

Buying and selling, supply and demand, wholesale and retail—the market and all of the economic factors surrounding it are complex things to track and understand. From the smallest farmer to the largest grocery store chain in the nation, all of American agriculture depends on the trends and prices within the marketplace.
At USDA’s Agricultural Marketing Service (AMS), we know the value of information and data. For almost 100 years we’ve tracked pricing and market trend information in our USDA Market News reports, and now we’ve formed the Agricultural Analytics Division (AAD) to help further meet the informational and statistical needs of farmers and businesses across the country.
The AAD provides a wide range of econometric, statistical, and analytical expertise and services. From production numbers to prices and market trends, to international trade activities and environmental impact—they track it all.
They produce periodic assessments, compiling and organizing vast amounts of market trends and data into streamlined, easily understood assessments. They study spot markets—near-term trading to cover immediate needs—and they look at market impacts that effect the long- and short-term pricing of agricultural products.
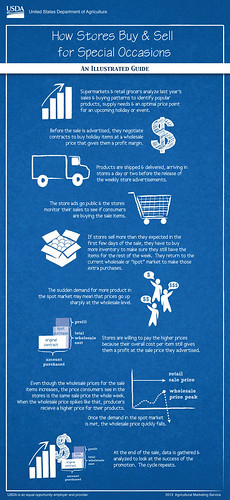
Their analysis of holiday trends and spot markets is the basis for the holiday infographics we’ve produced this year. Everything from Valentine’s Day to Halloween has consumer and retail trends that shed light on the market activity and consumer preferences.
There is an entire set of formulas, market factors and historic trends that help retail stores decide what items will be on sale during holidays and at other times of the year. This type of market analysis helps agribusiness plan for future demand.
The AAD is one of the many ways USDA is committed to helping American agriculture. If you’re interested in getting a more detailed look at the commodity and market trends, subscribe to our newsletter, The Economic Landscape, by emailing Michael Sheats. Or look for our next infographic for the consumer side of things.