

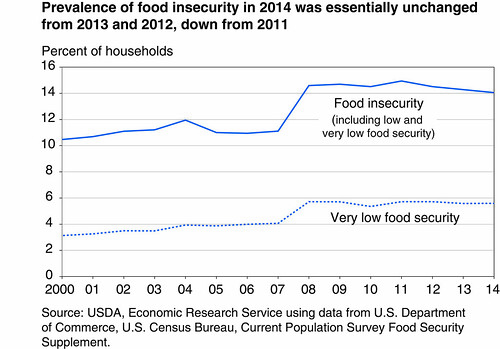
USDA’s recently released annual report on the incidence and severity of food insecurity in American households marks 20 years of Federal statistics measuring U.S. food insecurity. This year’s report, presenting 2014 data, shows that 86.0 percent of American households were food secure throughout the entire year, meaning that all household members had access at all times to enough food for an active, healthy life. In 2014, 14.0 percent of U.S. households (17.4 million households) had difficulty at some time during the year providing enough food for all their members because of a lack of financial or other resources. Food insecurity, essentially unchanged from 2013, is down from a high of 14.9 percent measured in 2011.
Looking back over the last several years, the food insecurity rate, as expected, rose in 2008 with the recession. But the food insecurity rate has not returned to pre-recession levels. Research shows that while modest improvements in food security have accompanied declining unemployment, other changes in the economy, including higher food prices, appear to offset the effect of unemployment declines. These higher food prices, along with an increase in overall inflation, are key factors preventing food insecurity rates from any substantial decline. Another Economic Research Service (ERS) study found that, particularly for households receiving benefits from USDA’s Supplemental Nutrition Assistance Program (SNAP), higher local food prices were related to higher food insecurity.
The latest food security statistics may also reflect changes to SNAP benefits--changes stemming from the American Recovery and Reinvestment Act (ARRA, the stimulus bill). In 2009, the ARRA increased maximum SNAP benefits by about 13 percent. From April 2009 to October 2013, maximum SNAP benefits were unchanged. But because allotments were not adjusted for inflation, the real value of those benefits decreased over time as food prices increased. ERS researchers examined the impacts on food insecurity levels, finding that the larger benefits at first helped to ameliorate food insecurity, but that in 2010 and 2011, the food security of SNAP households worsened as inflation reduced the buying power of the ARRA benefit.
In November 2013, the temporary increase in SNAP benefits from the stimulus bill ended, and maximum SNAP allotments fell by about 5 percent. For a family of four receiving the maximum SNAP allotment, monthly benefits fell by $36 from $668 to $632. This decrease may have resulted in a worsening of food security for families that rely on SNAP. These ERS studies demonstrate how economic conditions and policies, as well as household circumstances, affect the incidence of food insecurity.
For more information about food insecurity in 2014, including by demographic characteristics, across States, and changes over time, take a look at Household Food Security in the United States in 2014.