

USDA scientists work 365 days to provide safe and sustainable food, water, and natural resources in the face of a changing climate and uncertain energy sources. To recognize the contribution that agricultural science and research makes in our daily lives, this week’s “Banner Year” series features stories from 2015 that show the successes that USDA science and statistical agencies made for us all.
The past 12 months made for an eventful year in the world of agricultural statistics. In our efforts to remain true to our mission of providing timely, accurate, and useful statistics, we transformed several of our programs and tackled research to keep up with data needs of a changing agricultural industry. These new initiatives ensure that NASS continues to serve farmers, ranchers, and rural communities across the nation and that decisions impacting U.S. agriculture continue to be based on factual data.
Some of our most transformative work in 2015 included:
- Publishing the Tenure, Ownership, and Transition of Agricultural Land (TOTAL) survey results. These data provided the first insight since 1999 into the future of rural America, as we looked into who owns U.S. farmland and what are the transition and succession intentions for this land over the next decade.
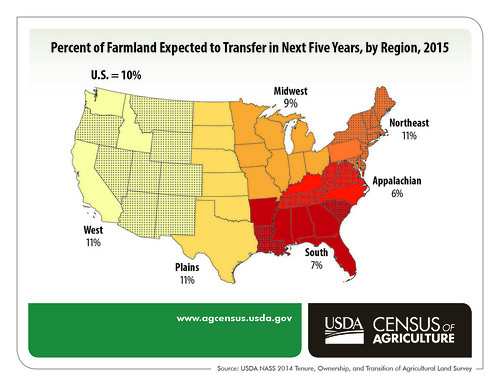
Percent of U.S. Farmland Expected to Transfer in Next Five Years, by Region, 2015 chart (Click to enlarge) - Evaluating farm typology data from the 2012 Census of Agriculture. The report looked into all aspects of family farms and provided new insight that allows USDA to better evaluate programs that support family farms, and young and/or beginning farmers.
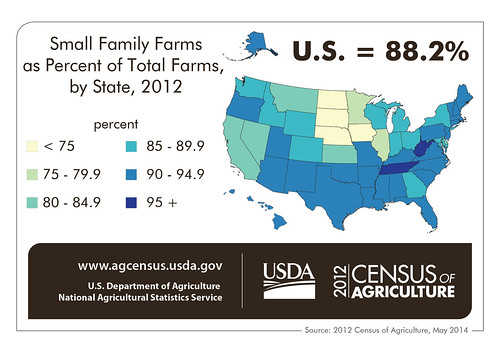
Small Family Farms as Percent of Total Farms, by State, 2012. NASS infographic. - Launching a new survey program that looks into microbial safety practices on U.S. farms. We launched this program jointly with our partners at USDA’s Economic Research Service. We are currently collecting these data, and once the results are compiled and published, we expect they will help shape new food safety outreach and guidelines.
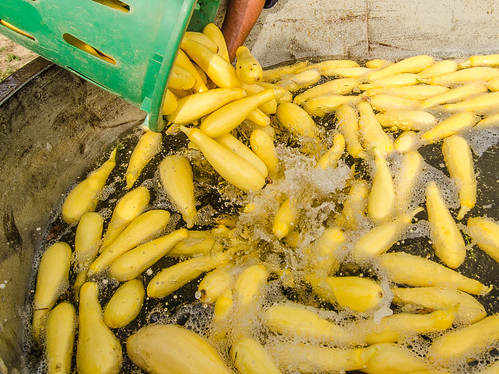
A farmworker rinses and packs just-picked yellow squash on a processing trailer. USDA photo by Lance Cheung. - Collecting data nationally for the Conservation Effects Assessment Program. This is a major project sponsored by our sister agency the Natural Resources Conservation Service. The results of the survey give a first-hand look into how operators manage agricultural lands for tomorrow. This insight is so important because soil erosion, climate change, water shortages, and feeding ever-increasing populations are important societal concerns today.
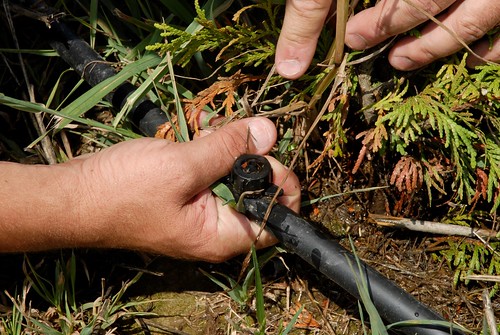
Drip irrigation is a system used to deliver slow, precise application of water and nutrients to a plant roots zone. This system maintains an optimum moisture level within the root zones, efficiently conserving water and helps prevent runoff while providing the proper balance of water and air needed for successful plant growth. USDA photo by Alice Welch. - Changing the way we collect statistics about women and beginning farmers and ranchers. Recognizing that agriculture is changing, NASS launched a series of discussions to ensure that our data properly counts women and new entrants into the field. While we are still working on determining the best approaches, 2015 saw the launch of this project, so crucial to the future of U.S. agriculture.