USDA recently issued Expenditures on Children by Families, 2015. This report is also known as “The Cost of Raising a Child.” USDA has been tracking the cost of raising a child since 1960 and this analysis examines expenses by age of child, household income, budgetary component, and region of the country.
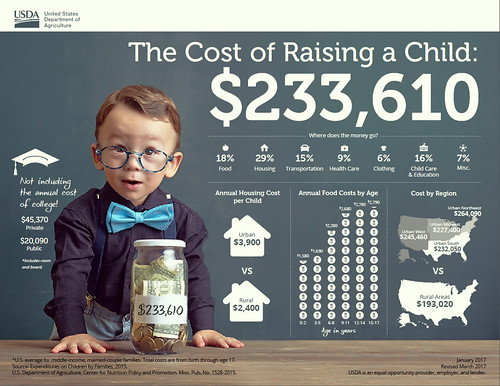
Based on the most recent data from the Consumer Expenditures Survey, in 2015, a family will spend approximately $12,980 annually per child in a middle-income ($59,200-$107,400), two-child, married-couple family. Middle-income, married-couple parents of a child born in 2015 may expect to spend $233,610 ($284,570 if projected inflation costs are factored in*) for food, shelter, and other necessities to raise a child through age 17. This does not include the cost of a college education.
Where does the money go? For a middle-income family, housing accounts for the largest share at 29% of total child-rearing costs. Food is second at 18%, and child care/education (for those with the expense) is third at 16%. Expenses vary depending on the age of the child.
We did the analysis by household income level, age of the child, and region of residence. Not surprising, the higher a family’s income the more was spent on a child, particularly for child care/education and miscellaneous expenses.
Expenses also increase as a child ages. Overall annual expenses averaged about $300 less for children from birth to 2 years old, and averaged $900 more for teenagers between 15-17 years of age. Teenagers have higher food costs as well as higher transportation costs as these are the years they start to drive so insurance is included or a maybe a second car is purchased for them.
Regional variation was also observed. Families in the urban Northeast spent the most on a child, followed by families in the urban West, urban South, and urban Midwest. Families in rural areas throughout the country spent the least on a child—child-rearing expenses were 27% lower in rural areas than the urban Northeast, primarily due to lower housing and child care/education expenses.
Child-rearing expenses are subject to economies of scale. That is, with each additional child, expenses on each declines. For married-couple families with one child, expenses averaged 27% more per child than expenses in a two-child family. For families with three or more children, per child expenses averaged 24% less on each child than on a child in a two-child family. This is sometimes referred to as the “cheaper by the dozen” effect. Each additional child costs less because children can share a bedroom; a family can buy food in larger, more economical quantities; clothing and toys can be handed down; and older children can often babysit younger ones.

This report is one of many ways that USDA works to support American families through our programs and work. It outlines typical spending by families from across the country, and is used in a number of ways to help support and education American families. Courts and state governments use this data to inform their decisions about child support guidelines and foster care payments. Financial planners use the information to provide advice to their clients, and families can access our Cost of Raising a Child calculator, which we update with every report on our website, to look at spending patterns for families similar to theirs. This Calculator is one of many tools available on MyMoney.gov, a government research and data clearinghouse related to financial education.
This year we released the report at a time when families are thinking about their plans for the New Year. We’ve been focusing on nutrition-related New Year’s resolutions – or what we are referring to as Real Solutions - on our MyPlate website, ChooseMyPlate.gov. This report and the updated calculator can help families as they focus on financial health resolutions. This report will provide families with a greater awareness of the expenses they are likely to face while raising children.
In addition to the report and the calculator, we also have a dedicated section on ChooseMyPlate.gov that provides tips and tools to aid families and individuals in making healthy choices while staying on a budget. For strategies beyond food, our friends at MyMoney.gov offer a wealth of information to help Americans plan for their financial future.
For more information on the Annual Report on Expenditures on Children by Families, also known as the cost of raising a child, go to: www.fns.usda.gov/resource/expenditures-children-families-reports-all-years.
*Projected inflationary costs are estimated to average 2.2 percent per year. This estimate is calculated by averaging the rate of inflation over the past 20 years.
Editor’s Note (March 8, 2017): The comparison of rural vs. urban northeast child care and education value has been updated.