
statistics

Maine Agriculture is "Up" in More Ways than One

The Census of Agriculture is the most complete account of U.S. farms and ranches and the people who operate them. Every Thursday USDA’s National Agricultural Statistics Service will highlight new Census data and the power of the information to shape the future of American agriculture.

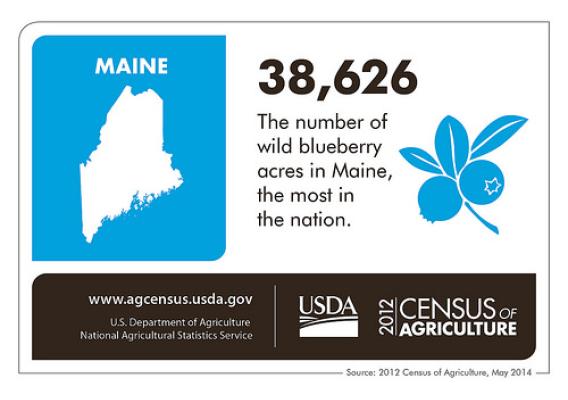
When examining the status of Maine’s agriculture using statistics derived from the 2012 Census of Agriculture, the words “up” and “increase” appear quite often. Our state’s agriculture and farm-related demographics are growing and diversifying each year.

Both the number of farms and land in farms in Maine increased since the last Census of Agriculture in 2007. In fact, we have the most farms of the New England states, and the land in farms is up eight percent from 2007. In addition, the average size of a Maine farm is 178 acres, up seven percent since 2007. Organic production and aquaculture sales increased from between 2007 and 2012 as well: the value of aquaculture sales increased from $26.3 million to $75.1 million (ranking us eighth nationally) and organic products increased from $23.3 million to $36.4 million. Lastly, since the 2007 Census, the total market value of agricultural sales increased 24 percent, the average value of sales per farm increased 23 percent, and the value of crops, including nursery and greenhouse, went up 46 percent.

A Lifetime of Statistics

This post is part of the Science Tuesday feature series on the USDA blog. Check back each week as we showcase stories and news from the USDA’s rich science and research portfolio.

As long as I can remember, I’ve had a passion for numbers and statistics. That’s why I’ve dedicated the last 39 years of my life to this amazing field.

I earned my degree in statistics in 1975 and shortly after that joined the U.S. Census Bureau, where I worked for 21 years.  At the Census Bureau, I had a really diverse experience, having worked on crime, housing, economics, and labor statistics, before ending up with the Census of Agriculture team. It was when this team transitioned to the National Agricultural Statistics Service (NASS) in 1997 that I joined my new home away from home at USDA.

A Census Story from Benton County, Mississippi

The Census of Agriculture is the most complete account of U.S. farms and ranches and the people who operate them. Every week USDA’s National Agricultural Statistics Service will highlight new Census data and the power of the information to shape the future of American agriculture.

The final 2012 Census of Agriculture release is just around the corner. My passion for Census data is rooted not only in the benefits the Census results provide for agriculture as a whole, but also in the value it provides at the local level. To help you see and share all the ways Census data are working for you, USDA is kicking off a dialogue to share how the Census is working for you and your community.

Through Your Census. Your Story., you can become engaged in the Census Story.

How Does Ag Census Work?

Since 1840, the U.S. government has collected important census data on agriculture. The purpose of the Census of Agriculture is to account for all U.S. farms and to summarize the characteristics of those farms and their operators at the national, state, and county levels.

Today, the Census is the only comprehensive source of statistics on American agriculture that provides information by county. So, why do we call the numbers we produce estimates? Aren’t the numbers known exactly? These are the questions I am often asked when discussing the agricultural census.  The fact is that we do not know the numbers exactly so we produce the best estimates we can, given the data we collect.

Dive Deeper Into USDA Data with New APIs

Data consumers can now more easily leverage several of the most popular offerings from USDA’s Economic Research Service (ERS)!

To meet the needs of a growing community of data users, including application developers and researchers, ERS has just released seven new APIs (Application Programming Interface), enriched with shared services provided by other Federal agencies.  The APIs offer dynamic access to ERS’s atlases, traditional data sets, and indicators in machine-readable formats.  ERS has developed rigorous standards for data products; users will note the extensive metadata and full documentation and transparency provided for each of the data sets via APIs.

Experienced users may want to dive into the thorough documentation available on ERS’s Developer page; while those seeking a simpler path can leverage pre-built widgets and starter-code snippets available in jQuery, Python, and Ruby.  The geospatial APIs provide access to map layers via ESRI (or other mapping services, such as Mapbox and Google Maps).  The newly released APIs supplement the following data sets:

Behind the Scenes with Ag Statistics

This post is part of the Science Tuesday feature series on the USDA blog. Check back each week as we showcase stories and news from USDA's rich science and research portfolio.

It is astounding to reflect at the end of the year and realize once again how many pieces came together each day, each week, and each month to make sure the United States has the best official agricultural statistics. It is something of a well-oiled machine made up of America’s farmers, statisticians, modern technology, deep agricultural knowledge, and the most basic elements of human interaction - trust and hard work - that brings forth these useful and objective data on time year after year since 1840.

It takes hundreds of thousands of producers responding to a multitude of surveys each year, in addition to the every-five-year Census of Agriculture which USDA’s National Agricultural Statistics Service (NASS) conducted this year, to provide the source information about U.S. farm production.  For this, we thank each individual producer who takes the time to complete the surveys.  Get a first look at the 2012 Census of Agriculture data on February 20, 2014 at the Ag Outlook Forum.

From Data to Decisions: Using Data to Improve Public Access and Knowledge

There are many companies that are currently using USDA data. Mercaris is a new company filling in the gap in offerings with reliable market data and an online trading tool tailored to the organic and non-GMO production, processing, and retail industries. Their reports present current and archived market condition information to assist in pricing decisions. FarmLogs provides comprehensive farm management software-as-a-service to farmers managing farms ranging from small-scale to over 30k acres. Their platform supports a hybrid of government and farmer-generated data that is analyzed and incorporated into their decisionmaking tools.

USDA wants to continue to encourage additional innovations and solutions by providing the data and statistics necessary that will offer improved agricultural production, global food security, poverty, nutrition and human health, natural resources and environmental issues, rural development, local and regional food systems, and many other issues.

Let's Get Visual - a Peek Behind the Scenes of Our Infographics


Buying and selling, supply and demand, wholesale and retail—the market and all of the economic factors surrounding it are complex things to track and understand.  From the smallest farmer to the largest grocery store chain in the nation, all of American agriculture depends on the trends and prices within the marketplace.

At USDA’s Agricultural Marketing Service (AMS), we know the value of information and data.  For almost 100 years we’ve tracked pricing and market trend information in our USDA Market News reports, and now we’ve formed the Agricultural Analytics Division (AAD) to help further meet the informational and statistical needs of farmers and businesses across the country.

The AAD provides a wide range of econometric, statistical, and analytical expertise and services. From production numbers to prices and market trends, to international trade activities and environmental impact—they track it all.