
surveys

A New Year with New Data

This time of year, I can’t help but think about cycles – everything coming full circle – from agriculture (planting through harvest) to the holiday season marking the end of one year and the start of the next. Here at USDA’s National Agricultural Statistics Service (NASS), we are at an exciting time in the five-year cycle of the Census of Agriculture program, which includes the Census of Agriculture itself – NASS’ largest data collection effort that is sent to every known farm and ranch in the country – as well as several smaller but important special studies. Not only are we just nine weeks away from releasing the results of the 2017 Census of Agriculture on February 21, we are also about to conduct two special studies: the Census of Aquaculture and the Irrigation and Water Management Survey.

NASS Gathers Feedback from Farmers and Ranchers about Their Survey Experience

Data collected from farmers and ranchers by the U.S. Department of Agriculture’s National Agricultural Statistics Service (NASS) allows for timely and accurate statistics that help our customers – U.S. farmers and ranchers, among many others – make informed business decisions. These vital data also affect farm policy, influence trade and the market, as well as academic and historical research. Producing these statistics depends on a positive survey experience for our customers.

APHIS and Partners Sponsor Annual Honey Bee Survey Directed at Monitoring Bee Health

About one mouthful in three in our diets directly or indirectly benefits from honey bee pollination. That makes bees critically valuable to humans’ existence. For this reason the U.S. Department of Agriculture’s Animal and Plant Health Inspection Service (APHIS) documents issues affecting honey bee health through the annual National Honey Bee Survey (NHBS). The survey collects data on bee health to understand long term trends, factors that drive bee health, ways to safeguard bee populations in the United States. Bee pollination is responsible for $15+ billion in added crop value -- particularly for specialty crops such as almonds and other nuts, berries, fruits, and vegetables. We need the economic benefits, as well as the nourishment, that bees provide to us through their role in pollination.

NASS Surveys Provide U.S. Agricultural Supply Data for Trade

With May being World Trade Month, it is worth noting that the source of data to determine the U.S. supply of crops and livestock is America’s farmers and ranchers who fill out surveys from USDA’s National Agricultural Statistics Service (NASS). These statistics feed directly into the monthly World Supply and Demand Estimates report (WASDE), which shows how much food, feed, fuel, and fiber are available or expected to be available around the world throughout the year. These data are available free of charge to anyone who wants them and are widely regarded as the gold standard.

SNAP Households Acquire About as Many Calories as Non-SNAP Households, But Spend Less

Households can have similar food needs, but often have different budgets with which to meet them. These budget differences may help explain observed differences in food spending and diet quality. A new report from USDA’s Economic Research Service digs into this issue using household level data from USDA’s National Household Food Acquisition and Purchase Survey (FoodAPS) to estimate the number of calories acquired and the amount of money spent to get them.

Two NASS Surveys Critical for USDA Crop Programs for Farmers

When drought and flooding impact crop production, or even in a year with good yields, good data is crucial to the agriculture industry.

USDA’s National Agricultural Statistics Service (NASS) conducts more than 400 surveys each year.  Two of our larger and more impactful surveys are the annual Row Crops County Agricultural Production Survey (CAPS) and December Agricultural Survey, the results of which are combined to set our county average yields.

Agricultural Data Users Weigh-in on USDA Statistical Programs

As I’ve learned over my years with the National Agricultural Statistics Service (NASS), in order to make an impact, our information needs to meet the needs of the people who use the data we produce. And while we constantly try to gauge and meet their needs, it is imperative to speak to our data users directly to get their input. We are open to feedback all the time and we hold annual special Data Users’ Meeting in Chicago every October.

Of course face-to-face interaction has its limitations since not everyone can travel to Chicago to meet with us. To address this concern, for the first time this year, we are also adding a social media component to our Data Users’ Meeting. Immediately following the panel session at the meeting, from 5 p.m. to 5:30 p.m. Central Time, I will be answering questions via Twitter during our monthly #StatChat.

Measuring Hazelnuts in Oregon

Few realize that Oregon produces 99 percent of the hazelnuts in the United States. That means that an accurate forecast of hazelnut production in the Beaver state assists the industry in determining marketing plans and price. To do that, USDA’s National Agricultural Statistics Service runs a joint project with the Hazelnut Marketing Board of Oregon, which allows us to measure the most accurate production yields and forecasts for hazelnut production possible. This project is called the Oregon Hazelnut Objective Yield Survey.

When it comes to forecasting production of a particular commodity, there are various methods we can use. Predominantly we survey growers to get their estimate of their own farm production. We combine the farmers’ responses with objective yield measurements. In brief, we use the objective yield survey to count and measure the crop prior to harvest so that we can see what kind of crop we can truly expect by the end of the growing season.

Relationships and Technology Are the Keys to Better Data for Farmers and Ranchers

Like nearly all organizations that use surveys to collect information, we have seen declining response rates in recent years. The value of accurate data is now more important than ever for decision-making on the farm, and by USDA farm program administrators, policy makers, researchers, market participants and, really, every aspect of agriculture. It is critical that we work closely with potential respondents and their industry representatives.

End-of-year crop production and stocks surveys, including the county agricultural production survey, which are critical for the Farm Service Agency and the Risk Management Agency to administer programs that benefit farmers and ranchers are upon us.  These agencies need accurate data to serve producers with beneficial programs such as the Price Loss Coverage (PLC), Agriculture Risk Coverage (PLC), Conservation Reserve Program (CRP) and many crop insurance programs.

Statistical Information Critical to Efficient Markets

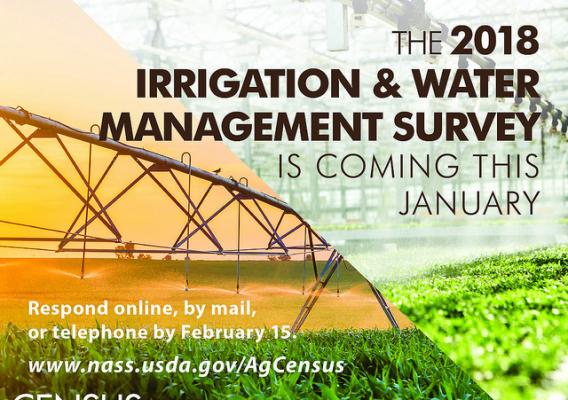
Starting next week, the National Agricultural Statistics Service (NASS) will reach out to tens of thousands of farmers across the United States. Our interviewers will go door to door and make phone calls to collect the most accurate information possible about farmland in each state. In addition, we’ll ask farmers to report their acres planted by crop, and total grains & oilseeds stored on their farms. We will then spend several weeks processing and analyzing the responses we receive so that we can publish some of the most anticipated reports by the end of the month. Let’s just say we keep things busy in June!

Personally, I’ve gone through all aspects of NASS surveys. Growing up on our family farm in Kansas, I saw my father fill out surveys he received from USDA’s statistical agency. Later I joined NASS myself and got a chance to work with and survey farmers in Kansas, Indiana, and North Dakota. Over time, my career brought me to NASS’ Washington, D.C. office where I lead teams of statisticians who analyze survey data and other information to publish official U.S. crop estimates.