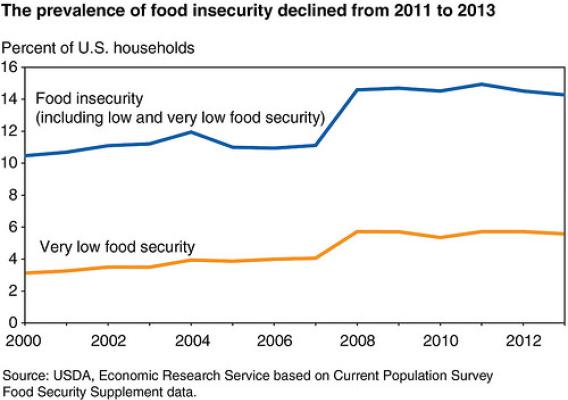
USDA’s latest report on food insecurity in America shows that the prevalence of food insecurity is down from a high of 14.9 percent of U.S. households in 2011 to 14.3 percent in 2013. This annual report takes a look at the number and types of households that had difficulty at some time during the year providing enough food for all their members due to a lack of financial or other resources. Back in 2007, about 11 percent of U.S. households were food insecure, but with the economic downturn in 2008, that rate had increased and remained relatively high.
Given improvements in employment and other economic indicators, some have wondered why food security has been slow to improve. A recent study by my colleagues and me at the Economic Research Service sheds light on this question. We found that while unemployment declined in 2012 and 2013, inflation and the price of food relative to other goods and services continued to increase. These increases offset improvements in food security that might have resulted from the decline in unemployment. This study provides a useful backdrop to understanding trends in and causes of food insecurity.