Our study on saplings was conducted in six forested sites in three southern Michigan counties: Ingham Co. (three sites), Gratiot Co. (two sites), and Shiawassee Co. (one site), with 10 to 60 km between sites.
Data set one - on the fate and density of emerald ash borer larvae and associated parasitoids on ash saplings from both biocontrol-release and non-release control plots in southern Michigan during the three-year study (2013–2015). Data set one was used for calculations and associated analyses for of the parameters presented in Figure 1, 2, 3, and 4.
Data set two - on ash tree abundance (per 100 m2) and healthy conditions (or crown classes) at the six study sites in southern Michigan observed in summer 2015. Data set two was used for estimation of tree density (Figure 5) and healthy condition (or crown classes).
Resources in this dataset:
2014 Naive Broiler CAFO Study for Agricultural Antibiotic Resistance in Mississippi State, Mississippi\nConventional commercial broiler production involves the rearing of more than 20,000 broilers in a single confined space, atop bedding material such as pine shavings or rice hulls, for approximately 6.5 weeks. This environment is known for harboring pathogens and antibiotic resistant bacteria, but studies have focused on previously established houses. A concerted effort by the broiler industry has involved the scaling back of antibiotic use on-farm, but this has only been a recent occurrence. In the current study, a set of three naïve houses were followed from inception through 11 broiler flocks and monitored for ambient climatic conditions, bacterial pathogens, and antibiotic resistance. Within the first 3 weeks of the first flock cycle, 100% of litter samples were positive for Salmonella and Listeria while Campylobacter was culture negative. In all likelihood, given that pre flock bedding and soil levels were negative for pathogens and 4-5 orders of magnitude lower for other indicators, chicks most likely provided the colonizing bacteria. The influence of intra-house location was minor with only watering lines and side walls influencing some pathogen and indicator levels. Most bacterial groups experienced the typical cyclical pattern of litter contamination seen in other studies. This study represents a first of its kind view into the time required for bacterial pathogens and antibiotic resistance to colonize and establish in naïve broiler houses.
Resource Title: GeoData catalog record.
File Name: Web Page, url: https://geodata.nal.usda.gov/geonetwork/srv/eng/catalog.search#/metadata/83c91004-f234-441f-9616-2bd33149f42b
2014 Swine CAFO Study SE for Agricultural Antibiotic Resistance in Mississippi State, Mississippi\nThe environmental influence of farm management in concentrated animal feeding operations (CAFO) can yield vast changes to the microbial biota and ecological structure of both the pig and waste manure lagoon wastewater. While some of these changes may not be negative, it is possible that CAFOs can enrich antibiotic resistant bacteria or pathogens based on farm type, thereby influencing the impact imparted by the land application of its respective wastewater. The purpose of this study was to measure the microbial constituents of swine-sow, -nursery, and -finisher farm manure lagoon wastewater and determine the changes induced by farm management. A total of 37 farms were visited in the Mid-South USA and analyzed for the genes 16S rRNA, spaQ (Salmonella spp.), Camp-16S (Campylobacter spp.), tetA, tetB, ermF, ermA, mecA, and intI using quantitative PCR. Additionally, 16S rRNA sequence libraries were created. Overall, it appeared that finisher farms were significantly different from nursery and sow farms in nearly all genes measured and in 16S rRNA clone libraries. Nearly all antibiotic resistance genes were detected in all farms. Interestingly, the mecA resistance gene (e.g. methicillin resistant Staphylococcus aureus) was below detection limits on most farms, and decreased as the pigs aged. Finisher farms generally had fewer antibiotic resistance genes, which corroborated previous phenotypic data; additionally, finisher farms produced a less diverse 16S rRNA sequence library. Comparisons of Camp-16S and spaQ GU (genomic unit) values to previous culture data demonstrated ratios from 10 to 10,000:1 depending on farm type, indicating viable but not cultivatable bacteria were dominant. The current study indicated that swine farm management schemes positively and negatively affect microbial and antibiotic resistant populations in CAFO wastewater which has future “downstream” implications from both an environmental and public health perspective.
Resource Title: GeoData catalog record.
File Name: Web Page, url: https://geodata.nal.usda.gov/geonetwork/srv/eng/catalog.search#/metadata/651220ea-a65e-43a1-9c28-433c27464cae
These rasters provide the local mean annual extreme low temperature from 1991 to 2020 in an 800m x 800m grid covering the USA (including Puerto Rico) based on interpolation of data from more than a thousand weather stations. Each location's Plant Hardiness Zone is calculated based on classifying that temperature into 5 degree bands.The classified rasters are then used to create print and interactive maps.
Temperature station data for the 2023 edition of the USDA Plant Hardiness Zone Map (PHZM) came from many different sources. In the eastern and central United States, Puerto Rico, and Hawaii, data came primarily from weather stations of the National Weather Service and several state networks. In the western United States and Alaska, data from stations maintained by USDA Natural Resources Conservation Service, USDA Forest Service, U.S. Department of the Interior (DOI) Bureau of Reclamation, and DOI Bureau of Land Management also helped to better define hardiness zones in mountainous areas. Environment Canada provided data from Canadian stations, and data from Mexican stations came from the Mexico National Weather Service and the Global Historical Climate Network. The USDA PHZM was produced with PRISM, a highly sophisticated climate mapping technology developed at Oregon State University. The map was produced from a digital computer grid, with each cell measuring about a half mile on a side. PRISM estimated the mean annual extreme minimum temperature for each grid cell (or pixel on the map) by examining data from nearby stations; determining how the temperature changed with elevation; and accounting for possible coastal effects, temperature inversions, and the type of topography (ridge top, hill slope, or valley bottom). Information on PRISM can be obtained from the PRISM Climate Group website https://prism.oregonstate.edu. Once a draft of the map was completed, it was reviewed by a team of climatologists, agricultural meteorologists, and horticultural experts. If the zone for an area appeared anomalous to these expert reviewers, experts doublechecked the draft maps for errors or biases. A detailed explanation of the mapmaking process and a discussion of the horticultural applications of the 2012 PHZM (similar to 2023) are available from the articles listed below. Daly, C., M.P. Widrlechner, M.D. Halbleib, J.I. Smith, and W.P. Gibson. 2012. Development of a new USDA Plant Hardiness Zone Map for the United States. Journal of Applied Meteorology and Climatology, 51: 242-264.Widrlechner, M.P., C. Daly, M. Keller, and K. Kaplan. 2012. Horticultural Applications of a Newly Revised USDA Plant Hardiness Zone Map. HortTechnology, 22: 6-19.
", "title": "2023 USDA Plant Hardiness Zone Map Mean Annual Extreme Low Temperature Rasters", "distribution": [ { "@type": "dcat:Distribution", "downloadURL": "https://ndownloader.figshare.com/files/44868823", "format": "xml", "mediaType": "text/xml", "title": "2023ConusNAD83_Clip.tif.xml" }, { "@type": "dcat:Distribution", "downloadURL": "https://ndownloader.figshare.com/files/44868853", "format": "tfw", "mediaType": "text/plain", "title": "2023PuertoRicoNAD83_Clip.tfw" }, { "@type": "dcat:Distribution", "downloadURL": "https://ndownloader.figshare.com/files/44868886", "format": "tif", "mediaType": "image/tiff", "title": "2023AlaskaNAD83_Clip.tif" }, { "@type": "dcat:Distribution", "downloadURL": "https://ndownloader.figshare.com/files/44868919", "format": "tfw", "mediaType": "text/plain", "title": "2023ConusNAD83_Clip.tfw" }, { "@type": "dcat:Distribution", "downloadURL": "https://ndownloader.figshare.com/files/44868922", "format": "xml", "mediaType": "text/plain", "title": "2023ConusNAD83_Clip.tif.aux.xml" }, { "@type": "dcat:Distribution", "downloadURL": "https://ndownloader.figshare.com/files/44868925", "format": "CPG", "mediaType": "text/plain", "title": "2023ConusNAD83_Clip.tif.vat.CPG" }, { "@type": "dcat:Distribution", "downloadURL": "https://ndownloader.figshare.com/files/44868928", "format": "xml", "mediaType": "text/xml", "title": "2023ConusNAD83_Clip.tif.vat.dbf.xml" }, { "@type": "dcat:Distribution", "downloadURL": "https://ndownloader.figshare.com/files/44868934", "format": "tfw", "mediaType": "text/plain", "title": "2023HawaiiNAD83_Clip.tfw" }, { "@type": "dcat:Distribution", "downloadURL": "https://ndownloader.figshare.com/files/44868937", "format": "dbf", "mediaType": "application/x-dbf", "title": "2023ConusNAD83_Clip.tif.vat.dbf" }, { "@type": "dcat:Distribution", "downloadURL": "https://ndownloader.figshare.com/files/44868940", "format": "tif", "mediaType": "image/tiff", "title": "2023ConusNAD83_Clip.tif" }, { "@type": "dcat:Distribution", "downloadURL": "https://ndownloader.figshare.com/files/44868943", "format": "tif", "mediaType": "image/tiff", "title": "2023HawaiiNAD83_Clip.tif" }, { "@type": "dcat:Distribution", "downloadURL": "https://ndownloader.figshare.com/files/44868946", "format": "xml", "mediaType": "text/plain", "title": "2023HawaiiNAD83_Clip.tif.aux.xml" }, { "@type": "dcat:Distribution", "downloadURL": "https://ndownloader.figshare.com/files/44868949", "format": "ovr", "mediaType": "image/tiff", "title": "2023HawaiiNAD83_Clip.tif.ovr" }, { "@type": "dcat:Distribution", "downloadURL": "https://ndownloader.figshare.com/files/44868952", "format": "CPG", "mediaType": "text/plain", "title": "2023HawaiiNAD83_Clip.tif.vat.CPG" }, { "@type": "dcat:Distribution", "downloadURL": "https://ndownloader.figshare.com/files/44868955", "format": "xml", "mediaType": "text/xml", "title": "2023HawaiiNAD83_Clip.tif.xml" }, { "@type": "dcat:Distribution", "downloadURL": "https://ndownloader.figshare.com/files/44868958", "format": "dbf", "mediaType": "application/x-dbf", "title": "2023HawaiiNAD83_Clip.tif.vat.dbf" }, { "@type": "dcat:Distribution", "downloadURL": "https://ndownloader.figshare.com/files/44868964", "format": "tif", "mediaType": "image/tiff", "title": "2023PuertoRicoNAD83_Clip.tif" }, { "@type": "dcat:Distribution", "downloadURL": "https://ndownloader.figshare.com/files/44868967", "format": "xml", "mediaType": "text/plain", "title": "2023PuertoRicoNAD83_Clip.tif.aux.xml" }, { "@type": "dcat:Distribution", "downloadURL": "https://ndownloader.figshare.com/files/44868970", "format": "CPG", "mediaType": "text/plain", "title": "2023PuertoRicoNAD83_Clip.tif.vat.CPG" }, { "@type": "dcat:Distribution", "downloadURL": "https://ndownloader.figshare.com/files/44868973", "format": "dbf", "mediaType": "application/x-dbf", "title": "2023PuertoRicoNAD83_Clip.tif.vat.dbf" }, { "@type": "dcat:Distribution", "downloadURL": "https://ndownloader.figshare.com/files/44868979", "format": "tfw", "mediaType": "text/plain", "title": "2023AlaskaNAD83_Clip.tfw" }, { "@type": "dcat:Distribution", "downloadURL": "https://ndownloader.figshare.com/files/44868976", "format": "xml", "mediaType": "text/xml", "title": "2023PuertoRicoNAD83_Clip.tif.xml" }, { "@type": "dcat:Distribution", "downloadURL": "https://ndownloader.figshare.com/files/44868982", "format": "xml", "mediaType": "text/plain", "title": "2023AlaskaNAD83_Clip.tif.aux.xml" }, { "@type": "dcat:Distribution", "downloadURL": "https://ndownloader.figshare.com/files/44868985", "format": "CPG", "mediaType": "text/plain", "title": "2023AlaskaNAD83_Clip.tif.vat.CPG" }, { "@type": "dcat:Distribution", "downloadURL": "https://ndownloader.figshare.com/files/44868991", "format": "dbf", "mediaType": "application/x-dbf", "title": "2023AlaskaNAD83_Clip.tif.vat.dbf" }, { "@type": "dcat:Distribution", "downloadURL": "https://ndownloader.figshare.com/files/44868994", "format": "xml", "mediaType": "text/xml", "title": "2023AlaskaNAD83_Clip.tif.xml" }, { "@type": "dcat:Distribution", "downloadURL": "https://ndownloader.figshare.com/files/44942842", "format": "txt", "mediaType": "text/plain", "title": "README.txt" }, { "accessURL": "https://geodata.nal.usda.gov/geonetwork/srv/api/records/ffdb6728-e2bd-486f-832e-0b461f4e890b/formatters/xml", "@type": "dcat:Distribution", "format": "xml", "mediaType": "text/xml", "conformsTo": "http://www.isotc211.org/2005/gmd", "title": "Geodata ISO 19139 metadata" } ], "license": "https://creativecommons.org/licenses/by/4.0/", "bureauCode": [ "005:18" ], "modified": "2024-06-26", "publisher": { "@type": "org:Organization", "name": "Agricultural Research Service" }, "accrualPeriodicity": "irregular", "theme": [ "geospatial" ], "keyword": [ "plant hardiness", "weather", "low temperature", "climate", "perennial", "garden" ], "spatial": "{\"type\": \"MultiPolygon\", \"coordinates\": [[[[-130.66162347794, 23.2817191756], [-130.66162347794, 51.255804989], [-65.036594867706, 51.255804989], [-65.036594867706, 23.2817191756], [-130.66162347794, 23.2817191756]]], [[[-172.06787109375, 52.22331731689], [-172.06787109375, 72.242962523344], [-137.69287347794, 72.242962523344], [-137.69287347794, 52.22331731689], [-172.06787109375, 52.22331731689]]], [[[-161.13035917282, 13.662584394355], [-161.13035917282, 25.063481365232], [-149.41161632538, 25.063481365232], [-149.41161632538, 13.662584394355], [-161.13035917282, 13.662584394355]]]]}" }, { "identifier": "10113/AA22745", "accessLevel": "public", "contactPoint": { "hasEmail": "mailto:Yakov.Pachepsky@ars.usda.gov", "fn": "Pachepsky, Yakov" }, "programCode": [ "005:040" ], "description": "2D finite element water, solute, and heat mover model for plant models.
\nMost crops are grown in rows and this introduces spatial variability in soil processes with respect to the row. However, this variability can be exploited to reduce chemical transport to groundwater or improve management of irrigation water. Unless a model can account for variability perpendicular to crop rows as well as vertically into the soil profile it will not be able to fully evaluate all possible management practices that can be used to make agriculture more efficient and less harmful to the environment. To address this concern we developed 2DSOIL, the first comprehensive, modular, two-dimensional soil simulator that can simulate the major physical, chemical and biological processes in soil. Fully implemented, principles of modular modeling facilitate the addition and replacement of modules, as well as the reuse of existing code. The modularity of 2DSOIL has been designed to make it easy to modify the model and to make it easy to incorporate into plant models. 2DSOIL was used to simulate the effect of several water and nitrogen management practices and was incorporated into ARS potato and cotton models, into the Root Zone Water Quality Model, and into the USGS Modular Modeling System.
", "title": "2DSOIL version 03", "distribution": [], "license": "https://creativecommons.org/publicdomain/zero/1.0/", "bureauCode": [ "005:18" ], "modified": "2024-02-15", "publisher": { "@type": "org:Organization", "name": "Agricultural Research Service" }, "keyword": [ "computer software", "finite element analysis", "solutes", "heat", "simulation models", "soil", "soil profiles", "interphase", "root growth", "crop models", "models", "crops", "groundwater", "irrigation management", "irrigation water", "nitrogen", "potatoes", "cotton", "Root Zone Water Quality Model" ] }, { "identifier": "10113/AA22481", "accessLevel": "public", "contactPoint": { "hasEmail": "mailto:Todd.Skaggs@ars.usda.gov", "fn": "Skaggs, Todd" }, "programCode": [ "005:040" ], "description": "3DADE is a Fortran computer program for evaluating a series of analytical solutions of the 3-Dimensional Advection-Dispersion Equation. The analytical solutions pertain to three-dimensional solute transport during steady unidirectional water flow in porous media with uniform transport and flow properties. The transport equation contains terms accounting for solute movement by advection and dispersion, as well as for solute retardation, first-order decay, and zero-order production. The3DADE code can be used to solve the direct problem, i.e., the concentration is calculated as a function of time and space for specified model parameters, and the indirect (inverse) problem in which the program estimates selected parameters by fitting one of the analytical solutions to specified experimental data. Transient analytical solutions are evaluated for five different transport scenarios (three boundary value problems and two initial value problems) in either a Cartesian or cylindrical coordinate system. Simple steady-state solutions are also provided for three initial value problems.
\nThe program comes with a user manual giving detailed descriptions of the different transport problems, listing the main program variables, input file formats, sample input and output files, and providing a hard copy of the FORTRAN source code.
Resource Title: 3DADE Download Page.
File Name: Web Page, url: https://www.ars.usda.gov/research/software/download/?softwareid=93&modecode=20-36-15-00
A major challenge to area-wide management of coffee berry borer (CBB, Hypothenemus hampei Ferrari) (Coleoptera: Scolytidae) is understanding how a heterogeneous coffee-growing landscape affects CBB population dynamics across temporal and spatial scales. We examined coffee phenology, weather, CBB flight activity, infestation, CBB position within the fruit, and management across 14 commercial coffee farms from 2016–2018 on Hawaii Island to characterize variation among districts and elevations. This data was used to develop an optimized pesticide spray schedule for each growing location. Implementing a coordinated area-wide approach refined by small-scale optimization will lead to improved management of CBB on individual farms and a reduction in pest pressure across the coffee-growing landscape.
", "title": "Data from: Coffee berry borer (Coleoptera: Scolytidae) population dynamics across Hawaii Island’s diverse coffee-growing landscape: Optimizing location-specific pesticide applications", "distribution": [ { "@type": "dcat:Distribution", "downloadURL": "https://ndownloader.figshare.com/files/44874613", "format": "xlsx", "mediaType": "application/vnd.openxmlformats-officedocument.spreadsheetml.sheet", "title": "Johnson&Manoukis_2024_CBB.xlsx" }, { "@type": "dcat:Distribution", "downloadURL": "https://ndownloader.figshare.com/files/44874616", "format": "xlsx", "mediaType": "application/vnd.openxmlformats-officedocument.spreadsheetml.sheet", "title": "Johnson&Manoukis_2024_phenology.xlsx" }, { "@type": "dcat:Distribution", "downloadURL": "https://ndownloader.figshare.com/files/44874619", "format": "xlsx", "mediaType": "application/vnd.openxmlformats-officedocument.spreadsheetml.sheet", "title": "Johnson&Manoukis_2024_Weather.xlsx" } ], "license": "https://creativecommons.org/publicdomain/zero/1.0/", "bureauCode": [ "005:18" ], "modified": "2024-04-08", "publisher": { "@type": "org:Organization", "name": "Agricultural Research Service" }, "accrualPeriodicity": "R/P0.5M", "keyword": [ "trap catch", "integrated pest management", "weather variables", "plant phenology", "Coffea arabica", "elevation gradient", "crop infestation" ] }, { "identifier": "10.15482/USDA.ADC/25702863.v1", "accessLevel": "public", "contactPoint": { "hasEmail": "mailto:justin.faris@usda.gov", "fn": "Faris, Justin D." }, "programCode": [ "005:040" ], "description": "The disease known as Septoria nodorum blotch, or SNB, is caused by a fungal pathogen that infects wheat plants and can cause substantial losses in grain yield. When a specific protein known as Tox1 is produced by the fungus and it is recognized by the wheat gene named Snn1, there is a compatible interaction that leads to disease in the wheat plant. Here, researchers conducted genetic, genomic, and bioinformatic analyses to determine how the Snn1 gene evolved, characterize the level of genetic diversity among wheat lines that carry the Snn1 gene, determine how the Snn1 gene functions to recognize the fungal SnTox1 protein, and to develop molecular markers that can be used by wheat breeders to track the Snn1 gene. The researchers found that some wheat lines carry two copies of Snn1, and the second copy resulted from a relatively recent genetic duplication of the first copy. Specific features in the DNA of the Snn1 genes were identified that dictate whether Snn1 can recognize SnTox1 thereby making the wheat plant either resistant or susceptible to SNB. These features were targeted for the development of several molecular markers that can be used in efficient DNA assays to determine if the Snn1 gene is present, and therefore if a given wheat plant will be resistant or susceptible to SNB. These marker assays will serve as useful tools to wheat breeders for the efficient development of SNB-resistant wheat varieties.
", "title": "Data from: Evolution, diversity, and function of the disease susceptibility gene Snn1 in wheat", "distribution": [ { "@type": "dcat:Distribution", "downloadURL": "https://ndownloader.figshare.com/files/45882081", "format": "xlsx", "mediaType": "application/vnd.openxmlformats-officedocument.spreadsheetml.sheet", "title": "Snn1_Phenotypic_data_for_deposition-06-14-23.xlsx" }, { "@type": "dcat:Distribution", "downloadURL": "https://ndownloader.figshare.com/files/45882087", "format": "docx", "mediaType": "application/vnd.openxmlformats-officedocument.wordprocessingml.document", "title": "Description_of_data_for_Snn1_metadata.docx" } ], "license": "https://creativecommons.org/licenses/by/4.0/", "bureauCode": [ "005:18" ], "modified": "2024-05-07", "publisher": { "@type": "org:Organization", "name": "Agricultural Research Service" }, "accrualPeriodicity": "irregular", "keyword": [ "septoria nodorum blotch", "wheat", "durum", "disease resistance", "Triticum aestivum", "Triticum turgidum", "Parastagonospora nodorum", "necrotrophic effector", "host-pathogen interaction", "necrotrophic fungus", "SnTox1", "Snn1" ] }, { "identifier": "10.15482/USDA.ADC/25035926.v1", "accessLevel": "public", "contactPoint": { "hasEmail": "mailto:mark.liebig@usda.gov", "fn": "Liebig, Mark A." }, "programCode": [ "005:040" ], "description": "Alfalfa (Medicago spp.) interseeded into rangeland has been shown to improve the quantity and quality of forage available for grazing. Information regarding soil responses to interseeded alfalfa in rangeland, however, is lacking. A study was conducted to investigate the effects of alfalfa transplanted into native rangeland on soil organic carbon and total nitrogen. The study was located approximately 5 km south of Mandan, ND USA on a Temvik silt loam soil (USDA: Fine-silty, mixed, superactive frigid Typic Haplustoll). Treatments included three alfalfa cultivars transplanted into rangeland and a native vegetation control. Treatments were applied using a randomized block design with five replications. Soil properties measured during the study included soil bulk density, soil organic carbon, and total soil nitrogen. Measurements were made in 2001 (baseline) and again 2005 following four years of alfalfa growth. Samples were collected using a step-down probe in depth increments of 0-10, 10-20, 20-30, and 30-40 cm. Duplicate cores from each treatment were composited by depth. Soil carbon and nitrogen were quantified by the dry combustion method. Data may be used to understand soil property responses to interseeded alfalfa in rangeland. Data are generally applicable to rangelands under a semiarid Continental climate for the following soil types: Grassna, Linton, Mandan, Temvik, Williams, and Wilton.
", "title": "Data from: Response of soil carbon and nitrogen to transplanted alfalfa in North Dakota rangeland", "distribution": [ { "@type": "dcat:Distribution", "downloadURL": "https://ndownloader.figshare.com/files/44194841", "format": "xlsx", "mediaType": "application/vnd.openxmlformats-officedocument.spreadsheetml.sheet", "title": "ALFC&N_Data Dictionary.xlsx" }, { "@type": "dcat:Distribution", "downloadURL": "https://ndownloader.figshare.com/files/44194844", "format": "csv", "mediaType": "text/plain", "title": "ALFC&N_Data.csv" }, { "@type": "dcat:Distribution", "downloadURL": "https://ndownloader.figshare.com/files/44194850", "format": "csv", "mediaType": "text/plain", "title": "ALFC&N_Metadata.csv" } ], "license": "https://creativecommons.org/publicdomain/zero/1.0/", "bureauCode": [ "005:18" ], "modified": "2024-03-05", "publisher": { "@type": "org:Organization", "name": "Agricultural Research Service" }, "accrualPeriodicity": "irregular", "keyword": [ "Northern Great Plains", "soil organic carbon and nitrogen", "interseeding", "Alfalfa", "Rangeland", "dry combustion method" ], "spatial": "{\"type\": \"Point\", \"coordinates\": [-100.91425, 46.77386]}" }, { "identifier": "10.15482/USDA.ADC/25416649.v1", "accessLevel": "public", "contactPoint": { "hasEmail": "mailto:mark.liebig@usda.gov", "fn": "Liebig, Mark A." }, "programCode": [ "005:040" ], "description": "Integrated crop-livestock (ICL) systems combine crop and livestock production and have been found to improve soil health. However, there is limited understanding of how ICL systems affect soil carbon (C) dynamics, especially in semi-arid regions. To better understand C responses to ICL systems, a 3-yr study was conducted near Mandan, ND, USA. Carbon dioxide efflux, aboveground biomass, and soil C measurements were made in grazed and ungrazed ICL system crop rotations and grass pasture. Treatments were replicated four times. Measurements of CO2 efflux were made using static chamber methodology 93 times over the study period (14 Oct 2016 – 16 Oct 2019). Aboveground biomass, soil organic matter, water-soluble C and N, and C mineralization were measured annually following standard protocols. Aboveground biomass was expressed as mass units of C per unit area assuming a plant tissue C concentration of 45%. Data may be used to understand CO2 efflux, aboveground biomass, and soil C dynamics in ICL production systems. Data are generally applicable to cropland under a semiarid continental climate for the following soil types: Grassna, Linton, Mandan, Temvik, Williams, and Wilton.
", "title": "Data from: Soil CO2 Efflux Dynamics in an Integrated Crop-Livestock System", "distribution": [ { "@type": "dcat:Distribution", "downloadURL": "https://ndownloader.figshare.com/files/45073186", "format": "xlsx", "mediaType": "application/vnd.openxmlformats-officedocument.spreadsheetml.sheet", "title": "ICLCO2_Data Dictionary.xlsx" }, { "@type": "dcat:Distribution", "downloadURL": "https://ndownloader.figshare.com/files/45073189", "format": "xlsx", "mediaType": "application/vnd.openxmlformats-officedocument.spreadsheetml.sheet", "title": "ICLCO2_GHG_Data&Metadata.xlsx" }, { "@type": "dcat:Distribution", "downloadURL": "https://ndownloader.figshare.com/files/45073192", "format": "xlsx", "mediaType": "application/vnd.openxmlformats-officedocument.spreadsheetml.sheet", "title": "ICLCO2_Soil_Data&Metadata.xlsx" }, { "@type": "dcat:Distribution", "downloadURL": "https://ndownloader.figshare.com/files/45073201", "format": "xlsx", "mediaType": "application/vnd.openxmlformats-officedocument.spreadsheetml.sheet", "title": "ICLCO2_Biomass_Data&Metadata.xlsx" }, { "@type": "dcat:Distribution", "downloadURL": "https://ndownloader.figshare.com/files/45073207", "format": "csv", "mediaType": "text/plain", "title": "ICLCO2_Biomass_Data.csv" }, { "@type": "dcat:Distribution", "downloadURL": "https://ndownloader.figshare.com/files/45073210", "format": "csv", "mediaType": "application/csv", "title": "ICLCO2_Biomass_Metadata.csv" }, { "@type": "dcat:Distribution", "downloadURL": "https://ndownloader.figshare.com/files/45073222", "format": "csv", "mediaType": "application/csv", "title": "ICLCO2_GHG_Data.csv" }, { "@type": "dcat:Distribution", "downloadURL": "https://ndownloader.figshare.com/files/45073213", "format": "csv", "mediaType": "text/plain", "title": "ICLCO2_GHG_Metadata.csv" }, { "@type": "dcat:Distribution", "downloadURL": "https://ndownloader.figshare.com/files/45073216", "format": "csv", "mediaType": "text/plain", "title": "ICLCO2_Soil_Data.csv" }, { "@type": "dcat:Distribution", "downloadURL": "https://ndownloader.figshare.com/files/45073219", "format": "csv", "mediaType": "application/csv", "title": "ICLCO2_Soil_Metadata.csv" } ], "license": "https://creativecommons.org/publicdomain/zero/1.0/", "bureauCode": [ "005:18" ], "modified": "2024-03-20", "publisher": { "@type": "org:Organization", "name": "Agricultural Research Service" }, "accrualPeriodicity": "irregular", "keyword": [ "integrated agricultural systems", "carbon dioxide", "soil organic carbon", "Aboveground biomass carbon", "northern plains" ], "spatial": "{\"type\": \"MultiPoint\", \"coordinates\": [[-100.91277, 46.7732], [-100.90423, 46.76765]]}" }, { "identifier": "10.15482/USDA.ADC/25487827.v1", "accessLevel": "public", "contactPoint": { "hasEmail": "mailto:mark.liebig@usda.gov", "fn": "Liebig, Mark A." }, "programCode": [ "005:040" ], "description": "Integrated crop-livestock (ICL) systems can potentially increase agricultural productivity in an environmentally sustainable manner. Impacts of ICL systems on water quality, however, have not been adequately studied. Rainfall simulations were used to examine effects of cropland and grass pasture vegetation types on surface runoff and water infiltrating into soil in a long-term ICL study near Mandan, ND USA. Simulations were conducted before and after grazing over a two-year period (August 2017 – May 2019). Water quality parameters included nitrate-N, nitrite-N, ammonia-N, phosphate-P, and total suspended solid (TSS) concentrations and loads in surface and infiltration waters. Water N and P compounds were determined using an AQ1 Discrete Analyzer, while TSS concentrations were determined by mass difference after passing a known sample volume through filter paper and drying to a constant mass. Surface runoff loads for N and P compounds were calculated by the sum of sample concentrations multiplied by sample volumes for all samples collected during each simulation event. As a supplement to water quality parameters, plant biomass and litter samples were collected, and percent cover of living vegetation, vegetation litter, and bare ground were estimated within a representative area of the sample site. Data may be used to understand ICL system impacts on water quality and are generally applicable to cropland and rangeland under a semiarid continental climate for the following soil types: Grassna, Linton, Mandan, Temvik, Williams, and Wilton.
", "title": "Data from: Water quality of an integrated crop–livestock system in the northern Great Plains", "distribution": [ { "@type": "dcat:Distribution", "downloadURL": "https://ndownloader.figshare.com/files/45645012", "format": "xlsx", "mediaType": "application/vnd.openxmlformats-officedocument.spreadsheetml.sheet", "title": "ICLWATER_Data Dictionary.xlsx" }, { "@type": "dcat:Distribution", "downloadURL": "https://ndownloader.figshare.com/files/45645018", "format": "xlsx", "mediaType": "application/vnd.openxmlformats-officedocument.spreadsheetml.sheet", "title": "ICLWATER_Biomass_Data&Metadata.xlsx" }, { "@type": "dcat:Distribution", "downloadURL": "https://ndownloader.figshare.com/files/45645021", "format": "xlsx", "mediaType": "application/vnd.openxmlformats-officedocument.spreadsheetml.sheet", "title": "ICLWATER_H2OEC&pH_Data&Metadata.xlsx" }, { "@type": "dcat:Distribution", "downloadURL": "https://ndownloader.figshare.com/files/45645024", "format": "xlsx", "mediaType": "application/vnd.openxmlformats-officedocument.spreadsheetml.sheet", "title": "ICLWATER_Infiltration_Data&Metadata.xlsx" }, { "@type": "dcat:Distribution", "downloadURL": "https://ndownloader.figshare.com/files/45645027", "format": "xlsx", "mediaType": "application/vnd.openxmlformats-officedocument.spreadsheetml.sheet", "title": "ICLWATER_Runoff_Data&Metadata.xlsx" }, { "@type": "dcat:Distribution", "downloadURL": "https://ndownloader.figshare.com/files/45645030", "format": "xlsx", "mediaType": "application/vnd.openxmlformats-officedocument.spreadsheetml.sheet", "title": "ICLWATER_SimulationWater_Data&Metadata.xlsx" }, { "@type": "dcat:Distribution", "downloadURL": "https://ndownloader.figshare.com/files/45645033", "format": "xlsx", "mediaType": "application/vnd.openxmlformats-officedocument.spreadsheetml.sheet", "title": "ICLWATER_SoilWater_Data&Metadata.xlsx" }, { "@type": "dcat:Distribution", "downloadURL": "https://ndownloader.figshare.com/files/45645036", "format": "xlsx", "mediaType": "application/vnd.openxmlformats-officedocument.spreadsheetml.sheet", "title": "ICLWATER_Weather_Data&Metadata.xlsx" }, { "@type": "dcat:Distribution", "downloadURL": "https://ndownloader.figshare.com/files/45645039", "format": "csv", "mediaType": "application/csv", "title": "ICLWATER_Biomass_Data.csv" }, { "@type": "dcat:Distribution", "downloadURL": "https://ndownloader.figshare.com/files/45645042", "format": "csv", "mediaType": "application/csv", "title": "ICLWATER_Biomass_Metadata.csv" }, { "@type": "dcat:Distribution", "downloadURL": "https://ndownloader.figshare.com/files/45645045", "format": "csv", "mediaType": "text/plain", "title": "ICLWATER_H2OEC&pH_Data.csv" }, { "@type": "dcat:Distribution", "downloadURL": "https://ndownloader.figshare.com/files/45645048", "format": "csv", "mediaType": "application/csv", "title": "ICLWATER_H2OEC&pH_Metadata.csv" }, { "@type": "dcat:Distribution", "downloadURL": "https://ndownloader.figshare.com/files/45645051", "format": "csv", "mediaType": "text/plain", "title": "ICLWATER_Infiltration_Data.csv" }, { "@type": "dcat:Distribution", "downloadURL": "https://ndownloader.figshare.com/files/45645054", "format": "csv", "mediaType": "application/csv", "title": "ICLWATER_Infiltration_Metadata.csv" }, { "@type": "dcat:Distribution", "downloadURL": "https://ndownloader.figshare.com/files/45645057", "format": "csv", "mediaType": "text/plain", "title": "ICLWATER_Runoff_Data.csv" }, { "@type": "dcat:Distribution", "downloadURL": "https://ndownloader.figshare.com/files/45645060", "format": "csv", "mediaType": "text/plain", "title": "ICLWATER_Runoff_Metadata.csv" }, { "@type": "dcat:Distribution", "downloadURL": "https://ndownloader.figshare.com/files/45645063", "format": "csv", "mediaType": "application/csv", "title": "ICLWATER_SimWater_Data.csv" }, { "@type": "dcat:Distribution", "downloadURL": "https://ndownloader.figshare.com/files/45645066", "format": "csv", "mediaType": "text/plain", "title": "ICLWATER_SimWater_Metadata.csv" }, { "@type": "dcat:Distribution", "downloadURL": "https://ndownloader.figshare.com/files/45645069", "format": "csv", "mediaType": "application/csv", "title": "ICLWATER_SoilWater_Data.csv" }, { "@type": "dcat:Distribution", "downloadURL": "https://ndownloader.figshare.com/files/45645072", "format": "csv", "mediaType": "text/plain", "title": "ICLWATER_SoilWater_Metadata.csv" }, { "@type": "dcat:Distribution", "downloadURL": "https://ndownloader.figshare.com/files/45645075", "format": "csv", "mediaType": "application/csv", "title": "ICLWATER_Weather_Data.csv" }, { "@type": "dcat:Distribution", "downloadURL": "https://ndownloader.figshare.com/files/45645078", "format": "csv", "mediaType": "text/plain", "title": "ICLWATER_Weather_Metadata.csv" } ], "license": "https://creativecommons.org/publicdomain/zero/1.0/", "bureauCode": [ "005:18" ], "modified": "2024-04-24", "publisher": { "@type": "org:Organization", "name": "Agricultural Research Service" }, "accrualPeriodicity": "irregular", "keyword": [ "integrated agricultural systems", "Runoff", "Infiltration", "Northern Plains", "Rainfall Simulations" ], "spatial": "{\"type\": \"MultiPoint\", \"coordinates\": [[-100.91277, 46.7732], [-100.90423, 46.76765]]}" }, { "identifier": "10.15482/USDA.ADC/25225919.v1", "accessLevel": "public", "contactPoint": { "hasEmail": "mailto:mark.liebig@usda.gov", "fn": "Liebig, Mark A." }, "programCode": [ "005:040" ], "description": "There are very few reports in the literature with field measurements of wind erosion flux associated with different forms of tillage management. Measurements of wind erosion flux were conducted to quantify the effects of soil tillage disturbance on wind erosion at a site in south central North Dakota USA in 2003 and 2004. The study was conducted on the Area IV Soil Conservation Districts Research Farm. The study site consisted of gently rolling topography (0-3%) with Temvik-Wilton silt loam soils (USDA: Fine-silty, mixed, superactive frigid Typic and Pachic Haplustolls). Three tillage treatments were included in the study: no-tillage (NT), an intermediate level of disturbance, one-pass tandem disk tillage (TDT), and a heavier level of disturbance, two-pass offset disk tillage (ODT). Erosion flux was measured with sediment samplers of the Big Spring Number Eight type from May through September each year. Sediment samplers were positioned near the peripheries of plots and captured soil flux between 5 and 10 cm height. Vertical flux profile was determined by stacked sediment samplers capturing flux at five heights between 5 and 100 cm. Measurements were applied to soil wind erodibility factors, including multiple within-season determinations of prostrate residue coverage (including live material) by marked cable technique, standing residue by photographic means, soil surface roughness by chain method, and twice per season determinations of aggregate size distribution by compact rotary sieve. Data associated with this study should be of interest to soil conservationists, soil scientists, earth scientists, agronomists and others interested in the increased erosion hazards occurring as result of global climate change. Data are generally applicable to croplands under a semiarid Continental climate for the following soil types: Grassna, Linton, Mandan, Temvik, Williams, and Wilton.
", "title": "Data from: ‘Field measurement of wind erosion flux and soil erodibility factors as affected by tillage and seasonal drought’", "distribution": [ { "@type": "dcat:Distribution", "downloadURL": "https://ndownloader.figshare.com/files/44560595", "format": "xlsx", "mediaType": "application/vnd.openxmlformats-officedocument.spreadsheetml.sheet", "title": "Data Dictionary - Wind erosion database.xlsx" }, { "@type": "dcat:Distribution", "downloadURL": "https://ndownloader.figshare.com/files/44560598", "format": "docx", "mediaType": "application/vnd.openxmlformats-officedocument.wordprocessingml.document", "title": "Experiment Explanation - Wind erosion database.docx" }, { "@type": "dcat:Distribution", "downloadURL": "https://ndownloader.figshare.com/files/44560604", "format": "xlsx", "mediaType": "application/vnd.openxmlformats-officedocument.spreadsheetml.sheet", "title": "Residue Coverage_Data&Metadata.xlsx" }, { "@type": "dcat:Distribution", "downloadURL": "https://ndownloader.figshare.com/files/44560607", "format": "csv", "mediaType": "text/plain", "title": "Residue Coverage_Data.csv" }, { "@type": "dcat:Distribution", "downloadURL": "https://ndownloader.figshare.com/files/44560610", "format": "csv", "mediaType": "application/csv", "title": "Residue Coverage_Metadata.csv" }, { "@type": "dcat:Distribution", "downloadURL": "https://ndownloader.figshare.com/files/44560613", "format": "xlsx", "mediaType": "application/vnd.openxmlformats-officedocument.spreadsheetml.sheet", "title": "Sediment Sampler_Data&Metadata.xlsx" }, { "@type": "dcat:Distribution", "downloadURL": "https://ndownloader.figshare.com/files/44560616", "format": "csv", "mediaType": "application/csv", "title": "Sediment Sampler_Data.csv" }, { "@type": "dcat:Distribution", "downloadURL": "https://ndownloader.figshare.com/files/44560619", "format": "csv", "mediaType": "text/plain", "title": "Sediment Sampler_Metadata.csv" }, { "@type": "dcat:Distribution", "downloadURL": "https://ndownloader.figshare.com/files/44560622", "format": "xlsx", "mediaType": "application/vnd.openxmlformats-officedocument.spreadsheetml.sheet", "title": "Soil Roughness_Data&Metadata.xlsx" }, { "@type": "dcat:Distribution", "downloadURL": "https://ndownloader.figshare.com/files/44560625", "format": "csv", "mediaType": "application/csv", "title": "Soil Roughness_Data.csv" }, { "@type": "dcat:Distribution", "downloadURL": "https://ndownloader.figshare.com/files/44560628", "format": "csv", "mediaType": "text/plain", "title": "Soil Roughness_Metadata.csv" } ], "license": "https://creativecommons.org/publicdomain/zero/1.0/", "bureauCode": [ "005:18" ], "modified": "2024-02-26", "publisher": { "@type": "org:Organization", "name": "Agricultural Research Service" }, "accrualPeriodicity": "irregular", "keyword": [ "Wind erosion", "Sediment flux", "Residue coverage", "Soil roughness", "Northern Great Plains" ], "spatial": "{\"type\": \"Point\", \"coordinates\": [-100.9377, 46.7716]}" }, { "identifier": "10.15482/USDA.ADC/25206968.v1", "accessLevel": "public", "contactPoint": { "hasEmail": "mailto:sharon.schneider@usda.gov", "fn": "Schneider, Sharon, K." }, "programCode": [ "005:040" ], "description": "These data provide field measurements at two geographical sites of plant and soil as affected by (a) tillage and water erosion and (b) replacement of translocated topsoil through soil-landscape rehabilitation. Data include pre-restoration soil properties, a digital elevation model, and tillage and water erosion estimates. Data reported after restoration include annual assessments of crop emergence, biomass and grain yield; soil physical, chemical, and biological properties; weed communities; and weather information. The Stevens County, Minnesota site was a heavily eroded site while the Roberts County, South Dakota site was moderately eroded. The data can be used to develop agronomic best management practices to improve crop production and to protect environmental and soil health. The data also could contribute to meta-analyses describing effects of erosion and soil-landscape rehabilitation (translocating soil from areas of net deposition to areas of net soil loss by erosion) on crop performance and changes in soil properties.
", "title": "Soil, crop, and weed communities as affected by soil erosion and topsoil replacement in a Mollisol landform (a six-year soil-landscape rehabilitation study)", "distribution": [ { "@type": "dcat:Distribution", "downloadURL": "https://ndownloader.figshare.com/files/44533802", "format": "docx", "mediaType": "application/vnd.openxmlformats-officedocument.wordprocessingml.document", "title": "Soil-Landscape Rehabilitation Study Metadata.docx" }, { "@type": "dcat:Distribution", "downloadURL": "https://ndownloader.figshare.com/files/44533943", "format": "xlsx", "mediaType": "application/vnd.openxmlformats-officedocument.spreadsheetml.sheet", "title": "User & Publication Information.xlsx" }, { "@type": "dcat:Distribution", "downloadURL": "https://ndownloader.figshare.com/files/44533982", "format": "xlsx", "mediaType": "application/vnd.openxmlformats-officedocument.spreadsheetml.sheet", "title": "Stevens County MN Pre-restoration Soil Data.xlsx" }, { "@type": "dcat:Distribution", "downloadURL": "https://ndownloader.figshare.com/files/44534030", "format": "xlsx", "mediaType": "application/vnd.openxmlformats-officedocument.spreadsheetml.sheet", "title": "Stevens County MN Plant & Soil Data.xlsx" }, { "@type": "dcat:Distribution", "downloadURL": "https://ndownloader.figshare.com/files/44534159", "format": "xlsx", "mediaType": "application/vnd.openxmlformats-officedocument.spreadsheetml.sheet", "title": "Stevens County MN Weather Information.xlsx" }, { "@type": "dcat:Distribution", "downloadURL": "https://ndownloader.figshare.com/files/44534222", "format": "xlsx", "mediaType": "application/vnd.openxmlformats-officedocument.spreadsheetml.sheet", "title": "Roberts County SD Plant & Soil Data.xlsx" }, { "@type": "dcat:Distribution", "downloadURL": "https://ndownloader.figshare.com/files/44534387", "format": "xlsx", "mediaType": "application/vnd.openxmlformats-officedocument.spreadsheetml.sheet", "title": "Roberts County SD Weather Information.xlsx" }, { "accessURL": "https://geodata.nal.usda.gov/geonetwork/srv/api/records/9eaacb50-e855-46e1-bde4-4a7438ddfb83/formatters/xml", "@type": "dcat:Distribution", "format": "xml", "mediaType": "text/xml", "conformsTo": "http://www.isotc211.org/2005/gmd", "title": "Geodata ISO 19139 metadata" } ], "license": "https://creativecommons.org/publicdomain/zero/1.0/", "bureauCode": [ "005:18" ], "modified": "2024-03-26", "publisher": { "@type": "org:Organization", "name": "Agricultural Research Service" }, "theme": [ "geospatial" ], "keyword": [ "Crop production", "Crop productivity", "Soil erosion", "Tillage erosion", "Water erosion", "Soil health", "Spatial variation", "Soil restoration", "Landscape restoration", "Productivity", "Soil carbon", "Plant nutrients", "Soil profile", "Soil fertility", "Corn", "Soybean" ] }, { "identifier": "10.15482/USDA.ADC/25393501.v1", "accessLevel": "public", "contactPoint": { "hasEmail": "mailto:arun.rajamohan@usda.gov", "fn": "Rajamohan, Arun" }, "programCode": [ "005:040" ], "description": "This dataset contains the raw data (unsubstracted) and the machine normalized (subtracted) output files from calorimetry experiments measuring metabolic heat flow of the sugarbeet root maggot. Both isothermal and scanning calorimetry were employed in this project. The metabolism of the larvae was measured over an ecologically relevant temperature from 10 to -16°C. Quality control graphs are provided for each of the runs. The sugarbeet root maggots were examined with two different types of calorimeters, a model FDCS196 (Linkam Scientific, UK) and a model DSC7000X (Hitachi Global, Japan). The model FDCS196 calorimeter filmed the larvae during the runs, documenting the larvae’s ability to remain mobile down to temperatures just above their freezing point.
Despite their fundamentally different designs and algorithms, the two calorimeters gave congruent results. Both calorimeters unexpectedly revealed that the larvae’s metabolic heat flow increased as the temperature decreased. To confirm that our results were not due to equipment error or some misunderstanding on our part, we investigated a similar phenomenon in developing Drosophila melanogaster larvae on the model DSC7000X calorimeter. They gave the same result as the sugarbeet root maggots: increased metabolic heat flow at lower temperatures. This increase in heat flow occurs under both normoxic and anoxic conditions for both species.
", "title": "Using calorimetry to measure metabolic heat in two dipteran species, Tetanops myopaeformis and Drosophila melanogaster, exposed to ecologically relevant low temperatures", "distribution": [ { "@type": "dcat:Distribution", "downloadURL": "https://ndownloader.figshare.com/files/44994952", "format": "png", "mediaType": "image/png", "title": "Dros_01242024_Fig6_D1_subtracted.png" }, { "@type": "dcat:Distribution", "downloadURL": "https://ndownloader.figshare.com/files/44994961", "format": "png", "mediaType": "image/png", "title": "Dros_01242024_Fig6_D1_unsubtracted.png" }, { "@type": "dcat:Distribution", "downloadURL": "https://ndownloader.figshare.com/files/44995006", "format": "png", "mediaType": "image/png", "title": "Dros_01272024_Fig6_D2_unsubtracted.png" }, { "@type": "dcat:Distribution", "downloadURL": "https://ndownloader.figshare.com/files/44994973", "format": "png", "mediaType": "image/png", "title": "Dros_01282024_Fig6_D3_subtracted.png" }, { "@type": "dcat:Distribution", "downloadURL": "https://ndownloader.figshare.com/files/44994982", "format": "png", "mediaType": "image/png", "title": "Dros_01292024_Fig6_D4_unsubtracted.png" }, { "@type": "dcat:Distribution", "downloadURL": "https://ndownloader.figshare.com/files/44994976", "format": "png", "mediaType": "image/png", "title": "Dros_01292024_Fig6_D4_subtracted.png" }, { "@type": "dcat:Distribution", "downloadURL": "https://ndownloader.figshare.com/files/44994979", "format": "png", "mediaType": "image/png", "title": "Dros_01272024_Fig6_D2_subtracted.png" }, { "@type": "dcat:Distribution", "downloadURL": "https://ndownloader.figshare.com/files/44994970", "format": "png", "mediaType": "image/png", "title": "Dros_01292024_Fig6_D5_subtracted.png" }, { "@type": "dcat:Distribution", "downloadURL": "https://ndownloader.figshare.com/files/44994997", "format": "png", "mediaType": "image/png", "title": "SBRM_01202324_Fig6_S4_unsubtracted.png" }, { "@type": "dcat:Distribution", "downloadURL": "https://ndownloader.figshare.com/files/44994958", "format": "png", "mediaType": "image/png", "title": "Dros_01292024_Fig6_D5_unsubtracted.png" }, { "@type": "dcat:Distribution", "downloadURL": "https://ndownloader.figshare.com/files/44995000", "format": "png", "mediaType": "image/png", "title": "Dros_02012024_Fig6_D6_subtracted.png" }, { "@type": "dcat:Distribution", "downloadURL": "https://ndownloader.figshare.com/files/44994949", "format": "png", "mediaType": "image/png", "title": "Dros_02012024_Fig6_D6_unsubtracted.png" }, { "@type": "dcat:Distribution", "downloadURL": "https://ndownloader.figshare.com/files/44994985", "format": "png", "mediaType": "image/png", "title": "SBRM_01202024_Fig6_S1_unsubstracted.png" }, { "@type": "dcat:Distribution", "downloadURL": "https://ndownloader.figshare.com/files/44994967", "format": "png", "mediaType": "image/png", "title": "SBRM_01202024_Fig6_S2_unsubtracted.png" }, { "@type": "dcat:Distribution", "downloadURL": "https://ndownloader.figshare.com/files/44994988", "format": "png", "mediaType": "image/png", "title": "SBRM_01202324_Fig6_S3_unsubstracted.png" }, { "@type": "dcat:Distribution", "downloadURL": "https://ndownloader.figshare.com/files/44994964", "format": "png", "mediaType": "image/png", "title": "SBRM_01222024_Fig6_S1_subtracted.png" }, { "@type": "dcat:Distribution", "downloadURL": "https://ndownloader.figshare.com/files/44994991", "format": "png", "mediaType": "image/png", "title": "SBRM_01222024_Fig6_S2_subtracted.png" }, { "@type": "dcat:Distribution", "downloadURL": "https://ndownloader.figshare.com/files/44994955", "format": "png", "mediaType": "image/png", "title": "SBRM_01232024_Fig6_S3_subtracted.png" }, { "@type": "dcat:Distribution", "downloadURL": "https://ndownloader.figshare.com/files/44995003", "format": "png", "mediaType": "image/png", "title": "SBRM_01232024_Fig6_S4_subtracted.png" }, { "@type": "dcat:Distribution", "downloadURL": "https://ndownloader.figshare.com/files/44994994", "format": "png", "mediaType": "image/png", "title": "SBRM_01242024_Fig6_S5_unsubtracted.png" }, { "@type": "dcat:Distribution", "downloadURL": "https://ndownloader.figshare.com/files/44995012", "format": "png", "mediaType": "image/png", "title": "SBRM_012432024_Fig6_S5_subtracted.png" }, { "@type": "dcat:Distribution", "downloadURL": "https://ndownloader.figshare.com/files/44995015", "format": "png", "mediaType": "image/png", "title": "SBRM_01262024_Fig6_S6_subtracted.png" }, { "@type": "dcat:Distribution", "downloadURL": "https://ndownloader.figshare.com/files/44995009", "format": "png", "mediaType": "image/png", "title": "SBRM_01262024_Fig6_S6_unsubtracted.png" }, { "@type": "dcat:Distribution", "downloadURL": "https://ndownloader.figshare.com/files/44995150", "format": "csv", "mediaType": "application/csv", "title": "Dros_01242024_Fig6_D1_subtracted.csv" }, { "@type": "dcat:Distribution", "downloadURL": "https://ndownloader.figshare.com/files/44995147", "format": "csv", "mediaType": "application/csv", "title": "Dros_01242024_Fig6_D1_unsubtracted.csv" }, { "@type": "dcat:Distribution", "downloadURL": "https://ndownloader.figshare.com/files/44995156", "format": "csv", "mediaType": "application/csv", "title": "Dros_01272024_Fig6_D2_subtracted.csv" }, { "@type": "dcat:Distribution", "downloadURL": "https://ndownloader.figshare.com/files/44995153", "format": "csv", "mediaType": "text/plain", "title": "Dros_01272024_Fig6_D2_unsubtracted.csv" }, { "@type": "dcat:Distribution", "downloadURL": "https://ndownloader.figshare.com/files/44995159", "format": "csv", "mediaType": "text/plain", "title": "Dros_01282024_Fig6_D3_subtracted.csv" }, { "@type": "dcat:Distribution", "downloadURL": "https://ndownloader.figshare.com/files/44995165", "format": "csv", "mediaType": "application/csv", "title": "Dros_01282024_Fig6_D3_unsubtracted.csv" }, { "@type": "dcat:Distribution", "downloadURL": "https://ndownloader.figshare.com/files/44995189", "format": "csv", "mediaType": "application/csv", "title": "Dros_01292024_Fig6_D4_subtracted.csv" }, { "@type": "dcat:Distribution", "downloadURL": "https://ndownloader.figshare.com/files/44995168", "format": "csv", "mediaType": "application/csv", "title": "Dros_01292024_Fig6_D4_unsubtracted.csv" }, { "@type": "dcat:Distribution", "downloadURL": "https://ndownloader.figshare.com/files/44995192", "format": "csv", "mediaType": "text/plain", "title": "Dros_01292024_Fig6_D5_subtracted.csv" }, { "@type": "dcat:Distribution", "downloadURL": "https://ndownloader.figshare.com/files/44995186", "format": "csv", "mediaType": "text/plain", "title": "Dros_01292024_Fig6_D5_unsubtracted.csv" }, { "@type": "dcat:Distribution", "downloadURL": "https://ndownloader.figshare.com/files/44995210", "format": "csv", "mediaType": "application/csv", "title": "Dros_02012024_Fig6_D6_subtracted.csv" }, { "@type": "dcat:Distribution", "downloadURL": "https://ndownloader.figshare.com/files/44995171", "format": "csv", "mediaType": "text/plain", "title": "Dros_02012024_Fig6_D6_unsubtracted.csv" }, { "@type": "dcat:Distribution", "downloadURL": "https://ndownloader.figshare.com/files/44995285", "format": "csv", "mediaType": "text/plain", "title": "SBRM_01202024_Fig6_S1_substracted.csv" }, { "@type": "dcat:Distribution", "downloadURL": "https://ndownloader.figshare.com/files/44995291", "format": "csv", "mediaType": "text/plain", "title": "SBRM_01202024_Fig6_S1_unsubstracted.csv" }, { "@type": "dcat:Distribution", "downloadURL": "https://ndownloader.figshare.com/files/44995297", "format": "csv", "mediaType": "application/csv", "title": "SBRM_01202024_Fig6_S2_subtracted.csv" }, { "@type": "dcat:Distribution", "downloadURL": "https://ndownloader.figshare.com/files/44995303", "format": "csv", "mediaType": "text/plain", "title": "SBRM_01202024_Fig6_S2_unsubtracted.csv" }, { "@type": "dcat:Distribution", "downloadURL": "https://ndownloader.figshare.com/files/44995312", "format": "csv", "mediaType": "application/csv", "title": "SBRM_01202324_Fig6_S3_substracted.csv" }, { "@type": "dcat:Distribution", "downloadURL": "https://ndownloader.figshare.com/files/44995180", "format": "png", "mediaType": "image/png", "title": "SBRM_11082022_Fig2_F8_unsubstracted.png" }, { "@type": "dcat:Distribution", "downloadURL": "https://ndownloader.figshare.com/files/44995315", "format": "csv", "mediaType": "text/plain", "title": "SBRM_01202324_Fig6_S3_unsubstracted.csv" }, { "@type": "dcat:Distribution", "downloadURL": "https://ndownloader.figshare.com/files/44995183", "format": "png", "mediaType": "image/png", "title": "SBRM_11072022_Fig2_F7 substracted.png" }, { "@type": "dcat:Distribution", "downloadURL": "https://ndownloader.figshare.com/files/44995321", "format": "csv", "mediaType": "application/csv", "title": "SBRM_01202324_Fig6_S4_subtracted.csv" }, { "@type": "dcat:Distribution", "downloadURL": "https://ndownloader.figshare.com/files/44995327", "format": "csv", "mediaType": "application/csv", "title": "SBRM_01202324_Fig6_S4_unsubtracted.csv" }, { "@type": "dcat:Distribution", "downloadURL": "https://ndownloader.figshare.com/files/44995324", "format": "csv", "mediaType": "text/plain", "title": "SBRM_01242024_Fig6_S5_subtracted.csv" }, { "@type": "dcat:Distribution", "downloadURL": "https://ndownloader.figshare.com/files/44995330", "format": "csv", "mediaType": "text/plain", "title": "SBRM_01242024_Fig6_S5_unsubtracted.csv" }, { "@type": "dcat:Distribution", "downloadURL": "https://ndownloader.figshare.com/files/44995348", "format": "csv", "mediaType": "text/plain", "title": "SBRM_01262024_Fig6_S6_subtracted.csv" }, { "@type": "dcat:Distribution", "downloadURL": "https://ndownloader.figshare.com/files/44995342", "format": "csv", "mediaType": "application/csv", "title": "SBRM_01262024_Fig6_S6_unsubtracted.csv" }, { "@type": "dcat:Distribution", "downloadURL": "https://ndownloader.figshare.com/files/44995018", "format": "png", "mediaType": "image/png", "title": "SBRM_03232023_Fig4_L1_subtracted.png" }, { "@type": "dcat:Distribution", "downloadURL": "https://ndownloader.figshare.com/files/44995033", "format": "png", "mediaType": "image/png", "title": "SBRM_03242023_Fig4_L1_unsubtracted.png" }, { "@type": "dcat:Distribution", "downloadURL": "https://ndownloader.figshare.com/files/44995021", "format": "png", "mediaType": "image/png", "title": "SBRM_03282023_Fig4_L2_substracted.png" }, { "@type": "dcat:Distribution", "downloadURL": "https://ndownloader.figshare.com/files/44995024", "format": "png", "mediaType": "image/png", "title": "SBRM_03282023_Fig4_L2_unsubstracted.png" }, { "@type": "dcat:Distribution", "downloadURL": "https://ndownloader.figshare.com/files/44995036", "format": "png", "mediaType": "image/png", "title": "SBRM_03282023_Fig4_Sapp_subtracted.png" }, { "@type": "dcat:Distribution", "downloadURL": "https://ndownloader.figshare.com/files/44995030", "format": "png", "mediaType": "image/png", "title": "SBRM_03282023_Fig4_Sapp_unsubtracted.png" }, { "@type": "dcat:Distribution", "downloadURL": "https://ndownloader.figshare.com/files/44995027", "format": "png", "mediaType": "image/png", "title": "SBRM_03292023_Fig4_L3_subtracted.png" }, { "@type": "dcat:Distribution", "downloadURL": "https://ndownloader.figshare.com/files/44995039", "format": "png", "mediaType": "image/png", "title": "SBRM_03292023_Fig4_L3_unsubtracted.png" }, { "@type": "dcat:Distribution", "downloadURL": "https://ndownloader.figshare.com/files/44995072", "format": "png", "mediaType": "image/png", "title": "SBRM_03302023_Fig4_B3.png" }, { "@type": "dcat:Distribution", "downloadURL": "https://ndownloader.figshare.com/files/44995063", "format": "png", "mediaType": "image/png", "title": "SBRM_03302023_Fig4_L4_subtracted.png" }, { "@type": "dcat:Distribution", "downloadURL": "https://ndownloader.figshare.com/files/44995051", "format": "png", "mediaType": "image/png", "title": "SBRM_03302023_Fig4_L4_unsubtracted.png" }, { "@type": "dcat:Distribution", "downloadURL": "https://ndownloader.figshare.com/files/44995042", "format": "png", "mediaType": "image/png", "title": "SBRM_03312023_Fig4_L5_subtracted.png" }, { "@type": "dcat:Distribution", "downloadURL": "https://ndownloader.figshare.com/files/44995060", "format": "png", "mediaType": "image/png", "title": "SBRM_03312023_Fig4_L5_unsubtracted.png" }, { "@type": "dcat:Distribution", "downloadURL": "https://ndownloader.figshare.com/files/44995228", "format": "csv", "mediaType": "text/plain", "title": "SBRM_03242023_Fig4_L1_subtracted.csv" }, { "@type": "dcat:Distribution", "downloadURL": "https://ndownloader.figshare.com/files/44995225", "format": "csv", "mediaType": "application/csv", "title": "SBRM_03242023_Fig4_L1_unsubtracted.csv" }, { "@type": "dcat:Distribution", "downloadURL": "https://ndownloader.figshare.com/files/44995237", "format": "csv", "mediaType": "application/csv", "title": "SBRM_03282023_Fig4_L2_substracted.csv" }, { "@type": "dcat:Distribution", "downloadURL": "https://ndownloader.figshare.com/files/44995252", "format": "csv", "mediaType": "text/plain", "title": "SBRM_03282023_Fig4_L2_unsubstracted.csv" }, { "@type": "dcat:Distribution", "downloadURL": "https://ndownloader.figshare.com/files/44995243", "format": "csv", "mediaType": "text/plain", "title": "SBRM_03282023_Fig4_Sapp_subtracted.csv" }, { "@type": "dcat:Distribution", "downloadURL": "https://ndownloader.figshare.com/files/44995261", "format": "csv", "mediaType": "application/csv", "title": "SBRM_03282023_Fig4_Sapp_unsubtracted.csv" }, { "@type": "dcat:Distribution", "downloadURL": "https://ndownloader.figshare.com/files/44995258", "format": "csv", "mediaType": "text/plain", "title": "SBRM_03292023_Fig4_L3_subtracted.csv" }, { "@type": "dcat:Distribution", "downloadURL": "https://ndownloader.figshare.com/files/44995267", "format": "csv", "mediaType": "text/plain", "title": "SBRM_03292023_Fig4_L3_unsubtracted.csv" }, { "@type": "dcat:Distribution", "downloadURL": "https://ndownloader.figshare.com/files/44995270", "format": "csv", "mediaType": "application/csv", "title": "SBRM_03302023_Fig4_B3.csv" }, { "@type": "dcat:Distribution", "downloadURL": "https://ndownloader.figshare.com/files/44995273", "format": "csv", "mediaType": "application/csv", "title": "SBRM_03302023_Fig4_L4_subtracted.csv" }, { "@type": "dcat:Distribution", "downloadURL": "https://ndownloader.figshare.com/files/44995276", "format": "csv", "mediaType": "text/plain", "title": "SBRM_03302023_Fig4_L4_unsubtracted.csv" }, { "@type": "dcat:Distribution", "downloadURL": "https://ndownloader.figshare.com/files/44995279", "format": "csv", "mediaType": "text/plain", "title": "SBRM_03312023_Fig4_L5_subtracted.csv" }, { "@type": "dcat:Distribution", "downloadURL": "https://ndownloader.figshare.com/files/44995282", "format": "csv", "mediaType": "application/csv", "title": "SBRM_03312023_Fig4_L5_unsubtracted.csv" }, { "@type": "dcat:Distribution", "downloadURL": "https://ndownloader.figshare.com/files/44995048", "format": "png", "mediaType": "image/png", "title": "SBRM_08252022_Fig3.png" }, { "@type": "dcat:Distribution", "downloadURL": "https://ndownloader.figshare.com/files/44995066", "format": "png", "mediaType": "image/png", "title": "SBRM_08252022_Fig3_unsubstracted.png" }, { "@type": "dcat:Distribution", "downloadURL": "https://ndownloader.figshare.com/files/44995345", "format": "csv", "mediaType": "text/plain", "title": "SBRM_08042022_Fig2_C2.csv" }, { "@type": "dcat:Distribution", "downloadURL": "https://ndownloader.figshare.com/files/44995057", "format": "png", "mediaType": "image/png", "title": "SBRM_08262022_Fig3.png" }, { "@type": "dcat:Distribution", "downloadURL": "https://ndownloader.figshare.com/files/44995045", "format": "png", "mediaType": "image/png", "title": "SBRM_08262022_Fig3_unsubstracted.png" }, { "@type": "dcat:Distribution", "downloadURL": "https://ndownloader.figshare.com/files/44995069", "format": "png", "mediaType": "image/png", "title": "SBRM_09072022_Fig3.png" }, { "@type": "dcat:Distribution", "downloadURL": "https://ndownloader.figshare.com/files/44995054", "format": "png", "mediaType": "image/png", "title": "SBRM_09072022_Fig3_unsubstracted.png" }, { "@type": "dcat:Distribution", "downloadURL": "https://ndownloader.figshare.com/files/44995075", "format": "png", "mediaType": "image/png", "title": "SBRM_09092022_Fig3.png" }, { "@type": "dcat:Distribution", "downloadURL": "https://ndownloader.figshare.com/files/44995087", "format": "png", "mediaType": "image/png", "title": "SBRM_09092022_Fig3_unsubstracted.png" }, { "@type": "dcat:Distribution", "downloadURL": "https://ndownloader.figshare.com/files/44995084", "format": "png", "mediaType": "image/png", "title": "SBRM_09132022_Fig3.png" }, { "@type": "dcat:Distribution", "downloadURL": "https://ndownloader.figshare.com/files/44995081", "format": "png", "mediaType": "image/png", "title": "SBRM_09132022_Fig3_unsubstracted.png" }, { "@type": "dcat:Distribution", "downloadURL": "https://ndownloader.figshare.com/files/44995078", "format": "png", "mediaType": "image/png", "title": "SBRM_09142022_Fig3.png" }, { "@type": "dcat:Distribution", "downloadURL": "https://ndownloader.figshare.com/files/44995090", "format": "png", "mediaType": "image/png", "title": "SBRM_09142022_Fig3_unsubstracted.png" }, { "@type": "dcat:Distribution", "downloadURL": "https://ndownloader.figshare.com/files/44995093", "format": "png", "mediaType": "image/png", "title": "SBRM_09152022_Fig3.png" }, { "@type": "dcat:Distribution", "downloadURL": "https://ndownloader.figshare.com/files/44995096", "format": "png", "mediaType": "image/png", "title": "SBRM_09152022_Fig3_unsubstracted.png" }, { "@type": "dcat:Distribution", "downloadURL": "https://ndownloader.figshare.com/files/44995366", "format": "csv", "mediaType": "application/csv", "title": "SBRM_08252022_Fig3_substracted.csv" }, { "@type": "dcat:Distribution", "downloadURL": "https://ndownloader.figshare.com/files/44995369", "format": "csv", "mediaType": "text/plain", "title": "SBRM_08252022_Fig3_unsubstracted.csv" }, { "@type": "dcat:Distribution", "downloadURL": "https://ndownloader.figshare.com/files/44995372", "format": "csv", "mediaType": "application/csv", "title": "SBRM_08262022_Fig3_substracted.csv" }, { "@type": "dcat:Distribution", "downloadURL": "https://ndownloader.figshare.com/files/44995375", "format": "csv", "mediaType": "application/csv", "title": "SBRM_08262022_Fig3_unsubstracted.csv" }, { "@type": "dcat:Distribution", "downloadURL": "https://ndownloader.figshare.com/files/44995378", "format": "csv", "mediaType": "text/plain", "title": "SBRM_09072022_Fig3_substracted.csv" }, { "@type": "dcat:Distribution", "downloadURL": "https://ndownloader.figshare.com/files/44995381", "format": "csv", "mediaType": "text/plain", "title": "SBRM_09072022_Fig3_unsubstracted.csv" }, { "@type": "dcat:Distribution", "downloadURL": "https://ndownloader.figshare.com/files/44995387", "format": "csv", "mediaType": "application/csv", "title": "SBRM_09092022_Fig3_substracted.csv" }, { "@type": "dcat:Distribution", "downloadURL": "https://ndownloader.figshare.com/files/44995384", "format": "csv", "mediaType": "text/plain", "title": "SBRM_09092022_Fig3_unsubstracted.csv" }, { "@type": "dcat:Distribution", "downloadURL": "https://ndownloader.figshare.com/files/44995390", "format": "csv", "mediaType": "text/plain", "title": "SBRM_09132022_Fig3_substracted.csv" }, { "@type": "dcat:Distribution", "downloadURL": "https://ndownloader.figshare.com/files/44995393", "format": "csv", "mediaType": "application/csv", "title": "SBRM_09132022_Fig3_unsubstracted.csv" }, { "@type": "dcat:Distribution", "downloadURL": "https://ndownloader.figshare.com/files/44995402", "format": "csv", "mediaType": "application/csv", "title": "SBRM_09142022_Fig3_substracted.csv" }, { "@type": "dcat:Distribution", "downloadURL": "https://ndownloader.figshare.com/files/44995396", "format": "csv", "mediaType": "text/plain", "title": "SBRM_09142022_Fig3_unsubstracted.csv" }, { "@type": "dcat:Distribution", "downloadURL": "https://ndownloader.figshare.com/files/44995399", "format": "csv", "mediaType": "application/csv", "title": "SBRM_09152022_Fig3_substracted.csv" }, { "@type": "dcat:Distribution", "downloadURL": "https://ndownloader.figshare.com/files/44995405", "format": "csv", "mediaType": "text/plain", "title": "SBRM_09152022_Fig3_unsubstracted.csv" }, { "@type": "dcat:Distribution", "downloadURL": "https://ndownloader.figshare.com/files/44995492", "format": "avi", "mediaType": "video/x-msvideo", "title": "SBRM_05122022_Fig2_F1.avi" }, { "@type": "dcat:Distribution", "downloadURL": "https://ndownloader.figshare.com/files/44995483", "format": "avi", "mediaType": "video/x-msvideo", "title": "SBRM_05132022_Fig2_F2.avi" }, { "@type": "dcat:Distribution", "downloadURL": "https://ndownloader.figshare.com/files/44995486", "format": "avi", "mediaType": "video/x-msvideo", "title": "SBRM_05142022_Fig2_N1.avi" }, { "@type": "dcat:Distribution", "downloadURL": "https://ndownloader.figshare.com/files/44995450", "format": "avi", "mediaType": "video/x-msvideo", "title": "SBRM_05182022_Fig2_N3.avi" }, { "@type": "dcat:Distribution", "downloadURL": "https://ndownloader.figshare.com/files/44995489", "format": "avi", "mediaType": "video/x-msvideo", "title": "SBRM_05192022_Fig2_N4.avi" }, { "@type": "dcat:Distribution", "downloadURL": "https://ndownloader.figshare.com/files/44995420", "format": "avi", "mediaType": "video/x-msvideo", "title": "SBRM_05202022_Fig2_F3.avi" }, { "@type": "dcat:Distribution", "downloadURL": "https://ndownloader.figshare.com/files/44995099", "format": "png", "mediaType": "image/png", "title": "SBRMM_05132022_Fig2_F2.png" }, { "@type": "dcat:Distribution", "downloadURL": "https://ndownloader.figshare.com/files/44995102", "format": "png", "mediaType": "image/png", "title": "SBRM_0512202_Fig2_F1.png" }, { "@type": "dcat:Distribution", "downloadURL": "https://ndownloader.figshare.com/files/44995105", "format": "png", "mediaType": "image/png", "title": "SBRM_05142022_Fig2_N1.png" }, { "@type": "dcat:Distribution", "downloadURL": "https://ndownloader.figshare.com/files/44995474", "format": "csv", "mediaType": "application/csv", "title": "SBRM_12022022_Fig2_D1_unsubtracted.csv" }, { "@type": "dcat:Distribution", "downloadURL": "https://ndownloader.figshare.com/files/44995108", "format": "png", "mediaType": "image/png", "title": "SBRM_05162022_FIG2_N2.png" }, { "@type": "dcat:Distribution", "downloadURL": "https://ndownloader.figshare.com/files/44995111", "format": "png", "mediaType": "image/png", "title": "SBRM_05182022_Fig2_N3.png" }, { "@type": "dcat:Distribution", "downloadURL": "https://ndownloader.figshare.com/files/44995114", "format": "png", "mediaType": "image/png", "title": "SBRM_05192022_Fig2_N4.png" }, { "@type": "dcat:Distribution", "downloadURL": "https://ndownloader.figshare.com/files/44995117", "format": "png", "mediaType": "image/png", "title": "SBRM_05202022_Fig2_F3.png" }, { "@type": "dcat:Distribution", "downloadURL": "https://ndownloader.figshare.com/files/44995120", "format": "png", "mediaType": "image/png", "title": "SBRM_07162022_Fig2_C1.png" }, { "@type": "dcat:Distribution", "downloadURL": "https://ndownloader.figshare.com/files/44995123", "format": "png", "mediaType": "image/png", "title": "SBRM_08042022_Fig2_C2.png" }, { "@type": "dcat:Distribution", "downloadURL": "https://ndownloader.figshare.com/files/44995132", "format": "png", "mediaType": "image/png", "title": "SBRM_08102022_Fig2_C3.png" }, { "@type": "dcat:Distribution", "downloadURL": "https://ndownloader.figshare.com/files/44995135", "format": "png", "mediaType": "image/png", "title": "SBRM_08112022_Fig2_C4.png" }, { "@type": "dcat:Distribution", "downloadURL": "https://ndownloader.figshare.com/files/44995129", "format": "png", "mediaType": "image/png", "title": "SBRM_08122022_Fig2_C5.png" }, { "@type": "dcat:Distribution", "downloadURL": "https://ndownloader.figshare.com/files/44995141", "format": "png", "mediaType": "image/png", "title": "SBRM_08222022_Fig2_F4.png" }, { "@type": "dcat:Distribution", "downloadURL": "https://ndownloader.figshare.com/files/44995138", "format": "png", "mediaType": "image/png", "title": "SBRM_08232022_Fig2_F5.png" }, { "@type": "dcat:Distribution", "downloadURL": "https://ndownloader.figshare.com/files/44995126", "format": "png", "mediaType": "image/png", "title": "SBRM_10032022_Fig2_D4_unsubstracted.png" }, { "@type": "dcat:Distribution", "downloadURL": "https://ndownloader.figshare.com/files/44995144", "format": "png", "mediaType": "image/png", "title": "SBRM_11042022_Fig2_F6_substracted.png" }, { "@type": "dcat:Distribution", "downloadURL": "https://ndownloader.figshare.com/files/44995162", "format": "png", "mediaType": "image/png", "title": "SBRM_11042022_Fig2_F6_unsubstracted.png" }, { "@type": "dcat:Distribution", "downloadURL": "https://ndownloader.figshare.com/files/44995195", "format": "png", "mediaType": "image/png", "title": "SBRM_11072022_Fig2_F7_unsubstracted.png" }, { "@type": "dcat:Distribution", "downloadURL": "https://ndownloader.figshare.com/files/44995198", "format": "png", "mediaType": "image/png", "title": "SBRM_11082022_Fig2_F8_substracted.png" }, { "@type": "dcat:Distribution", "downloadURL": "https://ndownloader.figshare.com/files/44995201", "format": "png", "mediaType": "image/png", "title": "SBRM_11092022_Fig2_F9_substracted.png" }, { "@type": "dcat:Distribution", "downloadURL": "https://ndownloader.figshare.com/files/44995177", "format": "png", "mediaType": "image/png", "title": "SBRM_11092022_Fig2_F9_unsubstracted.png" }, { "@type": "dcat:Distribution", "downloadURL": "https://ndownloader.figshare.com/files/44995174", "format": "png", "mediaType": "image/png", "title": "SBRM_11102022_Fig2_F10_substracted.png" }, { "@type": "dcat:Distribution", "downloadURL": "https://ndownloader.figshare.com/files/44995207", "format": "png", "mediaType": "image/png", "title": "SBRM_11102022_Fig2_F10_unsubstracted.png" }, { "@type": "dcat:Distribution", "downloadURL": "https://ndownloader.figshare.com/files/44995204", "format": "png", "mediaType": "image/png", "title": "SBRM_11142023_Fig2_D6_substracted.png" }, { "@type": "dcat:Distribution", "downloadURL": "https://ndownloader.figshare.com/files/44995213", "format": "png", "mediaType": "image/png", "title": "SBRM_11142023_Fig2_D6_unsubstracted.png" }, { "@type": "dcat:Distribution", "downloadURL": "https://ndownloader.figshare.com/files/44995222", "format": "png", "mediaType": "image/png", "title": "SBRM_11152022_Fig2_F11_substracted.png" }, { "@type": "dcat:Distribution", "downloadURL": "https://ndownloader.figshare.com/files/44995216", "format": "png", "mediaType": "image/png", "title": "SBRM_11152022_Fig2_F11_unsubstracted.png" }, { "@type": "dcat:Distribution", "downloadURL": "https://ndownloader.figshare.com/files/44995219", "format": "png", "mediaType": "image/png", "title": "SBRM_11152023_Fig_D7_substracted.png" }, { "@type": "dcat:Distribution", "downloadURL": "https://ndownloader.figshare.com/files/44995231", "format": "png", "mediaType": "image/png", "title": "SBRM_11152023_Fig_D7_unsubstracted.png" }, { "@type": "dcat:Distribution", "downloadURL": "https://ndownloader.figshare.com/files/44995234", "format": "png", "mediaType": "image/png", "title": "SBRM_12022922_Fig2_D1_substracted.png" }, { "@type": "dcat:Distribution", "downloadURL": "https://ndownloader.figshare.com/files/44995249", "format": "png", "mediaType": "image/png", "title": "SBRM_12022922_Fig2_D1_unsubstracted.png" }, { "@type": "dcat:Distribution", "downloadURL": "https://ndownloader.figshare.com/files/44995240", "format": "png", "mediaType": "image/png", "title": "SBRM_12032022_Fig2_D3_substracted.png" }, { "@type": "dcat:Distribution", "downloadURL": "https://ndownloader.figshare.com/files/44995246", "format": "png", "mediaType": "image/png", "title": "SBRM_12032022_Fig2_D3_unsubstracted.png" }, { "@type": "dcat:Distribution", "downloadURL": "https://ndownloader.figshare.com/files/44995255", "format": "png", "mediaType": "image/png", "title": "SBRM_12032022_Fig2_D4_substracted.png" }, { "@type": "dcat:Distribution", "downloadURL": "https://ndownloader.figshare.com/files/44995264", "format": "png", "mediaType": "image/png", "title": "SBRM_12032022_Fig2_D4_unsubstracted.png" }, { "@type": "dcat:Distribution", "downloadURL": "https://ndownloader.figshare.com/files/44995288", "format": "csv", "mediaType": "application/csv", "title": "SBRM_05122022_Fig2_F1.csv" }, { "@type": "dcat:Distribution", "downloadURL": "https://ndownloader.figshare.com/files/44995294", "format": "csv", "mediaType": "text/plain", "title": "SBRM_05132022_Fig2_F2.csv" }, { "@type": "dcat:Distribution", "downloadURL": "https://ndownloader.figshare.com/files/44995300", "format": "csv", "mediaType": "application/csv", "title": "SBRM_05142022_Fig2_N1.csv" }, { "@type": "dcat:Distribution", "downloadURL": "https://ndownloader.figshare.com/files/44995306", "format": "csv", "mediaType": "text/plain", "title": "SBRM_05162022_Fig2_N2.csv" }, { "@type": "dcat:Distribution", "downloadURL": "https://ndownloader.figshare.com/files/44995309", "format": "csv", "mediaType": "application/csv", "title": "SBRM_05182022_Fig2_N3.csv" }, { "@type": "dcat:Distribution", "downloadURL": "https://ndownloader.figshare.com/files/44995318", "format": "csv", "mediaType": "text/plain", "title": "SBRM_05192022_Fig2_N4.csv" }, { "@type": "dcat:Distribution", "downloadURL": "https://ndownloader.figshare.com/files/44995333", "format": "csv", "mediaType": "application/csv", "title": "SBRM_05202022_Fig2_F3.csv" }, { "@type": "dcat:Distribution", "downloadURL": "https://ndownloader.figshare.com/files/44995408", "format": "csv", "mediaType": "text/plain", "title": "SBRM_11042022_Fig2_F6_unsubtracted.csv" }, { "@type": "dcat:Distribution", "downloadURL": "https://ndownloader.figshare.com/files/44995336", "format": "csv", "mediaType": "text/plain", "title": "sbrm_07162022_FIG2_C1.csv" }, { "@type": "dcat:Distribution", "downloadURL": "https://ndownloader.figshare.com/files/44995414", "format": "csv", "mediaType": "application/csv", "title": "SBRM_11072022_Fig2_F7_subtracted Data.csv" }, { "@type": "dcat:Distribution", "downloadURL": "https://ndownloader.figshare.com/files/44995417", "format": "csv", "mediaType": "application/csv", "title": "SBRM_11072022_Fig2_F7_unsubtracted.csv" }, { "@type": "dcat:Distribution", "downloadURL": "https://ndownloader.figshare.com/files/44995339", "format": "csv", "mediaType": "application/csv", "title": "SBRM_08102022_Fig2_C3.csv" }, { "@type": "dcat:Distribution", "downloadURL": "https://ndownloader.figshare.com/files/44995423", "format": "csv", "mediaType": "text/plain", "title": "SBRM_11082022_Fig2_F8_subtracted.csv" }, { "@type": "dcat:Distribution", "downloadURL": "https://ndownloader.figshare.com/files/44995351", "format": "csv", "mediaType": "text/plain", "title": "SBRM_08112022_Fig2_C4.csv" }, { "@type": "dcat:Distribution", "downloadURL": "https://ndownloader.figshare.com/files/44995363", "format": "csv", "mediaType": "application/csv", "title": "SBRM_08122022_Fig2_C5.csv" }, { "@type": "dcat:Distribution", "downloadURL": "https://ndownloader.figshare.com/files/44995354", "format": "csv", "mediaType": "application/csv", "title": "SBRM_08222022_Fig2_F4.csv" }, { "@type": "dcat:Distribution", "downloadURL": "https://ndownloader.figshare.com/files/44995357", "format": "csv", "mediaType": "text/plain", "title": "SBRM_08232022_Fig2_F5.csv" }, { "@type": "dcat:Distribution", "downloadURL": "https://ndownloader.figshare.com/files/44995411", "format": "csv", "mediaType": "application/csv", "title": "SBRM_11042022_Fig2_F6_subtracted.csv" }, { "@type": "dcat:Distribution", "downloadURL": "https://ndownloader.figshare.com/files/44995426", "format": "csv", "mediaType": "text/plain", "title": "SBRM_11082022_Fig2_F8_unsubtracted.csv" }, { "@type": "dcat:Distribution", "downloadURL": "https://ndownloader.figshare.com/files/44995429", "format": "csv", "mediaType": "text/plain", "title": "SBRM_11092022_Fig2_F9-unsubtracted.csv" }, { "@type": "dcat:Distribution", "downloadURL": "https://ndownloader.figshare.com/files/44995432", "format": "csv", "mediaType": "application/csv", "title": "SBRM_11092022_Fig2_F9_subtracted.csv" }, { "@type": "dcat:Distribution", "downloadURL": "https://ndownloader.figshare.com/files/44995435", "format": "csv", "mediaType": "application/csv", "title": "SBRM_11102022_Fif2_F10_unsubtracted.csv" }, { "@type": "dcat:Distribution", "downloadURL": "https://ndownloader.figshare.com/files/44995438", "format": "csv", "mediaType": "text/plain", "title": "SBRM_11102022_Fig2_10_subtracted.csv" }, { "@type": "dcat:Distribution", "downloadURL": "https://ndownloader.figshare.com/files/44995441", "format": "csv", "mediaType": "application/csv", "title": "SBRM_11142023_Fig2_D6_ unsubtracted.csv" }, { "@type": "dcat:Distribution", "downloadURL": "https://ndownloader.figshare.com/files/44995444", "format": "csv", "mediaType": "application/csv", "title": "SBRM_11142023_Fig2_D6_substracted.csv" }, { "@type": "dcat:Distribution", "downloadURL": "https://ndownloader.figshare.com/files/44995447", "format": "csv", "mediaType": "text/plain", "title": "SBRM_11142023_Fig2_D6_unsubtracted.csv" }, { "@type": "dcat:Distribution", "downloadURL": "https://ndownloader.figshare.com/files/44995453", "format": "csv", "mediaType": "application/csv", "title": "SBRM_11142023_Fig2_D7_substracted.csv" }, { "@type": "dcat:Distribution", "downloadURL": "https://ndownloader.figshare.com/files/44995456", "format": "csv", "mediaType": "text/plain", "title": "SBRM_11152022_Fig2_F11_subtracted.csv" }, { "@type": "dcat:Distribution", "downloadURL": "https://ndownloader.figshare.com/files/44995459", "format": "csv", "mediaType": "text/plain", "title": "SBRM_11152022_Fig2_F11_unsubtracted.csv" }, { "@type": "dcat:Distribution", "downloadURL": "https://ndownloader.figshare.com/files/44995462", "format": "csv", "mediaType": "application/csv", "title": "SBRM_11152023_Fig2_D7_unsubstracted.csv" }, { "@type": "dcat:Distribution", "downloadURL": "https://ndownloader.figshare.com/files/44995465", "format": "csv", "mediaType": "application/csv", "title": "SBRM_12022022_Fig2_D1_subtracted.csv" }, { "@type": "dcat:Distribution", "downloadURL": "https://ndownloader.figshare.com/files/44995468", "format": "csv", "mediaType": "text/plain", "title": "SBRM_12032022_Fig2_D3_subtracted.csv" }, { "@type": "dcat:Distribution", "downloadURL": "https://ndownloader.figshare.com/files/44995471", "format": "csv", "mediaType": "application/csv", "title": "SBRM_12032022_Fig2_D3_unsubtracted.csv" }, { "@type": "dcat:Distribution", "downloadURL": "https://ndownloader.figshare.com/files/44995480", "format": "csv", "mediaType": "application/csv", "title": "SBRM_12032022_Fig2_D4_subtracted.csv" }, { "@type": "dcat:Distribution", "downloadURL": "https://ndownloader.figshare.com/files/44995477", "format": "csv", "mediaType": "text/plain", "title": "SBRM_12032022_Fig2_D4_unsubtracted.csv" } ], "license": "https://www.usa.gov/publicdomain/label/1.0/", "bureauCode": [ "005:18" ], "modified": "2024-03-22", "publisher": { "@type": "org:Organization", "name": "Agricultural Research Service" }, "keyword": [ "sugarbeet root maggot", "Tetanops myopaeformis", "diapause", "dormancy", "freeze tolerant", "metabolic rate", "calorimetry (DSC)", "normoxia", "NP305", "overwintering", "anoxia", "stress" ] }, { "identifier": "10113/AA22544", "accessLevel": "public", "contactPoint": { "hasEmail": "mailto:Ryan.Hayes@ars.usda.gov", "fn": "Hayes, Ryan" }, "programCode": [ "005:040" ], "description": "A Baseflow Filter for Hydrologic Models in R
Resource Title: A Baseflow Filter for Hydrologic Models in R.
File Name: Web Page, url: https://www.ars.usda.gov/research/software/download/?softwareid=383&modecode=20-72-05-00
download page
Maize and soybean yield data set for Precision Zonal Management (PZM) project from 2012-2015. Project compared chisel plow tillage against ridge tillage (PZM) systems, with and without winter cereal rye cover crops. Experimental sites in four US states: IL, MI, MN and PA. Data set provides plot-level yield data (kg/ha) for each site-year and for both crops.
\nFile also contains data set of maize and soybean yield stability, with soil properties measured in 2015 (end of experimental period) and delta values (values in 2015 minus values prior to experiment establishment in 2011).
Resource Title: Data for: A regionally-adapted implementation of conservation agriculture delivers rapid improvements to soil properties associated with crop yield stability.
File Name: PZM_yields_stability_soil.xlsx
Resource Description: Data files combined into a single excel document.
Resource Title: Data Dictionary.
File Name: PZM_data_dictionary.csv
Resource Title: Yield data for: A regionally-adapted implementation of conservation agriculture delivers rapid improvements to soil properties associated with crop yield stability.
File Name: PZM_Yields.csv
Resource Title: Stable Soil data for: A regionally-adapted implementation of conservation agriculture delivers rapid improvements to soil properties associated with crop yield stability.
File Name: PZM_stable_soil.csv
ACRE Study for Greenhouse gas Reduction through Agricultural Carbon Enhancement network in West Lafayette, Indiana\nIn-field measurements of direct soil greenhouse gas (GHG) emissions provide critical data for quantifying the net energy efficiency and economic feasibility of crop residue based bioenergy production systems. A major challenge to such assessments has been the paucity of field studies addressing the effects of crop residue removal and associated best practices for soil management (i.e., conservation tillage) on soil emissions of carbon dioxide (CO2), nitrous oxide (N2O), and methane (CH4). This regional survey summarizes soil GHG emissions from nine maize production systems evaluating different levels of corn stover removal under conventional or conservation tillage management across the US Corn Belt. Cumulative growing season soil emissions of CO2, N2O, and/ or CH4 were measured for 2–5 years (2008–2012) at these various sites using a standardized static vented chamber technique as part of the USDA-ARS’s Resilient Economic Agricultural Practices (REAP) regional partnership. Cumulative soil GHG emissions during the growing season varied widely across sites, by management, and by year. Overall, corn stover removal decreased soil total CO2 and N2O emissions by -4 and -7 %, respectively, relative to no removal. No management treatments affected soil CH4 fluxes.When aggregated to total GHG emissions (Mg CO2eq ha-1) across all sites and years, corn stover removal decreased growing season soil emissions by -5±1 % (mean±se) and ranged from -36 % to 54 % (n=50). Lower GHG emissions in stover removal treatments were attributed to decreased C and N inputs into soils, as well as possible microclimatic differences associated with changes in soil cover. High levels of spatial and temporal variabilities in direct GHG emissions highlighted the importance of site-specific management and environmental conditions on the dynamics of GHG emissions from agricultural soils.
Resource Title: West Lafayette, IN ACRE Study (INWLACRE) CSV data.
File Name: INWLACRE_csv_data.zip
Resource Description: CSV format data on Experimental Units, Field Sites, Greenhouse Gas Flux, Harvest Fraction, Residue Management, Soil Biology, Soil Chemistry, Soil Physics, Amendments, Growth Stages, Planting, Tillage, Persons, Treatments, Weather Daily, Weather Station.
The Automated Geospatial Watershed Assessment (AGWA) tool is a GIS-based hydrologic modeling tool that uses commonly available GIS data layers to fully parameterize, execute, and spatially visualize results for the RHEM, KINEROS2, KINEROS-OPUS, SWAT2000, and SWAT2005 watershed runoff and erosion models. Accommodating novice to expert GIS users, it is designed to be used by watershed, water resource, land use, and resource managers and scientists investigating the hydrologic impacts of land-cover/land-use change in small watershed to basin-scale studies. AGWA is currently available as AGWA 1.5 for ArcView 3.x, AGWA 2.x for ArcGIS 9.x, and AGWA 3.X for ArcGIS 10.x.
\nPlanning and assessment in land and water resource management are evolving from simple, local-scale problems toward complex, spatially explicit regional ones. Such problems have to be addressed with distributed models that can compute runoff and erosion at different spatial and temporal scales. The extensive data requirements and the difficult task of building input parameter files, however, have long represented an obstacle to the timely and cost-effective use of such complex models by resource managers.
\nThe USDA- ARS Southwest Watershed Research Center, in cooperation with the U.S. EPA Office of Research and Development Landscape Ecology Branch, the University of Arizona, and the University of Wyoming, has developed a GIS tool to facilitate this process. A geographic information system (GIS) provides the framework within which spatially-distributed data are collected and used to prepare model input files and evaluate model results.
\nAGWA uses widely available standardized spatial datasets that can be obtained via the internet. The data are used to develop input parameter files for two watershed runoff and erosion models: KINEROS2 and SWAT.
Resource Title: AGWA - Automated Geospatial Watershed Assessment Tool.
File Name: Web Page, url: https://www.tucson.ars.ag.gov/agwa/
Main tool web site
Agricultural Policy/Environmental eXtender (APEX) has components for routing water, sediment, nutrients, and pesticides across complex landscapes and channel systems to the watershed outlet as well as groundwater and reservoir components. A watershed can be subdivided as much as necessary to assure that each subarea is relatively homogeneous in terms of soil, land use, management, and weather. APEX was constructed to evaluate various land management strategies considering sustainability, erosion (wind, sheet, and channel), economics, water supply and quality, soil quality, plant competition, weather, and pests. The routing of water, sediment, nutrient, and pesticide capabilities are some of the most comprehensive available in current landscape-scale models and can be simulated between subareas and channel systems within the model. APEX can perform long-term continuous simulations for modeling the impacts of different nutrient management practices, tillage operations, conservation practices, alternative cropping systems, and other management practices on surface runoff and losses of sediment, nutrients, and other pollutant indicators.
Resource Title: APEX – Agricultural Policy/Environmental eXtender Model.
File Name: Web Page, url: https://epicapex.tamu.edu/apex/
Web site for the APEX model: describes components, capabilities, examples of applications, and download links for executables, source code, and supporting tools.
APLE is a Microsoft Excel spreadsheet model that runs on an annual time-step and estimates field-scale, sediment bound and dissolved P loss (kg ha−1) in surface runoff for agricultural field. APLE is intended to quantify P loss through process-based equations. It has been tested for its ability to reliably predict P loss in runoff for systems with machine-applied manure and for soil P cycling using data from a wide variety of agricultural fields and regions.
Resource Title: Annual P Loss Estimator (APLE).
File Name: APLE 2.5.2.xlsx
Resource Description: APLE is a fairly simple, user-friendly, Microsoft Excel spreadsheet model that runs on an annual time-step and estimates field-scale, sediment bound and dissolved P loss (kg ha−1) in surface runoff for agricultural field. To download the spreadsheet, fill out the form at https://www.ars.usda.gov/research/software/download/?softwareid=304
Resource Title: Annual Phosphorus Loss Estimator User’s Manual Version 2.4.
File Name: APLEUsersManual24.pdf
Accurate geo-referencing information is a basic requirement for combining remote satellite imagery with other geographic information. To detect changes in time-series satellite images, it is extremely important for the images to be precisely co-registered and orthorectified, so that images acquired from different sensors and dates can be compared directly.
\nPrecise registration relates satellite images to the ground reference based on carefully selected ground control points between the image and corresponding ground objects. Co-registration matches two images based on the tie points in the images. The topographical variations of the earth’s surface and the satellite view zenith angle affect the pixel’s distance projected onto the satellite image. The distortion inherent in the image is determined by topographical elevation. The orthorectification process is used to correct the pixel displacement caused by the topographical variations at the off-nadir viewing and to make the image orthographic, with every pixel in its correct location regardless of elevation and viewing direction.
\nThe automated registration and orthorectification package (AROP) uses precisely registered and orthorectified Landsat data (e.g., GeoCover or recently released free Landsat Level 1T data from the USGS EROS data center) as the base image to co-register, orthorectify and reproject (if needs) the warp images from other data sources, and thus make geo-referenced time-series images consistent in the geographic extent, spatial resolution, and projection. The co-registration, orthorectification and reprojection processes were integrated and thus image is only resampled once. This package has been tested on the Landsat Multi-spectral Scanner (MSS), TM, Enhanced TM Plus (ETM+) and Operational Land Imager (OLI), Terra ASTER, CBERS CCD, IRS-P6 AWiFS, and Sentinel-2 Multispectral Instrument (MSI) data.
\nThe development of the AROP package was supported by the U.S. Geological Survey (USGS) Landsat Science Team project and the NASA EOS project. The package was initially developed at the NASA Goddard Space Flight Center by Dr. Feng Gao (from September 2005 to June 2011). Further improvement and continuous maintenance are now being undertaken in the Hydrology and Remote Sensing Laboratory, Agricultural Research Service, U.S. Department of Agriculture (USDA) by Dr. Feng Gao.
\nResource Title: AROP.
File Name: Web Page, url: https://www.ars.usda.gov/research/software/download/?softwareid=326&modecode=80-42-05-10
download page
NOTE: Due to security issues, the ARSEF database search function is not currently available and we are transitioning to a site on the ARS-AZURE cloud. Please contact the curator (Kathryn.Bushley@usda.gov) if you need information about specific groups or a custom search of the database that can be sent via e-mail. Printed PDF catalogues of all isolates and other information about the collection are available on the ARSEF website at https://www.ars.usda.gov/northeast-area/ithaca-ny/robert-w-holley-center-for-agriculture-health/emerging-pests-and-pathogens-research/docs/mycology/
\nThe Agricultural Research Service Collection of Entomopathogenic Fungal Cultures is the world's largest, most kaleidoscopic, and most comprehensive collection of living cultures of fungi that are pathogenic to or associated with insects, spiders, mites, ticks, and other invertebrates. Some isolates in the collection are not themselves invertebrate pathogens but are critically important for the improvements of taxonomies and systematics for the many diverse groups of fungi represented here. As of July 2016, ARSEF maintains more than 13000 isolates of more than 700 taxa of fungi isolated from 1300 hosts collected at more than 2400 locations on every continent.
\nThe database is searchable by Fungi, Hosts, Locations, Provenance, or Accessions. Results are provided in PDF format.
\nCatalog files are in the Adobe Acrobat (PDF) format and are readable with the Adobe Acrobat Reader.
\nAll catalogs and live searches of isolate data incorporate the most current supportable taxonomies for ARSEF fungi. Significant changes in the nomenclatural rules for many fungi have a large and ongoing impact on the entomopathogens in the order Hypocreales. These changes are discussed the introductory material in the catalogs.
\nIf you are unsure about the most current identifications for isolates, online searches of ARSEF accessions return taxonomic information in the collection database at the moment of the search.
", "title": "ARS Collection of Entomopathogenic Fungal Cultures (ARSEF)", "distribution": [], "license": "https://www.usa.gov/publicdomain/label/1.0/", "bureauCode": [ "005:18" ], "modified": "2023-11-30", "publisher": { "@type": "org:Organization", "name": "Agricultural Research Service" }, "keyword": [ "organisms", "fungi", "cultures", "Insects", "spiders", "mites", "ticks", "taxonomy", "Entomopathogenic Fungi", "Invertebrates", "Online database", "data.gov", "ARS" ] }, { "identifier": "10113/AA6256", "accessLevel": "public", "contactPoint": { "hasEmail": "mailto:Todd.Ward@ars.usda.gov", "fn": "Ward, Todd" }, "programCode": [ "005:040" ], "description": "This database server is supported in fulfilment of the research mission of the Mycotoxin Prevention and Applied Microbiology Research Unit at the National Center for Agricultural Utilization Research in Peoria, Illinois. The linked website provides access to gene sequence databases for various groups of microorganisms, such as Streptomyces species or Aspergillus species and their relatives, that are the product of ARS research programs. The sequence databases are organized in the BIGSdb (Bacterial Isolate Genomic Sequence Database) software package developed by Keith Jolley and Martin Maiden at Oxford University.
\nResource Title: ARS Microbial Genomic Sequence Database Server.
File Name: Web Page, url: http://199.133.98.43
The ARS Water Data Base is a collection of precipitation and streamflow data from small agricultural watersheds in the United States. This national archive of variable time-series readings for precipitation and runoff contains sufficient detail to reconstruct storm hydrographs and hyetographs. There are currently about 14,000 station years of data stored in the data base. Watersheds used as study areas range from 0.2 hectare (0.5 acres) to 12,400 square kilometers (4,786 square miles). Raingage networks range from one station per watershed to over 200 stations. The period of record for individual watersheds vary from 1 to 50 years. Some watersheds have been in continuous operation since the mid 1930's.
Resource Title: FORMAT INFORMATION FOR VARIOUS RECORD TYPES.
File Name: format.txt
Resource Description: Format information identifying fields and their length will be included in this file for all files except those ending with the extension .txt
\nTYPES OF FILES
\nAs indicated in the previous section data has been stored by location number in the form, LXX where XX is the location number. In each subdirectory, there will be various files using the following naming conventions:
\nRunoff data: WSXXX.zip where XXX is the watershed number assigned by the WDC. This number may or may not correspond to a naming convention used in common literature.
\nRainfall data: RGXXXXXX.zip where XXXXXX is the rain gage station identification.
\nMaximum-minimum daily air temperature: MMTXXXXX.zip where XXXXX is the watershed number assigned by the WDC.
\nAncillary text files: NOTXXXXX.txt where XXXXX is the watershed number assigned by the WDC. These files will contain textual information including latitude-longitude, name commonly used in literature, acreage, most commonly-associated rain gage(s) (if known by the WDC), a list of all rain gages on or near the watershed. Land use, topography, and soils as known by the WDC.
\nTopographic maps of the watersheds: MAPXXXXX.zip where XXXXX is the location/watershed number assigned by the WDC. Map files are binary TIF files.
\nNOT ALL FILE TYPES MAY BE AVAILABLE FOR SPECIFIC WATERSHEDS. Data files are still being compiled and translated into a form viable for this archive. Please bear with us while we grow.
Resource Title: Data Inventory - watersheds.
File Name: inventor.txt
Resource Description: Watersheds at which records of runoff were being collected by the Agricultural Research Service.
\nVariables: Study Location & Number of Rain Gages1; Name; Lat.; Long; Number; Pub. Code; Record Began; Land Use2; Area (Acres); Types of Data3
Resource Title: Information about the ARS Water Database.
File Name: README.txt
Resource Title: INDEX TO INFORMATION ON EXPERIMENTAL AGRICULTURAL WATERSHEDS.
File Name: INDEX.TXT
Resource Description: This report includes identification information on all watersheds operated by the ARS. Only some of these are included in the ARS Water Data Base. They are so indicated in the column titled ARS Water Data Base. Other watersheds will not have data available here or through the Water Data Center. This index is particularly important since it relates watershed names with the indexing system used by the Water Data Center. Each location has been assigned a number. The data for that location will be stored in a sub-directory coded as LXX where XX is the location number. The index also indicates the watershed number used by the WDC. Data for a particular watershed will be stored in a compressed file named WSXXXXX.zip where XXXXX is the watershed number assigned by the WDC. Although not included in the index, rain gage information will be stored in compressed files named RGXXXXXX.zip where XXXXXX is a 6-character identification of the rain gage station.
\nThe Index also provides information such as latitude-longitude for each of the watersheds, acreage, the period-of-record for each acreage. Multiple entries for a particular watershed will either indicate that the acreage designated for the watershed changed or there was a break in operations of the watershed.
\nResource Title: ARS Water Database files.
File Name: ars_water.zip
Resource Description: USING THIS SYSTEM
\nBefore downloading huge amounts of data from the ARS Water Data Base, you should first review the text files included in this directory. They include:
\nINDEX OF ARS EXPERIMENTAL WATERSHEDS: index.txt
\nThis report includes identification information on all watersheds operated by the ARS. Only some of these are included in the ARS Water Data Base. They are so indicated in the column titled ARS Water Data Base. Other watersheds will not have data available here or through the Water Data Center. This index is particularly important since it relates watershed names with the indexing system used by the Water Data Center. Each location has been assigned a number. The data for that location will be stored in a sub-directory coded as LXX where XX is the location number. The index also indicates the watershed number used by the WDC. Data for a particular watershed will be stored in a compressed file named WSXXXXX.zip where XXXXX is the watershed number assigned by the WDC. Although not included in the index, rain gage information will be stored in compressed files named RGXXXXXX.zip where XXXXXX is a 6-character identification of the rain gage station.
\nThe Index also provides information such as latitude-longitude for each of the watersheds, acreage, the period-of-record for each acreage. Multiple entries for a particular watershed will either indicate that the acreage designated for the watershed changed or there was a break in operations of the watershed.
\nSTATION TABLE FOR THE ARS WATER DATA BASE: station.txt
\nThis report indicates the period of record for each recording station represented in the ARS Water Data Base. The data for a particular station will be stored in a single compressed file.
\nFORMAT INFORMATION FOR VARIOUS RECORD TYPES: format.txt
\nFormat information identifying fields and their length will be included in this file for all files except those ending with the extension .txt
\nTYPES OF FILES
\nAs indicated in the previous section data has been stored by location number in the form, LXX where XX is the location number. In each subdirectory, there will be various files using the following naming conventions:
\nRunoff data: WSXXX.zip where XXX is the watershed number assigned by the WDC. This number may or may not correspond to a naming convention used in common literature.
\nRainfall data: RGXXXXXX.zip where XXXXXX is the rain gage station identification.
\nMaximum-minimum daily air temperature: MMTXXXXX.zip where XXXXX is the watershed number assigned by the WDC.
\nAncillary text files: NOTXXXXX.txt where XXXXX is the watershed number assigned by the WDC. These files will contain textual information including latitude-longitude, name commonly used in literature, acreage, most commonly-associated rain gage(s) (if known by the WDC), a list of all rain gages on or near the watershed. Land use, topography, and soils as known by the WDC.
\nTopographic maps of the watersheds: MAPXXXXX.zip where XXXXX is the location/watershed number assigned by the WDC. Map files are binary TIF files.
\nNOT ALL FILE TYPES MAY BE AVAILABLE FOR SPECIFIC WATERSHEDS. Data files are still being compiled and translated into a form viable for this archive. Please bear with us while we grow.
Understanding the ion-specific effects of the mineral elements is a central theme of biology because these ions are fundamental to the composition and maintenance of life. However, experiments concerned with determining ion-specific effects are generally performed with salt, as opposed to ion, manipulations. This means that researchers have had to accept a co-variance in the co-ion of the salt used to manipulate the ion of interest. The result is that the effect of a single ion cannot be determined as it is confounded with the potential combined effects of the other ions that are co-varied. Because of this difficulty, the majority of research studies concerned with determining ion-specific effects exhibit ion confounding. The software application ARS-Media utilizes a linear programming optimization algorithm to determine the combination of salts, acids, and bases that satisfies any given target solution of ions. ARS-Media therefore allows researchers to construct experimental designs that use ions, as opposed to salts, as individual factors and, hence, experimentally determine ion-specific effects on biological responses relating to ion type, concentration, and proportion.
\nARS-Media for Excel is an ion solution calculator that uses Excel's linear programming optimization add-in Solver.
\nARS-Media utilizes Excel’s internal linear programming optimization algorithm to determine the combination of salts, acids, and bases that satisfy any given target solution of ions. The spreadsheet is designed for the formulation of nutrient media used in such applications as plant tissue culture, hydroponics, algal culture, fertilizer formulations, microbial culture, and any application that requires the definition of a specific culture media by its ion composition. The spreadsheet is formula-based and uses no macros that can sometimes conflict with institutional IT security systems.
\nWeb download of these resources can be found at:\nARS-Media\nARS-Media for Excel
Resource Title: ARS-Media Ion Solution Calculator.
File Name: ARS-Media Ion Solution Calculator.zip
Resource Description: ARS-Media Ion Solution Calculator.zip
Resource Title: ARS-Media for Excel.
File Name: ARS-Media_Excel_p_5-15-15.xlsx
Resource Title: ARS-Media Excel Instructions.
File Name: ARS-Media_Excel_Instructions_5-15-15[2].docx
Information is needed to mitigate dryland soil greenhouse gas (GHG) emissions by using novel management practices. We evaluated the effects of cropping sequence and N fertilization on dryland soil temperature and water content at the 0- to 15-cm depth and surface CO2, N2O, and CH4 fluxes in a Williams loam in eastern Montana. Treatments were no-tilled continuous malt barley (Hordeum vulgaris L.) (NTCB), no-tilled malt barley-pea (Pisum sativum L.) (NTB-P), and conventional-tilled malt barley-fallow (CTB-F) (control), each with 0 and 80 kg N ha-1. Gas fluxes were measured at 3 to 14 d intervals using static, vented chambers from March to November, 2008 to 2011. Soil temperature varied but water content was greater in CTB-F than in other treatments. The GHG fluxes varied with date of sampling, peaking immediately after substantial precipitation (>15 mm) and N fertilization during increased soil temperature. Total CO2 flux from March to November was greater in NTCB and NTB-P with 80 kg N ha-1 than in other treatments from 2008 to 2010. Total N2O flux was greater in NTCB with 0 kg N ha-1 and in NTB-P with 80 kg N ha-1 than in other treatments in 2008 and 2011. Total CH4 uptake was greater with 80 than with 0 kg N ha-1 in NTCB in 2009 and 2011. Because of intermediate level of CO2 equivalent of GHG emissions and known favorable effect on malt barley yield, NTB-P with 0 kg N ha-1 might mitigate GHG emissions and sustain crop yields compared to other treatments in eastern Montana. For accounting global warming potential of management practices, however, additional information on soil C dynamics and CO2 associated with production inputs and machinery use are needed.
Resource Title: GeoData catalog record.
File Name: Web Page, url: https://geodata.nal.usda.gov/geonetwork/srv/eng/catalog.search#/metadata/60e0612c-8144-46fc-a41a-07fc83b4ad83
An Environmental Component of a \"One Health\" approach, the mission of the Agricultural Antibiotic Resistance (AgAR) project is to
\nANTIBIOTIC DRUGS: Which drugs are the most relevant for each type of ag production system? At what level do excreted drugs continue to provide selective pressure in the environment?
\nRESISTANT BACTERIA: What is the relative contribution of specific bacteria to resistance in human clinical settings? Are some bacteria more likely than others to donate or receive resistance genes? What is the relative contribution of clonal spread of pathogens versus horizontal gene transfer?
\nRESISTANT GENES: How long do specific types of genes persist in agricultural samples? What conditions increase or decrease the likelihood of a successful transfer in manure, soil, water, and air? What is the role of the natural soil \"resistome\"?
\nAgAR Network Goals:
\nThe AgAR network is composed of ARS scientists with an interest in understanding the ecology of antibiotic resistance in soil, water, air, insects, wildlife, and food. The network currently represents 4 national programs at 10 ARS locations across the United States, with over 200 peer-reviewed publications on AgAR topics, authored and co-authored by over 70 current and former ARS employees.
\nActivities:
\nImportance:
\nWhile there is broad agreement the use of antibiotics in food animals has the potential to adversely impact human clinical outcomes, the details of how this happens are unknown, and there is a critical need for information on antibiotic resistance (AR) in agricultural settings (AgAR). U.S. and international health organizations have taken the lead on identifying specific antibiotic drugs and resistant infections that are critical to human health. ARS is uniquely positioned to provide information on the \"farm\" side of the \"farm to fork continuum\". ARS scientists are able to address these questions in a practical way, by combining their experience (over 200 peer-reviewed ARS publications on antibiotic resistance) with their applied understanding of agricultural production systems.
\nORGANIZATION: Scientists work on their own, individual research projects. The AgAR network provides resources to participants to encourage collaboration across program areas and geographical location.
\nMANAGEMENT: The AgAR network is operated using a wiki community approach. All participating scientists are encouraged to contribute to and share in the community resources. Currently, the group resources will be curated by the group coordinator, with input and guidance from a five person advisory panel.
\nRESOURCES: Bibliography of peer-reviewed AgAR papers by ARS authors • AgAR topic reference lists • information on meetings and conferences • \"AR_in_environment\" listserve • Community webinars
\nResource Title: AgAR Data Search.
File Name: Web Page, url: https://agcros-usdaars.opendata.arcgis.com/pages/ag-ar
The Agricultural Collaborative Research Outcomes System (AgCROS) is a growing “network of networks” that presently consists of multiple agricultural data networks: Nutrient Uptake and Outcome Network (NUOnet), the Greenhouse gas Reduction through Agricultural Carbon Enhancement Network (GRACEnet), Resilient Economic Agricultural Practices (REAP), Dairy Agriculture for People and the Planet (DAPP; Dairy Grand Challenge), Soil Health Assessment Network (SHAnet), Agricultural Antibiotic Resistance (AgAR), and the Long-Term Agroecosystem Research (LTAR) Network. By integrating these diverse database networks, AgCROS facilitates the flow of information and increases the cooperation among researchers participating in these networks.
Resource Title: Agricultural Collaborative Research Outcomes System.
File Name: Web Page, url: https://agcros-usdaars.opendata.arcgis.com/
Spatial data on soils, land use, and topography, combined with knowledge of conservation effectiveness can be used to identify alternatives to reduce nutrient discharge from small watersheds. This database was developed to be used in conjunction with the Agricultural Conservation Planning Framework Toolkit.
\nData comprise soil survey information and land use. Soil characterization data were extracted from the Natural Resources Conservation Service (NRCS) Web Soil Survey (Soil Survey Staff, 2013). Land use coverages were developed to represent agricultural fields and the types and rotations of agricultural crops and other land cover types. Land use boundaries were produced by editing a publicly available USDA field boundaries dataset (pre-2008), with all ownership and county-level attributes removed. To ensure these field polygons were consistent with recent land use, the 2009 Cropland Data Layer (USDA-NASS, 2013) was examined for all fields larger than 16 ha. For those fields with multiple cover types, 2009 National Agricultural Imagery Program (NAIP) aerial photography was used as a basis to manually edit field boundaries. A field was considered to have multiple cover types and was edited if the dominant cover occupied <75% of the field, as indicated by the 2009 Cropland Data Layer. Updated field boundaries were then overlaid with data from USDA-National Agricultural Statistics Service (2013) Cropland Data Layer for 2000 – 2014, and each field was classified to represent crop rotations and land cover using the most recent six-year (2009-2014) sequence of land cover. Six-year land-cover strings (e.g., corn-corn-soybean-corn-soybean-corn) generated for each field were classified to represent major crop rotations, which were dominantly comprised of corn (Zea mays L.) and soybean (Glycine max (L.) Merr) annual row crops.
\nThe database does not include high-resolution digital elevation models (DEMs) derived from LiDAR (light detection and ranging) survey data, although these are needed by the Agricultural Conservation Planning Framework Toolkit and must be obtained independently.
\nDatabase is scheduled to become available on October 1, 2015.
\nResource Title: Land Use and Soils data, viewing and downloading page.
File Name: Web Page, url: https://www.nrrig.mwa.ars.usda.gov/st40_huc/dwnldACPF.html
Recent land use, field boundary, and soil survey information for individual HUC12 watersheds in Iowa, Illinois, and southern Minnesota. With this land use viewer web page, users may navigate to individual HUC12 watersheds, view land-use maps, and download land use and soils data that can be directly used as input data for the ACPF toolbox. Before developing information on conservation priorities and opportunities using the ACPF toolbox, users will need to obtain elevation data for their watershed, which is usually available from your state government.
Spatial data on soils, land use, and topography combined with knowledge of conservation effectiveness can be used to reduce nutrient discharge from small watersheds.
\nThe Agricultural Conservation Planning Framework (ACPF) Toolbox software includes tools to process the LiDAR-based digital elevation models for hydrologic analysis, which then allows a series of prioritization, riparian classification, and conservation-practice placement tools to be used. These toolsets identify agricultural fields most prone to deliver runoff directly to streams, map and classify riparian zones to inform whole-watershed riparian corridor management, and estimate the extent of tile drainage in the watershed. The software maps out suites of locations appropriate to install each of several types of conservation practices. These practice-placement opportunities are mapped for practices including controlled drainage, grassed waterways, water and sediment control basins, and nutrient removal wetlands. Rather than making any recommendations, ACPF provides an inventory of watershed assessment data and conservation placement opportunities across a watershed, in order to inform local watershed planning.
\nACPF software runs as an extension to ArcGIS software (ver 10.2 or higher) and requires the customized ACPF spatial databases that include agricultural field boundaries and land uses, key soil survey information, and LiDAR based elevation data that are all tied to the Hydrologic Unit Code (HUC) 12 watershed scale.
\nResource Title: ACPF Watershed Planning Tool Informational Web Site .
File Name: Web Page, url: http://northcentralwater.org/acpf/
This related resource, called \"A Framework to Facilitate Conservation Planning in Agricultural Watersheds Using Precision GIS-based Technologies,\" is a web page describing the watershed planning framework. Conceptually, our framework is based on a “Conservation Pyramid” (Figure 1) that emphasizes soil conservation as the foundation to agricultural watershed management. Our planning framework (Figure 2) identifies locations where specific landscape attributes are favorable for installation of each type of practice, and includes methods to prioritize locations according to susceptibility to runoff and erosion losses.
The Agricultural Land Management Alternative with Numerical Assessment Criteria (ALMANAC) model simulates crop growth, competition, light interception by leaves, biomass accumulation, partitioning of biomass into grain, water use, nutrient uptake, and growth constraints such as water, temperature, and nutrient stress. Plant development is temperature driven, with duration of growth stages dependent on degree days. Each plant species has a defined base temperature and optimum temperature. The simulation of competition for light is based on Beer's law, allowing a different extinction coefficient (k) for each species. Light is partitioned between species based on k-values, leaf area index (LAI) and plant heights. LAI, light interception with Beer's law, and potential daily biomass increase with a species-specific value of radiation use efficiency (RUE). The model simulates competition for water and nutrients based on each species' current rooting zone and demand by each species. The daily increases in and biomass are reduced when plant-available water in the current rooting depth is insufficient to meet potential evapotranspiration. Total biomass is simulated with radiation use efficiency and grain yield with a harvest index approach, sensitive to water stress. Grain yield is simulated based on harvest index (HI), which is the grain yield as a fraction of the total aboveground dry matter at maturity.
\nSimulations using the BatchRun section of ALMANAC will create outputs for more than one scenario at a time. BatchRuns allow ALMANAC users to perform many runs at a time. For an example of BatchRun in use, see Dr. Behrman's 'Spatial forecasting of switchgrass productivity under current and future climate change scenarios' with simulations across the eastern half of the United States.
\nSoil, weather, tillage, and crop parameter are essential inputs for the model. Users typically access the extensive NRCS soils data, and readily available daily weather data, such as NOAA, for inputs. See HowtoSoils and NOAAfiles for downloading and ALMANAC formatting instructions. Weather inputs require values of daily maximum and minimum temperatures, rainfall, and solar radiation. ALMANAC contains a weather generator subroutine, based on concepts of the WGEN model. The generator is used when weather is not available, or the user does not wish to use or format existing data. Users can make runs with several years of weather in a few minutes, enabling them to efficiently simulate an extensive range of management, crop, and soil scenarios. Tillage requires users to select or create management data. ALMANAC offers a wide range of tillage operations including drainage, irrigation, fertilization, furrow diking, and liming. We recommend obtaining field data to gain parameters for new plants, or yield data of established plants to calibrate and validate simulations. Parameters for describing plant processes are easy to derive for a plant species or cultivar (see Sampling Protocol Standard with Photos). After parameters for describing plant processes are derived for a plant species or cultivar they are easily transfer among the models here in Temple (EPIC, APEX, SWAT).
\nALMANAC is an important decision making tool with proven parameters and simulations that have been applied to many crop prediction and natural resource problems. ALMANAC can assist with future crop predictions such as how much biomass will be produced, what plant will be successful where, when is the optimal time to harvest, the effect of management on competing species, and management adjustment effects on land. ALMANAC is also used in natural resources regarding climate change, soil erosion, risk assessment, management decisions, plant competition, conservation effects and climate change on soil, water, competition. With this model users can determine how a plant will yield across time, how nutrients and water pass through the system, and how plants will be affected by management changes. We input real world field data into plant parameters used for the model, this enables our simulations to be more precise. The model has been used in nationwide assessments, ecosystem studies, biofuels, and for individual farmer fields.
\nALMANAC has also been developed for Mexico. The ALMANACMEX model is an output of research collaboration between the United States Department of Agriculture - Agricultural Research Service (USDA-ARS) and the Mexican National Institute of Agricultural, Forestry and Livestock Research (INIFAP).
Resource Title: Website Pointer to ALMANAC Simulation Model.
File Name: Web Page, url: https://www.ars.usda.gov/plains-area/temple-tx/grassland-soil-and-water-research-laboratory/docs/193226/
Includes description of the ALMANAC model and usage, downloads, documentation, support contact, and related publications.
Four-year rainfed corn field experiment in Ames, Iowa. This dataset is part of an Agricultural Model Intercomparison and Improvement Project (AgMIP) data node maintained at National Agricultural Library for USDA-AgMIP data.
Resource Title: Corn Dataset.
File Name: agmip_download.zip
Resource Description: Direct download, zipped aceb data format file at https://api.agmip.org/cropsitedb/2/dataset/53616eb8-df80-45dd-9c45-d7d81b8e1181
The ARS Culture Collection is one of the largest public collections of microorganisms in the world, containing approximately 93,000 strains of bacteria and fungi. The collection is split into subcollections of molds, prokaryotes, and yeasts. In addition, the online catalog is searchable by genus, species, subvar type, and subspecies.
\nThe collection is housed within the Mycotoxin Prevention and Applied Microbiology Research Unit at the National Center for Agricultural Utilization Research in Peoria, Illinois. The scientists and staff of the ARS Culture Collection conduct and facilitate microbiological research that advances agricultural production, food safety, public health, and economic development. These goals are pursued through in-house research that improves understanding and utilization of microbiological diversity and through efforts to enhance the value and accessibility of microbial accessions in the Agricultural Research Service Culture Collection.
\nResource Title: The ARS Culture (NRRL) Collection Online Catalog.
File Name: Web Page, url: https://nrrl.ncaur.usda.gov/cgi-bin/usda/index.html
Online catalog and database server for the ARS Culture Collection (NRRL).
This model was originally trained for use in a recommendation system to the Ag Data Commons that will automatically link viewers of one dataset to other directly relevant datasets and research papers that they may be interested in. It was also used to determine the similarities and differences between projects within ARS’ National Programs and create a visualization layer to allow leaders to explore and manage their programs easily.
\nThis model was generated using the Word2Vec model, starting with a set of word vectors trained on Google News articles, and further training it on the titles+abstracts from PubAg and the titles+descriptions from Ag Data Commons. This model was trained using a vector length of 300 and the Continuous Bag of Words version of the algorithm with negative sampling.
\nThis word vector model could be used for any Natural-Language Processing applications involving text with a large amount of agricultural research vocabulary.
Resource Title: Agricultural Word Vectors.
File Name: AgWordVectors-300.zip
Resource Description: Word vectors trained on the full titles/abstracts in PubAg and titles/abstracts in Ag Data Commons. (Part A)
Resource Title: Agricultural Word Vectors Trainables.
File Name: AgWordVectors-300.model.trainables.syn1neg.zip
Resource Description: Word vectors trained on the full titles/abstracts in PubAg and titles/abstracts in Ag Data Commons. (Part B)
Resource Title: Agricultural Word Vector Model.
File Name: AgWordVectors-300.model.wv_.vectors.zip
Resource Description: Word vectors trained on the full titles/abstracts in PubAg and titles/abstracts in Ag Data Commons. (Part C)
Improving the quality of water discharged from agricultural watersheds requires comprehensive and adaptive approaches for planning and implementing conservation practices. These measures will need to consider landscape hydrology, distributions of soil types, land cover, and crop distributions in an integrated manner. The two most consistent challenges to these efforts will be consistency and reliability of data, and the capacity to translate conservation planning from watershed to farm and field scales. The translation of scale is required because, while conservation practices can be planned based on a watershed scale framework, they must be implemented by landowners in specific fields and riparian sites that are under private ownership. To support these goals, it has been necessary to develop planning approaches, high-resolution spatial datasets, and conservation practice assessment tools that will allow the agricultural and conservation communities to characterize and mitigate these challenges. The field boundary dataset represents a spatial framework for assembling and maintaining geospatial data to support conservation planning at the scale where conservation practices are implemented.
\nThis field boundaries dataset has been assembled to support field-scale agricultural conservation planning using the USDA/ARS Agricultural Conservation Planning Framework (ACPF). The original data used to create this database are the pre-2008 Farm Bill FSA common land unit (CLU) datasets. A portion of metadata found herein pertains to the USDA FSA CLU. The remaining information has been developed to reflect the repurposing of the data in its aggregated form. It is important to note that all USDA programmatic and ownership information that was associated with the original data have been removed. Beyond that, these data has been extensively edited to reflect crop-specific land use consistent with 2009 land cover as derived from 2009 NASS Crop Data Layer datasets and 2009 aerial photography, and no longer reflects discrete ownership patterns.
\nThe ACPF field boundaries feature class incorporates two additional resources that form the Illinois ACPF Land Use database. The Illinois ACPF Fields Crop History table holds the dominant land use class, derived from the NASS CDL, for individual fields from 2010 to 2020. The Illinois ACPF Land Use table hold summary land use information for individual fields for 2015 to 2020 including an assigned General Land Use (GenLU) that represent the cropping system over that period. In lieu of a data dictionary for these resources, each dataset has a FGDC-compliant metadata file using the North American ISO 19115-2003 profile in .xml format.
\nFor more information about this dataset contact David E. James at davide.james@usda.gov or dejames@iastate.edu
Resource Title: Illinois ACPF Crop History 2010-2020.
File Name: IL_ACPFfields_CropHistory2010_2020.pdf
Resource Description: Illinois ACPF Crop History 2010-2020
Resource Software Recommended: Adobe Acrobat,url: www.adobe.com
Resource Title: Illinois ACPF Land Use 2015-2020.
File Name: IL_ACPFfields_LandUse2015_2020.pdf
Resource Description: Illinois ACPF Land Use 2015-2020
Resource Software Recommended: Adobe Acrobat,url: www.esri.com
Resource Title: Illinois Field Boundaries 2020.
File Name: IL_ACPFfields2020.pdf
Resource Description: Illinois Field Boundaries 2020 metadata
Resource Software Recommended: Adobe Acrobat,url: www.adobe.com
Resource Title: Agricultural land use by field: Illinois 2010-2020.
File Name: Illinois_ACPFfields2020.zip
Resource Description: This field boundaries dataset has been assembled to support field-scale agricultural conservation planning using the USDA/ARS Agricultural Conservation Planning Framework (ACPF).
Resource Software Recommended: ESRI's ArcGIS,url: www.esri.com
Improving the quality of water discharged from agricultural watersheds requires comprehensive and adaptive approaches for planning and implementing conservation practices. These measures will need to consider landscape hydrology, distributions of soil types, land cover, and crop distributions in an integrated manner. The two most consistent challenges to these efforts will be consistency and reliability of data, and the capacity to translate conservation planning from watershed to farm and field scales. The translation of scale is required because, while conservation practices can be planned based on a watershed scale framework, they must be implemented by landowners in specific fields and riparian sites that are under private ownership. To support these goals, it has been necessary to develop planning approaches, high-resolution spatial datasets, and conservation practice assessment tools that will allow the agricultural and conservation communities to characterize and mitigate these challenges. The field boundary dataset represents a spatial framework for assembling and maintaining geospatial data to support conservation planning at the scale where conservation practices are implemented.
\nThis field boundaries dataset has been assembled to support field-scale agricultural conservation planning using the USDA/ARS Agricultural Conservation Planning Framework (ACPF). The original data used to create this database are the pre-2008 Farm Bill FSA common land unit (CLU) datasets. A portion of metadata found herein pertains to the USDA FSA CLU. The remaining information has been developed to reflect the repurposing of the data in its aggregated form. It is important to note that all USDA programmatic and ownership information that was associated with the original data have been removed. Beyond that, these data has been extensively edited to reflect crop-specific land use consistent with 2009 land cover as derived from 2009 NASS Crop Data Layer datasets and 2009 aerial photography, and no longer reflects discrete ownership patterns.
Resource Title: Agricultural land use by field: Iowa 2010-2019.
File Name: IA_ACPFfields2019.zip
Resource Description: This field boundaries dataset has been assembled to support field-scale agricultural conservation planning using the USDA/ARS Agricultural Conservation Planning Framework (ACPF).
Resource Software Recommended: ArcGIS,url: https://www.esri.com
Resource Title: Iowa ACPF Crop History 2010-2019.
File Name: IA_ACPFfields_CropHistory2010_2019.pdf
Resource Description: Iowa ACPF Crop History 2010-2019
Resource Title: Iowa ACPF Land Use 2014-2019.
File Name: IA_ACPFfields_LandUse2014_2019.pdf
Resource Description: Iowa ACPF Land Use 2014-2019
Resource Title: Iowa Field Boundaries 2019.
File Name: IA_ACPF_fieldBoundaries_2019.pdf
Resource Description: Iowa Field Boundaries 2019
Improving the quality of water discharged from agricultural watersheds requires comprehensive and adaptive approaches for planning and implementing conservation practices. These measures will need to consider landscape hydrology, distributions of soil types, land cover, and crop distributions in an integrated manner. The two most consistent challenges to these efforts will be consistency and reliability of data, and the capacity to translate conservation planning from watershed to farm and field scales. The translation of scale is required because, while conservation practices can be planned based on a watershed scale framework, they must be implemented by landowners in specific fields and riparian sites that are under private ownership. To support these goals, it has been necessary to develop planning approaches, high-resolution spatial datasets, and conservation practice assessment tools that will allow the agricultural and conservation communities to characterize and mitigate these challenges. The field boundary dataset represents a spatial framework for assembling and maintaining geospatial data to support conservation planning at the scale where conservation practices are implemented.
\nThis field boundaries dataset has been assembled to support field-scale agricultural conservation planning using the USDA/ARS Agricultural Conservation Planning Framework (ACPF). The original data used to create this database are the pre-2008 Farm Bill FSA common land unit (CLU) datasets. A portion of metadata found herein pertains to the USDA FSA CLU. The remaining information has been developed to reflect the repurposing of the data in its aggregated form. It is important to note that all USDA programmatic and ownership information that was associated with the original data have been removed. Beyond that, these data has been extensively edited to reflect crop-specific land use consistent with 2015 land cover as derived from 2015 NASS Crop Data Layer datasets and 2015 aerial photography, and no longer reflects discrete ownership patterns.
Resource Title: Agricultural land use by field: Minnesota 2010-2019.
File Name: MN_ACPFfields2019.zip
Resource Description: This field boundaries dataset has been assembled to support field-scale agricultural conservation planning using the USDA/ARS Agricultural Conservation Planning Framework (ACPF).
Resource Software Recommended: ArcGIS,url: https://www.esri.com/en-us/home
Resource Title: Minnesota Field Boundaries 2019.
File Name: MN_ACPF_fieldBoundaries_2019.pdf
Resource Description: Minnesota Field Boundaries 2019
Resource Title: Minnesota ACPF Crop History 2010-2019.
File Name: MN_ACPFfields_CropHistory2010_2019.pdf
Resource Description: Minnesota ACPF Crop History 2010-2019
Resource Title: Minnesota ACPF Land Use 2014-2019.
File Name: MN_ACPFfields_LandUse2014_2019.pdf
Resource Description: Minnesota ACPF Land Use 2014-2019
Improving the quality of water discharged from agricultural watersheds requires comprehensive and adaptive approaches for planning and implementing conservation practices. These measures will need to consider landscape hydrology, distributions of soil types, land cover, and crop distributions in an integrated manner. The two most consistent challenges to these efforts will be consistency and reliability of data, and the capacity to translate conservation planning from watershed to farm and field scales. The translation of scale is required because, while conservation practices can be planned based on a watershed scale framework, they must be implemented by landowners in specific fields and riparian sites that are under private ownership. To support these goals, it has been necessary to develop planning approaches, high-resolution spatial datasets, and conservation practice assessment tools that will allow the agricultural and conservation communities to characterize and mitigate these challenges. The field boundary dataset represents a spatial framework for assembling and maintaining geospatial data to support conservation planning at the scale where conservation practices are implemented.
\nThis field boundaries dataset has been assembled to support field-scale agricultural conservation planning using the USDA/ARS Agricultural Conservation Planning Framework (ACPF). The original data used to create this database are the pre-2008 Farm Bill FSA common land unit (CLU) datasets. A portion of metadata found herein pertains to the USDA FSA CLU. The remaining information has been developed to reflect the repurposing of the data in its aggregated form. It is important to note that all USDA programmatic and ownership information that was associated with the original data have been removed. Beyond that, these data has been extensively edited to reflect crop-specific land use consistent with crop-specific land cover as derived from 2014 and 2016 NASS Crop Data Layer datasets and 2014 and 2016 aerial photography, and no longer reflects discrete ownership patterns. For this data set, individual field boundaries were edited under two different projects and, as a result, the year of editing varies. Each record has a field, updateYr, that reflect the year of editing.
\nThe ACPF field boundaries feature class incorporates two additional resources that form the Nebraska ACPF Land Use database. The Nebraska ACPF Fields Crop History table holds the dominant land use class, derived from the NASS CDL, for individual fields from 2010 to 2020. The Nebraska ACPF Land Use table hold summary land use information for individual fields for 2015 to 2020 including an assigned General Land Use (GenLU) that represent the cropping system over that period. In lieu of a data dictionary for these resources, each dataset has a FGDC-compliant metadata file using the North American ISO 19115-2003 profile in .xml format.
\nFor more information about this dataset contact David E. James at davide.james@usda.gov or dejames@iastate.edu
Resource Title: Nebraska ACPF Crop History 2010-2020.
File Name: NE_ACPFfields_CropHistory2010_2020.pdf
Resource Description: Nebraska ACPF Crop History 2010-2020
Resource Software Recommended: Adobe Acrobat,url: www.adobe.com
Resource Title: Nebraska ACPF Land Use 2015-2020.
File Name: NE_ACPFfields_LandUse2015_2020.pdf
Resource Description: Nebraska ACPF Land Use 2015-2020
Resource Software Recommended: Adobe Acrobat,url: www.adobe.com
Resource Title: Agricultural land use by field: Nebraska 2010-2020.
File Name: Nebraska_ACPFfields2020.zip
Resource Description: This field boundaries dataset has been assembled to support field-scale agricultural conservation planning using the USDA/ARS Agricultural Conservation Planning Framework (ACPF).
Resource Software Recommended: ESRI's ArcGIS,url: www.esri.com
Resource Title: Nebraska Field Boundaries 2020.
File Name: NE_ACPFfields2020.pdf
Resource Description: Nebraska Field Boundaries 2020 metadata
Resource Software Recommended: Adobe Acrobat,url: www.adobe.com
Improving the quality of water discharged from agricultural watersheds requires comprehensive and adaptive approaches for planning and implementing conservation practices. These measures will need to consider landscape hydrology, distributions of soil types, land cover, and crop distributions in an integrated manner. The two most consistent challenges to these efforts will be consistency and reliability of data, and the capacity to translate conservation planning from watershed to farm and field scales. The translation of scale is required because, while conservation practices can be planned based on a watershed scale framework, they must be implemented by landowners in specific fields and riparian sites that are under private ownership. To support these goals, it has been necessary to develop planning approaches, high-resolution spatial datasets, and conservation practice assessment tools that will allow the agricultural and conservation communities to characterize and mitigate these challenges. The field boundary dataset represents a spatial framework for assembling and maintaining geospatial data to support conservation planning at the scale where conservation practices are implemented.
\nThis field boundaries dataset has been assembled to support field-scale agricultural conservation planning using the USDA/ARS Agricultural Conservation Planning Framework (ACPF). The original data used to create this database are the pre-2008 Farm Bill FSA common land unit (CLU) datasets. A portion of metadata found herein pertains to the USDA FSA CLU. The remaining information has been developed to reflect the repurposing of the data in its aggregated form. It is important to note that all USDA programmatic and ownership information that was associated with the original data have been removed. Beyond that, these data has been extensively edited to reflect crop-specific land use consistent with 2009 land cover as derived from 2009 NASS Crop Data Layer datasets and 2009 aerial photography, and no longer reflects discrete ownership patterns.
\nThe ACPF field boundaries feature class incorporates two additional resources that form the Upper Mississippi River Basin (UMRB) ACPF Land Use database. The UMRB ACPF Fields Crop History table holds the dominant land use class, derived from the NASS CDL, for individual fields from 2010 to 2020. The UMRB ACPF Land Use table hold summary land use information for individual fields for 2015 to 2020 including an assigned General Land Use (GenLU) that represent the cropping system over that period. In lieu of a data dictionary for these resources, each dataset has a FGDC-compliant metadata file using the North American ISO 19115-2003 profile in .xml format.
\nFor more information about this dataset contact David E. James at davide.james@usda.gov or dejames@iastate.edu
Resource Title: Agricultural land use by field: Upper Mississippi River Basin 2010-2020.
File Name: UMRB_ACPFfields2020.zip
Resource Description: This field boundaries dataset has been assembled to support field-scale agricultural conservation planning using the USDA/ARS Agricultural Conservation Planning Framework (ACPF).
Resource Software Recommended: ESRI's ArcGIS,url: www.esri.com
Resource Title: Upper Mississippi River Basin Field Boundaries 2020.
File Name: UMRB_ACPFfields2020.pdf
Resource Description: UMRB Field Boundaries 2020 feature class metadata
Resource Software Recommended: Adobe Acrobat,url: www.adobe.com
Resource Title: Upper Mississippi River Basin ACPF Crop History 2010-2020.
File Name: UMRB_ACPFfields_CropHistory2010_2020.pdf
Resource Description: Upper Mississippi River Basin ACPF Crop History table 2010-2020 metadata
Resource Software Recommended: Adobe Acrobat,url: www.adobe.com
Resource Title: Upper Mississippi River Basin ACPF Land Use 2015-2020.
File Name: UMRB_ACPFfields_LandUse2015_2020.pdf
Resource Description: Upper Mississippi River Basin ACPF Land Use table 2015-2020 metadata
Resource Software Recommended: Adobe Acrobat,url: www.adobe.com
Improving the quality of water discharged from agricultural watersheds requires comprehensive and adaptive approaches for planning and implementing conservation practices. These measures will need to consider landscape hydrology, distributions of soil types, land cover, and crop distributions in an integrated manner. The two most consistent challenges to these efforts will be consistency and reliability of data, and the capacity to translate conservation planning from watershed to farm and field scales. The translation of scale is required because, while conservation practices can be planned based on a watershed scale framework, they must be implemented by landowners in specific fields and riparian sites that are under private ownership. To support these goals, it has been necessary to develop planning approaches, high-resolution spatial datasets, and conservation practice assessment tools that will allow the agricultural and conservation communities to characterize and mitigate these challenges. The field boundary dataset represents a spatial framework for assembling and maintaining geospatial data to support conservation planning at the scale where conservation practices are implemented.
\nThis field boundaries dataset has been assembled to support field-scale agricultural conservation planning using the USDA/ARS Agricultural Conservation Planning Framework (ACPF). The original data used to create this database are the pre-2008 Farm Bill FSA common land unit (CLU) datasets. A portion of metadata found herein pertains to the USDA FSA CLU. The remaining information has been developed to reflect the repurposing of the data in its aggregated form. It is important to note that all USDA programmatic and ownership information that was associated with the original data have been removed. Beyond that, these data has been extensively edited to reflect crop-specific land use and no longer reflects discrete ownership patterns.
Resource Title: Wisconsin Field Boundaries 2019.
File Name: WI_ACPF_fieldBoundaries_2019.pdf
Resource Description: Wisconsin Field Boundaries 2019
Resource Title: Wisconsin ACPF Crop History 2010-2019.
File Name: WI_ACPFfields_CropHistory2010_2019.pdf
Resource Description: Wisconsin ACPF Crop History 2010-2019
Resource Title: Wisconsin ACPF Land Use 2014-2019.
File Name: WI_ACPFfields_LandUse2014_2019.pdf
Resource Description: Wisconsin ACPF Land Use 2014-2019
Resource Title: Agricultural land use by field: Wisconsin 2010-2019.
File Name: WI_ACPFfields2019.zip
Resource Description: This field boundaries dataset has been assembled to support field-scale agricultural conservation planning using the USDA/ARS Agricultural Conservation Planning Framework (ACPF).
Resource Software Recommended: ArcGIS,url: https://www.esri.com
The AgroEcosystem Performance Assessment Tool is a computer program used to evaluate the agronomic and environmental performance of management practices in long-term agroecosystem experiments. The program employs a simple scoring method to quantify the performance of management practices using indicators grouped within agroecosystem functions. Management practices are evaluated on a relative basis using the method, thereby internalizing comparisons. Because of its specialized application to long-term experiments, the program is designed primarily for use by agricultural researchers.
Resource Title: AgroEcosystem Performance Assessment Tool download page.
File Name: Web Page, url: https://www.ars.usda.gov/research/software/download/?softwareid=365&modecode=30-64-05-00
https://www.reacchpna.org/sites/default/files/AR3_1.2.pdf\n\nPixel classification:\nClassification, Stable, Dynamic, Unstable\nUrban, 1, 101, 202 \nRangeland, 3, 103, 203\nForest, 4, 104, 204\nWater, 5, 105, 205\nWetlands, 6, 106, 206\nBarren, 7, 107, 207\nWilderness, 9, 109, 209\nAnnual, 11, 111, 211\nTransition, 12, 112, 212\nGrain-fallow, 13, 113, 213\nIrrigated, 14, 114, 214\nOrchard, 15, 115, 215\nAgriculture, 50, 150, 250\nWater and Other, 51, 151, 251
Resource Title: GeoData catalog record.
File Name: Web Page, url: https://geodata.nal.usda.gov/geonetwork/srv/eng/catalog.search#/metadata/83415cb1-f993-4f61-ac85-e0efcd360bb1
This dataset consists of agronomic calendars for each growing season (year) when upland cotton [Gossypium hirsutum (L.)] was grown for fiber and seed at the USDA-ARS Conservation and Production Laboratory (CPRL), Soil and Water Management Research Unit (SWMRU) research weather station, Bushland, Texas (Lat. 35.186714°, Long. -102.094189°, elevation 1170 m above MSL). In 2000, 2001, 2008, 2020, and 2021, cotton was grown on four large, precision weighing lysimeters, each in the center of a 4.44 ha square field. In 2002, 2010, and 2012, cotton was grown on two large, precision weighing lysimeters and their surrounding 4.44 ha square fields. In 2003 and 2004, cotton was grown on only one large weighing lysimeter in rotation with sorghum. The four fields were contiguous. The fields were designated northeast (NE), southeast (SE), northwest (NW), and southwest (SW), and were themselves arranged in a larger square with the fields in four adjacent quadrants of the larger square. Irrigation was by linear move sprinkler system in from 2000 through 2012. In 2020 and 2021, the NE and SE fields were irrigated using subsurface drip irrigation (SDI), while the NW and SW fields were irrigated using a linear move system. Cotton was sometimes grown as a dryland crop, sometimes as a fully irrigated crop, and sometimes as a deficit irrigated crop. Irrigations designated as full were managed to replenish soil water used by the crop on a weekly or more frequent basis as determined by soil profile water content readings made with a neutron probe to 2.4-m depth in the field. Irrigations designated as deficit typically involved full irrigation to establish the crop. A crop calendar for each season lists by date the pertinent agronomic and maintenance operations (e.g., planting, thinning, fertilization, pesticide application, lysimeter maintenance, harvest). For each season there is one crop calendar for each two lysimeters (NE and SE, and/or NW and SW).\nThese datasets originate from research aimed at determining crop water use (ET), crop coefficients for use in ET-based irrigation scheduling based on a reference ET, crop growth, yield, harvest index, and crop water productivity as affected by irrigation method, timing, amount (full or some degree of deficit), agronomic practices, cultivar, and weather. Prior publications have focused on ET, crop coefficients, and crop water productivity. Crop coefficients have been used by ET networks. The data have utility for testing simulation models of crop ET, growth, and yield and have been used for testing, and calibrating models of ET that use satellite and/or weather data.
\nSee the README for descriptions of each data file.
", "title": "Agronomic Calendars for the Bushland, Texas Cotton Datasets", "distribution": [ { "@type": "dcat:Distribution", "downloadURL": "https://ndownloader.figshare.com/files/44540243", "format": "xlsx", "mediaType": "application/vnd.openxmlformats-officedocument.spreadsheetml.sheet", "title": "2000 East Cotton Calendar_0.xlsx" }, { "@type": "dcat:Distribution", "downloadURL": "https://ndownloader.figshare.com/files/44540246", "format": "xlsx", "mediaType": "application/vnd.openxmlformats-officedocument.spreadsheetml.sheet", "title": "2000 West Cotton Calendar_0.xlsx" }, { "@type": "dcat:Distribution", "downloadURL": "https://ndownloader.figshare.com/files/44540249", "format": "xlsx", "mediaType": "application/vnd.openxmlformats-officedocument.spreadsheetml.sheet", "title": "2001 East Cotton Calendar_0.xlsx" }, { "@type": "dcat:Distribution", "downloadURL": "https://ndownloader.figshare.com/files/44540252", "format": "xlsx", "mediaType": "application/vnd.openxmlformats-officedocument.spreadsheetml.sheet", "title": "2001 West Cotton Calendar.xlsx" }, { "@type": "dcat:Distribution", "downloadURL": "https://ndownloader.figshare.com/files/44540255", "format": "xlsx", "mediaType": "application/vnd.openxmlformats-officedocument.spreadsheetml.sheet", "title": "2002 East Cotton Calendar.xlsx" }, { "@type": "dcat:Distribution", "downloadURL": "https://ndownloader.figshare.com/files/44540264", "format": "xlsx", "mediaType": "application/vnd.openxmlformats-officedocument.spreadsheetml.sheet", "title": "2003 West Sorg.-Cot. Calendar_0.xlsx" }, { "@type": "dcat:Distribution", "downloadURL": "https://ndownloader.figshare.com/files/44540267", "format": "xlsx", "mediaType": "application/vnd.openxmlformats-officedocument.spreadsheetml.sheet", "title": "2004 West Cot.-Sorg. Calendar_0.xlsx" }, { "@type": "dcat:Distribution", "downloadURL": "https://ndownloader.figshare.com/files/44540270", "format": "xlsx", "mediaType": "application/vnd.openxmlformats-officedocument.spreadsheetml.sheet", "title": "2008 East Cotton Calendar_0.xlsx" }, { "@type": "dcat:Distribution", "downloadURL": "https://ndownloader.figshare.com/files/44540279", "format": "xlsx", "mediaType": "application/vnd.openxmlformats-officedocument.spreadsheetml.sheet", "title": "2008 West Cotton Calendar_0.xlsx" }, { "@type": "dcat:Distribution", "downloadURL": "https://ndownloader.figshare.com/files/44540282", "format": "xlsx", "mediaType": "application/vnd.openxmlformats-officedocument.spreadsheetml.sheet", "title": "2010 East Cotton Calendar_0.xlsx" }, { "@type": "dcat:Distribution", "downloadURL": "https://ndownloader.figshare.com/files/44540294", "format": "xlsx", "mediaType": "application/vnd.openxmlformats-officedocument.spreadsheetml.sheet", "title": "2012 West Cotton Calendar_0.xlsx" }, { "@type": "dcat:Distribution", "downloadURL": "https://ndownloader.figshare.com/files/44540297", "format": "xlsx", "mediaType": "application/vnd.openxmlformats-officedocument.spreadsheetml.sheet", "title": "2020 East Cotton Calendar_0.xlsx" }, { "@type": "dcat:Distribution", "downloadURL": "https://ndownloader.figshare.com/files/44540303", "format": "xlsx", "mediaType": "application/vnd.openxmlformats-officedocument.spreadsheetml.sheet", "title": "2020 West Cotton Calendar_0.xlsx" }, { "@type": "dcat:Distribution", "downloadURL": "https://ndownloader.figshare.com/files/44540306", "format": "xlsx", "mediaType": "application/vnd.openxmlformats-officedocument.spreadsheetml.sheet", "title": "2021 East Cotton Calendar_0.xlsx" }, { "@type": "dcat:Distribution", "downloadURL": "https://ndownloader.figshare.com/files/44540312", "format": "xlsx", "mediaType": "application/vnd.openxmlformats-officedocument.spreadsheetml.sheet", "title": "2021 West Cotton Calendar_0.xlsx" }, { "@type": "dcat:Distribution", "downloadURL": "https://ndownloader.figshare.com/files/44540315", "format": "txt", "mediaType": "text/plain", "title": "Cotton_Calendars_README_0.txt" } ], "license": "https://creativecommons.org/publicdomain/zero/1.0/", "bureauCode": [ "005:18" ], "modified": "2024-04-04", "publisher": { "@type": "org:Organization", "name": "Agricultural Research Service" }, "accrualPeriodicity": "irregular", "keyword": [ "NP211", "Evapotranspiration", "agronomic log", "cotton", "cotton fiber", "cotton yield", "data.gov", "ARS" ], "spatial": "{\"type\": \"Polygon\", \"coordinates\": [[[-102.09906463948, 35.191719970106], [-102.07671433134, 35.19121493622], [-102.07678299485, 35.1865853205], [-102.07609634934, 35.177044674547], [-102.09913330298, 35.177072738625], [-102.09906463948, 35.191719970106]]]}" }, { "identifier": "10.15482/USDA.ADC/1526331", "accessLevel": "public", "contactPoint": { "hasEmail": "mailto:steve.evett@usda.gov", "fn": "Evett, Steven R." }, "programCode": [ "005:040" ], "description": "This dataset consists of agronomic calendars for each growing season (year) when maize (Zea mays, L., also known as corn in the United States) was grown for grain at the USDA-ARS Conservation and Production Laboratory (CPRL), Soil and Water Management Research Unit (SWMRU) research weather station, Bushland, Texas (Lat. 35.186714°, Long. -102.094189°, elevation 1170 m above MSL). Maize was grown for grain on four large, precision weighing lysimeters, each in the center of a 4.44 ha square field. The four square fields are themselves arranged in a larger square with the fields in four adjacent quadrants of the larger square. Fields and lysimeters within each field are thus designated northeast (NE), southeast (SE), northwest (NW), and southwest (SW). Irrigation was by linear move sprinkler system in 1989, 1990, and 1994. In 2013, 2016, and 2018, two lysimeters and their respective fields (NE and SE) were irrigated using subsurface drip irrigation (SDI), and two lysimeters and their respective fields (NW and SW) were irrigated by a linear move sprinkler system. Irrigations were managed to replenish soil water used by the crop on a weekly or more frequent basis as determined by soil profile water content readings made with a neutron probe to 2.4-m depth in the field. A crop calendar for each season lists by date the pertinent agronomic and maintenance operations (e.g., planting, thinning, fertilization, pesticide application, lysimeter maintenance, harvest). For each year there is a crop calendar for the two east lysimeters (NE and SE) and another calendar for the two west lysimeters (NW and SW). These datasets originate from research aimed at determining crop water use (ET), crop coefficients for use in ET-based irrigation scheduling based on a reference ET, crop growth, yield, harvest index, and crop water productivity as affected by irrigation method, timing, amount (full or some degree of deficit), agronomic practices, cultivar, and weather. Prior publications have focused on maize ET, crop coefficients, and crop water productivity. Crop coefficients have been used by ET networks. The data have utility for testing simulation models of crop ET, growth, and yield and have been used by the Agricultural Model Intercomparison and Improvement Project (AgMIP), by OPENET, and by many others for testing, and calibrating models of ET that use satellite and/or weather data.
Resources in this dataset:
This dataset consists of agronomic calendars for each growing season (year) when soybean [Glycine max (L.) Merr.] was grown for seed at the USDA-ARS Conservation and Production Laboratory (CPRL), Soil and Water Management Research Unit (SWMRU) research weather station, Bushland, Texas (Lat. 35.186714°, Long. -102.094189°, elevation 1170 m above MSL). In 1995, 2003, 2004, and 2010, soybean was grown on two large, precision weighing lysimeters, each in the center of a 4.44 ha square field. In 2019, soybean was grown on four large, precision weighing lysimeters, each in the center of a 4.4 ha square fields. The four fields were contiguous. The fields were designated northeast (NE), southeast (SE), northwest (NW), and southwest (SW), and were themselves arranged in a larger square with the fields in four adjacent quadrants of the larger square. Irrigation was by linear move sprinkler system in 1995, 2003, 2004, and 2010. In 2019, the NE and SE fields were irrigated using subsurface drip irrigation (SDI), while the NW and SW fields were irrigated using a linear move system. Irrigations designated as full were managed to replenish soil water used by the crop on a weekly or more frequent basis as determined by soil profile water content readings made with a neutron probe to 2.4-m depth in the field. Irrigations designated as deficit typically involved full irrigation to establish the crop. A crop calendar for each season lists by date the pertinent agronomic and maintenance operations (e.g., planting, thinning, fertilization, pesticide application, lysimeter maintenance, harvest). For each season there is one crop calendar for each two lysimeters (NE and SE, and/or NW and SW).\nThese datasets originate from research aimed at determining crop water use (ET), crop coefficients for use in ET-based irrigation scheduling based on a reference ET, crop growth, yield, harvest index, and crop water productivity as affected by irrigation method, timing, amount (full or some degree of deficit), agronomic practices, cultivar, and weather. Prior publications have focused on ET, crop coefficients, and crop water productivity. Crop coefficients have been used by ET networks. The data have utility for testing simulation models of crop ET, growth, and yield and have been used for testing, and calibrating models of ET that use satellite and/or weather data.
\nSee the README for descriptions of each data file.
Resource Title: 1995 Bushland, TX, west soybean agronomic calendar.
File Name: 1995 West Soybean Calendar(FINAL).xlsx
Resource Description: This agronomic calendar lists by date the agronomic operations on the Bushland, TX, large weighing lysimeters and surrounding fields, including tillage, planting, fertilization, pesticide application, furrow diking, irrigations, etc., and also sensor installation, sensor reading that might disturb lysimeter operation (neutron probe readings), maintenance operations such as emptying drainage tanks, adjusting lysimeter scale counterweights, electronic and electrical maintenance, etc. Amounts and kinds of fertilizer and pesticide applications are given with proper chemical names and SI units.
Resource Title: 2003 Bushland, TX, east soybean agronomic calendar.
File Name: 2003 East Soybean Calendar (FINAL).xlsx
Resource Description: This agronomic calendar lists by date the agronomic operations on the Bushland, TX, large weighing lysimeters and surrounding fields, including tillage, planting, fertilization, pesticide application, furrow diking, irrigations, etc., and also sensor installation, sensor reading that might disturb lysimeter operation (neutron probe readings), maintenance operations such as emptying drainage tanks, adjusting lysimeter scale counterweights, electronic and electrical maintenance, etc. Amounts and kinds of fertilizer and pesticide applications are given with proper chemical names and SI units.
Resource Title: 2010 Bushland, TX, west soybean agronomic calendar.
File Name: 2010 West Soybean Calendar(FINAL).xlsx
Resource Description: This agronomic calendar lists by date the agronomic operations on the Bushland, TX, large weighing lysimeters and surrounding fields, including tillage, planting, fertilization, pesticide application, furrow diking, irrigations, etc., and also sensor installation, sensor reading that might disturb lysimeter operation (neutron probe readings), maintenance operations such as emptying drainage tanks, adjusting lysimeter scale counterweights, electronic and electrical maintenance, etc. Amounts and kinds of fertilizer and pesticide applications are given with proper chemical names and SI units.
Resource Title: 2019 Bushland, TX, east soybean agronomic calendar.
File Name: 2019 East Soybean Calendar(FINAL).xlsx
Resource Description: This agronomic calendar lists by date the agronomic operations on the Bushland, TX, large weighing lysimeters and surrounding fields, including tillage, planting, fertilization, pesticide application, furrow diking, irrigations, etc., and also sensor installation, sensor reading that might disturb lysimeter operation (neutron probe readings), maintenance operations such as emptying drainage tanks, adjusting lysimeter scale counterweights, electronic and electrical maintenance, etc. Amounts and kinds of fertilizer and pesticide applications are given with proper chemical names and SI units.
Resource Title: 2019 Bushland, TX, west soybean agronomic calendar.
File Name: 2019 West Soybean Calendar(FINAL).xlsx
Resource Description: This agronomic calendar lists by date the agronomic operations on the Bushland, TX, large weighing lysimeters and surrounding fields, including tillage, planting, fertilization, pesticide application, furrow diking, irrigations, etc., and also sensor installation, sensor reading that might disturb lysimeter operation (neutron probe readings), maintenance operations such as emptying drainage tanks, adjusting lysimeter scale counterweights, electronic and electrical maintenance, etc. Amounts and kinds of fertilizer and pesticide applications are given with proper chemical names and SI units.
Resource Title: 2004 Bushland, TX, east soybean agronomic calendar.
File Name: 2004 East Soybean Calendar(FINAL).xlsx
Resource Description: This agronomic calendar lists by date the agronomic operations on the Bushland, TX, large weighing lysimeters and surrounding fields, including tillage, planting, fertilization, pesticide application, furrow diking, irrigations, etc., and also sensor installation, sensor reading that might disturb lysimeter operation (neutron probe readings), maintenance operations such as emptying drainage tanks, adjusting lysimeter scale counterweights, electronic and electrical maintenance, etc. Amounts and kinds of fertilizer and pesticide applications are given with proper chemical names and SI units.
Resource Title: README.
File Name: README_Soybean_Agronomic_Calendars.txt
This dataset consists of agronomic calendars for each growing season (year) when sunflower (Helianthus annuus L.) was grown for seed at the USDA-ARS Conservation and Production Laboratory (CPRL), Soil and Water Management Research Unit (SWMRU) research weather station, Bushland, Texas (Lat. 35.186714°, Long. -102.094189°, elevation 1170 m above MSL). Sunflower was grown on two large, precision weighing lysimeters, each in the center of a 4.44 ha square field. The two fields were the easternmost (NE and SE) of four square fields, which are themselves arranged in a larger square with the fields in four adjacent quadrants of the larger square. Fields and lysimeters within each field are thus designated northeast (NE), southeast (SE), northwest (NW), and southwest (SW). Irrigation was by linear move sprinkler system. Irrigations designated as full were managed to replenish soil water used by the crop on a weekly or more frequent basis as determined by soil profile water content readings made with a neutron probe to 2.4-m depth in the field. Irrigations designated as deficit typically involved full irrigation to establish the crop. A crop calendar for each season lists by date the pertinent agronomic and maintenance operations (e.g., planting, thinning, fertilization, pesticide application, lysimeter maintenance, harvest). For each season there is a crop calendar for the two lysimeters.\nThese datasets originate from research aimed at determining crop water use (ET), crop coefficients for use in ET-based irrigation scheduling based on a reference ET, crop growth, yield, harvest index, and crop water productivity as affected by irrigation method, timing, amount (full or some degree of deficit), agronomic practices, cultivar, and weather. Prior publications have focused on ET, crop coefficients, and crop water productivity. Crop coefficients have been used by ET networks. The data have utility for testing simulation models of crop ET, growth, and yield and have been used for testing, and calibrating models of ET that use satellite and/or weather data.
Resource Title: 2009 Bushland, TX, east sunflower agronomic calendar.
File Name: 2009 East Sunflower Calendar.xlsx
Resource Description: This agronomic calendar lists by date the agronomic operations on the Bushland, TX, large weighing lysimeters and surrounding fields, including tillage, planting, fertilization, pesticide application, furrow diking, irrigations, etc., and also sensor installation, sensor reading that might disturb lysimeter operation (neutron probe readings), maintenance operations such as emptying drainage tanks, adjusting lysimeter scale counterweights, electronic and electrical maintenance, etc. Amounts and kinds of fertilizer and pesticide applications are given with proper chemical names and SI units.
Resource Title: 2011 Bushland, TX, east sunflower agronomic calendar.
File Name: 2011 East Sunflower Calendar.xlsx
Resource Description: This agronomic calendar lists by date the agronomic operations on the Bushland, TX, large weighing lysimeters and surrounding fields, including tillage, planting, fertilization, pesticide application, furrow diking, irrigations, etc., and also sensor installation, sensor reading that might disturb lysimeter operation (neutron probe readings), maintenance operations such as emptying drainage tanks, adjusting lysimeter scale counterweights, electronic and electrical maintenance, etc. Amounts and kinds of fertilizer and pesticide applications are given with proper chemical names and SI units.
This dataset consists of agronomic calendars for each growing season (year) when winter wheat (Triticum aestivum L.) was grown for grain at the USDA-ARS Conservation and Production Laboratory (CPRL), Soil and Water Management Research Unit (SWMRU) research weather station, Bushland, Texas (Lat. 35.186714°, Long. -102.094189°, elevation 1170 m above MSL). Winter wheat was grown for grain on two large, precision weighing lysimeters, each in the center of a 4.44 ha square field. The four square fields are themselves arranged in a larger square with the fields in four adjacent quadrants of the larger square. Fields and lysimeters within each field are thus designated northeast (NE), southeast (SE), northwest (NW), and southwest (SW). Irrigation was by linear move sprinkler system. Irrigations designated as full were managed to replenish soil water used by the crop on a weekly or more frequent basis as determined by soil profile water content readings made with a neutron probe to 2.4-m depth in the field. Irrigations designated as deficit typically involved full irrigation to establish the crop followed by limited or no irrigation in the later winter and spring. A crop calendar for each season lists by date the pertinent agronomic and maintenance operations (e.g., planting, thinning, fertilization, pesticide application, lysimeter maintenance, harvest). For each season there is a crop calendar for the two lysimeters. In the 1989-1990 seasons the NW and SW lysimeters and fields were planted to winter wheat, and in the 1991-1992 season the NE and SE lysimeters and fields were planted to winter wheat. These datasets originate from research aimed at determining crop water use (ET), crop coefficients for use in ET-based irrigation scheduling based on a reference ET, crop growth, yield, harvest index, and crop water productivity as affected by irrigation method, timing, amount (full or some degree of deficit), agronomic practices, cultivar, and weather. Prior publications have focused on ET, crop coefficients, and crop water productivity. Crop coefficients have been used by ET networks. The data have utility for testing simulation models of crop ET, growth, and yield and have been used by the Agricultural Model Intercomparison and Improvement Project (AgMIP), and by many others for testing, and calibrating models of ET that use satellite and/or weather data.
Resources in this dataset:
Four eddy-covariance (EC) sensors were deployed at two heights upwind and within alfalfa plot trials at San Joaquin Valley Ag Science Center. The purpose of the experiment was to evaluate the robustness of flux footprint models under different atmospheric stability conditions. At each of the two locations, an EC sensor was mounted at an unconventionally low height (~1 meter) and a second at a more typical height (~2.5 m). Supplementary sensors were co-located to measure net radiation, soil heat flux, and other parameters necessary to evaluate closure of the surface energy budget. The southeast station was located at the downwind edge of a 2 acre plot trial of irrigated alfalfa, arranged in small blocks. The upwind fetch (with respect to predominant day time wind direction) included less than 100 meters of semi-homogeneous conditions. Soil sensors were duplicated across the alfalfa blocks and inter-block alleys which were irrigated but not planted. The northwest station was located approximately 25 meters upwind of the irrigated alfalfa plot trials in fallow, non-irrigated bare field.\nRaw 10 Hz infrared gas analyzer and sonic anemometer data, and 30 minute averaged data from other sensors are provided.
\nResources in this dataset:
\nTitle: Data dictionary for SEB files from southeast station (in zipped folder)\nFilename: ALF2021_SEBSE_header.csv\nDescription: Contains variable names, description of sensors, units, and required metadata for each variable.
\nTitle: Data dictionary for SEB files from northwest station (zipped folder)\nFilename: ALF2021_SEBNW_header.csv\nDescription: Contains variable names, description of sensors, units, and required metadata for each variable.
\nTitle: Data dictionary for EC files from SE station (zipped folder)\nFilename: ALF2021_ECSE_header.csv\nDescription: Contains variable names, description of sensors, units, and required metadata for each variable.
\nTitle: Data dictionary for EC files from NW station (zipped folder)\nFilename: ALF2021_ECNW_header.csv\nDescription: Contains variable names, description of sensors, units, and required metadata for each variable.
\nTitle: SJVASC Alfalfa 2021- NW station\nFilename: EC2_alfNW.zip
\nTitle: SJVASC Alfalfa 2021- SE station\nFilename: EC2_alfSE.zip
\nResource Title: SJVASC Alfalfa 2021- NW station.
File Name: EC2_alfNW.zip
Resource Title: SJVASC Alfalfa 2021- SE station.
File Name: EC2_alfSE.zip
Resource Title: Data dictionary for EC files from NW station (zipped folder).
File Name: ALF2021_ECNW_header.csv
Resource Title: Data dictionary for EC files from SE station (zipped folder).
File Name: ALF2021_ECSE_header.csv
Resource Title: Data dictionary for SEB files from northwest station (zipped folder).
File Name: ALF2021_SEBNW_header.csv
Resource Title: Data dictionary for SEB files from southeast station (in zipped folder).
File Name: ALF2021_SEBSE_header.csv
Alternative Biomass Production Study for Resilient Economic Agricultural Practices in Morris, Minnesota\nThe Tillage Study was established in 1997 to assess the effect of a variety of tillage intensities on soil C. The initial eight treatments included no-tillage, moldboard + disk tillage, chisel tillage, and fall and spring residue management, with or without strip-tillage and strip-tillage + subsoiling (Archer and Reicosky, 2009). In 2004, treatments were reduced to no-tillage, moldboard tillage, and fall and spring residue management without strip-tillage, but all had an early or late planting date. The last comprehensive set of soil samples were collected in 2006. In 2008, the strip-tilled subset of the Tillage Study plots were repurposed for the Alternative Biomass Production Systems study, which was designed to explore alternative strategies to support bioenergy including planting of cellulosic feedstock. The Alternative Biomass Production plots included perennials in an extended 6-year rotation, winter cereal rye cover crops in a corn-soybean rotation, and an alternative Sorghum-Sudan grass hybrid forage system, all of which have and will continue to be monitored for agronomic and soil properties.
Resource Title: GeoData catalog record.
File Name: Web Page, url: https://geodata.nal.usda.gov/geonetwork/srv/eng/catalog.search#/metadata/cafbf65e-2056-4aac-af33-ab3896fb3c6d
Alternative Rotation Study for Greenhouse gas Reduction through Agricultural Carbon Enhancement network in Brookings, South Dakota\nGreenhouse gas fluxes and ancillary data are being measured in a 2-yr corn-soybean rotation (business as usual) and a 4- yr corn-pea-winter wheat-soybean rotation (more sustainable).
Resource Title: GeoData catalog record.
File Name: Web Page, url: https://geodata.nal.usda.gov/geonetwork/srv/eng/catalog.search#/metadata/829740f4-6f6d-4dfc-9e51-b894497aff6b
The site is located on the USDA-ARS's Reynolds Creek Experimental Watershed. It is dominated by Wyoming big sagebrush on land managed by USDI Bureau of Land Management.
Resource Title: GeoData catalog record.
File Name: Web Page, url: https://geodata.nal.usda.gov/geonetwork/srv/eng/catalog.search#/metadata/347233fc-69ea-4df0-8148-9f3a5e3ea5cc
Located within an exclusively agricultural landscape, the G19 Rosemount AmeriFlux site measures the carbon budget of corn-soybean annual crop rotation.
Resource Title: GeoData catalog record.
File Name: Web Page, url: https://geodata.nal.usda.gov/geonetwork/srv/eng/catalog.search#/metadata/Rosemount-G19_eaa_2015_March_12_1556
The study site is one of three fields (all located within 1.6 km of each other) at the University of Nebraska Agricultural Research and Development Center near Mead, Nebraska. This site is irrigated with a center pivot system. Prior to the initiation of the study, the irrigated site had a 10-yr history of maize-soybean rotation under no-till. A tillage operation (disking) was done just prior to the 2001 planting to homogenize the top 0.1 m of soil, incorporate P and K fertilizers, as well as previously accumulated surface residues. Since the tillage operation, the site has been under no-till management until the harvest of 2005. Following harvest, a conservation-plow tillage operation was initiated where a small amount of N fertilizer is sprayed on the residue immediately prior to the plow operation. Approximately 1/3 of the crop residue is left on the surface. The post-harvest conservation-plow operation continues as the current practice.
Resource Title: GeoData catalog record.
File Name: Web Page, url: https://geodata.nal.usda.gov/geonetwork/srv/eng/catalog.search#/metadata/UniversityOfNebraska1_eaa_2015_March_17_1330
The study site is one of three fields (all located within 1.6 km of each other) at the University of Nebraska Agricultural Research and Development Center near Mead, Nebraska. This site is irrigated with a center pivot system. Prior to the initiation of the study, the irrigated site had a 10-yr history of maize-soybean rotation under no-till. A tillage operation (disking) was done just prior to the 2001 planting to homogenize the top 0.1 m of soil, incorporate P and K fertilizers, as well as previously accumulated surface residues. Since this tillage operation, the site has been under no-till management.
Resource Title: GeoData catalog record.
File Name: Web Page, url: https://geodata.nal.usda.gov/geonetwork/srv/eng/catalog.search#/metadata/UniversityOfNebraska2_eaa_2015_March_17_1535
The study site is one of three fields (all located within 1.6 km of each other) at the University of Nebraska Agricultural Research and Development Center near Mead, Nebraska. While the other two sites are equipped with irrigation systems, this site relies on rainfall. A tillage operation (disking) was done just prior to the 2001 planting to homogenize the top 0.1 m of soil, incorporate P and K fertilizers, as well as previously accumulated surface residues. Since initiation of the study in 2001, this site has been under no-till management.
Resource Title: GeoData catalog record.
File Name: Web Page, url: https://geodata.nal.usda.gov/geonetwork/srv/eng/catalog.search#/metadata/UniversityOfNebraska_eaa_2015_March_17_1231
Energy and CO2 Fluxes have been monitored from 1997 to 2007 using Bowen Ratio technique, and since spring of 2004 with eddy covariance. This is located in a small intensively-studied, experimental watershed within USDA-ARS's Walnut Gulch Experimental Watershed.
Resource Title: GeoData catalog record.
File Name: Web Page, url: https://geodata.nal.usda.gov/geonetwork/srv/eng/catalog.search#/metadata/WalnutGulchKG_eaa_2015_March_12_1648
This dataset links to a data download from the Daymet website. Data parameters are Latitude: 34.2547 Longitude: -89.8735 X & Y on Lambert Conformal Conic: 897941.75 -822030.73; Tile: 11206; Elevation: 91 meters; Years: 1980-2014. Archived and distributed through the Oak Ridge National Laboratory Distributed Active Archive Center (ORNL DAAC), the Daymet dataset for Goodwin Creek provides gridded estimates of daily weather parameters for North America, including daily continuous surfaces of minimum and maximum temperature, precipitation occurrence and amount, humidity, shortwave radiation, snow water equivalent, and day length. The Goodwin Creek site is located in the Bluff Hills, just east of the Mississippi River valley. In addition to being a core AmeriFlux site, Goodwin Creek is affiliated with a multitude of other projects including Surface Radiation (SURFRAD), Baseline Surface Radiation Network (BSRN), and is one of twelve USDA Conservation Reserve Program watersheds. Natural disturbances are of minimal influence to the site. The immediate region is primarily used for grazing while infrequent logging activities occur in nearby forests. The grass surrounding the base of the tower is mowed periodically to maintain a height consistent with the regional grasslands.\n\nDaymet is supported by funding from NASA through the Earth Science Data and Information System (ESDIS) and the Terrestrial Ecosystem Program. The continued development of the Daymet algorithm and processing is also supported by the Office of Biological and Environmental Research within the U.S. Department of Energy's Office of Science.
Resource Title: GeoData catalog.
File Name: Web Page, url: https://geodata.nal.usda.gov/geonetwork/srv/eng/catalog.search#/metadata/GoodwinCreek_eaa_2015_March_17_1633
Dataset consists of monitoring the levels of 15 amino acid and 21 phenolic compounds in Cabernet franc grapevine leaves infected with Grapevine red blotch-associated virus or Cabernet sauvignon grapevine leaves infected with Grapevine leafroll-associated virus 3 during May, July, and September of 2018 and 2019 in Davis, California. Unless indicated, amino acid data is in microg/g fresh weight and phenolic data is in mg/g fresh weight.
Resource Title: Amino acid and phenolic compound amounts in healthy and virus-infected grapevines..
File Name: GrapevineVirusChemistryProject.xlsx
Resource Description: Data from leaves collected in May, July, or September in 2018 or 2019. Unless indicated, amino acid levels in ppm (microg/g fresh weight) and phenolic levels in mg/g fresh weight.
The data in this repository is to provide the scripts used in the assembly of the Anastrepha ludens genome. It can be used to replicate the steps necessary to assemble the genome described in National Center for Biotechnology Information (NCBI) BioProject: PRJNA803324. This genome assembly workflow was performed on the United States Department of Agriculture (USDA) - SCINet/Mississippi State University High Performance Computing Cluster (HPC) Atlas and installed via Conda.
Whole genome sequence data for Bovidae Bos taurus - beef Angus. The data is in \"fastq\" format.
\nThe National Animal Germplasm Program does not have germplasm for this animal.
\nThere are two versions of each file because we did paired end sequencing. There are two reads for each of the 210 data lines (a forward and a reverse read) summing to 420 total. A diagram of this is provided in the Collection Dataset\n. In the diagram, the two reads would correspond to read 1 and read 3.
Resource Title: Animal 103-3 Sequence Data - SCINet.
File Name: Web Page, url: https://app.globus.org/file-manager?destination_id=e5391440-1d5e-11ec-a0a0-6b21ca6daf73&destination_path=/node33202/
tar file containing 14 files. The files are:\nRAPiD-Genomics_F112_CSU_136201_P001_WA03_i5-515_i7-99_S3_L003_R1_001.fastq.gz\nRAPiD-Genomics_F112_CSU_136201_P001_WA03_i5-515_i7-99_S3_L003_R2_001.fastq.gz\nRAPiD-Genomics-F113-CSU-136201-P001-WA03-i5-515-i7-99_S139_L002_R1_001.fastq.gz\nRAPiD-Genomics-F113-CSU-136201-P001-WA03-i5-515-i7-99_S139_L002_R2_001.fastq.gz\nRAPiD-Genomics-F113-CSU-136201-P001-WA03-i5-515-i7-99_S3_L001_R1_001.fastq.gz\nRAPiD-Genomics-F113-CSU-136201-P001-WA03-i5-515-i7-99_S3_L001_R2_001.fastq.gz\nRAPiD-Genomics-F114-CSU-136201-P001-WA03-i5-515-i7-99_S3_L003_R1_001.fastq.gz\nRAPiD-Genomics-F114-CSU-136201-P001-WA03-i5-515-i7-99_S3_L003_R2_001.fastq.gz\nRAPiD-Genomics_F115_CSU_136201_P001_WA03_i5-515_i7-99_S3_L001_R1_001.fastq.gz\nRAPiD-Genomics_F115_CSU_136201_P001_WA03_i5-515_i7-99_S3_L001_R2_001.fastq.gz\nRAPiD-Genomics_F115_CSU_136201_P001_WA03_i5-515_i7-99_S3_L002_R1_001.fastq.gz\nRAPiD-Genomics_F115_CSU_136201_P001_WA03_i5-515_i7-99_S3_L002_R2_001.fastq.gz\nRAPiD-Genomics_F116_CSU_136201_P001_WA03_i5-515_i7-99_S358_L002_R1_001.fastq.gz\nRAPiD-Genomics_F116_CSU_136201_P001_WA03_i5-515_i7-99_S358_L002_R2_001.fastq.gz
\nThe .tar file can be accessed/retrieved with valid SCINet account at this location: /KEEP/ADCdatastorage/NAL/published/node33202/103-3.tar
\nSee the SCINet File Transfer guide for more information on moving large files: https://scinet.usda.gov/guides/data/datatransfer
\nGlobus users:\nThe files can also be accessed through Globus by following this data link.The user will need to log in to Globus in order to retrieve this data. User accounts are free of charge with several options for signing on. Instructions for creating an account are on the login page.\n
Whole genome sequence data for Bovidae Bos taurus - beef Angus. The data is in \"fastq\" format.
\nThe National Animal Germplasm Program has germplasm for this animal, with the repository number 16378.
\nThere are two versions of each file because we did paired end sequencing. There are two reads for each of the 210 data lines (a forward and a reverse read) summing to 420 total. A diagram of this is provided in the Collection Dataset\n. In the diagram, the two reads would correspond to read 1 and read 3.
Resource Title: Animal 16378 Sequence Data - SCINet.
File Name: Web Page, url: https://app.globus.org/file-manager?destination_id=e5391440-1d5e-11ec-a0a0-6b21ca6daf73&destination_path=/node29313/
tar file containing 14 files. The files are:\nRAPiD-Genomics_F112_CSU_136201_P001_WA07_i5-515_i7-103_S7_L003_R1_001.fastq.gz\nRAPiD-Genomics_F112_CSU_136201_P001_WA07_i5-515_i7-103_S7_L003_R2_001.fastq.gz\nRAPiD-Genomics-F113-CSU-136201-P001-WA07-i5-515-i7-103_S143_L002_R1_001.fastq.gz\nRAPiD-Genomics-F113-CSU-136201-P001-WA07-i5-515-i7-103_S143_L002_R2_001.fastq.gz\nRAPiD-Genomics-F113-CSU-136201-P001-WA07-i5-515-i7-103_S7_L001_R1_001.fastq.gz\nRAPiD-Genomics-F113-CSU-136201-P001-WA07-i5-515-i7-103_S7_L001_R2_001.fastq.gz\nRAPiD-Genomics-F114-CSU-136201-P001-WA07-i5-515-i7-103_S7_L003_R1_001.fastq.gz\nRAPiD-Genomics-F114-CSU-136201-P001-WA07-i5-515-i7-103_S7_L003_R2_001.fastq.gz\nRAPiD-Genomics_F115_CSU_136201_P001_WA07_i5-515_i7-103_S7_L001_R1_001.fastq.gz\nRAPiD-Genomics_F115_CSU_136201_P001_WA07_i5-515_i7-103_S7_L001_R2_001.fastq.gz\nRAPiD-Genomics_F115_CSU_136201_P001_WA07_i5-515_i7-103_S7_L002_R1_001.fastq.gz\nRAPiD-Genomics_F115_CSU_136201_P001_WA07_i5-515_i7-103_S7_L002_R2_001.fastq.gz\nRAPiD-Genomics_F116_CSU_136201_P001_WA07_i5-515_i7-103_S362_L002_R1_001.fastq.gz\nRAPiD-Genomics_F116_CSU_136201_P001_WA07_i5-515_i7-103_S362_L002_R2_001.fastq.gz
\nThe .tar file can be accessed/retrieved with valid SCINet account at this location: /KEEP/ADCdatastorage/NAL/published/node29313/
\nSee the SCINet File Transfer guide for more information on moving large files: https://scinet.usda.gov/guides/data/datatransfer
\nGlobus users:\nThe files can also be accessed through Globus by following this data link.The user will need to log in to Globus in order to retrieve this data. User accounts are free of charge with several options for signing on. Instructions for creating an account are on the login page.
Whole genome sequence data for Bovidae Bos taurus - beef Angus. The data is in \"fastq\" format.
\nThe National Animal Germplasm Program does not have germplasm for this animal.
\nThere are two versions of each file because we did paired end sequencing. There are two reads for each of the 210 data lines (a forward and a reverse read) summing to 420 total. A diagram of this is provided in the Collection Dataset. In the diagram, the two reads would correspond to read 1 and read 3.
Resource Title: Animal 186-6 Sequence Data - SCINet .
File Name: Web Page, url: https://app.globus.org/file-manager?destination_id=e5391440-1d5e-11ec-a0a0-6b21ca6daf73&destination_path=/node33204/
tar file containing 14 files. The files are:\nRAPiD-Genomics_F112_CSU_136201_P001_WA04_i5-515_i7-100_S4_L003_R1_001.fastq.gz\nRAPiD-Genomics_F112_CSU_136201_P001_WA04_i5-515_i7-100_S4_L003_R2_001.fastq.gz\nRAPiD-Genomics-F113-CSU-136201-P001-WA04-i5-515-i7-100_S140_L002_R1_001.fastq.gz\nRAPiD-Genomics-F113-CSU-136201-P001-WA04-i5-515-i7-100_S140_L002_R2_001.fastq.gz\nRAPiD-Genomics-F113-CSU-136201-P001-WA04-i5-515-i7-100_S4_L001_R1_001.fastq.gz\nRAPiD-Genomics-F113-CSU-136201-P001-WA04-i5-515-i7-100_S4_L001_R2_001.fastq.gz\nRAPiD-Genomics-F114-CSU-136201-P001-WA04-i5-515-i7-100_S4_L003_R1_001.fastq.gz\nRAPiD-Genomics-F114-CSU-136201-P001-WA04-i5-515-i7-100_S4_L003_R2_001.fastq.gz\nRAPiD-Genomics_F115_CSU_136201_P001_WA04_i5-515_i7-100_S4_L001_R1_001.fastq.gz\nRAPiD-Genomics_F115_CSU_136201_P001_WA04_i5-515_i7-100_S4_L001_R2_001.fastq.gz\nRAPiD-Genomics_F115_CSU_136201_P001_WA04_i5-515_i7-100_S4_L002_R1_001.fastq.gz\nRAPiD-Genomics_F115_CSU_136201_P001_WA04_i5-515_i7-100_S4_L002_R2_001.fastq.gz\nRAPiD-Genomics_F116_CSU_136201_P001_WA04_i5-515_i7-100_S359_L002_R1_001.fastq.gz\nRAPiD-Genomics_F116_CSU_136201_P001_WA04_i5-515_i7-100_S359_L002_R2_001.fastq.gz
\nThe .tar file can be accessed/retrieved with valid SCINet account at this location: /KEEP/ADCdatastorage/NAL/published/node33204/186-6.tar
\nSee the SCINet File Transfer guide for more information on moving large files: https://scinet.usda.gov/guides/data/datatransfer
\nGlobus users:\nThe files can also be accessed through Globus by following this data link.The user will need to log in to Globus in order to retrieve this data. User accounts are free of charge with several options for signing on. Instructions for creating an account are on the login page.
\nWhole genome sequence data for Bovidae Bos taurus - beef Angus. The data is in \"fastq\" format.
\nThe National Animal Germplasm Program has germplasm for this animal, with the repository number 20544.
\nThere are two versions of each file because we did paired end sequencing. There are two reads for each of the 210 data lines (a forward and a reverse read) summing to 420 total. A diagram of this is provided in the Collection Dataset. In the diagram, the two reads would correspond to read 1 and read 3.
Resource Title: Animal 20544 Sequence Data - SCINet.
File Name: Web Page, url: https://app.globus.org/file-manager?destination_id=e5391440-1d5e-11ec-a0a0-6b21ca6daf73&destination_path=/node32019/
tar file containing 14 files. The files are:\nRAPiD-Genomics_F112_CSU_136201_P001_WA08_i5-515_i7-104_S8_L003_R1_001.fastq.gz\nRAPiD-Genomics_F112_CSU_136201_P001_WA08_i5-515_i7-104_S8_L003_R2_001.fastq.gz\nRAPiD-Genomics-F113-CSU-136201-P001-WA08-i5-515-i7-104_S144_L002_R1_001.fastq.gz\nRAPiD-Genomics-F113-CSU-136201-P001-WA08-i5-515-i7-104_S144_L002_R2_001.fastq.gz\nRAPiD-Genomics-F113-CSU-136201-P001-WA08-i5-515-i7-104_S8_L001_R1_001.fastq.gz\nRAPiD-Genomics-F113-CSU-136201-P001-WA08-i5-515-i7-104_S8_L001_R2_001.fastq.gz\nRAPiD-Genomics-F114-CSU-136201-P001-WA08-i5-515-i7-104_S8_L003_R1_001.fastq.gz\nRAPiD-Genomics-F114-CSU-136201-P001-WA08-i5-515-i7-104_S8_L003_R2_001.fastq.gz\nRAPiD-Genomics_F115_CSU_136201_P001_WA08_i5-515_i7-104_S8_L001_R1_001.fastq.gz\nRAPiD-Genomics_F115_CSU_136201_P001_WA08_i5-515_i7-104_S8_L001_R2_001.fastq.gz\nRAPiD-Genomics_F115_CSU_136201_P001_WA08_i5-515_i7-104_S8_L002_R1_001.fastq.gz\nRAPiD-Genomics_F115_CSU_136201_P001_WA08_i5-515_i7-104_S8_L002_R2_001.fastq.gz\nRAPiD-Genomics_F116_CSU_136201_P001_WA08_i5-515_i7-104_S363_L002_R1_001.fastq.gz\nRAPiD-Genomics_F116_CSU_136201_P001_WA08_i5-515_i7-104_S363_L002_R2_001.fastq.gz
\nSCINet users:\nThe .tar file can be accessed/retrieved with valid SCINet account at this location: /KEEP/ADCdatastorage/NAL/published/node32019/\nSee the SCINet File Transfer guide for more information on moving large files: https://scinet.usda.gov/guides/data/datatransfer
\nGlobus users:\nThe files can also be accessed through Globus by following this data link. The user will need to log in to Globus in order to retrieve this data. User accounts are free of charge with several options for signing on. Instructions for creating an account are on the login page.
\nWhole genome sequence data for Bovidae Bos taurus - beef Angus. The data is in \"fastq\" format.
\nThe National Animal Germplasm Program has germplasm for this animal, with the repository number 20545.
\nThere are two versions of each file because we did paired end sequencing. There are two reads for each of the 210 data lines (a forward and a reverse read) summing to 420 total. A diagram of this is provided in the Collection Dataset. In the diagram, the two reads would correspond to read 1 and read 3.
Resource Title: Animal 20545 Sequence Data - SCINet.
File Name: Web Page, url: https://app.globus.org/file-manager?destination_id=e5391440-1d5e-11ec-a0a0-6b21ca6daf73&destination_path=/node32023/
.tar file containng 14 files. the files are:\nRAPiD-Genomics_F112_CSU_136201_P001_WA09_i5-515_i7-105_S9_L003_R1_001.fastq.gz\nRAPiD-Genomics_F112_CSU_136201_P001_WA09_i5-515_i7-105_S9_L003_R2_001.fastq.gz\nRAPiD-Genomics-F113-CSU-136201-P001-WA09-i5-515-i7-105_S145_L002_R1_001.fastq.gz\nRAPiD-Genomics-F113-CSU-136201-P001-WA09-i5-515-i7-105_S145_L002_R2_001.fastq.gz\nRAPiD-Genomics-F113-CSU-136201-P001-WA09-i5-515-i7-105_S9_L001_R1_001.fastq.gz\nRAPiD-Genomics-F113-CSU-136201-P001-WA09-i5-515-i7-105_S9_L001_R2_001.fastq.gz\nRAPiD-Genomics-F114-CSU-136201-P001-WA09-i5-515-i7-105_S9_L003_R1_001.fastq.gz\nRAPiD-Genomics-F114-CSU-136201-P001-WA09-i5-515-i7-105_S9_L003_R2_001.fastq.gz\nRAPiD-Genomics_F115_CSU_136201_P001_WA09_i5-515_i7-105_S9_L001_R1_001.fastq.gz\nRAPiD-Genomics_F115_CSU_136201_P001_WA09_i5-515_i7-105_S9_L001_R2_001.fastq.gz\nRAPiD-Genomics_F115_CSU_136201_P001_WA09_i5-515_i7-105_S9_L002_R1_001.fastq.gz\nRAPiD-Genomics_F115_CSU_136201_P001_WA09_i5-515_i7-105_S9_L002_R2_001.fastq.gz\nRAPiD-Genomics_F116_CSU_136201_P001_WA09_i5-515_i7-105_S364_L002_R1_001.fastq.gz\nRAPiD-Genomics_F116_CSU_136201_P001_WA09_i5-515_i7-105_S364_L002_R2_001.fastq.gz
\nThe .tar file can be accessed/retrieved with valid SCINet account at this location: /KEEP/ADCdatastorage/NAL/published/node32023/
\nSee the SCINet File Transfer guide for more information on moving large files: https://scinet.usda.gov/guides/data/datatransfer
\nGlobus users:\nThe files can also be accessed through Globus by following this data link.The user will need to log in to Globus in order to retrieve this data. User accounts are free of charge with several options for signing on. Instructions for creating an account are on the login page.
Whole genome sequence data for Bovidae Bos taurus - beef Angus. The data is in \"fastq\" format.
\nThe National Animal Germplasm Program has germplasm for this animal, with the repository number 20587.
\nThere are two versions of each file because we did paired end sequencing. There are two reads for each of the 210 data lines (a forward and a reverse read) summing to 420 total. A diagram of this is provided in the Collection Dataset. In the diagram, the two reads would correspond to read 1 and read 3.
Resource Title: Animal 20587 Sequence Data - SCINet .
File Name: Web Page, url: https://app.globus.org/file-manager?destination_id=e5391440-1d5e-11ec-a0a0-6b21ca6daf73&destination_path=/node32043/
.tar file containing 14 files. The files are:\nRAPiD-Genomics_F112_CSU_136201_P001_WA10_i5-515_i7-106_S10_L003_R1_001.fastq.gz
\nRAPiD-Genomics-F114-CSU-136201-P001-WA10-i5-515-i7-106_S10_L003_R2_001.fastq.gz\nRAPiD-Genomics_F112_CSU_136201_P001_WA10_i5-515_i7-106_S10_L003_R2_001.fastq.gz
\nRAPiD-Genomics_F115_CSU_136201_P001_WA10_i5-515_i7-106_S10_L001_R1_001.fastq.gz\nRAPiD-Genomics-F113-CSU-136201-P001-WA10-i5-515-i7-106_S10_L001_R1_001.fastq.gz
\nRAPiD-Genomics_F115_CSU_136201_P001_WA10_i5-515_i7-106_S10_L001_R2_001.fastq.gz\nRAPiD-Genomics-F113-CSU-136201-P001-WA10-i5-515-i7-106_S10_L001_R2_001.fastq.gz
\nRAPiD-Genomics_F115_CSU_136201_P001_WA10_i5-515_i7-106_S10_L002_R1_001.fastq.gz\nRAPiD-Genomics-F113-CSU-136201-P001-WA10-i5-515-i7-106_S146_L002_R1_001.fastq.gz
\nRAPiD-Genomics_F115_CSU_136201_P001_WA10_i5-515_i7-106_S10_L002_R2_001.fastq.gz\nRAPiD-Genomics-F113-CSU-136201-P001-WA10-i5-515-i7-106_S146_L002_R2_001.fastq.gz
\nRAPiD-Genomics_F116_CSU_136201_P001_WA10_i5-515_i7-106_S365_L002_R1_001.fastq.gz\nRAPiD-Genomics-F114-CSU-136201-P001-WA10-i5-515-i7-106_S10_L003_R1_001.fastq.gz
\nRAPiD-Genomics_F116_CSU_136201_P001_WA10_i5-515_i7-106_S365_L002_R2_001.fastq.gz
The .tar file can be accessed/retrieved with valid SCINet account at this location: /KEEP/ADCdatastorage/NAL/published/node32043/
\nSee the SCINet File Transfer guide for more information on moving large files: https://scinet.usda.gov/guides/data/datatransfer
\nGlobus users:\nThe files can also be accessed through Globus by following this data link.The user will need to log in to Globus in order to retrieve this data. User accounts are free of charge with several options for signing on. Instructions for creating an account are on the login page.
\nWhole genome sequence data for Bovidae Bos taurus - beef Angus. The data is in \"fastq\" format.
\nThe National Animal Germplasm Program has germplasm for this animal, with the repository number 20598.
\nThere are two versions of each file because we did paired end sequencing. There are two reads for each of the 210 data lines (a forward and a reverse read) summing to 420 total. A diagram of this is provided in the Collection Dataset. In the diagram, the two reads would correspond to read 1 and read 3.
Resource Title: Animal 20598 Sequence Data - SCINet .
File Name: Web Page, url: https://app.globus.org/file-manager?destination_id=e5391440-1d5e-11ec-a0a0-6b21ca6daf73&destination_path=/node32077/
tar file containing 14 files. The files are:\nRAPiD-Genomics_F112_CSU_136201_P001_WA11_i5-515_i7-107_S11_L003_R1_001.fastq.gz\nRAPiD-Genomics_F112_CSU_136201_P001_WA11_i5-515_i7-107_S11_L003_R2_001.fastq.gz\nRAPiD-Genomics-F113-CSU-136201-P001-WA11-i5-515-i7-107_S11_L001_R1_001.fastq.gz\nRAPiD-Genomics-F113-CSU-136201-P001-WA11-i5-515-i7-107_S11_L001_R2_001.fastq.gz\nRAPiD-Genomics-F113-CSU-136201-P001-WA11-i5-515-i7-107_S147_L002_R1_001.fastq.gz\nRAPiD-Genomics-F113-CSU-136201-P001-WA11-i5-515-i7-107_S147_L002_R2_001.fastq.gz\nRAPiD-Genomics-F114-CSU-136201-P001-WA11-i5-515-i7-107_S11_L003_R1_001.fastq.gz\nRAPiD-Genomics-F114-CSU-136201-P001-WA11-i5-515-i7-107_S11_L003_R2_001.fastq.gz\nRAPiD-Genomics_F115_CSU_136201_P001_WA11_i5-515_i7-107_S11_L001_R1_001.fastq.gz\nRAPiD-Genomics_F115_CSU_136201_P001_WA11_i5-515_i7-107_S11_L001_R2_001.fastq.gz\nRAPiD-Genomics_F115_CSU_136201_P001_WA11_i5-515_i7-107_S11_L002_R1_001.fastq.gz\nRAPiD-Genomics_F115_CSU_136201_P001_WA11_i5-515_i7-107_S11_L002_R2_001.fastq.gz\nRAPiD-Genomics_F116_CSU_136201_P001_WA11_i5-515_i7-107_S366_L002_R1_001.fastq.gz\nRAPiD-Genomics_F116_CSU_136201_P001_WA11_i5-515_i7-107_S366_L002_R2_001.fastq.gz
\nThe .tar file can be accessed/retrieved with valid SCINet account at this location: /KEEP/ADCdatastorage/NAL/published/node32077/
\nSee the SCINet File Transfer guide for more information on moving large files: https://scinet.usda.gov/guides/data/datatransfer
\nGlobus users:\nThe files can also be accessed through Globus by following this data link.The user will need to log in to Globus in order to retrieve this data. User accounts are free of charge with several options for signing on. Instructions for creating an account are on the login page.
Whole genome sequence data for Bovidae Bos taurus - beef Angus. The data is in \"fastq\" format.
\nThe National Animal Germplasm Program has germplasm for this animal, with the repository number 20658.
\nThere are two versions of each file because we did paired end sequencing. There are two reads for each of the 210 data lines (a forward and a reverse read) summing to 420 total. A diagram of this is provided in the Collection Dataset. In the diagram, the two reads would correspond to read 1 and read 3.
Resource Title: Animal 20658 Sequence Data - SCINet.
File Name: Web Page, url: https://app.globus.org/file-manager?destination_id=e5391440-1d5e-11ec-a0a0-6b21ca6daf73&destination_path=/node32104/
tar file containing 14 files. The files are:\nRAPiD-Genomics_F112_CSU_136201_P001_WA12_i5-515_i7-108_S12_L003_R1_001.fastq.gz\nRAPiD-Genomics_F112_CSU_136201_P001_WA12_i5-515_i7-108_S12_L003_R2_001.fastq.gz\nRAPiD-Genomics-F113-CSU-136201-P001-WA12-i5-515-i7-108_S12_L001_R1_001.fastq.gz\nRAPiD-Genomics-F113-CSU-136201-P001-WA12-i5-515-i7-108_S12_L001_R2_001.fastq.gz\nRAPiD-Genomics-F113-CSU-136201-P001-WA12-i5-515-i7-108_S148_L002_R1_001.fastq.gz\nRAPiD-Genomics-F113-CSU-136201-P001-WA12-i5-515-i7-108_S148_L002_R2_001.fastq.gz\nRAPiD-Genomics-F114-CSU-136201-P001-WA12-i5-515-i7-108_S12_L003_R1_001.fastq.gz\nRAPiD-Genomics-F114-CSU-136201-P001-WA12-i5-515-i7-108_S12_L003_R2_001.fastq.gz\nRAPiD-Genomics_F115_CSU_136201_P001_WA12_i5-515_i7-108_S12_L001_R1_001.fastq.gz\nRAPiD-Genomics_F115_CSU_136201_P001_WA12_i5-515_i7-108_S12_L001_R2_001.fastq.gz\nRAPiD-Genomics_F115_CSU_136201_P001_WA12_i5-515_i7-108_S12_L002_R1_001.fastq.gz\nRAPiD-Genomics_F115_CSU_136201_P001_WA12_i5-515_i7-108_S12_L002_R2_001.fastq.gz\nRAPiD-Genomics_F116_CSU_136201_P001_WA12_i5-515_i7-108_S367_L002_R1_001.fastq.gz\nRAPiD-Genomics_F116_CSU_136201_P001_WA12_i5-515_i7-108_S367_L002_R2_001.fastq.gz
\nThe .tar file can be accessed/retrieved with valid SCINet account at this location: /KEEP/ADCdatastorage/NAL/published/node32104/
\nSee the SCINet File Transfer guide for more information on moving large files: https://scinet.usda.gov/guides/data/datatransfer
\nGlobus users:\nThe files can also be accessed through Globus by following this data link.The user will need to log in to Globus in order to retrieve this data. User accounts are free of charge with several options for signing on. Instructions for creating an account are on the login page.
Whole genome sequence data for Bovidae Bos taurus - beef Angus. The data is in \"fastq\" format.
\nThe National Animal Germplasm Program has germplasm for this animal, with the repository number 20735.
\nThere are two versions of each file because we did paired end sequencing. There are two reads for each of the 210 data lines (a forward and a reverse read) summing to 420 total. A diagram of this is provided in the Collection Dataset. In the diagram, the two reads would correspond to read 1 and read 3.
Resource Title: Animal 20735 Sequence Data - SCINet.
File Name: Web Page, url: https://app.globus.org/file-manager?destination_id=e5391440-1d5e-11ec-a0a0-6b21ca6daf73&destination_path=/node32108/
tar file containing 14 files. The files are:\nRAPiD-Genomics_F112_CSU_136201_P001_WB01_i5-515_i7-109_S13_L003_R1_001.fastq.gz\nRAPiD-Genomics_F112_CSU_136201_P001_WB01_i5-515_i7-109_S13_L003_R2_001.fastq.gz\nRAPiD-Genomics-F113-CSU-136201-P001-WB01-i5-515-i7-109_S13_L001_R1_001.fastq.gz\nRAPiD-Genomics-F113-CSU-136201-P001-WB01-i5-515-i7-109_S13_L001_R2_001.fastq.gz\nRAPiD-Genomics-F113-CSU-136201-P001-WB01-i5-515-i7-109_S149_L002_R1_001.fastq.gz\nRAPiD-Genomics-F113-CSU-136201-P001-WB01-i5-515-i7-109_S149_L002_R2_001.fastq.gz\nRAPiD-Genomics-F114-CSU-136201-P001-WB01-i5-515-i7-109_S13_L003_R1_001.fastq.gz\nRAPiD-Genomics-F114-CSU-136201-P001-WB01-i5-515-i7-109_S13_L003_R2_001.fastq.gz\nRAPiD-Genomics_F115_CSU_136201_P001_WB01_i5-515_i7-109_S13_L001_R1_001.fastq.gz\nRAPiD-Genomics_F115_CSU_136201_P001_WB01_i5-515_i7-109_S13_L001_R2_001.fastq.gz\nRAPiD-Genomics_F115_CSU_136201_P001_WB01_i5-515_i7-109_S13_L002_R1_001.fastq.gz\nRAPiD-Genomics_F115_CSU_136201_P001_WB01_i5-515_i7-109_S13_L002_R2_001.fastq.gz\nRAPiD-Genomics_F116_CSU_136201_P001_WB01_i5-515_i7-109_S368_L002_R1_001.fastq.gz\nRAPiD-Genomics_F116_CSU_136201_P001_WB01_i5-515_i7-109_S368_L002_R2_001.fastq.gz
\nThe .tar file can be accessed/retrieved with valid SCINet account at this location: /KEEP/ADCdatastorage/NAL/published/node32108/
\nSee the SCINet File Transfer guide for more information on moving large files: https://scinet.usda.gov/guides/data/datatransfer
\nGlobus users:\nThe files can also be accessed through Globus by following this data link.The user will need to log in to Globus in order to retrieve this data. User accounts are free of charge with several options for signing on. Instructions for creating an account are on the login page.
Whole genome sequence data for Bovidae Bos taurus - beef Angus. The data is in \"fastq\" format.
\nThe National Animal Germplasm Program has germplasm for this animal, with the repository number 20774.
\nThere are two versions of each file because we did paired end sequencing. There are two reads for each of the 210 data lines (a forward and a reverse read) summing to 420 total. A diagram of this is provided in the Collection Dataset. In the diagram, the two reads would correspond to read 1 and read 3.
Resource Title: Animal 20774 Sequence Data - SCINet.
File Name: Web Page, url: https://app.globus.org/file-manager?destination_id=e5391440-1d5e-11ec-a0a0-6b21ca6daf73&destination_path=/node32111/
tar file containing 14 files. The files are:\nRAPiD-Genomics_F112_CSU_136201_P001_WB02_i5-515_i7-110_S14_L003_R1_001.fastq.gz\nRAPiD-Genomics_F112_CSU_136201_P001_WB02_i5-515_i7-110_S14_L003_R2_001.fastq.gz\nRAPiD-Genomics-F113-CSU-136201-P001-WB02-i5-515-i7-110_S14_L001_R1_001.fastq.gz\nRAPiD-Genomics-F113-CSU-136201-P001-WB02-i5-515-i7-110_S14_L001_R2_001.fastq.gz\nRAPiD-Genomics-F113-CSU-136201-P001-WB02-i5-515-i7-110_S150_L002_R1_001.fastq.gz\nRAPiD-Genomics-F113-CSU-136201-P001-WB02-i5-515-i7-110_S150_L002_R2_001.fastq.gz\nRAPiD-Genomics-F114-CSU-136201-P001-WB02-i5-515-i7-110_S14_L003_R1_001.fastq.gz\nRAPiD-Genomics-F114-CSU-136201-P001-WB02-i5-515-i7-110_S14_L003_R2_001.fastq.gz\nRAPiD-Genomics_F115_CSU_136201_P001_WB02_i5-515_i7-110_S14_L001_R1_001.fastq.gz\nRAPiD-Genomics_F115_CSU_136201_P001_WB02_i5-515_i7-110_S14_L001_R2_001.fastq.gz\nRAPiD-Genomics_F115_CSU_136201_P001_WB02_i5-515_i7-110_S14_L002_R1_001.fastq.gz\nRAPiD-Genomics_F115_CSU_136201_P001_WB02_i5-515_i7-110_S14_L002_R2_001.fastq.gz\nRAPiD-Genomics_F116_CSU_136201_P001_WB02_i5-515_i7-110_S369_L002_R1_001.fastq.gz\nRAPiD-Genomics_F116_CSU_136201_P001_WB02_i5-515_i7-110_S369_L002_R2_001.fastq.gz
\nThe .tar file can be accessed/retrieved with valid SCINet account at this location: /KEEP/ADCdatastorage/NAL/published/node32111/
\nSee the SCINet File Transfer guide for more information on moving large files: https://scinet.usda.gov/guides/data/datatransfer
\nGlobus users:\nThe files can also be accessed through Globus by following this data link.The user will need to log in to Globus in order to retrieve this data. User accounts are free of charge with several options for signing on. Instructions for creating an account are on the login page.
Whole genome sequence data for Bovidae Bos taurus - beef Angus. The data is in \"fastq\" format.
\nThe National Animal Germplasm Program has germplasm for this animal, with the repository number 20783.
\nThere are two versions of each file because we did paired end sequencing. There are two reads for each of the 210 data lines (a forward and a reverse read) summing to 420 total. A diagram of this is provided in the Collection Dataset. In the diagram, the two reads would correspond to read 1 and read 3.
Resource Title: Animal 20783 Sequence Data - SCINet.
File Name: Web Page, url: https://app.globus.org/file-manager?destination_id=e5391440-1d5e-11ec-a0a0-6b21ca6daf73&destination_path=/node32117/
tar file containing 14 files. The files are:\nRAPiD-Genomics_F112_CSU_136201_P001_WB03_i5-515_i7-111_S15_L003_R1_001.fastq.gz\nRAPiD-Genomics_F112_CSU_136201_P001_WB03_i5-515_i7-111_S15_L003_R2_001.fastq.gz\nRAPiD-Genomics-F113-CSU-136201-P001-WB03-i5-515-i7-111_S151_L002_R1_001.fastq.gz\nRAPiD-Genomics-F113-CSU-136201-P001-WB03-i5-515-i7-111_S151_L002_R2_001.fastq.gz\nRAPiD-Genomics-F113-CSU-136201-P001-WB03-i5-515-i7-111_S15_L001_R1_001.fastq.gz\nRAPiD-Genomics-F113-CSU-136201-P001-WB03-i5-515-i7-111_S15_L001_R2_001.fastq.gz\nRAPiD-Genomics-F114-CSU-136201-P001-WB03-i5-515-i7-111_S15_L003_R1_001.fastq.gz\nRAPiD-Genomics-F114-CSU-136201-P001-WB03-i5-515-i7-111_S15_L003_R2_001.fastq.gz\nRAPiD-Genomics_F115_CSU_136201_P001_WB03_i5-515_i7-111_S15_L001_R1_001.fastq.gz\nRAPiD-Genomics_F115_CSU_136201_P001_WB03_i5-515_i7-111_S15_L001_R2_001.fastq.gz\nRAPiD-Genomics_F115_CSU_136201_P001_WB03_i5-515_i7-111_S15_L002_R1_001.fastq.gz\nRAPiD-Genomics_F115_CSU_136201_P001_WB03_i5-515_i7-111_S15_L002_R2_001.fastq.gz\nRAPiD-Genomics_F116_CSU_136201_P001_WB03_i5-515_i7-111_S370_L002_R1_001.fastq.gz\nRAPiD-Genomics_F116_CSU_136201_P001_WB03_i5-515_i7-111_S370_L002_R2_001.fastq.gz
\nThe .tar file can be accessed/retrieved with valid SCINet account at this location: /KEEP/ADCdatastorage/NAL/published/node32117/
\nSee the SCINet File Transfer guide for more information on moving large files: https://scinet.usda.gov/guides/data/datatransfer
\nGlobus users:\nThe files can also be accessed through Globus by following this data link.The user will need to log in to Globus in order to retrieve this data. User accounts are free of charge with several options for signing on. Instructions for creating an account are on the login page.
Whole genome sequence data for Bovidae Bos taurus - beef Angus. The data is in \"fastq\" format.
\nThe National Animal Germplasm Program has germplasm for this animal, with the repository number 20786.
\nThere are two versions of each file because we did paired end sequencing. There are two reads for each of the 210 data lines (a forward and a reverse read) summing to 420 total. A diagram of this is provided in the Collection Dataset. In the diagram, the two reads would correspond to read 1 and read 3.
Resource Title: Animal 20786 Sequence Data - SCINet.
File Name: Web Page, url: https://app.globus.org/file-manager?destination_id=e5391440-1d5e-11ec-a0a0-6b21ca6daf73&destination_path=/node32119/
tar file containing 14 files. The files are:\nRAPiD-Genomics_F112_CSU_136201_P001_WB04_i5-515_i7-112_S16_L003_R1_001.fastq.gz\nRAPiD-Genomics_F112_CSU_136201_P001_WB04_i5-515_i7-112_S16_L003_R2_001.fastq.gz\nRAPiD-Genomics-F113-CSU-136201-P001-WB04-i5-515-i7-112_S152_L002_R1_001.fastq.gz\nRAPiD-Genomics-F113-CSU-136201-P001-WB04-i5-515-i7-112_S152_L002_R2_001.fastq.gz\nRAPiD-Genomics-F113-CSU-136201-P001-WB04-i5-515-i7-112_S16_L001_R1_001.fastq.gz\nRAPiD-Genomics-F113-CSU-136201-P001-WB04-i5-515-i7-112_S16_L001_R2_001.fastq.gz\nRAPiD-Genomics-F114-CSU-136201-P001-WB04-i5-515-i7-112_S16_L003_R1_001.fastq.gz\nRAPiD-Genomics-F114-CSU-136201-P001-WB04-i5-515-i7-112_S16_L003_R2_001.fastq.gz\nRAPiD-Genomics_F115_CSU_136201_P001_WB04_i5-515_i7-112_S16_L001_R1_001.fastq.gz\nRAPiD-Genomics_F115_CSU_136201_P001_WB04_i5-515_i7-112_S16_L001_R2_001.fastq.gz\nRAPiD-Genomics_F115_CSU_136201_P001_WB04_i5-515_i7-112_S16_L002_R1_001.fastq.gz\nRAPiD-Genomics_F115_CSU_136201_P001_WB04_i5-515_i7-112_S16_L002_R2_001.fastq.gz\nRAPiD-Genomics_F116_CSU_136201_P001_WB04_i5-515_i7-112_S371_L002_R1_001.fastq.gz\nRAPiD-Genomics_F116_CSU_136201_P001_WB04_i5-515_i7-112_S371_L002_R2_001.fastq.gz
\nThe .tar file can be accessed/retrieved with valid SCINet account at this location: /KEEP/ADCdatastorage/NAL/published/node32119/
\nSee the SCINet File Transfer guide for more information on moving large files: https://scinet.usda.gov/guides/data/datatransfer
\nGlobus users:\nThe files can also be accessed through Globus by following this data link.The user will need to log in to Globus in order to retrieve this data. User accounts are free of charge with several options for signing on. Instructions for creating an account are on the login page.
Whole genome sequence data for Bovidae Bos taurus - beef Angus. The data is in \"fastq\" format.
\nThe National Animal Germplasm Program has germplasm for this animal, with the repository number 20816.
\nThere are two versions of each file because we did paired end sequencing. There are two reads for each of the 210 data lines (a forward and a reverse read) summing to 420 total. A diagram of this is provided in the Collection Dataset\n. In the diagram, the two reads would correspond to read 1 and read 3.
Resource Title: Animal 20816 Sequence Data - SCINet .
File Name: Web Page, url: https://app.globus.org/file-manager?destination_id=e5391440-1d5e-11ec-a0a0-6b21ca6daf73&destination_path=/node32121/
tar file containing 14 files. The files are:\nRAPiD-Genomics_F112_CSU_136201_P001_WB05_i5-515_i7-113_S17_L003_R1_001.fastq.gz\nRAPiD-Genomics_F112_CSU_136201_P001_WB05_i5-515_i7-113_S17_L003_R2_001.fastq.gz\nRAPiD-Genomics-F113-CSU-136201-P001-WB05-i5-515-i7-113_S153_L002_R1_001.fastq.gz\nRAPiD-Genomics-F113-CSU-136201-P001-WB05-i5-515-i7-113_S153_L002_R2_001.fastq.gz\nRAPiD-Genomics-F113-CSU-136201-P001-WB05-i5-515-i7-113_S17_L001_R1_001.fastq.gz\nRAPiD-Genomics-F113-CSU-136201-P001-WB05-i5-515-i7-113_S17_L001_R2_001.fastq.gz\nRAPiD-Genomics-F114-CSU-136201-P001-WB05-i5-515-i7-113_S17_L003_R1_001.fastq.gz\nRAPiD-Genomics-F114-CSU-136201-P001-WB05-i5-515-i7-113_S17_L003_R2_001.fastq.gz\nRAPiD-Genomics_F115_CSU_136201_P001_WB05_i5-515_i7-113_S17_L001_R1_001.fastq.gz\nRAPiD-Genomics_F115_CSU_136201_P001_WB05_i5-515_i7-113_S17_L001_R2_001.fastq.gz\nRAPiD-Genomics_F115_CSU_136201_P001_WB05_i5-515_i7-113_S17_L002_R1_001.fastq.gz\nRAPiD-Genomics_F115_CSU_136201_P001_WB05_i5-515_i7-113_S17_L002_R2_001.fastq.gz\nRAPiD-Genomics_F116_CSU_136201_P001_WB05_i5-515_i7-113_S372_L002_R1_001.fastq.gz\nRAPiD-Genomics_F116_CSU_136201_P001_WB05_i5-515_i7-113_S372_L002_R2_001.fastq.gz
\nThe .tar file can be accessed/retrieved with valid SCINet account at this location: /KEEP/ADCdatastorage/NAL/published/node32121/
\nSee the SCINet File Transfer guide for more information on moving large files: https://scinet.usda.gov/guides/data/datatransfer
\nGlobus users:\nThe files can also be accessed through Globus by following this data link.The user will need to log in to Globus in order to retrieve this data. User accounts are free of charge with several options for signing on. Instructions for creating an account are on the login page.
Whole genome sequence data for Bovidae Bos taurus - beef Angus. The data is in \"fastq\" format.
\nThe National Animal Germplasm Program has germplasm for this animal, with the repository number 20834.
\nThere are two versions of each file because we did paired end sequencing. There are two reads for each of the 210 data lines (a forward and a reverse read) summing to 420 total. A diagram of this is provided in the Collection Dataset. In the diagram, the two reads would correspond to read 1 and read 3.
Resource Title: Animal 20834 Sequence Data - SCINet .
File Name: Web Page, url: https://app.globus.org/file-manager?destination_id=e5391440-1d5e-11ec-a0a0-6b21ca6daf73&destination_path=/node32123/
tar file containing 14 files. The files are:\nRAPiD-Genomics_F112_CSU_136201_P001_WB06_i5-515_i7-114_S18_L003_R1_001.fastq.gz\nRAPiD-Genomics_F112_CSU_136201_P001_WB06_i5-515_i7-114_S18_L003_R2_001.fastq.gz\nRAPiD-Genomics-F113-CSU-136201-P001-WB06-i5-515-i7-114_S154_L002_R1_001.fastq.gz\nRAPiD-Genomics-F113-CSU-136201-P001-WB06-i5-515-i7-114_S154_L002_R2_001.fastq.gz\nRAPiD-Genomics-F113-CSU-136201-P001-WB06-i5-515-i7-114_S18_L001_R1_001.fastq.gz\nRAPiD-Genomics-F113-CSU-136201-P001-WB06-i5-515-i7-114_S18_L001_R2_001.fastq.gz\nRAPiD-Genomics-F114-CSU-136201-P001-WB06-i5-515-i7-114_S18_L003_R1_001.fastq.gz\nRAPiD-Genomics-F114-CSU-136201-P001-WB06-i5-515-i7-114_S18_L003_R2_001.fastq.gz\nRAPiD-Genomics_F115_CSU_136201_P001_WB06_i5-515_i7-114_S18_L001_R1_001.fastq.gz\nRAPiD-Genomics_F115_CSU_136201_P001_WB06_i5-515_i7-114_S18_L001_R2_001.fastq.gz\nRAPiD-Genomics_F115_CSU_136201_P001_WB06_i5-515_i7-114_S18_L002_R1_001.fastq.gz\nRAPiD-Genomics_F115_CSU_136201_P001_WB06_i5-515_i7-114_S18_L002_R2_001.fastq.gz\nRAPiD-Genomics_F116_CSU_136201_P001_WB06_i5-515_i7-114_S373_L002_R1_001.fastq.gz\nRAPiD-Genomics_F116_CSU_136201_P001_WB06_i5-515_i7-114_S373_L002_R2_001.fastq.gz
\nThe .tar file can be accessed/retrieved with valid SCINet account at this location: /KEEP/ADCdatastorage/NAL/published/node32123/
\nSee the SCINet File Transfer guide for more information on moving large files: https://scinet.usda.gov/guides/data/datatransfer
\nGlobus users:\nThe files can also be accessed through Globus by following this data link.The user will need to log in to Globus in order to retrieve this data. User accounts are free of charge with several options for signing on. Instructions for creating an account are on the login page.
Whole genome sequence data for Bovidae Bos taurus - beef Angus. The data is in \"fastq\" format.
\nThe National Animal Germplasm Program has germplasm for this animal, with the repository number 20841.
\nThere are two versions of each file because we did paired end sequencing. There are two reads for each of the 210 data lines (a forward and a reverse read) summing to 420 total. A diagram of this is provided in the Collection Dataset. In the diagram, the two reads would correspond to read 1 and read 3.
Resource Title: Animal 20841 Sequence Data - SCINet .
File Name: Web Page, url: https://app.globus.org/file-manager?destination_id=e5391440-1d5e-11ec-a0a0-6b21ca6daf73&destination_path=/node32125/
tar file containing 14 files. The files are:\nRAPiD-Genomics_F112_CSU_136201_P001_WB07_i5-515_i7-115_S19_L003_R1_001.fastq.gz\nRAPiD-Genomics_F112_CSU_136201_P001_WB07_i5-515_i7-115_S19_L003_R2_001.fastq.gz\nRAPiD-Genomics-F113-CSU-136201-P001-WB07-i5-515-i7-115_S155_L002_R1_001.fastq.gz\nRAPiD-Genomics-F113-CSU-136201-P001-WB07-i5-515-i7-115_S155_L002_R2_001.fastq.gz\nRAPiD-Genomics-F113-CSU-136201-P001-WB07-i5-515-i7-115_S19_L001_R1_001.fastq.gz\nRAPiD-Genomics-F113-CSU-136201-P001-WB07-i5-515-i7-115_S19_L001_R2_001.fastq.gz\nRAPiD-Genomics-F114-CSU-136201-P001-WB07-i5-515-i7-115_S19_L003_R1_001.fastq.gz\nRAPiD-Genomics-F114-CSU-136201-P001-WB07-i5-515-i7-115_S19_L003_R2_001.fastq.gz\nRAPiD-Genomics_F115_CSU_136201_P001_WB07_i5-515_i7-115_S19_L001_R1_001.fastq.gz\nRAPiD-Genomics_F115_CSU_136201_P001_WB07_i5-515_i7-115_S19_L001_R2_001.fastq.gz\nRAPiD-Genomics_F115_CSU_136201_P001_WB07_i5-515_i7-115_S19_L002_R1_001.fastq.gz\nRAPiD-Genomics_F115_CSU_136201_P001_WB07_i5-515_i7-115_S19_L002_R2_001.fastq.gz\nRAPiD-Genomics_F116_CSU_136201_P001_WB07_i5-515_i7-115_S374_L002_R1_001.fastq.gz\nRAPiD-Genomics_F116_CSU_136201_P001_WB07_i5-515_i7-115_S374_L002_R2_001.fastq.gz
\nThe .tar file can be accessed/retrieved with valid SCINet account at this location: /KEEP/ADCdatastorage/NAL/published/node32125/
\nSee the SCINet File Transfer guide for more information on moving large files: https://scinet.usda.gov/guides/data/datatransfer
\nGlobus users:\nThe files can also be accessed through Globus by following this data link.The user will need to log in to Globus in order to retrieve this data. User accounts are free of charge with several options for signing on. Instructions for creating an account are on the login page.
Whole genome sequence data for Bovidae Bos taurus - beef Angus. The data is in \"fastq\" format.
\nThe National Animal Germplasm Program has germplasm for this animal, with the repository number 24266.
\nThere are two versions of each file because we did paired end sequencing. There are two reads for each of the 210 data lines (a forward and a reverse read) summing to 420 total. A diagram of this is provided in the Collection Dataset. In the diagram, the two reads would correspond to read 1 and read 3.
Resource Title: Animal 24266 Sequence Data - SCINet.
File Name: Web Page, url: https://app.globus.org/file-manager?destination_id=e5391440-1d5e-11ec-a0a0-6b21ca6daf73&destination_path=/node32127/
tar file containing 14 files. The files are:\nRAPiD-Genomics_F112_CSU_136201_P001_WB08_i5-515_i7-116_S20_L003_R1_001.fastq.gz\nRAPiD-Genomics_F112_CSU_136201_P001_WB08_i5-515_i7-116_S20_L003_R2_001.fastq.gz\nRAPiD-Genomics-F113-CSU-136201-P001-WB08-i5-515-i7-116_S156_L002_R1_001.fastq.gz\nRAPiD-Genomics-F113-CSU-136201-P001-WB08-i5-515-i7-116_S156_L002_R2_001.fastq.gz\nRAPiD-Genomics-F113-CSU-136201-P001-WB08-i5-515-i7-116_S20_L001_R1_001.fastq.gz\nRAPiD-Genomics-F113-CSU-136201-P001-WB08-i5-515-i7-116_S20_L001_R2_001.fastq.gz\nRAPiD-Genomics-F114-CSU-136201-P001-WB08-i5-515-i7-116_S20_L003_R1_001.fastq.gz\nRAPiD-Genomics-F114-CSU-136201-P001-WB08-i5-515-i7-116_S20_L003_R2_001.fastq.gz\nRAPiD-Genomics_F115_CSU_136201_P001_WB08_i5-515_i7-116_S20_L001_R1_001.fastq.gz\nRAPiD-Genomics_F115_CSU_136201_P001_WB08_i5-515_i7-116_S20_L001_R2_001.fastq.gz\nRAPiD-Genomics_F115_CSU_136201_P001_WB08_i5-515_i7-116_S20_L002_R1_001.fastq.gz\nRAPiD-Genomics_F115_CSU_136201_P001_WB08_i5-515_i7-116_S20_L002_R2_001.fastq.gz\nRAPiD-Genomics_F116_CSU_136201_P001_WB08_i5-515_i7-116_S375_L002_R1_001.fastq.gz\nRAPiD-Genomics_F116_CSU_136201_P001_WB08_i5-515_i7-116_S375_L002_R2_001.fastq.gz
\nThe .tar file can be accessed/retrieved with valid SCINet account at this location: /KEEP/ADCdatastorage/NAL/published/node32127/
\nSee the SCINet File Transfer guide for more information on moving large files: https://scinet.usda.gov/guides/data/datatransfer
\nGlobus users:\nThe files can also be accessed through Globus by following this data link.The user will need to log in to Globus in order to retrieve this data. User accounts are free of charge with several options for signing on. Instructions for creating an account are on the login page.
Whole genome sequence data for Bovidae Bos taurus - beef Angus. The data is in \"fastq\" format.
\nThe National Animal Germplasm Program has germplasm for this animal, with the repository number 29443.
\nThere are two versions of each file because we did paired end sequencing. There are two reads for each of the 210 data lines (a forward and a reverse read) summing to 420 total. A diagram of this is provided in the Collection Dataset. In the diagram, the two reads would correspond to read 1 and read 3.
Resource Title: Animal 29443 Sequence Data - SCINet.
File Name: Web Page, url: https://app.globus.org/file-manager?destination_id=e5391440-1d5e-11ec-a0a0-6b21ca6daf73&destination_path=/node32129/
tar file containing 14 files. The files are:\nRAPiD-Genomics_F112_CSU_136201_P001_WB09_i5-515_i7-117_S21_L003_R1_001.fastq.gz\nRAPiD-Genomics_F112_CSU_136201_P001_WB09_i5-515_i7-117_S21_L003_R2_001.fastq.gz\nRAPiD-Genomics-F113-CSU-136201-P001-WB09-i5-515-i7-117_S157_L002_R1_001.fastq.gz\nRAPiD-Genomics-F113-CSU-136201-P001-WB09-i5-515-i7-117_S157_L002_R2_001.fastq.gz\nRAPiD-Genomics-F113-CSU-136201-P001-WB09-i5-515-i7-117_S21_L001_R1_001.fastq.gz\nRAPiD-Genomics-F113-CSU-136201-P001-WB09-i5-515-i7-117_S21_L001_R2_001.fastq.gz\nRAPiD-Genomics-F114-CSU-136201-P001-WB09-i5-515-i7-117_S21_L003_R1_001.fastq.gz\nRAPiD-Genomics-F114-CSU-136201-P001-WB09-i5-515-i7-117_S21_L003_R2_001.fastq.gz\nRAPiD-Genomics_F115_CSU_136201_P001_WB09_i5-515_i7-117_S21_L001_R1_001.fastq.gz\nRAPiD-Genomics_F115_CSU_136201_P001_WB09_i5-515_i7-117_S21_L001_R2_001.fastq.gz\nRAPiD-Genomics_F115_CSU_136201_P001_WB09_i5-515_i7-117_S21_L002_R1_001.fastq.gz\nRAPiD-Genomics_F115_CSU_136201_P001_WB09_i5-515_i7-117_S21_L002_R2_001.fastq.gz\nRAPiD-Genomics_F116_CSU_136201_P001_WB09_i5-515_i7-117_S376_L002_R1_001.fastq.gz\nRAPiD-Genomics_F116_CSU_136201_P001_WB09_i5-515_i7-117_S376_L002_R2_001.fastq.gz
\nThe .tar file can be accessed/retrieved with valid SCINet account at this location: /KEEP/ADCdatastorage/NAL/published/node32129/
\nSee the SCINet File Transfer guide for more information on moving large files: https://scinet.usda.gov/guides/data/datatransfer
\nGlobus users:\nThe files can also be accessed through Globus by following this data link.The user will need to log in to Globus in order to retrieve this data. User accounts are free of charge with several options for signing on. Instructions for creating an account are on the login page.
Whole genome sequence data for Bovidae Bos taurus - beef Angus. The data is in \"fastq\" format.
\nThe National Animal Germplasm Program has germplasm for this animal, with the repository number 29451.
\nThere are two versions of each file because we did paired end sequencing. There are two reads for each of the 210 data lines (a forward and a reverse read) summing to 420 total. A diagram of this is provided in the Collection Dataset. In the diagram, the two reads would correspond to read 1 and read 3.
Resource Title: Animal 29451 Sequence Data - SCINet .
File Name: Web Page, url: https://app.globus.org/file-manager?destination_id=e5391440-1d5e-11ec-a0a0-6b21ca6daf73&destination_path=/node32131/
tar file containing 14 files. The files are:\nRAPiD-Genomics_F112_CSU_136201_P001_WB10_i5-515_i7-118_S22_L003_R1_001.fastq.gz\nRAPiD-Genomics_F112_CSU_136201_P001_WB10_i5-515_i7-118_S22_L003_R2_001.fastq.gz\nRAPiD-Genomics-F113-CSU-136201-P001-WB10-i5-515-i7-118_S158_L002_R1_001.fastq.gz\nRAPiD-Genomics-F113-CSU-136201-P001-WB10-i5-515-i7-118_S158_L002_R2_001.fastq.gz\nRAPiD-Genomics-F113-CSU-136201-P001-WB10-i5-515-i7-118_S22_L001_R1_001.fastq.gz\nRAPiD-Genomics-F113-CSU-136201-P001-WB10-i5-515-i7-118_S22_L001_R2_001.fastq.gz\nRAPiD-Genomics-F114-CSU-136201-P001-WB10-i5-515-i7-118_S22_L003_R1_001.fastq.gz\nRAPiD-Genomics-F114-CSU-136201-P001-WB10-i5-515-i7-118_S22_L003_R2_001.fastq.gz\nRAPiD-Genomics_F115_CSU_136201_P001_WB10_i5-515_i7-118_S22_L001_R1_001.fastq.gz\nRAPiD-Genomics_F115_CSU_136201_P001_WB10_i5-515_i7-118_S22_L001_R2_001.fastq.gz\nRAPiD-Genomics_F115_CSU_136201_P001_WB10_i5-515_i7-118_S22_L002_R1_001.fastq.gz\nRAPiD-Genomics_F115_CSU_136201_P001_WB10_i5-515_i7-118_S22_L002_R2_001.fastq.gz\nRAPiD-Genomics_F116_CSU_136201_P001_WB10_i5-515_i7-118_S377_L002_R1_001.fastq.gz\nRAPiD-Genomics_F116_CSU_136201_P001_WB10_i5-515_i7-118_S377_L002_R2_001.fastq.gz
\nThe .tar file can be accessed/retrieved with valid SCINet account at this location: /KEEP/ADCdatastorage/NAL/published/node32131/
\nSee the SCINet File Transfer guide for more information on moving large files: https://scinet.usda.gov/guides/data/datatransfer
\nGlobus users:\nThe files can also be accessed through Globus by following this data link.The user will need to log in to Globus in order to retrieve this data. User accounts are free of charge with several options for signing on. Instructions for creating an account are on the login page.\n
Whole genome sequence data for Bovidae Bos taurus - beef Angus. The data is in \"fastq\" format.
\nThe National Animal Germplasm Program does not have germplasm for this animal.
\nThere are two versions of each file because we did paired end sequencing. There are two reads for each of the 210 data lines (a forward and a reverse read) summing to 420 total. A diagram of this is provided in the Collection Dataset. In the diagram, the two reads would correspond to read 1 and read 3.
Resource Title: Animal 400-1 Sequence Data - SCINet .
File Name: Web Page, url: https://app.globus.org/file-manager?destination_id=e5391440-1d5e-11ec-a0a0-6b21ca6daf73&destination_path=/node33206/
tar file containing 14 files. The files are:\nRAPiD-Genomics_F112_CSU_136201_P001_WA05_i5-515_i7-101_S5_L003_R1_001.fastq.gz\nRAPiD-Genomics_F112_CSU_136201_P001_WA05_i5-515_i7-101_S5_L003_R2_001.fastq.gz\nRAPiD-Genomics-F113-CSU-136201-P001-WA05-i5-515-i7-101_S141_L002_R1_001.fastq.gz\nRAPiD-Genomics-F113-CSU-136201-P001-WA05-i5-515-i7-101_S141_L002_R2_001.fastq.gz\nRAPiD-Genomics-F113-CSU-136201-P001-WA05-i5-515-i7-101_S5_L001_R1_001.fastq.gz\nRAPiD-Genomics-F113-CSU-136201-P001-WA05-i5-515-i7-101_S5_L001_R2_001.fastq.gz\nRAPiD-Genomics-F114-CSU-136201-P001-WA05-i5-515-i7-101_S5_L003_R1_001.fastq.gz\nRAPiD-Genomics-F114-CSU-136201-P001-WA05-i5-515-i7-101_S5_L003_R2_001.fastq.gz\nRAPiD-Genomics_F115_CSU_136201_P001_WA05_i5-515_i7-101_S5_L001_R1_001.fastq.gz\nRAPiD-Genomics_F115_CSU_136201_P001_WA05_i5-515_i7-101_S5_L001_R2_001.fastq.gz\nRAPiD-Genomics_F115_CSU_136201_P001_WA05_i5-515_i7-101_S5_L002_R1_001.fastq.gz\nRAPiD-Genomics_F115_CSU_136201_P001_WA05_i5-515_i7-101_S5_L002_R2_001.fastq.gz\nRAPiD-Genomics_F116_CSU_136201_P001_WA05_i5-515_i7-101_S360_L002_R1_001.fastq.gz\nRAPiD-Genomics_F116_CSU_136201_P001_WA05_i5-515_i7-101_S360_L002_R2_001.fastq.gz
\nThe .tar file can be accessed/retrieved with valid SCINet account at this location: /KEEP/ADCdatastorage/NAL/published/node33206/400-1.tar
\nSee the SCINet File Transfer guide for more information on moving large files: https://scinet.usda.gov/guides/data/datatransfer
\nGlobus users:\nThe files can also be accessed through Globus by following this data link.The user will need to log in to Globus in order to retrieve this data. User accounts are free of charge with several options for signing on. Instructions for creating an account are on the login page.\n
Whole genome sequence data for Bovidae Bos taurus - beef Angus. The data is in \"fastq\" format.
\nThe National Animal Germplasm Program has germplasm for this animal, with the repository number 44462.
\nThere are two versions of each file because we did paired end sequencing. There are two reads for each of the 210 data lines (a forward and a reverse read) summing to 420 total. A diagram of this is provided in the Collection Dataset. In the diagram, the two reads would correspond to read 1 and read 3.
Resource Title: Animal 44462 Sequence Data - SCINet.
File Name: Web Page, url: https://app.globus.org/file-manager?destination_id=e5391440-1d5e-11ec-a0a0-6b21ca6daf73&destination_path=/node32133/
tar file containing 14 files. The files are:\nRAPiD-Genomics_F112_CSU_136201_P001_WB11_i5-515_i7-119_S23_L003_R1_001.fastq.gz\nRAPiD-Genomics_F112_CSU_136201_P001_WB11_i5-515_i7-119_S23_L003_R2_001.fastq.gz\nRAPiD-Genomics-F113-CSU-136201-P001-WB11-i5-515-i7-119_S159_L002_R1_001.fastq.gz\nRAPiD-Genomics-F113-CSU-136201-P001-WB11-i5-515-i7-119_S159_L002_R2_001.fastq.gz\nRAPiD-Genomics-F113-CSU-136201-P001-WB11-i5-515-i7-119_S23_L001_R1_001.fastq.gz\nRAPiD-Genomics-F113-CSU-136201-P001-WB11-i5-515-i7-119_S23_L001_R2_001.fastq.gz\nRAPiD-Genomics-F114-CSU-136201-P001-WB11-i5-515-i7-119_S23_L003_R1_001.fastq.gz\nRAPiD-Genomics-F114-CSU-136201-P001-WB11-i5-515-i7-119_S23_L003_R2_001.fastq.gz\nRAPiD-Genomics_F115_CSU_136201_P001_WB11_i5-515_i7-119_S23_L001_R1_001.fastq.gz\nRAPiD-Genomics_F115_CSU_136201_P001_WB11_i5-515_i7-119_S23_L001_R2_001.fastq.gz\nRAPiD-Genomics_F115_CSU_136201_P001_WB11_i5-515_i7-119_S23_L002_R1_001.fastq.gz\nRAPiD-Genomics_F115_CSU_136201_P001_WB11_i5-515_i7-119_S23_L002_R2_001.fastq.gz\nRAPiD-Genomics_F116_CSU_136201_P001_WB11_i5-515_i7-119_S378_L002_R1_001.fastq.gz\nRAPiD-Genomics_F116_CSU_136201_P001_WB11_i5-515_i7-119_S378_L002_R2_001.fastq.gz
\nThe .tar file can be accessed/retrieved with valid SCINet account at this location: /KEEP/ADCdatastorage/NAL/published/node32133/44462.tar
\nSee the SCINet File Transfer guide for more information on moving large files: https://scinet.usda.gov/guides/data/datatransfer
\nGlobus users:\nThe files can also be accessed through Globus by following this data link.The user will need to log in to Globus in order to retrieve this data. User accounts are free of charge with several options for signing on. Instructions for creating an account are on the login page.
Whole genome sequence data for Bovidae Bos taurus - beef Angus. The data is in \"fastq\" format.
\nThe National Animal Germplasm Program has germplasm for this animal, with the repository number 44542.
\nThere are two versions of each file because we did paired end sequencing. There are two reads for each of the 210 data lines (a forward and a reverse read) summing to 420 total. A diagram of this is provided in the Collection Dataset. In the diagram, the two reads would correspond to read 1 and read 3.
Resource Title: Animal 44542 Sequence Data - SCINet .
File Name: Web Page, url: https://app.globus.org/file-manager?destination_id=e5391440-1d5e-11ec-a0a0-6b21ca6daf73&destination_path=/node32135/
tar file containing 14 files. The files are:\nRAPiD-Genomics_F112_CSU_136201_P001_WB12_i5-515_i7-120_S24_L003_R1_001.fastq.gz\nRAPiD-Genomics_F112_CSU_136201_P001_WB12_i5-515_i7-120_S24_L003_R2_001.fastq.gz\nRAPiD-Genomics-F113-CSU-136201-P001-WB12-i5-515-i7-120_S160_L002_R1_001.fastq.gz\nRAPiD-Genomics-F113-CSU-136201-P001-WB12-i5-515-i7-120_S160_L002_R2_001.fastq.gz\nRAPiD-Genomics-F113-CSU-136201-P001-WB12-i5-515-i7-120_S24_L001_R1_001.fastq.gz\nRAPiD-Genomics-F113-CSU-136201-P001-WB12-i5-515-i7-120_S24_L001_R2_001.fastq.gz\nRAPiD-Genomics-F114-CSU-136201-P001-WB12-i5-515-i7-120_S24_L003_R1_001.fastq.gz\nRAPiD-Genomics-F114-CSU-136201-P001-WB12-i5-515-i7-120_S24_L003_R2_001.fastq.gz\nRAPiD-Genomics_F115_CSU_136201_P001_WB12_i5-515_i7-120_S24_L001_R1_001.fastq.gz\nRAPiD-Genomics_F115_CSU_136201_P001_WB12_i5-515_i7-120_S24_L001_R2_001.fastq.gz\nRAPiD-Genomics_F115_CSU_136201_P001_WB12_i5-515_i7-120_S24_L002_R1_001.fastq.gz\nRAPiD-Genomics_F115_CSU_136201_P001_WB12_i5-515_i7-120_S24_L002_R2_001.fastq.gz\nRAPiD-Genomics_F116_CSU_136201_P001_WB12_i5-515_i7-120_S379_L002_R1_001.fastq.gz\nRAPiD-Genomics_F116_CSU_136201_P001_WB12_i5-515_i7-120_S379_L002_R2_001.fastq.gz
\nThe .tar file can be accessed/retrieved with valid SCINet account at this location: /KEEP/ADCdatastorage/NAL/published/node32135/44542.tar
\nSee the SCINet File Transfer guide for more information on moving large files: https://scinet.usda.gov/guides/data/datatransfer
\nGlobus users:\nThe files can also be accessed through Globus by following this data link.The user will need to log in to Globus in order to retrieve this data. User accounts are free of charge with several options for signing on. Instructions for creating an account are on the login page.
Whole genome sequence data for Bovidae Bos taurus - beef Angus. The data is in \"fastq\" format.
\nThe National Animal Germplasm Program has germplasm for this animal, with the repository number 44718.
\nThere are two versions of each file because we did paired end sequencing. There are two reads for each of the 210 data lines (a forward and a reverse read) summing to 420 total. A diagram of this is provided in the Collection Dataset\n. In the diagram, the two reads would correspond to read 1 and read 3.
Resource Title: Animal 44718 Sequence Data - SCINet.
File Name: Web Page, url: https://app.globus.org/file-manager?destination_id=e5391440-1d5e-11ec-a0a0-6b21ca6daf73&destination_path=/node32137/
tar file containing 14 files. The files are:\nRAPiD-Genomics_F112_CSU_136201_P001_WC01_i5-515_i7-121_S25_L003_R1_001.fastq.gz\nRAPiD-Genomics_F112_CSU_136201_P001_WC01_i5-515_i7-121_S25_L003_R2_001.fastq.gz\nRAPiD-Genomics-F113-CSU-136201-P001-WC01-i5-515-i7-121_S161_L002_R1_001.fastq.gz\nRAPiD-Genomics-F113-CSU-136201-P001-WC01-i5-515-i7-121_S161_L002_R2_001.fastq.gz\nRAPiD-Genomics-F113-CSU-136201-P001-WC01-i5-515-i7-121_S25_L001_R1_001.fastq.gz\nRAPiD-Genomics-F113-CSU-136201-P001-WC01-i5-515-i7-121_S25_L001_R2_001.fastq.gz\nRAPiD-Genomics-F114-CSU-136201-P001-WC01-i5-515-i7-121_S25_L003_R1_001.fastq.gz\nRAPiD-Genomics-F114-CSU-136201-P001-WC01-i5-515-i7-121_S25_L003_R2_001.fastq.gz\nRAPiD-Genomics_F115_CSU_136201_P001_WC01_i5-515_i7-121_S25_L001_R1_001.fastq.gz\nRAPiD-Genomics_F115_CSU_136201_P001_WC01_i5-515_i7-121_S25_L001_R2_001.fastq.gz\nRAPiD-Genomics_F115_CSU_136201_P001_WC01_i5-515_i7-121_S25_L002_R1_001.fastq.gz\nRAPiD-Genomics_F115_CSU_136201_P001_WC01_i5-515_i7-121_S25_L002_R2_001.fastq.gz\nRAPiD-Genomics_F116_CSU_136201_P001_WC01_i5-515_i7-121_S380_L002_R1_001.fastq.gz\nRAPiD-Genomics_F116_CSU_136201_P001_WC01_i5-515_i7-121_S380_L002_R2_001.fastq.gz
\nThe .tar file can be accessed/retrieved with valid SCINet account at this location: /KEEP/ADCdatastorage/NAL/published/node32137/44718.tar
\nSee the SCINet File Transfer guide for more information on moving large files: https://scinet.usda.gov/guides/data/datatransfer
\nGlobus users:\nThe files can also be accessed through Globus by following this data link.The user will need to log in to Globus in order to retrieve this data. User accounts are free of charge with several options for signing on. Instructions for creating an account are on the login page.\n
Whole genome sequence data for Bovidae Bos taurus - beef Angus. The data is in \"fastq\" format.
\nThe National Animal Germplasm Program has germplasm for this animal, with the repository number 44883.
\nThere are two versions of each file because we did paired end sequencing. There are two reads for each of the 210 data lines (a forward and a reverse read) summing to 420 total. A diagram of this is provided in the Collection Dataset\n. In the diagram, the two reads would correspond to read 1 and read 3.
Resource Title: Animal 44883 Sequence Data - SCINet .
File Name: Web Page, url: https://app.globus.org/file-manager?destination_id=e5391440-1d5e-11ec-a0a0-6b21ca6daf73&destination_path=/node32139/
tar file containing 14 files. The files are:\nRAPiD-Genomics_F112_CSU_136201_P001_WC02_i5-515_i7-122_S26_L003_R1_001.fastq.gz\nRAPiD-Genomics_F112_CSU_136201_P001_WC02_i5-515_i7-122_S26_L003_R2_001.fastq.gz\nRAPiD-Genomics-F113-CSU-136201-P001-WC02-i5-515-i7-122_S162_L002_R1_001.fastq.gz\nRAPiD-Genomics-F113-CSU-136201-P001-WC02-i5-515-i7-122_S162_L002_R2_001.fastq.gz\nRAPiD-Genomics-F113-CSU-136201-P001-WC02-i5-515-i7-122_S26_L001_R1_001.fastq.gz\nRAPiD-Genomics-F113-CSU-136201-P001-WC02-i5-515-i7-122_S26_L001_R2_001.fastq.gz\nRAPiD-Genomics-F114-CSU-136201-P001-WC02-i5-515-i7-122_S26_L003_R1_001.fastq.gz\nRAPiD-Genomics-F114-CSU-136201-P001-WC02-i5-515-i7-122_S26_L003_R2_001.fastq.gz\nRAPiD-Genomics_F115_CSU_136201_P001_WC02_i5-515_i7-122_S26_L001_R1_001.fastq.gz\nRAPiD-Genomics_F115_CSU_136201_P001_WC02_i5-515_i7-122_S26_L001_R2_001.fastq.gz\nRAPiD-Genomics_F115_CSU_136201_P001_WC02_i5-515_i7-122_S26_L002_R1_001.fastq.gz\nRAPiD-Genomics_F115_CSU_136201_P001_WC02_i5-515_i7-122_S26_L002_R2_001.fastq.gz\nRAPiD-Genomics_F116_CSU_136201_P001_WC02_i5-515_i7-122_S381_L002_R1_001.fastq.gz\nRAPiD-Genomics_F116_CSU_136201_P001_WC02_i5-515_i7-122_S381_L002_R2_001.fastq.gz
\nThe .tar file can be accessed/retrieved with valid SCINet account at this location: /KEEP/ADCdatastorage/NAL/published/node32139/44883.tar
\nSee the SCINet File Transfer guide for more information on moving large files: https://scinet.usda.gov/guides/data/datatransfer
\nGlobus users:\nThe files can also be accessed through Globus by following this data link.The user will need to log in to Globus in order to retrieve this data. User accounts are free of charge with several options for signing on. Instructions for creating an account are on the login page.
Whole genome sequence data for Bovidae Bos taurus - beef Angus. The data is in \"fastq\" format.
\nThe National Animal Germplasm Program has germplasm for this animal, with the repository number 44982.
\nThere are two versions of each file because we did paired end sequencing. There are two reads for each of the 210 data lines (a forward and a reverse read) summing to 420 total. A diagram of this is provided in the Collection Dataset. In the diagram, the two reads would correspond to read 1 and read 3.
Resource Title: Animal 44982 Sequence Data - SCINet .
File Name: Web Page, url: https://app.globus.org/file-manager?destination_id=e5391440-1d5e-11ec-a0a0-6b21ca6daf73&destination_path=/node32141/
tar file containing 14 files. The files are:\nRAPiD-Genomics_F112_CSU_136201_P001_WC03_i5-515_i7-123_S27_L003_R1_001.fastq.gz\nRAPiD-Genomics_F112_CSU_136201_P001_WC03_i5-515_i7-123_S27_L003_R2_001.fastq.gz\nRAPiD-Genomics-F113-CSU-136201-P001-WC03-i5-515-i7-123_S163_L002_R1_001.fastq.gz\nRAPiD-Genomics-F113-CSU-136201-P001-WC03-i5-515-i7-123_S163_L002_R2_001.fastq.gz\nRAPiD-Genomics-F113-CSU-136201-P001-WC03-i5-515-i7-123_S27_L001_R1_001.fastq.gz\nRAPiD-Genomics-F113-CSU-136201-P001-WC03-i5-515-i7-123_S27_L001_R2_001.fastq.gz\nRAPiD-Genomics-F114-CSU-136201-P001-WC03-i5-515-i7-123_S27_L003_R1_001.fastq.gz\nRAPiD-Genomics-F114-CSU-136201-P001-WC03-i5-515-i7-123_S27_L003_R2_001.fastq.gz\nRAPiD-Genomics_F115_CSU_136201_P001_WC03_i5-515_i7-123_S27_L001_R1_001.fastq.gz\nRAPiD-Genomics_F115_CSU_136201_P001_WC03_i5-515_i7-123_S27_L001_R2_001.fastq.gz\nRAPiD-Genomics_F115_CSU_136201_P001_WC03_i5-515_i7-123_S27_L002_R1_001.fastq.gz\nRAPiD-Genomics_F115_CSU_136201_P001_WC03_i5-515_i7-123_S27_L002_R2_001.fastq.gz\nRAPiD-Genomics_F116_CSU_136201_P001_WC03_i5-515_i7-123_S382_L002_R1_001.fastq.gz\nRAPiD-Genomics_F116_CSU_136201_P001_WC03_i5-515_i7-123_S382_L002_R2_001.fastq.gz
\nThe .tar file can be accessed/retrieved with valid SCINet account at this location: /KEEP/ADCdatastorage/NAL/published/node32141/44982.tar
\nSee the SCINet File Transfer guide for more information on moving large files: https://scinet.usda.gov/guides/data/datatransfer
\nGlobus users:\nThe files can also be accessed through Globus by following this data link.The user will need to log in to Globus in order to retrieve this data. User accounts are free of charge with several options for signing on. Instructions for creating an account are on the login page.\n
Whole genome sequence data for Bovidae Bos taurus - beef Angus. The data is in \"fastq\" format.
\nThe National Animal Germplasm Program has germplasm for this animal, with the repository number 44993.
\nThere are two versions of each file because we did paired end sequencing. There are two reads for each of the 210 data lines (a forward and a reverse read) summing to 420 total. A diagram of this is provided in the Collection Dataset. In the diagram, the two reads would correspond to read 1 and read 3.
Resource Title: Animal 44993 Sequence Data - SCINet.
File Name: Web Page, url: https://app.globus.org/file-manager?destination_id=e5391440-1d5e-11ec-a0a0-6b21ca6daf73&destination_path=/node32143/
tar file containing 14 files. The files are:\nRAPiD-Genomics_F112_CSU_136201_P001_WC04_i5-515_i7-124_S28_L003_R1_001.fastq.gz\nRAPiD-Genomics_F112_CSU_136201_P001_WC04_i5-515_i7-124_S28_L003_R2_001.fastq.gz\nRAPiD-Genomics-F113-CSU-136201-P001-WC04-i5-515-i7-124_S164_L002_R1_001.fastq.gz\nRAPiD-Genomics-F113-CSU-136201-P001-WC04-i5-515-i7-124_S164_L002_R2_001.fastq.gz\nRAPiD-Genomics-F113-CSU-136201-P001-WC04-i5-515-i7-124_S28_L001_R1_001.fastq.gz\nRAPiD-Genomics-F113-CSU-136201-P001-WC04-i5-515-i7-124_S28_L001_R2_001.fastq.gz\nRAPiD-Genomics-F114-CSU-136201-P001-WC04-i5-515-i7-124_S28_L003_R1_001.fastq.gz\nRAPiD-Genomics-F114-CSU-136201-P001-WC04-i5-515-i7-124_S28_L003_R2_001.fastq.gz\nRAPiD-Genomics_F115_CSU_136201_P001_WC04_i5-515_i7-124_S28_L001_R1_001.fastq.gz\nRAPiD-Genomics_F115_CSU_136201_P001_WC04_i5-515_i7-124_S28_L001_R2_001.fastq.gz\nRAPiD-Genomics_F115_CSU_136201_P001_WC04_i5-515_i7-124_S28_L002_R1_001.fastq.gz\nRAPiD-Genomics_F115_CSU_136201_P001_WC04_i5-515_i7-124_S28_L002_R2_001.fastq.gz\nRAPiD-Genomics_F116_CSU_136201_P001_WC04_i5-515_i7-124_S383_L002_R1_001.fastq.gz\nRAPiD-Genomics_F116_CSU_136201_P001_WC04_i5-515_i7-124_S383_L002_R2_001.fastq.gz
\nThe .tar file can be accessed/retrieved with valid SCINet account at this location: /KEEP/ADCdatastorage/NAL/published/node32143/44993.tar
\nSee the SCINet File Transfer guide for more information on moving large files: https://scinet.usda.gov/guides/data/datatransfer
\nGlobus users:\nThe files can also be accessed through Globus by following this data link.The user will need to log in to Globus in order to retrieve this data. User accounts are free of charge with several options for signing on. Instructions for creating an account are on the login page.
Whole genome sequence data for Bovidae Bos taurus - beef Angus. The data is in \"fastq\" format.
\nThe National Animal Germplasm Program has germplasm for this animal, with the repository number 45052.
\nThere are two versions of each file because we did paired end sequencing. There are two reads for each of the 210 data lines (a forward and a reverse read) summing to 420 total. A diagram of this is provided in the Collection Dataset. In the diagram, the two reads would correspond to read 1 and read 3.
Resource Title: Animal 45052 Sequence Data - SCINet.
File Name: Web Page, url: https://app.globus.org/file-manager?destination_id=e5391440-1d5e-11ec-a0a0-6b21ca6daf73&destination_path=/node32145/
tar file containing 14 files. The files are:\nRAPiD-Genomics_F112_CSU_136201_P001_WC05_i5-515_i7-125_S29_L003_R1_001.fastq.gz\nRAPiD-Genomics_F112_CSU_136201_P001_WC05_i5-515_i7-125_S29_L003_R2_001.fastq.gz\nRAPiD-Genomics-F113-CSU-136201-P001-WC05-i5-515-i7-125_S165_L002_R1_001.fastq.gz\nRAPiD-Genomics-F113-CSU-136201-P001-WC05-i5-515-i7-125_S165_L002_R2_001.fastq.gz\nRAPiD-Genomics-F113-CSU-136201-P001-WC05-i5-515-i7-125_S29_L001_R1_001.fastq.gz\nRAPiD-Genomics-F113-CSU-136201-P001-WC05-i5-515-i7-125_S29_L001_R2_001.fastq.gz\nRAPiD-Genomics-F114-CSU-136201-P001-WC05-i5-515-i7-125_S29_L003_R1_001.fastq.gz\nRAPiD-Genomics-F114-CSU-136201-P001-WC05-i5-515-i7-125_S29_L003_R2_001.fastq.gz\nRAPiD-Genomics_F115_CSU_136201_P001_WC05_i5-515_i7-125_S29_L001_R1_001.fastq.gz\nRAPiD-Genomics_F115_CSU_136201_P001_WC05_i5-515_i7-125_S29_L001_R2_001.fastq.gz\nRAPiD-Genomics_F115_CSU_136201_P001_WC05_i5-515_i7-125_S29_L002_R1_001.fastq.gz\nRAPiD-Genomics_F115_CSU_136201_P001_WC05_i5-515_i7-125_S29_L002_R2_001.fastq.gz\nRAPiD-Genomics_F116_CSU_136201_P001_WC05_i5-515_i7-125_S384_L002_R1_001.fastq.gz\nRAPiD-Genomics_F116_CSU_136201_P001_WC05_i5-515_i7-125_S384_L002_R2_001.fastq.gz
\nThe .tar file can be accessed/retrieved with valid SCINet account at this location: /KEEP/ADCdatastorage/NAL/published/node32145/45052.tar
\nSee the SCINet File Transfer guide for more information on moving large files: https://scinet.usda.gov/guides/data/datatransfer
\nGlobus users:\nThe files can also be accessed through Globus by following this data link.The user will need to log in to Globus in order to retrieve this data. User accounts are free of charge with several options for signing on. Instructions for creating an account are on the login page.\n
Whole genome sequence data for Bovidae Bos taurus - beef Angus. The data is in \"fastq\" format.
\nThe National Animal Germplasm Program has germplasm for this animal, with the repository number 45109.
\nThere are two versions of each file because we did paired end sequencing. There are two reads for each of the 210 data lines (a forward and a reverse read) summing to 420 total. A diagram of this is provided in the Collection Dataset. In the diagram, the two reads would correspond to read 1 and read 3.
Resource Title: Animal 45109 Sequence Data - SCINet.
File Name: Web Page, url: https://app.globus.org/file-manager?destination_id=e5391440-1d5e-11ec-a0a0-6b21ca6daf73&destination_path=/node32147/
tar file containing 14 files. The files are:\nRAPiD-Genomics_F112_CSU_136201_P001_WC06_i5-515_i7-126_S30_L003_R1_001.fastq.gz\nRAPiD-Genomics_F112_CSU_136201_P001_WC06_i5-515_i7-126_S30_L003_R2_001.fastq.gz\nRAPiD-Genomics-F113-CSU-136201-P001-WC06-i5-515-i7-126_S166_L002_R1_001.fastq.gz\nRAPiD-Genomics-F113-CSU-136201-P001-WC06-i5-515-i7-126_S166_L002_R2_001.fastq.gz\nRAPiD-Genomics-F113-CSU-136201-P001-WC06-i5-515-i7-126_S30_L001_R1_001.fastq.gz\nRAPiD-Genomics-F113-CSU-136201-P001-WC06-i5-515-i7-126_S30_L001_R2_001.fastq.gz\nRAPiD-Genomics-F114-CSU-136201-P001-WC06-i5-515-i7-126_S30_L003_R1_001.fastq.gz\nRAPiD-Genomics-F114-CSU-136201-P001-WC06-i5-515-i7-126_S30_L003_R2_001.fastq.gz\nRAPiD-Genomics_F115_CSU_136201_P001_WC06_i5-515_i7-126_S30_L001_R1_001.fastq.gz\nRAPiD-Genomics_F115_CSU_136201_P001_WC06_i5-515_i7-126_S30_L001_R2_001.fastq.gz\nRAPiD-Genomics_F115_CSU_136201_P001_WC06_i5-515_i7-126_S30_L002_R1_001.fastq.gz\nRAPiD-Genomics_F115_CSU_136201_P001_WC06_i5-515_i7-126_S30_L002_R2_001.fastq.gz\nRAPiD-Genomics_F116_CSU_136201_P001_WC06_i5-515_i7-126_S385_L002_R1_001.fastq.gz\nRAPiD-Genomics_F116_CSU_136201_P001_WC06_i5-515_i7-126_S385_L002_R2_001.fastq.gz
\nThe .tar file can be accessed/retrieved with valid SCINet account at this location: /KEEP/ADCdatastorage/NAL/published/node32147/45109.tar
\nSee the SCINet File Transfer guide for more information on moving large files: https://scinet.usda.gov/guides/data/datatransfer
\nGlobus users:\nThe files can also be accessed through Globus by following this data link.The user will need to log in to Globus in order to retrieve this data. User accounts are free of charge with several options for signing on. Instructions for creating an account are on the login page.
Whole genome sequence data for Bovidae Bos taurus - beef Angus. The data is in \"fastq\" format.
\nThe National Animal Germplasm Program does not have germplasm for this animal.
\nThere are two versions of each file because we did paired end sequencing. There are two reads for each of the 210 data lines (a forward and a reverse read) summing to 420 total. A diagram of this is provided in the Collection Dataset. In the diagram, the two reads would correspond to read 1 and read 3.
Resource Title: Animal 519-2 Sequence Data - SCINet.
File Name: Web Page, url: https://app.globus.org/file-manager?destination_id=e5391440-1d5e-11ec-a0a0-6b21ca6daf73&destination_path=/node33208/
tar file containing 14 files. The files are:\nRAPiD-Genomics_F112_CSU_136201_P001_WA06_i5-515_i7-102_S6_L003_R1_001.fastq.gz\nRAPiD-Genomics_F112_CSU_136201_P001_WA06_i5-515_i7-102_S6_L003_R2_001.fastq.gz\nRAPiD-Genomics-F113-CSU-136201-P001-WA06-i5-515-i7-102_S142_L002_R1_001.fastq.gz\nRAPiD-Genomics-F113-CSU-136201-P001-WA06-i5-515-i7-102_S142_L002_R2_001.fastq.gz\nRAPiD-Genomics-F113-CSU-136201-P001-WA06-i5-515-i7-102_S6_L001_R1_001.fastq.gz\nRAPiD-Genomics-F113-CSU-136201-P001-WA06-i5-515-i7-102_S6_L001_R2_001.fastq.gz\nRAPiD-Genomics-F114-CSU-136201-P001-WA06-i5-515-i7-102_S6_L003_R1_001.fastq.gz\nRAPiD-Genomics-F114-CSU-136201-P001-WA06-i5-515-i7-102_S6_L003_R2_001.fastq.gz\nRAPiD-Genomics_F115_CSU_136201_P001_WA06_i5-515_i7-102_S6_L001_R1_001.fastq.gz\nRAPiD-Genomics_F115_CSU_136201_P001_WA06_i5-515_i7-102_S6_L001_R2_001.fastq.gz\nRAPiD-Genomics_F115_CSU_136201_P001_WA06_i5-515_i7-102_S6_L002_R1_001.fastq.gz\nRAPiD-Genomics_F115_CSU_136201_P001_WA06_i5-515_i7-102_S6_L002_R2_001.fastq.gz\nRAPiD-Genomics_F116_CSU_136201_P001_WA06_i5-515_i7-102_S361_L002_R1_001.fastq.gz\nRAPiD-Genomics_F116_CSU_136201_P001_WA06_i5-515_i7-102_S361_L002_R2_001.fastq.gz
\nSCINet users:\nThe .tar file can be accessed/retrieved with valid SCINet account at this location: /KEEP/ADCdatastorage/NAL/published/node33208/519-2.tar\nSee the SCINet File Transfer guide for more information on moving large files: https://scinet.usda.gov/guides/data/datatransfer
\nGlobus users:\nThe files can also be accessed through Globus by following the data link provided below.The user will need to log in to Globus in order to retrieve this data. User accounts are free of charge with several options for signing on. Instructions for creating an account are on the login page.
\nWhole genome sequence data for Bovidae Bos taurus - beef Angus. The data is in \"fastq\" format.
\nThe National Animal Germplasm Program does not have germplasm for this animal.
\nThere are two versions of each file because we did paired end sequencing. There are two reads for each of the 210 data lines (a forward and a reverse read) summing to 420 total. A diagram of this is provided in the Collection Dataset. In the diagram, the two reads would correspond to read 1 and read 3.
Resource Title: Animal Dark_Knight Sequence Data - SCINet.
File Name: Web Page, url: https://app.globus.org/file-manager?destination_id=e5391440-1d5e-11ec-a0a0-6b21ca6daf73&destination_path=/node33210/
tar file containing 14 files. The files are:\nRAPiD-Genomics_F112_CSU_136201_P001_WA01_i5-515_i7-97_S1_L003_R1_001.fastq.gz\nRAPiD-Genomics_F112_CSU_136201_P001_WA01_i5-515_i7-97_S1_L003_R2_001.fastq.gz\nRAPiD-Genomics-F113-CSU-136201-P001-WA01-i5-515-i7-97_S137_L002_R1_001.fastq.gz\nRAPiD-Genomics-F113-CSU-136201-P001-WA01-i5-515-i7-97_S137_L002_R2_001.fastq.gz\nRAPiD-Genomics-F113-CSU-136201-P001-WA01-i5-515-i7-97_S1_L001_R1_001.fastq.gz\nRAPiD-Genomics-F113-CSU-136201-P001-WA01-i5-515-i7-97_S1_L001_R2_001.fastq.gz\nRAPiD-Genomics-F114-CSU-136201-P001-WA01-i5-515-i7-97_S1_L003_R1_001.fastq.gz\nRAPiD-Genomics-F114-CSU-136201-P001-WA01-i5-515-i7-97_S1_L003_R2_001.fastq.gz\nRAPiD-Genomics_F115_CSU_136201_P001_WA01_i5-515_i7-97_S1_L001_R1_001.fastq.gz\nRAPiD-Genomics_F115_CSU_136201_P001_WA01_i5-515_i7-97_S1_L001_R2_001.fastq.gz\nRAPiD-Genomics_F115_CSU_136201_P001_WA01_i5-515_i7-97_S1_L002_R1_001.fastq.gz\nRAPiD-Genomics_F115_CSU_136201_P001_WA01_i5-515_i7-97_S1_L002_R2_001.fastq.gz\nRAPiD-Genomics_F116_CSU_136201_P001_WA01_i5-515_i7-97_S356_L002_R1_001.fastq.gz\nRAPiD-Genomics_F116_CSU_136201_P001_WA01_i5-515_i7-97_S356_L002_R2_001.fastq.gz
\nThe .tar file can be accessed/retrieved with valid SCINet account at this location: /KEEP/ADCdatastorage/NAL/published/node33210/Dark_Knight.tar
\nSee the SCINet File Transfer guide for more information on moving large files: https://scinet.usda.gov/guides/data/datatransfer
\nGlobus users:\nThe files can also be accessed through Globus by following this data link.The user will need to log in to Globus in order to retrieve this data. User accounts are free of charge with several options for signing on. Instructions for creating an account are on the login page.
Whole genome sequence data for Bovidae Bos taurus - beef Angus. The data is in \"fastq\" format.
\nThe National Animal Germplasm Program does not have germplasm for this animal.
\nThere are two versions of each file because we did paired end sequencing. There are two reads for each of the 210 data lines (a forward and a reverse read) summing to 420 total. A diagram of this is provided in the Collection Dataset. In the diagram, the two reads would correspond to read 1 and read 3.
Resource Title: Animal Donnie Sequence Data - SCINet .
File Name: Web Page, url: https://app.globus.org/file-manager?destination_id=e5391440-1d5e-11ec-a0a0-6b21ca6daf73&destination_path=/node33212/
tar file containing 14 files. The files are:\nRAPiD-Genomics_F112_CSU_136201_P001_WA02_i5-515_i7-98_S2_L003_R1_001.fastq.gz\nRAPiD-Genomics_F112_CSU_136201_P001_WA02_i5-515_i7-98_S2_L003_R2_001.fastq.gz\nRAPiD-Genomics-F113-CSU-136201-P001-WA02-i5-515-i7-98_S138_L002_R1_001.fastq.gz\nRAPiD-Genomics-F113-CSU-136201-P001-WA02-i5-515-i7-98_S138_L002_R2_001.fastq.gz\nRAPiD-Genomics-F113-CSU-136201-P001-WA02-i5-515-i7-98_S2_L001_R1_001.fastq.gz\nRAPiD-Genomics-F113-CSU-136201-P001-WA02-i5-515-i7-98_S2_L001_R2_001.fastq.gz\nRAPiD-Genomics-F114-CSU-136201-P001-WA02-i5-515-i7-98_S2_L003_R1_001.fastq.gz\nRAPiD-Genomics-F114-CSU-136201-P001-WA02-i5-515-i7-98_S2_L003_R2_001.fastq.gz\nRAPiD-Genomics_F115_CSU_136201_P001_WA02_i5-515_i7-98_S2_L001_R1_001.fastq.gz\nRAPiD-Genomics_F115_CSU_136201_P001_WA02_i5-515_i7-98_S2_L001_R2_001.fastq.gz\nRAPiD-Genomics_F115_CSU_136201_P001_WA02_i5-515_i7-98_S2_L002_R1_001.fastq.gz\nRAPiD-Genomics_F115_CSU_136201_P001_WA02_i5-515_i7-98_S2_L002_R2_001.fastq.gz\nRAPiD-Genomics_F116_CSU_136201_P001_WA02_i5-515_i7-98_S357_L002_R1_001.fastq.gz\nRAPiD-Genomics_F116_CSU_136201_P001_WA02_i5-515_i7-98_S357_L002_R2_001.fastq.gz
\nSCINet users:\nThe .tar file can be accessed/retrieved with valid SCINet account at this location: /KEEP/ADCdatastorage/NAL/published/node33212/Donnie.tar\nSee the SCINet File Transfer guide for more information on moving large files: https://scinet.usda.gov/guides/data/datatransfer
\nGlobus users:\nThe files can also be accessed through Globus by following this data link.The user will need to log in to Globus in order to retrieve this data. User accounts are free of charge with several options for signing on. Instructions for creating an account are on the login page.
Whole genome sequence data for Bovidae Bos taurus - beef Angus, 30 animals in total. The data is in \"fastq\" format. There are two versions of each file because we did paired end sequencing. There are two reads for each of the 210 data lines (a forward and a reverse read) summing to 420 total. A diagram of this is attached. In the diagram, the two reads would correspond to read 1 and read 3.
Resource Title: CSU_136201_SampleSheet.csv - list of all Angus sequence files.
File Name: CSU_136201_SampleSheet.csv
Resource Description: This spreadsheet lists all 210 data files associated with the sequencing of these 30 Angus animals
\nResource Title: Sequence Reads Diagram.
File Name: SequenceReads.png
Resource Description: There are two reads for each of the 210 data lines (a forward and a reverse read) summing to 420 total. In the diagram, the two reads would correspond to read 1 and read 3.
Animal genetic resources underpin the livestock sector's production and profitability. As a result livestock industries contribute billions of dollars to national economies. The Animal Germplasm Resources Information Network (A-GRIN) mission is to acquire, evaluate and preserve these strategic resources so that industry and the research community can have access to a broad array of genetic variability for: national security, introduction of genetic variation, corrective breeding, and various research initiatives. There are three major technical components:
\nIn addition this program interacts with a wide range of livestock producers, researchers, and various industry representatives. Users can drill down to explore the germplasm collection by species, breed, line, and individual; compare taxonomies; find animals that meet their criteria to make a germplasm request.
Resource Title: National Animal Germplasm Program Website.
File Name: Web Page, url: https://agrin.ars.usda.gov/main_webpage_dev/ars?language=EN&record_source=US
The Agricultural Research Service’s National Animal Germplasm Program operates a gene bank for livestock, aquatic, poultry and insect genetic resources. Exploring these pages you will find information concerning the genetic resources collection and other issues related to genetic resources and how the program operates.\n
Unigene sequences were annotated by BlastX alignment to the non-redundant protein database (National Center for Biotechnology Information/GenBank) and the Aedes aegypti and Culex quinquefasciatus gene annotations (Vectorbase). This was done with a 1e-05 expectation value. Top hits are shown including accession numbers and description, if available. Unigene number and corresponding GenBank accession numbers are provided for all C. sonorensis genes. Both tables are modified from supplementary information tables at http://dx.doi.org/10.1371/journal.pone.0098123.s003 and numbered accordingly.
\nResource Title: table s2 annotation.
File Name: table s2 annotation.xlsx
Resource Title: table S3 GO terms.
File Name: table S3 GO terms.xlsx
Resource Title: data dictionary Nayduch S2 S3.
File Name: data dictionary Nayduch S2 S3_2.csv
Resource Description: Defines parameters for annotation and GO terms.
This data package contains a list of ground-based photographs taken at fifteen Net Primary Production (NPP) study sites at the Jornada Basin LTER. Sites were selected to represent the 5 major ecosystem types in the Chihuahuan Desert (upland grasslands, playa grasslands, mesquite-dominated shrublands, creosotebush-dominated shrublands, tarbush-dominated shrublands). For each ecosystem type, three sites were selected to represent the range in variability in production and plant diversity; thus the locations are not replicates. At each site, a 1 hectare area was fenced in 1988 and a grid of 49 (48 at one playa location) 1m x 1m replicate quadrats was laid out when vegetation sampling began in 1989. Beginning in 1996, annual photos were taken from each of the 4 corners of each of the 15 70-meter x 70-meter NPP sites between August and November, depending on other research activity constraints. From 1996-2002 photos were taken using 35mm color slide film. Beginning in 2003, digital photos were taken in JPG format. Occasionally, supplemental photos may be taken at the same time that provide additional habitat information at the landscape, patch, or plant species level. No photographs were taken in 2013. Photo files (.jpeg format) are included in annual ZIP archives attached to this data package. This is an ongoing dataset that is updated once per year.
Resource Title: Website Pointer to html file.
File Name: Web Page, url: https://portal.edirepository.org/nis/mapbrowse?scope=knb-lter-jrn&identifier=210011005
Webpage with information and links to data files for download
This package contains values of mean annual aboveground net primary production (NPP, in grams per square meter per year) at 15 NPP study sites on Jornada Experimental Range (JER) and Chihuahuan Desert Rangeland Research Center (CDRRC) lands. Sites were selected to represent the 5 major ecosystem types in the Chihuahuan Desert (upland grasslands, playa grasslands, mesquite-dominated shrublands, creosotebush-dominated shrublands, tarbush-dominated shrublands). For each ecosystem type, three sites were selected to represent the range in variability in production and plant diversity; thus the locations are not replicates. At each site, a 1 hectare area was fenced in 1988 and a grid of 49 (48 at one playa location) 1m x 1m replicate quadrats was laid out when sampling began in 1989. In fall, winter, and spring periods aboveground biomass was calculated for each species and quadrat at each NPP site. These calculations rely on two data sources: 1) non-destructive horizontal cover and vertical height measurements of individual plants, or plant parts, within each quadrat, and 2) linear regression coefficients for each plant species derived from off-quadrat cover, height, and harvested biomass measurements. NPP is then calculated as the positive biomass increment between seasons. The annual totals in this dataset are derived by summing mean site NPP values for winter (October - February), spring (February - May), and fall (May - October) increments for a single calendar year. Data collection is ongoing with new annual NPP values calculated after the conclusion of each growing season.Attention:1) Calculated values in this data package have changed over time as the methodology for estimating biomass has changed. 2) Relating long-term NPP in this package with long-term precipitation is problematic given the importance of wet and dry periods and their effect on production in these ecosystems.See Notes 1 & 2 in the methods element for further details.
Resource Title: Website Pointer to html file.
File Name: Web Page, url: https://portal.edirepository.org/nis/mapbrowse?scope=knb-lter-jrn&identifier=210011003
Webpage with information and links to data files for download
This data package contains annual measurements of vegetation canopy and basal gap sizes from transects at the Connectivity Modifier (Conmod) Pilot study on the Jornada Experimental Range from 2008-2016. There were 3 sites for this study: Gravelly Ridges, Aeolian, and Dona Ana. Within each site, there were 8 study plots, 4 of which were treatment plots where connectivity modules (conmods) were installed to decrease gap sizes between perennial vegetation. The plots were 8 x 8 meters and had an 8 x 8 meter buffer zone on both sides of the plot (upwind and downwind). Beginning in 2008, vegetation canopy and basal gap sizes were collected annually in all plots using the gap intercept method. These data were collected in 2008-2010, 2012 and 2016. At each plot, four parallel 24-meter transects crossing the upwind buffer, the plot, and the downwind buffer were measured. These parallel transects were spaced at 0.8, 2.8, 4.3, and 7.2 meter intervals across the plot and buffer areas. This study is complete (finished in 2016) and was the pilot study to the newer Cross Scale Interactions Study.
Resource Title: Website Pointer to html file.
File Name: Web Page, url: https://portal.edirepository.org/nis/mapbrowse?scope=knb-lter-jrn&identifier=210308001
Webpage with information and links to data files for download
This data package contains annual measurements of vegetation cover, species, and height from transects at the Connectivity Modifier (Conmod) Pilot study on the Jornada Experimental Range from 2008-2016. There were 3 sites for this study: Gravelly Ridges, Aeolian, and Dona Ana. Within each site, there were 8 study plots, 4 of which were treatment plots where connectivity modules (conmods) were installed to decrease gap sizes between perennial vegetation. The plots were 8 x 8 meters and had an 8 x 8 meter buffer zone on both sides of the plot (upwind and downwind). Beginning in 2008, vegetation cover by species, and vegetation heights were collected annually in all plots using the line-point intercept method. These data were collected in 2008-2010, 2012 and 2016. At each plot, four parallel 24-meter transects crossing the upwind buffer, the plot, and the downwind buffer were measured. These parallel transects were spaced at 0.8, 2.8, 4.3, and 7.2 meter intervals across the plot and buffer areas. Vegetation cover and height were read at points arranged at 25 centimeter increments along each transect. This study is complete (finished in 2016) and was the pilot study to the newer Cross Scale Interactions Study.
Resource Title: Website Pointer to html file.
File Name: Web Page, url: https://portal.edirepository.org/nis/mapbrowse?scope=knb-lter-jrn&identifier=210308002
Webpage with information and links to data files for download
AnthWest is a large dataset, one of the outcomes of a comprehensive, broadly comparative study on the diversity, biology, biogeography, and evolution of Anthidium Fabricius in the Western Hemisphere. In this dataset a total of 22,648 adult occurrence records comprising 9,657 unique events are documented for 92 species of Anthidium, including the invasive range of two introduced species from Eurasia, A. oblongatum (Illiger) and A. manicatum (Linnaeus). The geospatial coverage of the dataset extends from northern Canada and Alaska to southern Argentina, and from below sea level in Death Valley, California, USA, to 4,700 m a.s.l. in Tucumán, Argentina. The majority of the records in the dataset correspond to information recorded from individual specimens examined by the authors during this project, and deposited into 60 biodiversity collections located in Africa, Europe, North and South America.\nA fraction (4.8%) of the occurrence records were taken from the literature, largely California records from a taxonomic treatment with some additional records for the two introduced species. The temporal scale of the dataset represents collection events recorded between 1886 and 2012.
\nThe data underpinning the analysis reported in this paper are deposited at GBIF, the Global Biodiversity Information Facility, http://ipt.pensoft.net/ipt/resource.do?r=anthidium.
\nResource Title: AnthWest, Occurrence Records for Wool Carder Bees of the Genus Anthidium (Hymenoptera: Megachilidae, Anthidiini) in the Western Hemisphere (Data Dictionary).
File Name: meta.xml
Resource Description: The data dictionary for the Darwin Core Archive of AnthWest.
Resource Title: Darwin Core Archive.
File Name: dwca-anthidium-v7.0.zip
Resource Description: Zip file includes database field name definitions (meta.xml); also includes the data paper (eml.xml), and occurrence data (occurrence.txt, tab-separated ). Find web download at http://ipt.pensoft.net/ipt/archive.do?r=anthidium
AphID includes a key to the 66 most polyphagous and cosmopolitan aphid species. The key for slide-mounted specimens has 132 end points. The key does not include males, oviparae, or immatures. It may not work for all fundatrices or alatae and apterae from primary hosts (for those species with host alternation). AphID includes all 38 aphid species in the dichotomous keys to polyphagous aphids in the three seminal works by Roger Blackman & Victor Eastop (1994, 2000, 2006). The remaining aphids represent the 28 species most frequently intercepted at United States ports of entry that are not already represented on the Blackman & Eastop list. AphID offers users detailed descriptions of morphological features critical to identifying aphids along with annotated photographs to help illustrate each feature. Separate pages are devoted to suites of features, for example all features of the antenna are found on the same page. The morphology pages are crosslinked with a detailed glossary.
\nResource Title: Aphidnet.
File Name: Web Page, url: http://aphid.aphidnet.org/index.php
The Asian giant hornet, Vespa mandarinia, has a native range that extends from northern India to East Asia. In 2019, the hornet was confirmed for the first time in North America, posing an invasive threat to honey bees and human health. In September 2019, local beekeepers, tracked down a nest in a park in Nanaimo on Vancouver Island, British Columbia, Canada and exterminated it. The specimen we used for genome sequencing was obtained from that nest, the first one found in North America. DNA was extracted from the thorax for PacBio HiFi sequencing on two cells and data were assembled using IPA to yield a contig assembly of 248 Mb with a 3.14 Mb N50. The assembly was generated by the Agricultural Research Service's Ag100Pest Initiative in collaboration with Pacific Biosciences. This high-quality genome assembly is being released prior to publication in scientific journals as a public service to the research community.
\nThe Primary and Haplotig assemblies, along with the HiFi reads have been archived at NCBI. Relevant accessions include:\nSRA: SRR12366675 - PacBio HiFi reads for both cells\nBioProject: PRJNA649644, BioSample: SAMN15675875, GenBank: JACHAV000000000 - Primary contig assembly and mitochondrial genome\nBioProject: PRJNA649643, BioSample: SAMN15675875, GenBank: JACHAW000000000 - Alternate (Haplotigs) contig assembly
\nResource Title: IPA contigs purged from haplotigs.
File Name: ihVesMand1_IPA_purged_from_htig.fasta
Resource Description: IPA contigs purged from the haplotigs contig set by purge_dups. Fasta format.
Resource Title: Mitochondrial PacBio HiFi read set.
File Name: ihVesMand1_mt_reads.fasta
Resource Description: Mitochondrial reads from the PacBio HiFi read set. Fasta format.
Resource Title: All mitochondrial genome VNTR variants.
File Name: ihVesMand1_mtgenome_all_VNTR_variants.fasta
Resource Description: Multiple contigs of the mitochondrial genome were obtained due to the presence of an extended variable number tandem repeat (VNTR) region corresponding to the control region, with different copy numbers (ranging from 5 to 9) of an 823 bp repeat unit. We designated the most abundant mitochondrial genome variant (6 repeat copies) as the mitochondrial genome sequence and included it with the primary assembly deposited in GenBank.
Resource Title: Vespa mandarinia sequencing and assembly methods.
File Name: Vespa_mandarinia_Sequencing_and_Assembly_Methods.docx
Pesticide use, disease, climate change, and habitat loss associated with agricultural intensification and urbanization have contributed to the decline of numerous insect groups. Recent government incentives have recognized the importance of supplementary wildflower plantings to support native bee populations, yet little information exists on the attractiveness of recommended plant species to bees. We evaluated the bee attractiveness of 18 native wildflower species belonging to 6 families (Apiaceae, Apocynaceae, Asteraceae, Fabaceae, Lamiaceae, and Verbenaceae) commonly recommended by the U.S. Department of Agriculture – Natural Resource Conservation Service (USDA-NRCS) to land managers in the southeastern United States. To accomplish this, we planted the 18 wildflower species in separate 1 m2 plots arranged in a randomized block design with four replicates in Auburn, Alabama, USA. We conducted floral counts and timed sweep netting events to assess each species’ attractiveness to bees from May-November 2019. We also evaluated the floral preferences of seven bee taxa (Apis mellifera, Halictus poeyi/ligatus, Bombus griseocollis, Bombus impatiens, Lasioglossum spp., Megachile spp., and Xylocopa virginica) to the planted wildflower species. We found that Asclepias tuberosa, Gaillardia pulchella, and Verbena hastata attracted the greatest abundance, richness, and diversity of native bees compared to the other wildflower species. While several wildflower species attracted low abundance, richness, and diversity of native bees, they are still ecologically important for attracting uncommon or specialist bee species. Each bee taxa were attracted to a particular combination of planted wildflower species; collectively, Asclepias tuberosa, Gaillardia pulchella, and Verbena hastata attracted 89% of all be taxa in the study, which exemplifies the importance of including them in a wildflower mixture to attract native bees. Our results highlight that each species of native wildflower varies in the abundance, richness, and diversity of native bees they attract; this could be considered in the decision-making of landowners and land managers to promote wildflower plantings to reflect their needs.
", "title": "Assessing the attractiveness of native wildflower species to bees (Hymenoptera: Anthophila): in the southeastern United States", "distribution": [ { "@type": "dcat:Distribution", "downloadURL": "https://ndownloader.figshare.com/files/44292059", "format": "xlsx", "mediaType": "application/vnd.openxmlformats-officedocument.spreadsheetml.sheet", "title": "Wildflower_attractiveness_Bee_Data.xlsx" } ], "license": "https://creativecommons.org/licenses/by/4.0/", "bureauCode": [ "005:18" ], "modified": "2024-02-26", "publisher": { "@type": "org:Organization", "name": "Agricultural Research Service" }, "keyword": [ "bee visitation", "native bees", "native wildflowers", "pollination", "sweep netting", "wildflower attractiveness" ], "spatial": "{\"type\": \"Point\", \"coordinates\": [-85.3, 32.41]}" }, { "identifier": "10.15482/USDA.ADC/1519153", "accessLevel": "public", "contactPoint": { "hasEmail": "mailto:David.Augustine@usda.gov", "fn": "Augustine, David" }, "programCode": [ "005:040" ], "description": "This data package was produced initially by researchers working on the Shortgrass Steppe Long Term Ecological Research (SGS-LTER) Project, administered at Colorado State University. Then, was continued by the Rangeland Resources and Systems Research Unit of the USDA Agricultural Research Service. Data collection was conducted on the Central Plains Experimental Range in Nunn, Colorado.
\nWhen the CPER was established in 1939, researchers constructed a .5-1 ha grazing exclosure in each of the pastures. These areas have remained protected from grazing for the past 70 years. The remaining areas have been grazed for the past 20+ years. This collection of pastures and exclosures provided an extraordinary opportunity to reinitiate grazing and protection, and evaluate the balance between degradation and aggradation. We proposed to rearrange fences and expose areas to grazing that have been protected for 50 years, and protect areas from grazing that had been grazed for 50 years. The combinations of grazing conditions were: 1. Long-term protection 2. Long-term grazing (moderate) 3. 50 years of protection followed by grazing 4. 50 years of grazing followed by protection Net primary production, nitrogen dynamics, cattle utilization, and community dynamics of vegetation were measured. Additional information and referenced materials about many of the long-term studies initiated on the CPER can be found: http://hdl.handle.net/10217/85596.
Resource Title: Monthly Precipitation Data (1991-2017) from the Central Plains Experimental Range, Nunn, CO.
File Name: precipitationData.xlsx
Resource Description: These data were collected from a catch can located at the CPER headquarters
Resource Title: Species level percent basal cover data associated with the GZTX study on the Central Plains Experimental Range..
File Name: baseline3_GZTX.xlsx
Resource Description: Species level percent basal cover data associated with the GZTX study on the Central Plains Experimental Range.
Resource Title: baseline3 GZTX Data Dictionary.
File Name: baseline3_GZTX_dataDictionary.csv
Automated Water Supply Model (AWSM) was developed at the USDA Agricultural Research Service (ARS) in Boise, ID. AWSM was designed to streamline the work flow used by the ARS to forecast the water supply of multiple water basins. AWSM standardizes the steps needed to distribute weather station data with SMRF, run an energy and mass balance with iSnobal, and process the results, while maintaining the flexibility of each program.
Resource Title: AWSM GitHub Repository.
File Name: Web Page, url: https://github.com/USDA-ARS-NWRC/awsm
Automated Water Supply Model (AWSM) was developed at the USDA Agricultural Research Service. AWSM was designed to streamline the workflow used to forecast the water supply of multiple water basins.
NOTE: This dataset is no longer publicly available.
\nThis database houses over 500,000 sequences that were generated and assembled into approximately 15,000 contigs, annotated and functionally mapped to Gene Ontology (GO) terms.
\nBlueberry (Vaccinium corymbosum) is a major berry crop in the United States. Next generation sequencing methodologies, such as 454, have been demonstrated to be successful and efficient in producing a snap-shot of transcriptional activities during an organism’s developmental stage(s) or its response to biotic or abiotic stresses. Such application of this new sequencing technique allows for high-throughput, genome-wide experimental verification of known and novel transcripts. We have applied a high-throughput pyrosequencing technology (454 EST sequencing) for transcriptome profiling of blueberry during different stages of fruit development to gain an understanding of the genes that are up or down regulated during this process. We have also sequenced flower buds at four different stages of cold acclimation to gain a better understanding of the genes and biochemical pathways that are up- or down-regulated during cold acclimation, since extreme low temperatures are known to reduce crop yield and cause major losses to US farmers. We have also sequenced a leaf sample to compare its transcriptome profile with that of bud and fruit samples. Over 500,000 sequences were generated and assembled into approximately 15,000 contigs and were annotated and functionally mapped to Gene Ontology (GO) terms. A database was developed to house these sequences and their annotations. A web based interface was also developed to allow collaborators to search\\browse the data and aid in the analysis and interpretation of the data. The availability of these sequences will allow for future advances, such as the development of a blueberry microarray to study gene expression, and will aid in the blueberry genome sequencing effort that is underway.\nThis work was supported by grant 2008-51180-04861 from the USDA - Cooperative State Research, Education, and Extension Service (CSREES) Specialty Crop Research Initiative program.
", "title": "BBGD454: an Online Database for Blueberry Genomic Data Transcriptome analysis of Blueberry using 454 EST sequencing", "distribution": [], "license": "https://www.usa.gov/publicdomain/label/1.0/", "bureauCode": [ "005:18" ], "modified": "2024-02-08", "publisher": { "@type": "org:Organization", "name": "Agricultural Research Service" }, "keyword": [ "Vaccinium corymbosum", "blueberry", "genomics", "NP303", "NP301", "Online database", "data.gov", "ARS" ] }, { "identifier": "10.15482/USDA.ADC/1173241", "accessLevel": "public", "contactPoint": { "hasEmail": "mailto:nalkharouf@towson.edu", "fn": "Alkharouf, Nadim W." }, "programCode": [ "005:040" ], "description": "NOTE: This dataset is no longer publicly available.
\nBBGD (http://bioinformatics.towson.edu/BBGD/) was developed as a database for blueberry genomics. BBGD is both a sequence and gene expression database. It stores both EST and microarray data and allows scientists to correlate expression profiles with gene function. BBGD is a public online database. \"Presently, the main focus of the database is the identification of genes in blueberry that are significantly induced or suppressed after low temperature exposure. \"
\nTo gain a better understanding of changes in gene expression associated with cold acclimation in blueberry, the Rowland laboratory (USDA-ARS, Beltsville, MD) has undertaken a genomics approach based on the analysis of Expressed Sequence Tags (ESTs). Initially, two standard cDNA libraries were constructed using RNA from cold-acclimated and non-acclimated floral buds of the blueberry cultivar ‘Bluecrop’ (Vaccinium corymbosum L.) and about 1200 5’-end ESTs were generated from each of the libraries. About 100 3’-end ESTs were generated from the cold-acclimated library as well.
\nThe Blueberry EST database contains EST sequences from a number blueberry libraries including cold acclimated and non-acclimated libraries. It also includes forward and reverse subtractive libraries.
\nYou can query the sequence database by clone ID, accession number or gene (clone) name below. Or you can get a list (in tabular) format of all the clones in a particular library by clicking on the library name on the left side navigation bar.
\nAttribution for photo:
D2601-1 - Blueberry plant: Copyright free, public domain photo by Mark Ehlenfeldt
These are the \".log\" files from \"Characterizing a century of genetic diversity and contemporary antigenic diversity of N1 neuraminidase in Influenza A virus (IAV) from North American swine\" generated in BEAST and used to plot molecular substitution rates and calculate statistical distances between posterior distributions of these rates. The names of these files communicate information about the various BEAST runs using the following format: cladeOrLineageName_replicate_substitutionModel_treePrior_MCMCiterations_dateOfRunWithin2021.log where replicate is not always included
Resource Title: BEAST log file for clade N1.C.2.1.
File Name: N1C21_SRD06_strict_GMRF_200MNov9.log.zip
Resource Software Recommended: Tracer v1.7.1,url: http://tree.bio.ed.ac.uk/software/tracer/
Resource Title: BEAST log file for clade N1.C.2.
File Name: N1C2_SRD06_strict_GMRF_200MNov2.log.zip
Resource Software Recommended: Tracer v1.7.1,url: http://tree.bio.ed.ac.uk/software/tracer/
Resource Title: BEAST log file for clade N1.C.3.1.
File Name: N1C31_SRD06_strict_GMRF200M.log.zip
Resource Software Recommended: Tracer v1.7.1,url: http://tree.bio.ed.ac.uk/software/tracer/
Resource Title: BEAST log file for clade N1.C.3.2.
File Name: N1C32_SRD09_strict_GMRF_200MMay21.log.zip
Resource Software Recommended: Tracer v1.7.1,url: http://tree.bio.ed.ac.uk/software/tracer/
Resource Title: BEAST log file for clade N1.C.3.
File Name: N1C3_r1_hkyGamma4_GMRF_200MMay20.log.zip
Resource Software Recommended: Tracer v1.7.1,url: http://tree.bio.ed.ac.uk/software/tracer/
Resource Title: BEAST log file for clade N1.P.
File Name: N1P_SRD06_strict_GMRF_200MAug2.log.zip
Resource Software Recommended: Tracer v1.7.1,url: http://tree.bio.ed.ac.uk/software/tracer/
Resource Title: BEAST log file for the classical swine N1 lineage.
File Name: N1classical_r1_SRD06_UCLN_GMRF_200MMay21.log.zip
Resource Software Recommended: Tracer v1.7.1,url: http://tree.bio.ed.ac.uk/software/tracer/
A set of programs for best prediction of lactation yields.
\nLactation records of any reasonable length now can be processed with the selection index method known as best prediction (BP). Previous prediction programs were limited to the 305-d standard used since 1935. Best prediction was implemented in 1998 to calculate lactation records in USDA genetic evaluations, replacing the test interval method used since 1969 to calculate lactation records. Best prediction is more complex but also more accurate, particularly when testing is less frequent. Programs were reorganized to output better graphics, give users simpler access to options, and provide additional output, such as BP of daily yields. Test-day data for 6 breeds were extracted from the national dairy database, and lactation lengths were required to be ≥500 d (Ayrshire, Milking Shorthorn) or ≥800 d (all others). Average yield and SD at any day in milk (DIM) were estimated by fitting 3-parameter Wood’s curves (milk, fat, protein) and 4-parameter exponential functions (somatic cell score) to means and SD of 15- (≤300 DIM) and 30-d (>300 DIM) intervals. Correlations among TD yields were estimated using an autoregressive matrix to account for biological changes and an identity matrix to model daily measurement error. Autoregressive parameters (r) were estimated separately for first (r = 0.998) and later parities (r = 0.995). These r values were slightly larger than previous estimates due to the inclusion of the identity matrix. Correlations between traits were modified so that correlations between somatic cell score and other traits may be nonzero. The new lactation curves and correlation functions were validated by extracting TD data from the national database, estimating 305-d yields using the original and new programs, and correlating those results. Daily BP of yield were validated using daily milk weights from on-farm meters in university research herds. Correlations ranged from 0.900 to 0.988 for 305-d milk yield. High correlations ranged from 0.844 to 0.988 for daily yields, although correlations were as low as 0.015 on d 1 of lactation, which may be due to calving-related disorders that are not accounted for by BP. Correlations between 305-d yield calculated using 50-d intervals from 50 to 250 DIM and 305-yield calculated using all TD to 500 DIM increased as TD data accumulated. Many cows can profitably produce for >305 DIM, and the revised program provides a flexible tool to model these records.
Resource Title: BESTPRED.
File Name: Web Page, url: https://aipl.arsusda.gov/software/bestpred/
download and information page
BK-Economics is a software package that was developed by a team of scientists at the Carl Hayden Bee Research Center in Tucson, Arizona to assist commercial beekeepers in streamling their business practices. This software allows beekeepers to simulate years of business, taking into account factors like equipment purchases, labor force, transportation, marketing strategies, loans, honey flow, and other hive products without taking the usual risks. This software, when used in combination with the marketing strategy information in publication, can help beekeepers formulate a successful business plan when making financial decisions, expanding an operation or just starting out.
Resource Title: BK-Economics download page.
File Name: Web Page, url: https://www.ars.usda.gov/research/software/download/?softwareid=76&modecode=20-22-05-00
Link to the download page: https://www.ars.usda.gov/research/software/download/?softwareid=76&modecode=20-22-05-00
Data about Phakopsora pachyrhizi, causative agent of soybean rust. Genomics and Bioinformatics Research Unit, Stoneville, MS.
\nResource Title: All supplemental files.
File Name: AllSupplementalFiles.zip
Resource Description:
Word, Excel, and JAVA files
\nResource Title: Data dictionary for BMC Genomics P. pachyrhizi Supplemental Data.
File Name: Data Dictionary - BMC Genomics P. pachyrhizi Supplemental Data.csv
Bat guano is an emergent paleoenvironmental archive and isotopic compositions of bat guano have been tied to climate, vegetation, and trophic processing in isolated studies. However, a comprehensive, multi-isotope assessment of bat guano has not been established, hindering the proliferation of guano-based paleoenvironmental research. In this study, we comprehensively examine isotopic compositions of a 12,000-year long bat guano core from Cave Springs Cave, Alabama as well as relevant isotopic data from other sources to improve our understanding of each isotope system (δ13C, δ15N, and δ2H), the source-to-sink components of guano isotope pathways, and the fractionation occurring along each multi-step isotopic pathway from sources (i.e., soil, atmosphere, rainfall) to guano formation. We find the δ13C values of guano from Cave Springs Cave primarily reflect local vegetation with a large shift that coincides with the onset of the Anthropocene (after 1950 C.E.). We also determine that the δ15N values of Cave Springs Cave guano were not associated with precipitation or any other climatic variable but instead reflect a change in bat diet and agricultural intensification during the past 600 years. Overall, these data adds to the existing body of bat guano research and supports bat guano as a reliable archive for paleoenvironmental reconstructions.
", "title": "Bat guano isotope systems (δ13C, δ15N, and δ2H) integrate environmental, climatic, and ecological signals", "distribution": [ { "@type": "dcat:Distribution", "downloadURL": "https://ndownloader.figshare.com/files/46819177", "format": "xlsx", "mediaType": "application/vnd.openxmlformats-officedocument.spreadsheetml.sheet", "title": "Guano_Isotope_Data.xlsx" } ], "license": "https://creativecommons.org/licenses/by/4.0/", "bureauCode": [ "005:18" ], "modified": "2024-06-12", "publisher": { "@type": "org:Organization", "name": "Agricultural Research Service" }, "keyword": [ "Bat guano", "Isotope fractionation", "Trophic pathways", "Holocene", "Paleoclimatology" ] }, { "identifier": "10113/AA22475", "accessLevel": "public", "contactPoint": { "hasEmail": "mailto:Gloria.Hoffman@ARS.USDA.GOV", "fn": "Hoffman, Gloria" }, "programCode": [ "005:040" ], "description": "Developed by Gloria DeGrandi-Hoffman et al. A model that simulates host and parasitoid population interactions, parasitism rates, and plant damage is described. BIOCONTROL-PARASITE can simulate many different species of phytophagus insects, parasitoids, and plants because specifics of the insect and plant biology are entered though menus at the beginning of a simulation. Now available in a complete archive (.ZIP file).
Resource Title: Bio-Control Parasite.
File Name: Web Page, url: https://www.ars.usda.gov/research/software/download/?softwareid=73&modecode=20-22-05-00
Bioenergy Cropping Systems Study for Resilient Economic Agricultural Practices in Mandan, North Dakota
\nRigorous economic analyses are crucial for the successful launch of lignocellulosic bioenergy facilities in 2014 and beyond. Our objectives are to (1) introduce readers to a query tool developed to use data downloaded from the Agricultural Research Service (ARS) REAPnet for constructing enterprise budgets and (2) demonstrate the use of the query tool with REAPnet data from two field research sites (Ames, IA, and Mandan, ND) for evaluating short-term economic performance of various biofuel feedstock production strategies. Our results for both sites showed that short-term (<3 years) impacts on grain profitability were lower at lower average annual crop residue removal rates. However, it will be important to monitor longer term changes to see if grain profitability declines over time and if biomass harvest degrades soil resources. Analyses for Iowa showed short-term breakeven field-edge biomass prices of $26–$42 Mg−1 among the most efficient strategies, while results for North Dakota showed breakeven prices of $54–$73 Mg−1. We suggest that development of the data query tool is important because it helps illustrate several different soil and crop management strategies that could be used to provide sustainable feedstock supplies.
Resource Title: GeoData catalog record.
File Name: Web Page, url: https://geodata.nal.usda.gov/geonetwork/srv/eng/catalog.search#/metadata/704e95b7-54ea-46af-8373-9f510da4e30c
Biofuel Residue Removal Study for Greenhouse gas Reduction through Agricultural Carbon Enhancement network and Resilient Economic Agricultural Practices in Morris, Minnesota\nThe Biofuel Residue Removal experiment was established at Swan Lake Research farm near Morris MN in 2005. It consists of 3 separate experimental sites, one for each of three tillages—Chisel Plow, No Tillage established in 1995 and No Tillage established in 2005. Four residue removal treatments with 4 replicates were established in a corn/soybean rotation where each phase of the rotation was present each year. Each replicate has 8 plots, 4 removal treatments times 2 crops. Residue removal treatments are no removal, half removal, complete removal, and 75 % removal which was changed to cob removal in 2008. The 3 experiments have a total of 96 plots—3 tillages x 4 removal rates x 2 crops x 4 replicates. Greenhouse gas fluxes were measured from spring of 2008 through planting in 2011 in the no and complete removal plots. Root and above ground samples were taken at 75% silk (corn) or R6 (soybean) for plots where greenhouse gasses were measured. Soil samples to 1 meter were taken in 2005 and 2010. Veronica Acosta-Martinez from Lubbock TX measured enzymes and FAME from samples taken in 2008. POM was measured in 2005 and 2009. Erosivity was measured using a rotary sieve in 2011, 2012, and 2013. Corn biomass was sampled at physiological maturity and divided into above ear shank, below ear shank, and cob. It was analyzed for C and N and microwave digested for ICP analysis.
Resource Title: GeoData catalog record.
File Name: Web Page, url: https://geodata.nal.usda.gov/geonetwork/srv/eng/catalog.search#/metadata/9e882675-98c7-4b45-9e5c-91453da48a9a
The data in this repository is to provide the scripts used in the assembly of the Bombus huntii genome. It can be used to replicate the steps necessary to assemble the genome described in National Center for Biotechnology Information (NCBI) BioProject: PRJNA858880. This genome assembly workflow was performed on the United States Department of Agriculture (USDA) - SCINet/Mississippi State University High Performance Computing Cluster (HPC) Atlas and installed via Conda.
The Brachypodium Resource site focuses on research efforts located at the ARS GGD research site toward developing the plant Brachypodium distachyon as a model system to study plant genes for cereals species.
Resource Title: Web Page.
File Name: Web Page, url: https://brachypodium.pw.usda.gov/
Breedbase is a web-based, comprehensive breeding management and analysis software. It can be used to design field layouts, collect phenotypic information using tablets, support the collection of genotyping samples in a field, store large amounts of high density genotypic information, and provide Genomic Selection related analyses and predictions. Breedbase supports the Breeding Application Programming Interface (BrAPI) standard which defines data objects and methods for exchanging breeding data. The Breedbase system has evolved from the Sol Genomics Network (SGN) and Cassavabase and related sites (see RTBbase.org). There are a number of instances running for diverse crops, including Cassava (https://cassavabase.org, sweet potato (https://sweetpotatobase.org), banana (https://musabase.org), rice (https://ricebase.org), tomato and other Solanaceae (https://solgenomics.net/) and many others. The Breedbase manual provides detailed information about available features.
Resource Title: Website Pointer for Breedbase.
File Name: Web Page, url: https://breedbase.org/
Search utilities: Wizard; Accessions and Plots; Organisms; Progenies and Crosses; Field Trials; Genotyping Plates; Genotyping Data Projects; Genotyping Protocols; Traits; Images; People; FAQ.
\nManage utilities: User Roles; Breeding Programs; Locations; Accessions; Seed Lots; Crosses; Field Trials; Genotyping Trials; Field Book App; Phenotyping; Barcodes; Label Designer; Download; Upload; ODK Data Collection.
\nAnalyze utilities:\nBreeder Tools -- Selection Index; Genomic Selection; Population Structure; Accession Usage; Compare Trials; Graphical Filtering\nSequence Analysis -- BLAST; VIGS Tool; HapMap Jbrowse\nOther -- Ontology Browser; Compose a New Trait.
\nBruner Farm Study for Resilient Economic Agricultural Practices in Ames, Iowa\nSoil P analyzed by Bray P extractant. Soil K analyzed by Ammonium Acetate extractant. For MeasSoilCover estimates: Photos were taken with a Canon, 12.3 megapixel EOS Rebel T3 mounted on a Van-Guard QS-46 large format quick shoe. The monopod that the amera/shoe assembly was attached to is a Wooster Sherlock model R056 telescoping pole. A mounting racket and spirit level (part #’s MSRMB and MSRSLA respectively, available from Cropscan inc. http://www.cropscan.com/mpscs.html) were attached to the pole in a manner so that when the camera is mounted, and the bubble in the spirit level is centered, then the focal plane of the camera is perpendicular to the ground resulting in a nadir image of the ground beneath the camera. The fully extended pole camera assembly was carried diagonally across each plot in field 70/71 an East to West or West to East transect with photos being taken every 9 paces. The unit was angled in such a way that the shadow from the pole and camera was not included in the photo. In the larger plots at the Uthe farm and the Poets facility, 30 to 40 paces were taken between each photo. The self timer on the camera was set for a 10 second delay and the camera was focused before initiating the timer. In most instances, 10 seconds was ample time to maneuver the camera into position for the photo. The cameras motion stabilizer function was turned on and the18mm zoom setting was always used to capture the maximum amount of area in each photo. Cold days, and wind speeds in excess of 30mph present a challenge. Photos were downloaded from the camera with the EOS utility software supplied with the camera and analyzed with sample point version 1.51 with a grid size of 10x10 chosen. A newer version of sample point is available at http://www.samplepoint.org/.
Resource Title: Bruner Farm Study for Resilient Economic Agricultural Practices in Ames, Iowa.
File Name: BrunerFarmStudy.zip
This archive of .wav format sound recordings provided by the ARS Center for Medical, Agricultural, and Veterinary Entomology supports the detection and control of hidden insect infestations. Most of the sound files were selected from noise-free sections of recorded signal, but some typical background noises mixed with insect sounds are also provided. The insect sounds have higher frequencies and shorter durations that make them relatively easy to separate from background.
\nFor more information including related references, links to pictures or other information about each species in the Encyclopedia of Life or Featured Creatures, see the Bug Bytes sound library [note: supersedes 2005 sound library at https://www.ars.usda.gov/ARSUserFiles/3559/soundlibrary.html ]
\nCategories:\nA. Stored product insect movement and feeding sounds\nB. Movement and feeding sounds of soil invertebrates\nC. Defensive stridulation by soil insects (dung beetles)\nD. Movement and feeding sounds of insects in wood. Termite head-banging\nE. Movement and feeding sounds of insects in plants\nF. Buzzing of fruit flies, butterflies, moths, and mosquitoes, stink bug, and Rhopalid communication\nG. Fire ants, phorid flies, and their interactions\nH. Cricket, katydid, and cicada sounds, including underground sounds of immature crickets\nI. Examples to distinguish insect sounds from background noise
\nSpecies:\nAedes albopictus (Asian tiger mosquito)\nAedes taeniorynchus (salt marsh mosquito)\nAnastrepha suspensa (Caribbean fruit fly)\nAnoplophora glabripennis (Asian longhorned beetle)\nAntitrogus parvulus (Childers grub)\nApocnemidophorus pipitzi (Brazilian peppertree stem borer )\nBactrocera tyroni (Queensland fruit fly)\nBlattella germanica (German cockroach)\nBuprestid spp. (larva in oak branch)\nCamponotus denticulatus (Ants in Australian outback)\nCephus cinctus (Wheat stem sawfly)\nCeratitis capitata (Mediterranean fruit fly)\nCoptotermes formosanus (Formosan termite)\nCotesia marginiventris (Braconid parasitoid)\nCryptotermes or Incisitermes (Drywood termites)\nDelia antiqua (Onion fly)\nDendroctonus valens (red turpentine beetle)\nDermolepida albohirtum (greyback cane grub)\nDiaphorina citri (Asian citrius psyllid)\nDiaprepes abbreviatus (Diaprepes root weevil)\nDrepanotermes (Australian termites)\nEuschistus servus (brown stink bug)\nEuzophera magnolialis (Magnolia root borer)\nEnsifera (Crickets and katydids)\nGastropoda (snails) underground\nGeotrupes egeriei (Dung beetle) defensive stridulation\nHeliconius cydno alithea (Heliconid butterfly) adult and pupa\nHylobius abietes (pine weevil) link to Hylobius abietes\nHylotrupes bajulus (Old house borer)\nJadera haematoloma (soapberry bug)\nLeptogenys kitteli (ants) stridulations\nLumbricidae (Earthworm)\nMagicacada spp. (Cicada)\nMallodon dasystomus\nMonochamus titillator (Southern pine sawyer)\nMusca domesticus (housefly)\nNezara viridula (Southern green stink bug)\nOryctes rhinoceros (Coconut rhinoceros beetle) stridulation\nOryctes elegans (Rhinoceros beetle) larval movement\nOtiorhynchus sulcatus (Black vine weevil)\nPeltotrupes profundus (Dung beetle) defensive stridulation\nPhyllophaga (White grub)\nPlodia interpunctella (Indian meal moth) adults and larvae\nPolyphylla spp. (June beetle)\nProstephanus truncatus larvae and adults\nPseudacteon tricuspis (Phorid flies)\nReticulitermes flavipes (Eastern subterranean termite) and related spp.\nReticulitermes virginicus (termite)\nRhynchophorus ferrugineus (red palm weevil)\nRhynchophorus cruentatus (palmetto weevil)\nScapteriscus vicinus (Mole cricket)\nSitophilus oryzae (Rice weevil)\nSitophilus zeamais (maize weevil) larvae and adults\nSolenopsis invicta (Fire ant)
\nResource Title: Insect Pest Sounds Inventory.
File Name: Insect-Pest-Sounds-inventory.csv
Resource Description: Listing of .wav files of insect pests as well as other invertebrates and background sounds, with file ID and description including file size, duration, and recording credits, arranged by category.
Resource Title: Insect Sound Library.
File Name: InsectSounds.zip
Resource Description: Insect pest sound recording library - .zip archive of .wav files organized in the following categories:\n\nA. Stored product insect movement and feeding sounds\nB. Movement and feeding sounds of soil invertebrates\nC. Defensive stridulation by soil insects (dung beetles)\nD. Movement and feeding sounds of insects in wood. Termite head-banging\nE. Movement and feeding sounds of insects in plants\nF. Buzzing of fruit flies, butterflies, moths, and mosquitoes, stink bug, and Rhopalid communication\nG. Fire ants, phorid flies, and their interactions\nH. Cricket, katydid, and cicada sounds, including underground sounds of immature crickets\nI. Examples to distinguish insect sounds from background noise
The Bushland Reference ET calculator was developed at the USDA-ARS Conservation and Production Research Laboratory, Bushland, Texas. Although it was designed and developed for use mainly by producers and crop consultants to manage irrigation scheduling, it can also be used in educational training, research, and other practical application. It uses the ASCE Standardized Reference Evapotranspiration (ET) Equation for calculating grass and alfalfa reference ET at hourly and daily time steps. This program uses the more complex equation for estimating clear-sky solar radiation provided in Appendix D of the ASCE-EWRI ET Manual. Users have the option of using single set or time series weather data to calculate reference ET. Daily reference ET can be calculated either by summing the hourly ET values for a given day or by using averages of the climatic data.
Resource Title: Bushland ET Calculator download page.
File Name: Web Page, url: https://www.ars.usda.gov/research/software/download/?softwareid=Bushland+ET+Calculator&modecode=30-90-05-00
Evapotranspiration (ET) is a major component of the hydrologic cycle. ET data are used for a variety of water management and research purposes such as irrigation scheduling, water and crop modeling, streamflow, water availability, and many more. Remote sensing products have been widely used to create spatially representative ET data sets which provide important information from field to regional scales. As UAV capabilities increase, remote sensing use is likely to also increase. For that purpose, scientists at the USDA-ARS research laboratory in Bushland, TX developed the Bushland Evapotranspiration and Agricultural Remote Sensing System (BEARS) software. The BEARS software is a Java based software that allows users to process remote sensing data to generate ET outputs using predefined models, or enter custom equations and models. The capability to define new equations and build new models expands the applicability of the BEARS software beyond ET mapping to any remote sensing application. The software also includes an image viewing tool that allows users to visualize outputs, as well as draw an area of interest using various shapes.
Resource Title: BEARS Software download page (Windows) .
File Name: Web Page, url: https://www.ars.usda.gov/research/software/download/?softwareid=BEARS+Software+(Windows)&modecode=30-90-05-00
This version of the software is designed for Windows operating systems. There is also a Mac version of the BEARS Software available for download.
The effectiveness of nitrogen fertilizer in maximizing agricultural production and increasing economic returns for farmers has led to its widespread use. However, when this element is applied to a farming system, it can enter the surrounding environment via atmospheric, surface and leaching pathways. Consultants, extension agents, farmers, and other stakeholders need tools than can be used to quickly calculate the risk of nitrogen movement into the environment. The Nitrogen Index can assist users in making these assessments by integrating data on a series of management practices, weather conditions, soil characteristics and off-site factors. This tool has been tested using data from different agroecosystems across the United States, China, Mexico, Argentina, a Mediterranean region in Spain, and the Caribbean. It has performed well in comparing the effects of different management practices on nitrogen losses by distinguishing practices with high and very high risk levels from practices with medium, low and very low risk levels.
Resource Title: Nitrogen Index Tool - N Index 4.5.
File Name: Web Page, url: https://www.ars.usda.gov/research/software/download/?softwareid=275&modecode=30-12-30-15
download page
A new process-based cotton model, CPM, has been developed to simulate the growth and development of upland cotton (Gossypium hirsutum L.) throughout the growing season with minimal data input. CPM predicts final cotton yield for any combination of soil, weather, cultivar and sequence of management actions.
\nOver the last 30 years, the U.S. Department of Agriculture's (USDA) Agricultural Research Service (ARS) has conducted a wide range of research on cotton, including work to develop a series of \"production models\" designed to serve as decision aids to cotton producers. In 1996, ARS decided to develop a new \"second generation\" Cotton Production Model (CPM) that would retain the best features of the earlier versions in a new, more versatile, and more user friendly framework. The development process was completed to the stage of beta-testing, when the need to redirect limited resources to other priorities caused ARS to decide not to complete the validation process.
\nARS believes that CPM, while only partially validated, has the potential to make useful contributions to American cotton producers when completed. For these reasons, ARS decided to make the model available for further development and commercialization.
\nThe Cotton Production Model (CPM) was developed with a modular structure using an object-oriented programming language, C++. The model draws upon the latest scientific knowledge available, and is intended to be used with a wide variety of cotton types across the entire US Cotton Belt. CPM is written in C++ using a new modular structure that allows flexibility and adaptability. This object-oriented structure should allow modules to be incorporated into process-based models of other crop species (see Acock, B. and V. R. Reddy. 1977. Designing an object-oriented structure for crop models. Ecological Modeling 94: 33-44). In addition to being modular and generic, CPM has other advantages over earlier models. Compared to previous cotton models, CPM is more robust, more user-friendly, more easily maintained, and more easily updated with future advances in science. The algorithms that simulate crop growth are derived in part from the best of each of the previous models, and they incorporate new physiological information as well. A new feature of CPM is that it incorporates 2DSOIL, an excellent up-to-date soil and root process model (see Timlin, D. J., Y. Pachepsky, and B. Acock. 1996. A design for a modular, generic soil simulator to interface with plant models. Agronomy Journal 88:162-169 ). 2DSOIL tracks water movement through the soil-plant-atmosphere continuum with hourly time-steps. It also incorporates a new model of plant water relations that responds realistically to water stress. CPM has updated treatments of carbon and nitrogen stresses compared to previous models, and it is designed for easy addition of responses to phosphorus and potassium. Because the growth of each leaf, inter-node and fruit is simulated separately, CPM should be easily linked to pest or disease models.
\nCPM has the potential to be useful as a decision aid for cotton farmers and crop production consultants. If fully developed, it would be a valuable tool to optimize management inputs such as irrigation, fertilization, plant growth regulators, and defoliant application prior to harvest. In its current version, however, CPM has not yet been fully validated to be useful as a decision aid. The released version of CPM should be considered an advanced model suitable for research purposes. ARS does not endorse its use for any other purpose at this time. Of particular importance to a decision aid model is the user interface. The interface under which CPM has been developed and tested is one that was earlier developed for the soybean model, GLYCIM, and has been documented elsewhere (Acock, B., Pachepsky, Y. A., Mironenko, E. V., Whisler, F. D., and Reddy, V. R. 1999. GUICS: A Generic User Interface for On-Farm Crop Simulations. Agronomy Journal. 91:657-665). CPM is part of the current release of GUICS.
Resource Title: Cotton Production Model.
File Name: Cotton Production Model.zip
Resource Description: The following are the files available for the Cotton Production Model software.
CSR1 Study for Greenhouse gas Reduction through Agricultural Carbon Enhancement network in Watkinsville, Georgia\n
Resource Title: Watkinsville, GA CSR1 Study (GAJPCSR1) CSV data.
File Name: GAJPCSR1_csv_data.zip
Resource Description: CSV format data on Experimental Units, Field Sites, Grazing Plants, Soil Biology, Soil Chemistry, Soil Physics, Amendments, Grazing, Persons, Treatments, Weather Daily, Weather Station.
CSR2 Study for Greenhouse gas Reduction through Agricultural Carbon Enhancement network in Watkinsville, Georgia\n
Resource Title: Watkinsville, GA CSR2 Study (GAJPCSR2) CSV data.
File Name: GAJPCSR2_csv_data.zip
Resource Description: CSV format data on Experimental Units, Field Sites, Grazing Plants, Soil Biology, Soil Chemistry, Soil Physics, Amendments, Grazing, Persons, Treatments, Weather Daily, Weather Station.
Successful predictions of the fate and transport of solutes in the subsurface hinges on the availability of accurate transport parameters. We modified and updated the CXTFIT (version 1.0) code of Parker and van Genuchten [1984] for estimating solute transport parameters using a nonlinear least-squares parameter optimization method. The program may be used to solve the inverse problem by fitting mathematical solutions of theoretical transport models, based upon the convection-dispersion equation (CDE), to experimental results. This approach allows parameters in the transport models to be quantified. The program may also be used to solve the direct or forward problem to determine the concentration as a function of time and/or position. Three different one-dimensional transport models are included: the conventional CDE; the chemical and physical nonequilibrium CDE; and a stochastic stream tube model based upon the local-scale CDE with equilibrium or nonequilibrium adsorption. The two independent stochastic parameters in the stream-tube model are the pore-water velocity, v, and either the dispersion coefficient, D, the distribution coefficient, Kd, or the nonequilibrium rate parameter, alpha. These pairs of stochastic parameters were described with a bivariate lognormal probability density function (pdf). Examples are given on how transport parameters may be determined from laboratory or field tracer experiments for several types of initial and boundary conditions, as well as different zero-order production profiles.
\nThe program comes with a user manual giving a detailed description of the computer program, including the subroutines used to evaluate the analytical solutions for optimizing model parameters. Input and output files for all major problems are also included in the manual.
Resource Title: CXTFIT download page.
File Name: Web Page, url: https://www.ars.usda.gov/research/software/download/?softwareid=92&modecode=20-36-15-00
Not only is cacao the basic ingredient in the world’s favorite confection, chocolate, but it provides a livelihood for over 6.5 million farmers in Africa, South America and Asia and ranks as one of the top ten agriculture commodities in the world. Historically, cocoa production has been plagued by serious losses due to pests and diseases. The release of the cacao genome sequence will provide researchers with access to the latest genomic tools, enabling more efficient research and accelerating the breeding process, thereby expediting the release of superior cacao cultivars. The sequenced genotype, Matina 1-6, is representative of the genetic background most commonly found in the cacao producing countries, enabling results to be applied immediately and broadly to current commercial cultivars. Matina 1-6 is highly homozygous which greatly reduces the complexity of the sequence assembly process. While the sequence provided is a preliminary release, it already covers 92% of the genome, with approximately 35,000 genes. We will continue to refine the assembly and annotation, working toward a complete finished sequence. Updates will be made available via the main project website.
\nResource Title: Cacao Genome Database.
File Name: Web Page, url: http://www.cacaogenomedb.org/
CameraTrapDetectoR is an R package that uses deep learning computer vision models to automatically detect, count, and classify common North American domestic and wild species in camera trap images. Data for all versions of the taxonomic species model are located in this dataset. This data is automatically downloaded, extracted, and deployed in the tool's deploy_model function. Additional information about the R package and the training data can be found in the package's Github repository: https://github.com/CameraTrapDetectoR/CameraTrapDetectoR
This research used resources provided by the SCINet project and the AI Center of Excellence of the USDA Agricultural Research Service, ARS project number 0500-00093-001-00-D.
\nList of Resources:
\nCarbon Crops Study for Greenhouse gas Reduction through Agricultural Carbon Enhancement network and Resilient Economic Agricultural Practices in Morris, Minnesota\nThe overall goal of the Carbon Crop study, established in 2000, was to assess strategies for increasing soil C sequestration including converting to no till systems and including perennial grasses (e.g., switchgrass and big bluestem) Overall, the goal of the study has remained constant, although individual treatments were changed after an incremental soil sampling, in response to new hypotheses and questions. Soil sampling is conducted as treatment changes are implemented. In 2012, two of the perennial grass systems (spring harvest of Switchgrass and Big Bluestem) were changed to corn/soybean rotations, beginning with a soybean entry point, to determine if the SOC accrued under the perennial system was lost by converting to a short annual rotation managed without tillage. The second change made was to compare the productivity between recent and traditional switchgrass cultivars. The final change was conversion of autumn harvest of Big Bluestem treatment replaced with an annual biomass crop – Sorghum-Sudan grass. Soil samples were taken to 1 m in 2000, 2006, 2011, and 2016. Nitrous oxide and carbon dioxide fluxes from the soil were measured from June 2009 through March 2012.
Resource Title: GeoData catalog record.
File Name: Web Page, url: https://geodata.nal.usda.gov/geonetwork/srv/eng/catalog.search#/metadata/21d6ff3b-de69-44ff-a2b6-980a9c972a35
Cattle and Sheep Whole Genome Sequence (WGS)
\nUSMARC Beef Cattle Diversity Panel (MBCDPv2.9)
\nOngoing 10x WGS from cell lines used in USMARC research like Madin-Darby Bovine Kidney (MDBK) cells.
\nResource Title: Cattle and Sheep Whole Genome Sequence (WGS).
File Name: Web Page, url: https://www.ars.usda.gov/plains-area/clay-center-ne/marc/wgs/main/
These data are the result of a four-year (2017-2020) study comparing rangeland forage and cattle responses across three grazing management practices in central North Dakota. In each season, cow-calf pairs grazed on n = 4 pastures for each grazing management practice: Patch burned, in which a 40-ac patch of 160-ac pastures were burned with prescribed fire each spring with no internal fences; Continuous, in which neither prescribed fire nor internal fences were used; and Rotational, in which 40-ac pastures were sub-divided into 4 paddocks each with no prescribed fire. The data were primarily managed by Megan Wanchuk in support of her Master's thesis:
Wanchuk, MR. 2022. Patch-Burning Improves Forage Nutritive Value and Livestock Performance over Rotational and Continuous Grazing Strategies (Master's Thesis, North Dakota State University, Fargo, North Dakota).
", "title": "Central Grasslands Research Extension Center (North Dakota) patch-burning and grazing management", "distribution": [ { "@type": "dcat:Distribution", "downloadURL": "https://ndownloader.figshare.com/files/45222205", "format": "xlsx", "mediaType": "application/vnd.openxmlformats-officedocument.spreadsheetml.sheet", "title": "CentralGrasslandsFireForageNAL.xlsx" } ], "license": "https://creativecommons.org/licenses/by-sa/4.0/", "bureauCode": [ "005:18" ], "modified": "2024-04-19", "publisher": { "@type": "org:Organization", "name": "Agricultural Research Service" }, "accrualPeriodicity": "R/P1M", "keyword": [ "Rangeland Ecology", "Rangeland Management", "Rangeland fire ecology", "Prescribed fire", "Patch burn grazing", "Pyric herbivory" ] }, { "identifier": "10.15482/USDA.ADC/1520855", "accessLevel": "public", "contactPoint": { "hasEmail": "mailto:jweitzman@gc.cuny.edu", "fn": "Weitzman, Julie" }, "programCode": [ "005:040" ], "description": "In situ denitrification rates in intact soil cores from the Central Mississippi River Basin (CMRB) LTAR site in MO quantified by directly measuring dinitrogen (N2) and nitrous oxide (N2O) production via the Nitrogen-Free Air Recirculation Method (N-FARM) from 2016-2018. 10-day laboratory incubations provided estimates of ancillary soil data, including microbial respiration and potential net N mineralization and nitrification.
Resource Title: Central Mississippi River Basin Data Dictionary.
File Name: Central Mississippi River Basin Data Dictionary.csv
Resource Description: Data Dictionary for CMRB dataset.
Resource Title: Central Mississippi River Basin Metadata.
File Name: Central Mississippi River Basin Metadata.csv
Resource Description: Metadata for CMRB dataset.
Resource Title: Central Mississippi River Basin Dataset.
File Name: Central Mississippi River Basin Dataset.csv
Resource Description: CMRB Dataset.
Central Plains Experimental Range Study for Long-Term Agroecosystem Research in Nunn, Colorado\nThe Central Plains Experimental Range (CPER) is a site with the The Long-Term Agroecosystem Research (LTAR) Network, which consists of 18 sites across the continental United States (US) sponsored by the US Department of Agriculture, Agricultural Research Service, universities and non-governmental organizations. LTAR scientists seek to determine ways to ensure sustainability and enhance food production (and quality) and ecosystem services at broad regional scales. They are conducting common experiments across the LTAR network to compare traditional production strategies (“business as usual or BAU) with aspirational strategies, which include novel technologies and collaborations with farmers and ranchers. Within- and cross-site network success towards achieving the desired outcomes of enhancing quality food production and reducing environmental impact requires that LTAR scientists and collaborators have well-timed access to various data. We are striving to create opportunities to package and share long-term legacy observations from each site, with new data and metadata in useable, well documented and consistent formats for them.
Resource Title: Nunn, CO Central Plains Experimental Range Study (CONUCPER) CSV data.
File Name: CONUCPER_csv_data.zip
Resource Description: CSV format data on Experimental Units, Field Sites, Grazing Plants, Grazing, Persons, Treatments, Weather Daily, Weather Station.
A network of soil moisture and soil temperature profiles as well as solar radiation and precipitation gages are distributed throughout the central region of the DelMarVa peninsula to capture variability of these parameters to give a broad understanding of agricultural conditions in this domain. Soil profile data is captured at depths of 5, 10, 20, and 50 cm below the surface and recorded hourly at locations on the edges of agricultural fields, not inside the production fields.
Resources in this dataset:
Cligen is a stochastic weather generator which produces daily estimates of precipitation, temperature, dewpoint, wind, and solar radiation for a single geographic point, using monthly parameters (means, SD's, skewness, etc.) derived from the historic measurements. Unlike other climate generators, it produces individual storm parameter estimates, including time to peak, peak intensity, and storm duration, which are required to run the WEPP and the WEPS soil erosion models. Station parameter files to run Cligen for several thousand U. S. sites are available for download from this website: also data and software to build station files for international sites. With the exception of Tmin, Tmax, and Tdew temperatures (changed in January 2004), daily estimates for each parameter are generated independently of the others. With the current random number generator, subsequent runs on the same machine made with identical inputs will produce identical results.
\nUsers of daily simulation models should consider the impacts of Cligen's characteristics on their application. Individual parameter distributions may be expected to reproduce monthly historic distributions quite well. However, if the model in question is sensitive to the daily interactions of two or more of the parameters Cligen produces, Cligen may not be the most appropriate weather generator to use. This is because for a given day, it generates solar radiation, and maximum and minimum temperatures completely independently from precipitation. Experience and common sense tell us that these parameters are NOT independent. In practice this may not be a huge issue, since it is not uncommon for models to be sensitive to one weather parameter on a daily basis, and relatively insensitive to the others, as long as their monthly trends are preserved.
Resource Title: Cligen.
File Name: Web Page, url: https://www.ars.usda.gov/midwest-area/west-lafayette-in/national-soil-erosion-research/docs/wepp/cligen/
Overview, source code downloads, data files, and publications.
This work was conducted by the Diverse Rotations Improve Valuable Ecosystem Services (DRIVES) project, based in the USDA-ARS Sustainable Agricultural Systems Lab in Beltsville, MD. The DRIVES team compiled a database of 20-plus long-term cropping systems experiments in North America in order to conduct cross-site research. This repository contains all scripts from our first research paper from the DRIVES database: \"Rotational complexity increases cropping system output under poorer growing conditions,\" published in One Earth (in press). This analysis uses crop yield and experimental design data from the DRIVES database and public data sources for crop prices and inflation. This repository includes limited datasets derived from public sources or lacking connection to site IDs. We do not have permission to share the full primary dataset, but can provide data upon request with permission from site contacts.
The scripts show all data setup, analysis, and visualization steps used to investigate how crop rotation diversity (defined by rotation length and the number of species) impacts productivity of whole rotations and component crops under varying growing conditions. We used Bayesian multilevel modeling fit to data from 20 long-term cropping systems datasets in North America (434 site-years, 36,000 observations). Rotation- and crop-level productivity were quantified as dollar output, using price coefficients derived from National Agriculture Statistics Service (NASS) price data (included in repository). Growing condtions were quantified using an Environmental Index calculated from site-year average output. Bayesian multilevel models were implemented using the 'brms' R package, which is a wrapper for Stan.
Descriptions of all files are included in README.pdf.
", "title": "Code and limited data for: Rotational complexity increases cropping system output under poorer growing conditions", "distribution": [ { "@type": "dcat:Distribution", "downloadURL": "https://ndownloader.figshare.com/files/47261632", "format": "pdf", "mediaType": "application/pdf", "title": "README.pdf" }, { "@type": "dcat:Distribution", "downloadURL": "https://ndownloader.figshare.com/files/46749820", "format": "R", "mediaType": "text/plain", "title": "setUpDataViewsForFocalAndRotationYield_revision.R" }, { "@type": "dcat:Distribution", "downloadURL": "https://ndownloader.figshare.com/files/47258842", "format": "R", "mediaType": "text/plain", "title": "KEMfiguringOutDetrendingWithSiteData.R" }, { "@type": "dcat:Distribution", "downloadURL": "https://ndownloader.figshare.com/files/46749853", "format": "R", "mediaType": "text/plain", "title": "applyDetrendingToYieldData.R" }, { "@type": "dcat:Distribution", "downloadURL": "https://ndownloader.figshare.com/files/46749835", "format": "R", "mediaType": "text/plain", "title": "supplementCode_detrendingCropYields.R" }, { "@type": "dcat:Distribution", "downloadURL": "https://ndownloader.figshare.com/files/46749823", "format": "R", "mediaType": "text/plain", "title": "setUpForEIDIanalysis_revision.R" }, { "@type": "dcat:Distribution", "downloadURL": "https://ndownloader.figshare.com/files/46749826", "format": "R", "mediaType": "text/plain", "title": "setUpForFigures_revision.R" }, { "@type": "dcat:Distribution", "downloadURL": "https://ndownloader.figshare.com/files/46749829", "format": "R", "mediaType": "text/plain", "title": "specifyAndRunRCImodels_revisionV01.R" }, { "@type": "dcat:Distribution", "downloadURL": "https://ndownloader.figshare.com/files/46749814", "format": "R", "mediaType": "text/plain", "title": "priorPredictionTesting_20231215.R" }, { "@type": "dcat:Distribution", "downloadURL": "https://ndownloader.figshare.com/files/46749856", "format": "R", "mediaType": "text/plain", "title": "checkModels_RCI_revision.R" }, { "@type": "dcat:Distribution", "downloadURL": "https://ndownloader.figshare.com/files/46749841", "format": "R", "mediaType": "text/plain", "title": "supplementCode_posteriorPredictionPlots_revision.R" }, { "@type": "dcat:Distribution", "downloadURL": "https://ndownloader.figshare.com/files/46749817", "format": "R", "mediaType": "text/plain", "title": "obtainResultsFromRCIModels_EIDIanalysis_revision.R" }, { "@type": "dcat:Distribution", "downloadURL": "https://ndownloader.figshare.com/files/46749862", "format": "R", "mediaType": "text/plain", "title": "figureCode_RCIvRCIEIslope_revision.R" }, { "@type": "dcat:Distribution", "downloadURL": "https://ndownloader.figshare.com/files/47261626", "format": "R", "mediaType": "text/plain", "title": "figureCode_RCI123_revision.R" }, { "@type": "dcat:Distribution", "downloadURL": "https://ndownloader.figshare.com/files/46749850", "format": "R", "mediaType": "text/plain", "title": "tableCode_summaryCoefficients_revision.R" }, { "@type": "dcat:Distribution", "downloadURL": "https://ndownloader.figshare.com/files/46749844", "format": "R", "mediaType": "text/plain", "title": "supplementCode_siteCoefficients_revision.R" }, { "@type": "dcat:Distribution", "downloadURL": "https://ndownloader.figshare.com/files/46749859", "format": "R", "mediaType": "text/plain", "title": "designRotationReferenceSummaryFigures_KEM.R" }, { "@type": "dcat:Distribution", "downloadURL": "https://ndownloader.figshare.com/files/46749811", "format": "R", "mediaType": "text/plain", "title": "lookUpResultsSummaryStats_revision.R" }, { "@type": "dcat:Distribution", "downloadURL": "https://ndownloader.figshare.com/files/46749832", "format": "R", "mediaType": "text/plain", "title": "supplementCode_cropPriceCoefficientSensitivityAnalysis.R" }, { "@type": "dcat:Distribution", "downloadURL": "https://ndownloader.figshare.com/files/46749847", "format": "R", "mediaType": "text/plain", "title": "supplementFigures_CropPriceSensitivityAnalysis.R" }, { "@type": "dcat:Distribution", "downloadURL": "https://ndownloader.figshare.com/files/46749838", "format": "R", "mediaType": "text/plain", "title": "supplementCode_managementContrasts_revision.R" }, { "@type": "dcat:Distribution", "downloadURL": "https://ndownloader.figshare.com/files/47258698", "format": "R", "mediaType": "text/plain", "title": "cropCategories.R" }, { "@type": "dcat:Distribution", "downloadURL": "https://ndownloader.figshare.com/files/47258713", "format": "R", "mediaType": "text/plain", "title": "functionToCalculateRotationalIndices20220913.R" }, { "@type": "dcat:Distribution", "downloadURL": "https://ndownloader.figshare.com/files/46749865", "format": "R", "mediaType": "text/plain", "title": "HPDIfunction.R" }, { "@type": "dcat:Distribution", "downloadURL": "https://ndownloader.figshare.com/files/46749868", "format": "R", "mediaType": "text/plain", "title": "loadModelFitsForRCI_revision.R" }, { "@type": "dcat:Distribution", "downloadURL": "https://ndownloader.figshare.com/files/47258770", "format": "csv", "mediaType": "text/plain", "title": "NASScropPricesByMarketYear1991to2019.csv" }, { "@type": "dcat:Distribution", "downloadURL": "https://ndownloader.figshare.com/files/47258755", "format": "csv", "mediaType": "text/plain", "title": "NASScropPriceAveragesWithInflation1991to2019.csv" }, { "@type": "dcat:Distribution", "downloadURL": "https://ndownloader.figshare.com/files/47258758", "format": "csv", "mediaType": "text/plain", "title": "NASScropPriceCategoryCodingDE.csv" }, { "@type": "dcat:Distribution", "downloadURL": "https://ndownloader.figshare.com/files/47258764", "format": "csv", "mediaType": "text/plain", "title": "US Inflation 1990-2022 OECD Consumer Price Index.csv" }, { "@type": "dcat:Distribution", "downloadURL": "https://ndownloader.figshare.com/files/47258836", "format": "RData", "mediaType": "application/gzip", "title": "objectsForDetrending.RData" } ], "license": "https://creativecommons.org/licenses/by/4.0/", "bureauCode": [ "005:18" ], "modified": "2024-06-26", "publisher": { "@type": "org:Organization", "name": "Agricultural Research Service" }, "accrualPeriodicity": "R/P1Y", "keyword": [ "crop rotation", "LONG-TERM EXPERIMENTS", "crop yield", "Bayesian Multilevel Modeling" ] }, { "identifier": "10.15482/USDA.ADC/1399689", "accessLevel": "public", "contactPoint": { "hasEmail": "mailto:amy.tabb@ars.usda.gov", "fn": "Tabb, Amy" }, "programCode": [ "005:040" ], "description": "This record contains C++ code and a Docker release for performing curve skeletonization of objects, which have a voxel representation. Curve skeletonization is used to convert a three-dimensional digital object or shape to locally one-dimensional parts; in other words, to reduce the shape information to a more easily processed form. Our algorithm does so for objects whose surface may be noisy, which is a common occurrence when working with data acquired under real-world conditions. This record also includes a test dataset for verifying that the code is running correctly and as examples of how to convert from different file types. This code is a companion to the paper, “Fast and robust curve skeletonization for real-world elongated objects,” by Amy Tabb and Henry Medeiros, published as part of the IEEE WACV 2018 conference. A free, identical version is available on arXiv:1702:07619[cs.CV] (https://arxiv.org/pdf/1702.07619.pdf).
\nOpen source code can be found at:\nhttps://github.com/amy-tabb/CurveSkel-Tabb-Medeiros
\nDocker container release can be found at:\nhttps://hub.docker.com/r/amytabb/curveskel-tabb-medeiros-docker/
\nWe also include the results of using our code on one of the examples so that you can be sure that the code worked correctly. This folder is named 'A_Result' and can be found in the resource titled 'examples.zip'. A README is included in this record as well as in the examples folder. Both the GitHub and Docker repositories contain the test data to confirm that your data is formatted appropriately.
\nProblems/Comments/Bugs should be addressed to amy.tabb@ars.usda.gov
\nNote: Docker link to Curve Skeleton repository resource was added on 7/30/2018
Resource Title: Examples of data formats needed to run the code.
File Name: examples.zip
Resource Description: This directory contains a three-dimensional object in voxel representation, in directory \"OurFileFormat\". \"ConversionFromImageSequence\" contains files to demonstrate how to convert from the image sequence format common with ImageJ/Fiji to our format using our code. Finally, \"A_Result\" shows the results from running our code. A README is also included.
Resource Software Recommended: Link to Github code,url: https://github.com/amy-tabb/CurveSkel-Tabb-Medeiros
Resource Title: README for the example directory.
File Name: README_2017.txt
Abstract
\nThe expansive range of Lewis flax (Linum lewisii Pursh.), an herbaceous perennial, exposes the species to a diversity of climatic conditions. As interest in the domestication and adoption of perennial crop alternatives grows and interest in this species for natural area restoration continues, the assurance of a commercial plant variety’s ability to endure the full range of possible climatic extremes is paramount. This study examines the freezing tolerance of a geographically representative sampling of 44 Lewis flax accessions at winter temperature extremes experienced in the northern Great Plains of the United States. Survival analysis models were adapted to include temperature exposure, in replacement of ordinal time typically used in such models, to produce statistics evaluating reactions to extreme temperatures that Lewis flax would encounter in our field environments. Our results revealed Lewis flax is more freezing tolerant than previously reported, and revealed four accessions with significantly superior genetic freezing tolerance than the released ‘Maple Grove’ cultivar. Furthermore, regrowth analyses indicate variation among accessions not associated with survival, which could lead to improving regrowth rate and survival simultaneously. These findings and their methodology expand the understanding of Lewis flax adaptation for winter hardiness and offer an efficient, new model that can be used to evaluate freezing tolerance at ordinal temperatures without requiring extensive prior physiological knowledge for a species.
\nGitHub for Gossweiler et al., 2024. Contains R code used for figure generation and SAS code for statistical analyses.
", "title": "Code from: Survival analysis of freezing stress in the North American native perennial flax, Linum lewisii Pursh.", "distribution": [ { "@type": "dcat:Distribution", "downloadURL": "https://github.com/BrianSmart/LewisFlaxFrostStress", "mediaType": "text/html", "title": "https://github.com/BrianSmart/LewisFlaxFrostStress" } ], "license": "https://creativecommons.org/publicdomain/zero/1.0/", "bureauCode": [ "005:18" ], "modified": "2024-04-23", "publisher": { "@type": "org:Organization", "name": "Agricultural Research Service" }, "accrualPeriodicity": "irregular", "keyword": [ "Linum lewisii", "perennial grains", "Frost hardiness" ] }, { "identifier": "10113/AA22403", "accessLevel": "public", "contactPoint": { "hasEmail": "mailto:amy.tabb@usda.gov", "fn": "Tabb, Amy" }, "programCode": [ "005:040" ], "description": "Images are used frequently in plant phenotyping to capture measurements. This chapter offers a repeatable method for capturing two-dimensional measurements of plant parts in field or laboratory settings using a variety of camera styles (cellular phone, DSLR), with the addition of a printed calibration pattern. The method is based on calibrating the camera using information available from the EXIF tags from the image, as well as visual information from the pattern. Code is provided to implement the method, as well as a dataset for testing. We include steps to verify protocol correctness by imaging an artifact. The use of this protocol for two-dimensional plant phenotypoing will allow data capture from different cameras and environments, with comparison on the same physical scale.
Resource Title: Code repository: camera-as-scanner.
File Name: Web Page, url: https://github.com/amy-tabb/camera-as-scanner
Code for calibrating a camera using a pattern, EXIF tags, and then warping to physical dimensions times a scaling factor. Originally for use in two-dimensional plant phenotyping.
Resource Title: Code repository: aruco-pattern-write.
File Name: Web Page, url: https://github.com/amy-tabb/aruco-pattern-write
Basic code for generating a gird of aruco patterns.
Resource Title: Code repository: camera-as-scanner-data.
File Name: Web Page, url: https://github.com/amy-tabb/camera-as-scanner-data
A minimal working example to verify that the installation of camera-as-scanner is working as expected.
Resource Title: Data and Code from: Using cameras for precise measurement of two-dimensional plant features: CASS (Zenodo).
File Name: Web Page, url: http://doi.org/10.5281/zenodo.3677473
ComBase includes a systematically formatted database of quantified microbial responses to the food environment with more than 65,000 records, and is used for:
\nThe ComBase Browser enables you to search thousands of microbial growth and survival curves that have been collated in research establishments and from publications.
\nThe ComBase Predictive Models are a collection of software tools based on ComBase data to predict the growth or inactivation of microorganisms as a function of environmental factors such as temperature, pH and water activity in broth.
\nInterested users can also contribute growth or inactivation data via the Donate Data page, which includes instructional videos, data template and sample, and an Excel demo file of data and macros for checking data format and syntax.
\nResource Title: Website Pointer to ComBase.
File Name: Web Page, url: https://www.combase.cc/index.php/en/
ComBase is an online tool for quantitative food microbiology. Its main features are the ComBase database and ComBase models, and can be accessed on any web platform, including mobile devices. The focus of ComBase is describing and predicting how microorganisms survive and grow under a variety of primarily food-related conditions. ComBase is a highly useful tool for food companies to understand safer ways of producing and storing foods. This includes developing new food products and reformulating foods, designing challenge test protocols, producing Food Safety plans, and helping public health organizations develop science-based food policies through quantitative risk assessment. Over 60,000 records have been deposited into ComBase, describing how food environments, such as temperature, pH, and water activity, as well as other factors (e.g. preservatives and atmosphere) affect the growth of bacteria. Each data record shows users how bacteria populations change for a particular combination of environmental factors. Mathematical models (the ComBase Predictor and Food models) were developed on systematically generated data to predict how various organisms grow or survive under various conditions.
Identifying and developing effective and sensitive detection methods for antimicrobial resistant Salmonella enterica from surface water is a goal of the U.S. National Antimicrobial Resistance Monitoring System (NARMS). No specific microbiological methods used in surveillance efforts for Salmonella enterica or antimicrobial resistant S. enterica in water have been standardized or reported in the U.S. Here we describe a multi-laboratory evaluation of four methods, bulk water enrichment (BW), vertical Modified Moore Swab (VMMS), modified Standard Method 9260.B3 (SM), and dead-end ultrafiltration (DEUF), to recover S. enterica from surface water. In Phase 1, one-liter volumes of surface water (n=60) were collected from the same site in Fall 2021 on five different dates. Water was shipped and analyzed at four different USDA ARS laboratories for recovery of environmental Salmonella and an inoculated fluorescent S. Typhimurium strain (ca. 30 CFU/L). One-liter samples (n=20) were subjected to recovery and enrichment by either BW, VMMS, or SM. Overall, fluorescent S. Typhimurium and environmental Salmonella spp. were recovered from 65% (39/60) and 45% (27/60) of water samples, respectively. SM, VMMS, and BW recovered fluorescent S. Typhimurium from 75%, 60% and 60% of inoculated samples, respectively. Analysis by Chi-squared test determined that laboratory location had a significant (p < 0.05) effect on recovery compared to method or date of water collection. In Phase 2, DEUF was compared to SM at two different laboratory locations to recover fluorescent S. Typhimurium (30 CFU/L) from 1-L samples. SM and DEUF recovered S. Typhimurium from 100% (20/20) and 95% (19/20) of inoculated water samples, respectively; laboratory location nor recovery method (p> 0.05) affected S. Typhimurium recovery. Results indicate that SM method consistently recovered low levels of Salmonella from inoculated water samples and should be prioritized for Salmonella recovery from surface water.
\nResources in this dataset:
\nResource Title: Data Dictionary\nFile Name: Data Dictionary AgCommons 3 9 2023.xlsx\nResource Description: List of abbreviations used in data set.
\nResource Title: Water quality and rainfall data for surface water collected from MA04 site\nFile Name: Water quality rainfall data Ag Data Commons Phase 1 Sharma 3 22 2023.xlsx\nResource Description: Water quality data for surface water collected from MA04 site - surface water used for inoculation of fluorescent Salmonella Typhimurium on five different dates (Biological Replicates 1 -5) in September / October 2021 - this is termed Phase 1 in the manuscript.
\nResource Title: Phase 1 Comparison of recovery methods of fluorescent Salmonella Typhimurium using three different recovery methods\nFile Name: Phase 1 BW SM VMMS comparison data 9 1 2022.xlsx\nResource Description: Recovery methods of fluorescent Salmonella Typhimurium at four different laboratory locations (A,B,C,D) using three different recovery methods (BW, SM, VMMS).
\nResource Title: Recovery of naturally present (environmental Salmonella) from surface water recovered by three different methods\nFile Name: Phase 1 Environmental Salmonella recovery 9 1 2023.xlsx\nResource Description: Recovery of naturally present (environmental Salmonella) from surface water recovered at four different laboratory locations by three different methods (BW, SM, VMMS).
\nResource Title: Phase 2 Recovery of fluorescent Salmonella Typhimurium by SM and DEUF at two different locations\nFile Name: Phase 2 DEUF vs SM bioball data 9 1 2022.xlsx\nResource Description: Recovery of fluorescent Salmonella Typhimurium by SM and DEUF Methods using surface water from different laboratory locations (B and D)
\nResource Title: Recovery of fluorescent Salmonella Typhimurium from refrigerated surface water\nFile Name: Refrigeration Data Summary Tabl.xlsx\nResource Description: Recovery of fluorescent Salmonella Typhimurium from surface water refrigerated for 7 days before recovery by BW, SM, or VMMS.
\n[Note: Integrated as part of FoodData Central, April 2019.]\nThe database consists of several sets of data: food descriptions, nutrients, weights and measures, footnotes, and sources of data. The Nutrient Data file contains mean nutrient values per 100 g of the edible portion of food, along with fields to further describe the mean value. Information is provided on household measures for food items. Weights are given for edible material without refuse. Footnotes are provided for a few items where information about food description, weights and measures, or nutrient values could not be accommodated in existing fields.
\nData have been compiled from published and unpublished sources. Published data sources include the scientific literature. Unpublished data include those obtained from the food industry, other government agencies, and research conducted under contracts initiated by USDA’s Agricultural Research Service (ARS).
\nUpdated data have been published electronically on the USDA Nutrient Data Laboratory (NDL) web site since 1992. Standard Reference (SR) 28 includes composition data for all the food groups and nutrients published in the 21 volumes of \"Agriculture Handbook 8\" (US Department of Agriculture 1976-92), and its four supplements (US Department of Agriculture 1990-93), which superseded the 1963 edition (Watt and Merrill, 1963). SR28 supersedes all previous releases, including the printed versions, in the event of any differences.
\nAttribution for photos:\nPhoto 1: k7246-9 Copyright free, public domain photo by Scott Bauer\nPhoto 2: k8234-2 Copyright free, public domain photo by Scott Bauer
\nResource Title: READ ME - Documentation and User Guide - Composition of Foods Raw, Processed, Prepared - USDA National Nutrient Database for Standard Reference, Release 28.
File Name: sr28_doc.pdf
Resource Software Recommended: Adobe Acrobat Reader,url: http://www.adobe.com/prodindex/acrobat/readstep.html
Resource Title: ASCII (6.0Mb; ISO/IEC 8859-1).
File Name: sr28asc.zip
Resource Description: Delimited file suitable for importing into many programs. The tables are organized in a relational format, and can be used with a relational database management system (RDBMS), which will allow you to form your own queries and generate custom reports.
Resource Title: ACCESS (25.2Mb).
File Name: sr28db.zip
Resource Description: This file contains the SR28 data imported into a Microsoft Access (2007 or later) database. It includes relationships between files and a few sample queries and reports.
Resource Title: ASCII (Abbreviated; 1.1Mb; ISO/IEC 8859-1).
File Name: sr28abbr.zip
Resource Description: Delimited file suitable for importing into many programs. This file contains data for all food items in SR28, but not all nutrient values--starch, fluoride, betaine, vitamin D2 and D3, added vitamin E, added vitamin B12, alcohol, caffeine, theobromine, phytosterols, individual amino acids, individual fatty acids, or individual sugars are not included. These data are presented per 100 grams, edible portion. Up to two household measures are also provided, allowing the user to calculate the values per household measure, if desired.
Resource Title: Excel (Abbreviated; 2.9Mb).
File Name: sr28abxl.zip
Resource Description: For use with Microsoft Excel (2007 or later), but can also be used by many other spreadsheet programs. This file contains data for all food items in SR28, but not all nutrient values--starch, fluoride, betaine, vitamin D2 and D3, added vitamin E, added vitamin B12, alcohol, caffeine, theobromine, phytosterols, individual amino acids, individual fatty acids, or individual sugars are not included. These data are presented per 100 grams, edible portion. Up to two household measures are also provided, allowing the user to calculate the values per household measure, if desired.
Resource Software Recommended: Microsoft Excel,url: https://www.microsoft.com/
Resource Title: ASCII (Update Files; 1.1Mb; ISO/IEC 8859-1).
File Name: sr28upd.zip
Resource Description: Update Files - Contains updates for those users who have loaded Release 27 into their own programs and wish to do their own updates. These files contain the updates between SR27 and SR28. Delimited file suitable for import into many programs.
The Conservation Practice Effectiveness Database compiles information on the effectiveness of a suite of conservation practices. This database presents a compilation of data on the effectiveness of innovative practices developed to treat contaminants in surface runoff and tile drainage water from agricultural landscapes. Traditional conservation practices such as no-tillage and conservation crop rotation are included in the database, as well as novel practices such as drainage water management, blind inlets, and denitrification bioreactors. This will be particularly useful to conservation planners seeking new approaches to water quality problems associated with dissolved constituents, such as nitrate or soluble reactive phosphorus (SRP), and for researchers seeking to understand the circumstances in which such practices are most effective. Another novel feature of the database is the presentation of information on how individual conservation practices impact multiple water quality concerns. This information will be critical to enabling conservationists and policy makers to avoid (or at least be aware of) undesirable tradeoffs, whereby great efforts are made to improve water quality related to one resource concern (e.g., sediment) but exacerbate problems related to other concerns (e.g., nitrate or SRP). Finally, we note that the Conservation Practice Effectiveness Database can serve as a source of the soft data needed to calibrate simulation models assessing the potential water quality tradeoffs of conservation practices, including those that are still being developed. This database is updated and refined annually.
Resource Title: 2019 Conservation Practice Effectiveness (CoPE) Database.
File Name: Conservation_Practice_Effectiveness_2019.xlsx
Resource Description: This version of the database was published in 2019.
This dataset contains files used in the manuscript, \"Conserved B cell signaling, activation, and differentiation in porcine jejunal and ileal Peyer's patches despite distinct immune landscapes\" by Wiarda et al. (2023). Samples of jejunum and ileum containing Peyer's patches were collected from each of three, 8-week-old, female pigs and processed for single-cell RNA sequencing (scRNA-seq) and spatial transcriptomics (STomics). Data were analyzed to determine cell type compositions, spatial regions, gene expression, signaling interaction networks, activation trajectories, and cell locations. Files included here can be used to reconstruct all analyses of the manuscript, allowing individual users to perform independent queries. Also included is a vignette of all coding steps used in this work, provided as a Markdown file. Scripts and raw data will be available via preprint (to follow).
\nSee README for list of resources in this dataset with descriptions.
", "title": "Conserved B cell signaling, activation, and differentiation in porcine jejunal and ileal Peyer's patches despite distinct immune landscapes", "distribution": [ { "@type": "dcat:Distribution", "downloadURL": "https://ndownloader.figshare.com/files/44651953", "format": "rds", "mediaType": "application/gzip", "title": "STomics_PredictedLocations_ClusteringAnnotation_Jejunum.rds" }, { "@type": "dcat:Distribution", "downloadURL": "https://ndownloader.figshare.com/files/44651959", "format": "rds", "mediaType": "application/gzip", "title": "STomics_PredictedLocations_ClusteringAnnotation_Ileum.rds" }, { "@type": "dcat:Distribution", "downloadURL": "https://ndownloader.figshare.com/files/44651962", "format": "rds", "mediaType": "application/gzip", "title": "STomics_PredictedLocations_ManualAnnotation_Jejunum.rds" }, { "@type": "dcat:Distribution", "downloadURL": "https://ndownloader.figshare.com/files/44651968", "format": "rds", "mediaType": "application/gzip", "title": "STomics_PredictedLocations_ManualAnnotation_Ileum.rds" }, { "@type": "dcat:Distribution", "downloadURL": "https://ndownloader.figshare.com/files/44651977", "format": "rds", "mediaType": "application/gzip", "title": "CellChat_Ileum_SecretedSignalOnly_CD4macrophages.rds" }, { "@type": "dcat:Distribution", "downloadURL": "https://ndownloader.figshare.com/files/44651989", "format": "rds", "mediaType": "application/gzip", "title": "JejunumOnly.rds" }, { "@type": "dcat:Distribution", "downloadURL": "https://ndownloader.figshare.com/files/44652106", "format": "rds", "mediaType": "application/gzip", "title": "IleumOnly.rds" }, { "@type": "dcat:Distribution", "downloadURL": "https://ndownloader.figshare.com/files/44652973", "format": "rds", "mediaType": "application/gzip", "title": "CellChat_Jejunum_SecretedSignalOnly_CD4macrophages.rds" }, { "@type": "dcat:Distribution", "downloadURL": "https://ndownloader.figshare.com/files/44652976", "format": "rds", "mediaType": "application/gzip", "title": "B_traj_sce.rds" }, { "@type": "dcat:Distribution", "downloadURL": "https://ndownloader.figshare.com/files/44652979", "format": "h5Seurat", "mediaType": "application/x-hdf", "title": "IleumOnly.h5Seurat" }, { "@type": "dcat:Distribution", "downloadURL": "https://ndownloader.figshare.com/files/44652988", "format": "h5seurat", "mediaType": "application/x-hdf", "title": "B_traj.h5seurat" }, { "@type": "dcat:Distribution", "downloadURL": "https://ndownloader.figshare.com/files/44653000", "format": "h5seurat", "mediaType": "application/x-hdf", "title": "B.h5seurat" }, { "@type": "dcat:Distribution", "downloadURL": "https://ndownloader.figshare.com/files/44653012", "format": "h5seurat", "mediaType": "application/x-hdf", "title": "TILC.h5seurat" }, { "@type": "dcat:Distribution", "downloadURL": "https://ndownloader.figshare.com/files/44653015", "format": "h5seurat", "mediaType": "application/x-hdf", "title": "Myeloid.h5seurat" }, { "@type": "dcat:Distribution", "downloadURL": "https://ndownloader.figshare.com/files/44653018", "format": "h5seurat", "mediaType": "application/x-hdf", "title": "Epithelial.h5seurat" }, { "@type": "dcat:Distribution", "downloadURL": "https://ndownloader.figshare.com/files/44653021", "format": "h5seurat", "mediaType": "application/x-hdf", "title": "StromalCells.h5seurat" }, { "@type": "dcat:Distribution", "downloadURL": "https://ndownloader.figshare.com/files/44653024", "format": "txt", "mediaType": "text/plain", "title": "PigToHuman_GeneOrthos_v97.txt" }, { "@type": "dcat:Distribution", "downloadURL": "https://ndownloader.figshare.com/files/44653027", "format": "xlsx", "mediaType": "application/vnd.openxmlformats-officedocument.spreadsheetml.sheet", "title": "UpdatedGeneNameListForSus97GTF_06302021_JEW_SKS.xlsx" }, { "@type": "dcat:Distribution", "downloadURL": "https://ndownloader.figshare.com/files/44653030", "format": "rds", "mediaType": "application/gzip", "title": "AllSamples_annotated_ST.rds" }, { "@type": "dcat:Distribution", "downloadURL": "https://ndownloader.figshare.com/files/44653048", "format": "rds", "mediaType": "application/gzip", "title": "CellChat_Jejunum_CellCellSignalOnly_CD4macrophages.rds" }, { "@type": "dcat:Distribution", "downloadURL": "https://ndownloader.figshare.com/files/44653054", "format": "rds", "mediaType": "application/gzip", "title": "CellChat_Ileum_CellCellSignalOnly_CD4macrophages.rds" }, { "@type": "dcat:Distribution", "downloadURL": "https://ndownloader.figshare.com/files/44653063", "format": "rds", "mediaType": "application/gzip", "title": "CellChat_Jejunum_CellCellSignalOnly.rds" }, { "@type": "dcat:Distribution", "downloadURL": "https://ndownloader.figshare.com/files/44653072", "format": "rds", "mediaType": "application/gzip", "title": "CellChat_Ileum_CellCellSignalOnly.rds" }, { "@type": "dcat:Distribution", "downloadURL": "https://ndownloader.figshare.com/files/44653075", "format": "rds", "mediaType": "application/gzip", "title": "CellChat_Jejunum_SecretedSignalOnly.rds" }, { "@type": "dcat:Distribution", "downloadURL": "https://ndownloader.figshare.com/files/44653078", "format": "rds", "mediaType": "application/gzip", "title": "CellChat_Ileum_SecretedSignalOnly.rds" }, { "@type": "dcat:Distribution", "downloadURL": "https://ndownloader.figshare.com/files/44653081", "format": "rds", "mediaType": "application/gzip", "title": "CellChat_Jejunum_ECMSignalOnly.rds" }, { "@type": "dcat:Distribution", "downloadURL": "https://ndownloader.figshare.com/files/44653087", "format": "rds", "mediaType": "application/gzip", "title": "CellChat_Ileum_ECMSignalOnly.rds" }, { "@type": "dcat:Distribution", "downloadURL": "https://ndownloader.figshare.com/files/44653090", "format": "rds", "mediaType": "application/gzip", "title": "CellChat_MergedIleumJejunum_CellCellSignalOnly.rds" }, { "@type": "dcat:Distribution", "downloadURL": "https://ndownloader.figshare.com/files/44653093", "format": "rds", "mediaType": "application/gzip", "title": "CellChat_MergedIleumJejunum_SecretedSignalOnly.rds" }, { "@type": "dcat:Distribution", "downloadURL": "https://ndownloader.figshare.com/files/44653096", "format": "rds", "mediaType": "application/gzip", "title": "CellChat_MergedIleumJejunum_ECMSignalOnly.rds" }, { "@type": "dcat:Distribution", "downloadURL": "https://ndownloader.figshare.com/files/44653099", "format": "html", "mediaType": "text/html", "title": "TotalMarkdown.html" }, { "@type": "dcat:Distribution", "downloadURL": "https://ndownloader.figshare.com/files/44653105", "format": "txt", "mediaType": "text/plain", "title": "README_Wiarda_et_al_2023_0.txt" }, { "@type": "dcat:Distribution", "downloadURL": "https://ndownloader.figshare.com/files/44661982", "format": "h5seurat", "mediaType": "application/x-hdf", "title": "AllSamples_annotated.h5seurat" }, { "@type": "dcat:Distribution", "downloadURL": "https://ndownloader.figshare.com/files/44662249", "format": "h5Seurat", "mediaType": "application/x-hdf", "title": "JejunumOnly.h5Seurat" } ], "license": "https://creativecommons.org/licenses/by-sa/4.0/", "bureauCode": [ "005:18" ], "modified": "2024-02-23", "publisher": { "@type": "org:Organization", "name": "Agricultural Research Service" }, "keyword": [ "single-cell", "single-cell RNA sequencing", "spatial transcriptomics", "spatial", "trancriptomics", "Visium", "chromium", "10X", "Pig", "Porcine", "B cell", "B cell subpopulations", "Swine", "NP108", "RNA sequencing", "RNA-Seq", "scRNA-seq", "STomics", "intestine", "Peyer's patch", "immune", "leukocyte", "leukocytes", "Porcine leukocytes", "lymphocyte", "jejunum", "ileum", "data.gov", "ARS" ], "spatial": "{\"type\": \"Point\", \"coordinates\": [-93.576693534851, 42.045130793063]}" }, { "identifier": "10113/AA22721", "accessLevel": "public", "contactPoint": { "hasEmail": "mailto:derek.bickhart@ars.usda.gov", "fn": "Bickhart, Derek" }, "programCode": [ "005:040" ], "description": "This program converts several Cufflinks output files into easily readable Microsoft Excel tables using Apache's POI library. Only the \"cuffdiff\" output format currently is supported, but future versions may include other output formats.
\nThe source code and executable directory structure must be downloaded at the GitHub repository using the \"Download ZIP\" button on the right-hand side of the page: https://github.com/njdbickhart/ConvertCufflinksToExcel.
\nInstallation and usage information can be found at https://github.com/njdbickhart/ConvertCufflinksToExcel/blob/master/README.md.
Resource Title: ConvertCufflinksToExcel.
File Name: Web Page, url: https://www.ars.usda.gov/research/software/download/?softwareid=493&modecode=80-42-05-30
download page
This is part of the CORE project efforts to further develop tools for oat research through the development of oat SNP panels and Identification of loci affecting key traits in North American germplasm. Project activities are reported here.
Resource Title: Web Page.
File Name: Web Page, url: https://avena.pw.usda.gov/CORE
Hydrologic data, primarily precipitation and runoff, have been collected on experimental watersheds operated by the U.S. Department of Agriculture Agricultural Research Service (USDA-ARS) and on other lands in southeastern Arizona since the 1950s. These data are of national and international importance and make up one of the most comprehensive semiarid watershed data sets in the world. The USDA-ARS Southwest Watershed Research Center has recently developed an electronic data processing system that includes an online interface (https://tucson.ars.ag.gov/dap) to provide public access to the data. The goal of the system is to promote analyses and interpretations of historic and current data by improving data access. The publicly accessible part of the system consists of an interactive Web site, which provides an interface to the data, and a relational database, which is used to process, store, and manage data. In addition, DAP was expanded to put sediment, meteorological, soil moisture and temperature, vegetation, CO2 and water flux, geographic information system (GIS) and aircraft and satellite spectral imagery data on line and to publish metadata for all WGEW long-term measurements.
Resource Title: PDF File.
File Name: WGEW Soil Survey.pdf, url: https://www.tucson.ars.ag.gov/dap/Files/WGEW Soil Survey.pdf
Hydrologic data, primarily precipitation and runoff, have been collected on experimental watersheds operated by the U.S. Department of Agriculture Agricultural Research Service (USDA-ARS) and on other lands in southeastern Arizona since the 1950s. These data are of national and international importance and make up one of the most comprehensive semiarid watershed data sets in the world. The USDA-ARS Southwest Watershed Research Center has recently developed an electronic data processing system that includes an online interface (https://tucson.ars.ag.gov/dap) to provide public access to the data. The goal of the system is to promote analyses and interpretations of historic and current data by improving data access. The publicly accessible part of the system consists of an interactive Web site, which provides an interface to the data, and a relational database, which is used to process, store, and manage data. In addition, DAP was expanded to put sediment, meteorological, soil moisture and temperature, vegetation, CO2 and water flux, geographic information system (GIS) and aircraft and satellite spectral imagery data on line and to publish metadata for all WGEW long-term measurements.
Resource Title: Web Page.
File Name: WGEWsoils.xls, url: https://www.tucson.ars.ag.gov/dap/Files/WGEWsoils.xls
Corn Residue Removal Plots Study for Resilient Economic Agricultural Practices in Florence, South Carolina
Resource Title: GeoData catalog record.
File Name: Web Page, url: https://geodata.nal.usda.gov/geonetwork/srv/eng/catalog.search#/metadata/9dbbb9c4-801c-4ced-be34-8ccc36cd06d3
Lincoln NE Corn-Switchgrass Experiment USDA-ARS REAP Study (Ithaca, NE) - NEMEIRR Sustainable intensification of high-yielding production systems may help meet increasing demands for food, fuel, and fiber worldwide. Specifically, corn stover is being removed by producers for livestock purposes, and stover is also targeted as a primary 2nd generation biofuel feedstock. The NEMEIRR experimental objectives are to quantify how stover removal (no removal, moderate removal, high removal) and tillage management (no-till, disk) affect crop yields, soil organic carbon, soil greenhouse gas emissions, and other soil responses (microbial community structure, function; soil health). This experiment is conducted in a fully irrigated continuous corn system in the western Corn Belt, and soil and plant measurements have been taken since study establishment in 2001.
\nSee the record in the GeoData catalog at https://geodata.nal.usda.gov/geonetwork/srv/eng/catalog.search#/metadata/d746bba5-dd93-4fed-8c1a-21361ccc1bd0 for more information and links to the data resources.
", "title": "Corn-Switchgrass Study for Greenhouse gas Reduction through Agricultural Carbon Enhancement network and Resilient Economic Agricultural Practices in Lincoln, Nebraska", "distribution": [ { "@type": "dcat:Distribution", "downloadURL": "https://geodata.nal.usda.gov/geonetwork/srv/eng/catalog.search#/metadata/d746bba5-dd93-4fed-8c1a-21361ccc1bd0", "mediaType": "text/html", "title": "https://geodata.nal.usda.gov/geonetwork/srv/eng/catalog.search#/metadata/d746bba5-dd93-4fed-8c1a-21361ccc1bd0" } ], "license": "https://www.usa.gov/publicdomain/label/1.0/", "bureauCode": [ "005:18" ], "modified": "2023-11-30", "publisher": { "@type": "org:Organization", "name": "Agricultural Research Service" }, "accrualPeriodicity": "irregular", "keyword": [ "farming", "NP212", "sustainable agriculture", "corn", "switchgrass", "greenhouse gases", "greenhouse gas reduction", "agricultural carbon", "agricultural economics", "data.gov", "ARS" ], "spatial": "{\"type\": \"Polygon\", \"coordinates\": [[[-96.412238, 41.168279], [-96.410046, 41.168279], [-96.410046, 41.167189], [-96.412238, 41.167189], [-96.412238, 41.168279]]]}" }, { "identifier": "10113/AA22617", "accessLevel": "public", "contactPoint": { "hasEmail": "mailto:Steven.Mauget@ars.usda.gov", "fn": "Mauget, Steve" }, "programCode": [ "005:040" ], "description": "Dropping Ogallala aquifer levels and changing commodity prices and energy costs make irrigation management an important but uncertain issue to west Texas cotton producers. For example, is deficit or full irrigation more profitable under the current lint price and pumping cost conditions? Also, what is the best way to divide production into dryland and irrigated acreage with limited well capacity? To help producers answer these questions this web application estimates the effects of irrigation on the profitability of center pivot cotton production on the Southern High Plains. It's main purpose is to show the impact of irrigation on yield and the related effects on both profits per acre and profits over a center pivot area with combined dryland and irrigated production.
Resource Title: Cotton Irrigation Tool.
File Name: Web Page, url: https://www.ars.usda.gov/research/software/download/?softwareid=486&modecode=30-96-05-00
download page
CottonGen offers BLAST with genome, transcriptome, peptide and marker sequence databases from Gossypium species. This can be done using nucleotide sequences or peptide sequences. BLAST functionality is similar to that on NCBI.
\nBLAST Programs:
\nblastp: Search protein database using a protein query.
\nResource Title: Website Pointer for CottonGen BLAST Search.
File Name: Web Page, url: https://www.cottongen.org/blast
CottonGen offers BLAST with genome, transcriptome, peptide and marker sequence databases from *Gossypium* species. This can be done using nucleotide sequences or peptide sequences. BLAST functionality is similar to that on NCBI. Enter or upload FASTA sequence(s) to query and select BLAST database.\n
BLAST Programs:
\nBIMS, the Breeding Information Management System, is a secure and comprehensive online breeding management system developed for the generic Tripal Database Platform which allows breeders to store, manage, archive and analyze their private breeding program. Breeders can load data in templates provided as well as output from the Field Book App, an android app for collecting phenotype data. In addition to the private breeders BIMS, users without accounts can also view the publicly available breeding data. The fully developed version will allow users to:
\nFully integrate their data with publicly available genomic, genetic and breeding data in the community database.
\nUtilize their integrated pedigree, phenotype and genotype data in performing genomic analysis and making breeding decisions.
\nUse open-source new genomics tool and breeding decision tools with seamless access to HPC.
\nResource Title: Website Pointer for CottonGen BIMS (Breeding Information Management System).
File Name: Web Page, url: https://www.cottongen.org/bims
BIMS, the Breeding Information Management System, is a secure and comprehensive online breeding management system developed for the generic Tripal Database Platform which allows breeders to store, manage, archive and analyze their private breeding program. Breeders can load data in templates provided as well as output from the Field Book App, an android app for collecting phenotype data. In addition to the private breeders BIMS users without accounts can also view the publicly available breeding data. The fully developed version will allow users to:\n
Fully integrate their data with publicly available genomic, genetic and breeding data in the community database
\nUtilize their integrated pedigree, phenotype and genotype data in performing genomic analysis and making breeding decisions.
\nUse open-source new genomics tool and breeding decision tools with seamless access to HPC.
\nThe CottonGen CottonCyc Pathways Database, part of CottonGen, supports searching and browsing the following CottonCyc databases:
\nThis Cyc database was constructed using PathwayTools version 20.0 using the gene models from the JGI v2.0 D5 genome assembly of Gossypium raimondii. There has been no manual curation of this Cyc database. Pathway predictions were made using PathwayTools and in-silico v2.1 annotations as provided by JGI.
\nThis Cyc database was constructed using PathwayTools version 20.0 using the gene models from the CGP-BGI v1.0 AD1 genome assembly of Gossypium hirsutum. There has been no manual curation of this Cyc database. Pathway predictions were made using PathwayTools and in-silico v1.0 annotations as provided by CGP-BGI.
\nSearch parameters include genes, proteins, RNAs, compounds, reactions, pathways, growth media, and BLAST search.
Resource Title: Website Pointer to CottonGen CottonCyc Pathways Database.
File Name: Web Page, url: http://ptools.cottongen.org/
CottonGen has an instance of the JBrowse genome browser for viewing genome data. A list of the genomes available in CottonGen can be accessed by clicking the JBrowse link in the Tools menu.
\nWhole Genomes
\nChloroplast Genomes
\nPlease watch the JBrowse tutorial for more details about how to navigate and use JBrowse.
\nResource Title: CottonGen JBrowse and User Manual.
File Name: Web Page, url: https://www.cottongen.org/node/8287911
CottonGen has an instance of the JBrowse genome browser for viewing genome data. A list of the genomes available in CottonGen can be accessed by clicking the JBrowse link in the Tools menu. \n\nWhole Genomes\n\n* 2019-03: Gossypium barbadense AD2 Hai-7124 genome ZJU v1.1_a1\n* 2018-12: Gossypium barbadense AD2 3-79 genome HAU v2_a1\n* 2015-12: Gossypium barbadense AD2 3-79 genome HAU v1_a1\n* 2019-03: Gossypium hirsutum AD1 genome ZJU-Improved v2.1_a1\n* 2018-12: Gossypium hirsutum AD1 genome HAU v1_a1\n* 2017-09: Gossypium hirsutum AD1 genome TX-JGI v1.1_a1\n* 2015-04: Gossypium hirsutum AD1 genome NAU-NBI v1.1_a1.1\n* 2015-04: Gossypium hirsutum AD1 genome CGP-BGI v1_a1\n* 2018-05: Gossypium arboreum A2 genome CRI-Updated v1_a1\n* 2014-05: Gossypium arboreum A2 genome CGP-BGI v2_a1\n* 2012-12: Gossypium raimondii D5 genome JGI v2_a2.1\n* 2012-08: Gossypium raimondii D5 genome CGP-BGI v1_a1\n\nChloroplast Genomes\n\n* Gossypium arboreum chloroplast\n* Gossypium barbadense chloroplast\n* Gossypium hirsutum chloroplast\n* Gossypium raimondii chloroplast\n\nPlease watch the JBrowse tutorial for more details about how to navigate and use JBrowse.
MapViewer is a graphical tool for viewing and comparing Gossypium spp. genetic maps. It includes dynamically scrollable maps, correspondence matrices, dot plots, links to details about map features, and exporting functionality. It was developed by the MainLab at Washington State University and is available for download for use in other Tripal databases. The query interface allows the user to select Species, Map, and Linkage Group options. Help information includes a video tutorial, user manual, and sample map, correspondence matrix, dot plot, and exported figures.
\nResource Title: Website Pointer for CottonGen Map Viewer.
File Name: Web Page, url: https://www.cottongen.org/MapViewer
MapViewer is a graphical tool for viewing and comparing *Gossypium* spp. genetic maps. It includes dynamically scrollable maps, correspondence matrices, dot plots, links to details about map features, and exporting functionality. It was developed by the MainLab at Washington State University and is available for download for use in other Tripal databases. The query interface allows the user to select Species, Map, and Linkage Group options. Help information includes a video tutorial, user manual, and sample map, correspondence matrix, dot plot, and exported figures.
Primer3web version 4.0.0 allows users to pick PCR primers from a DNA sequence based on criteria including:
\noligonucleotide melting temperature, size, GC content, and primer-dimer possibilities,
\nPCR product size,
\npositional constraints within the source (template) sequence, and
\npossibilities for ectopic priming (amplifying the wrong sequence)
\nmany other constraints.
\nAll of these criteria are user-specifiable as constraints, and some are specifiable as terms in an objective function that characterizes an optimal primer pair.
\nResource Title: Website Pointer for CottonGen Primer3.
File Name: Web Page, url: https://www.cottongen.org/tools/primer3
Sequence Retrieval allows users to download nucleotide and protein sequences including chromosomes, scaffolds, genes, mRNAs, transcript coding sequences, protein, reftrans contigs and unigene contigs. For the sequences aligned to larger sequences, such as genes, mRNAs and transcript coding sequences, a numeric value specifying the number of upstream bases and downstream bases can be entered. A video and text tutorial are provided for additional help information.
Resource Title: Website Pointer for Cottongen Sequence Retrieval.
File Name: Web Page, url: https://www.cottongen.org/retrieve/sequences
Sequence Retrieval allows users to download nucleotide and protein sequences including chromosomes, scaffolds, genes, mRNAs, transcript coding sequences, protein, reftrans contigs and unigene contigs. For the sequences aligned to larger sequences, such as genes, mRNAs and transcript coding sequences, a numeric value specifying the number of upstream bases and downstream bases can be entered. A video and text tutorial are provided for additional help information.
\nAvailable Datasets:
\nConserved syntenic regions among publicly available cotton genomes were analyzed by CottonGen and made available using the Tripal Synteny Viewer developed by the Fei Bioinformatics Lab from the Boyce Thomson Institute at Cornell University. Analysis was done using MCScanX (Wang et al. 2012) with default settings and blast files were made using blastp with an expectation value cutoff < 1e-10, maximum alignment of 5, and maximum scores of 5.
\nThe synteny viewer displays all the conserved syntenic blocks between a selected chromosome of a genome and another genome in a circular and tabular layout. Once a block is chosen in the circular or tabular layout, all the genes in the block are shown in a graphic and tabular format. The gene names have hyperlinks to gene pages where detailed information of the gene can be accessed. The ‘synteny’ section of the gene page displays all the orthologs and the paralogs with link to the corresponding syntenic blocks or gene pages.
Resource Title: Website Pointer for Cottongen Synteny Viewer.
File Name: Web Page, url: https://www.cottongen.org/synview/search
Synteny among Cotton genomes can be viewed using the new Tripal Synteny Viewer. Conserved syntenic regions among publicly available cotton genomes were analyzed by CottonGen and made available using the Tripal Synteny Viewer developed by the Fei Bioinformatics Lab from the Boyce Thomson Institute at Cornell University. Analysis was done using MCScanX (Wang et al. 2012) with default settings and blast files were made using blastp with an expectation value cutoff < 1e-10, maximum alignment of 5, and maximum scores of 5.
\nThe synteny viewer dynamically displays all the conserved syntenic blocks between a selected chromosome of a genome and another genome in a circular and tabular layout. Once a block is chosen in the circular or tabular layout, all the genes in the block are shown in a graphic and tabular format. The gene names have hyperlinks to gene pages where detailed information of the gene can be accessed. The ‘synteny’ section of the gene page displays all the orthologs and the paralogs with link to the corresponding syntenic blocks or gene pages.
\nCottonGen (https://www.cottongen.org) is a curated and integrated web-based relational database providing access to publicly available genomic, genetic and breeding data to enable basic, translational and applied research in cotton. Built using the open-source Tripal database infrastructure, CottonGen supersedes CottonDB and the Cotton Marker Database, which includes sequences, genetic and physical maps, genotypic and phenotypic markers and polymorphisms, quantitative trait loci (QTLs), pathogens, germplasm collections and trait evaluations, pedigrees, and relevant bibliographic citations, with enhanced tools for easier data sharing, mining, visualization, and data retrieval of cotton research data. CottonGen contains annotated whole genome sequences, unigenes from expressed sequence tags (ESTs), markers, trait loci, genetic maps, genes, taxonomy, germplasm, publications and communication resources for the cotton community. Annotated whole genome sequences of Gossypium raimondii are available with aligned genetic markers and transcripts. These whole genome data can be accessed through genome pages, search tools and GBrowse, a popular genome browser. Most of the published cotton genetic maps can be viewed and compared using CMap, a comparative map viewer, and are searchable via map search tools. Search tools also exist for markers, quantitative trait loci (QTLs), germplasm, publications and trait evaluation data. CottonGen also provides online analysis tools such as NCBI BLAST and Batch BLAST.
\nThis project is funded/supported by Cotton Incorporated, the USDA-ARS Crop Germplasm Research Unit at College Station, TX, the Southern Association of Agricultural Experiment Station Directors, Bayer CropScience, Corteva/Agriscience, Dow/Phytogen, Monsanto, Washington State University, and NRSP10.
Resource Title: Website Pointer for CottonGen.
File Name: Web Page, url: https://www.cottongen.org/
Genomic, Genetic and Breeding Resources for Cotton Research Discovery and Crop Improvement organized by :
\nAlso provides Quick Start links for Major Species and Tools.
The Cover Crop Chart (v. 2.0) is designed to assist producers with decisions on the use of cover crops in crop and forage production systems. The chart, patterned after the periodic table of elements, includes information on 58 crop species that may be planted individually or in cocktail mixtures. Information on growth cycle, relative water use, plant architecture, seeding depth, forage quality, pollination characteristics, and nutrient cycling are included for most crop species.
\nThe Cover Crop Chart is easy to use, requiring only Adobe Acrobat software. Using the chart as a guide, users can select individual crop species by clicking on the name which will direct them to additional information about the selected crop. Icons within each crop page return the user to the chart, thereby easily allowing comparisons of different crops.
\nThe Cover Crop Chart represents a compendium of information from multiple sources throughout the U.S. and Canada, and is not based on research conducted at the USDA-ARS Northern Great Plains Research Laboratory (NGPRL). Primary sources of information included the Midwest Cover Crops Council, USDA - Sustainable Agriculture Research & Education (SARE), USDA - Natural Resources Conservation Service (NRCS) PLANTS Database, relevant peer-reviewed journal articles, and the 3rd edition of *Managing Cover Crops Profitably* (Andy Clark, Editor).
\nInformation on specific crops is occasionally generalized and/or approximate to accommodate wide variation in geographic/agronomic conditions, and therefore may not reflect performance in on-farm conditions. Accordingly, USDA - Agricultural Research Service (ARS) makes no guarantee to the performance of specific crops based on information provided within the Cover Crop Chart.
\nThe Cover Crop Chart is produced and distributed by the staff of the USDA-ARS NGPRL, Mandan, ND. Mark Liebig and Holly Johnson contributed to the design and content of the chart with input from NGPRL staff and producers and technicians from the Area IV Soil Conservation Districts of North Dakota and NRCS staff at the Bismarck and Dickinson Field/Area Offices.
\nResource Title: Cover Crop Chart download page.
File Name: Web Page, url: https://www.ars.usda.gov/research/software/download/?softwareid=263&modecode=30-64-05-00
The Crop Sequence Calculator software is an interactive program for viewing crop sequencing information. The Crop Sequence Calculator program is designed to assist agricultural managers determine workable cropping sequences for the northern Great Plains. Version (3.1) contains the previous version (3.0) and adds new information gathered from additional cropping sequence research, as well as supplemental information related to use of annual crops as cover crops.
\nCropping systems need to be inherently flexible to take advantage of economic opportunities and/or adapt to environmental realities. Therefore, this program applies the principles of Dynamic Cropping Systems to help users select cropping sequences best suited to their particular situation. The research data used to develop the Crop Sequence Calculator were collected from no-till farming experiments conducted near Mandan, ND from 1998 to 2005. This version (3.1) contains the previous version (3.0) and adds new information gathered from additional cropping sequence research, as well as supplemental information related to use of annual crops as cover crops. Users are asked to select the appropriate data set for answering questions unique to their enterprise. The first data set is what we call Phase II. The Phase II experiment consisted of predominantly cool-season crops, and the weather conditions were considerably wetter than average. The ten crops used for this phase are shown in the Phase II Crops box. The Phase III experiment used some of the same crops as the Phase II, but included other crops considered to be warm-season crops. These crops are listed in the Phase III Crops box. The crops used in both phases are highlighted. Precipitation received during the Phase III experiment was below average.
Resource Title: Crop Sequence Calculator Version 3.1 download page.
File Name: Web Page, url: https://www.ars.usda.gov/research/software/download/?softwareid=398&modecode=30-64-05-00#downloadForm
The Cryptocephalinae of the World (http://camptosomata.myspecies.info/) serves to maintain images, updated classification, and bibliography of cryptocephaline leaf beetles. Currently, focus is largely on Stegnocephala, New World Cryptocephalus, and Fulcidacini; however, with time and continued collaboration we hope to build upon this work. Images are based almost exclusively on type specimens, but authoritatively identified material is also included. The identity of most species herein is finally confirmed after almost 150 years since their original description. This dataset was funded by an Encyclopedia of Life Postdoctoral Fellowship awarded to the author.
Resource Title: Cryptocephalinae of the World.
File Name: Web Page, url: http://camptosomata.myspecies.info/
Link to the web site for Cryptocephalinae of the World.
This data package contains cryptogam cover data from plots with various levels of herbivore exclusion on Jornada Experimental Range (JER) and Chihuahuan Desert Rangeland Research Center (CDRRC) lands. Study sites were established in 1995; one in black grama grassland and the other in creosotebush shrubland to compare the impact of herbivores on ecosystem processes between these vegetation types. Parallel studies were established at the Sevilleta LTER site (New Mexico, USA) and Mapimi Biosphere Reserve (Durango, Mexico). Each study site is 1 km by 0.5 km in area. Four replicate experimental blocks were randomly located at each study site to measure vegetation responses using exclusion treatments including a) all mammalian herbivores, including cattle, lagomorphs, and rodents, b) lagomorphs and cattle only, c) cattle only, and d) control accessible to all herbivores. Thirty-six sampling points were positioned at 5.8-meter intervals on a systematically located 6 by 6 point grid within each plot. A permanent one-meter by one-meter vegetation measurement quadrat is located at each of the 36 points. Each year in spring and fall from 1995-2005, the percent of a quadrat covered in cryptogams was estimated by summing the percent of each 10 cm square within a quadrat (including 100 10-cm squares) containing cryptogams (See methods for a detailed explanation). Cryptogams (biological soil crusts) include lichens, algae, cyanobacteria, and moss. This study is complete.
Resource Title: Website Pointer to html file.
File Name: Web Page, url: https://portal.edirepository.org/nis/mapbrowse?scope=knb-lter-jrn&identifier=210086003
Webpage with information and links to data files for download
The USDA Agricultural Research Service (ARS) recently established SCINet , which consists of a shared high performance computing resource, Ceres, and the dedicated high-speed Internet2 network used to access Ceres. Current and potential SCINet users are using and generating very large datasets so SCINet needs to be provisioned with adequate data storage for their active computing. It is not designed to hold data beyond active research phases. At the same time, the National Agricultural Library has been developing the Ag Data Commons, a research data catalog and repository designed for public data release and professional data curation. Ag Data Commons needs to anticipate the size and nature of data it will be tasked with handling.
\nThe ARS Web-enabled Databases Working Group, organized under the SCINet initiative, conducted a study to establish baseline data storage needs and practices, and to make projections that could inform future infrastructure design, purchases, and policies. The SCINet Web-enabled Databases Working Group helped develop the survey which is the basis for an internal report. While the report was for internal use, the survey and resulting data may be generally useful and are being released publicly.
\nFrom October 24 to November 8, 2016 we administered a 17-question survey (Appendix A) by emailing a Survey Monkey link to all ARS Research Leaders, intending to cover data storage needs of all 1,675 SY (Category 1 and Category 4) scientists. We designed the survey to accommodate either individual researcher responses or group responses. Research Leaders could decide, based on their unit's practices or their management preferences, whether to delegate response to a data management expert in their unit, to all members of their unit, or to themselves collate responses from their unit before reporting in the survey.
\nLarger storage ranges cover vastly different amounts of data so the implications here could be significant depending on whether the true amount is at the lower or higher end of the range. Therefore, we requested more detail from \"Big Data users,\" those 47 respondents who indicated they had more than 10 to 100 TB or over 100 TB total current data (Q5). All other respondents are called \"Small Data users.\" Because not all of these follow-up requests were successful, we used actual follow-up responses to estimate likely responses for those who did not respond.
\nWe defined active data as data that would be used within the next six months. All other data would be considered inactive, or archival.
\nTo calculate per person storage needs we used the high end of the reported range divided by 1 for an individual response, or by G, the number of individuals in a group response. For Big Data users we used the actual reported values or estimated likely values.
\n\nResource Title: Appendix A: ARS data storage survey questions.
File Name: Appendix A.pdf
Resource Description: The full list of questions asked with the possible responses. The survey was not administered using this PDF but the PDF was generated directly from the administered survey using the Print option under Design Survey. Asterisked questions were required. A list of Research Units and their associated codes was provided in a drop down not shown here.\n
Resource Software Recommended: Adobe Acrobat,url: https://get.adobe.com/reader/
Resource Title: CSV of Responses from ARS Researcher Data Storage Survey.
File Name: Machine-readable survey response data.csv
Resource Description: CSV file includes raw responses from the administered survey, as downloaded unfiltered from Survey Monkey, including incomplete responses. Also includes additional classification and calculations to support analysis. Individual email addresses and IP addresses have been removed. This information is that same data as in the Excel spreadsheet (also provided).
Resource Title: Responses from ARS Researcher Data Storage Survey.
File Name: Data Storage Survey Data for public release.xlsx
Resource Description: MS Excel worksheet that Includes raw responses from the administered survey, as downloaded unfiltered from Survey Monkey, including incomplete responses. Also includes additional classification and calculations to support analysis. Individual email addresses and IP addresses have been removed.
Resource Software Recommended: Microsoft Excel,url: https://products.office.com/en-us/excel
DRIFTSIM can be used to determine the effects of major drift-causing factors on the mean drift distances up to 656 feet from the release point for individual water droplets or classes of droplets.
\nUnlike other computer simulation software, DRIFTSIM requires no special skills to operate and computer system requirements are minimal: Pentium processor, CD drive, MS-Windows version 3.1 or later, 8 Mb of memory, 30 Mb free hard drive space and a mouse.
\nLarge amounts of pesticides are applied worldwide on a wide variety of crops. While pesticides are essential for high quality, abundant food, they pose risks if applied improperly. Of particular concern is the potential for spray droplets to drift to areas other than the intended targets.
\nIn order to assist applicators choose the optimum spray conditions to minimize spray drift, Heping Zhuand Robert Foxof the USDA Agricultural Research Service and Erdal Ozkan of the Ohio State University have developed DRIFTSIM--a user-friendly computer program capable of predicting drift distances of spray droplets under a wide variety of conditions. Unlike other computer simulation software, DRIFTSIM requires no special skills to operate and computer system requirements are minimal: Pentium processor, CD drive, MS-Windows version 3.1 or later, 8 Mb of memory, 30 Mb free hard drive space and a mouse.
\nDRIFTSIM rapidly estimates the mean drift distances of water droplets discharged from atomizers on field sprayers.
\nThe program, which is the only spray drift estimation software that works on portable computers, enables researchers to predict and calculate spray drift potentials which previously was not possible.
\nExtension agencies and researchers can use the program to evaluate spray drift problems and train spray operators to adjust sprayer settings to improve the application performance.
\nTo download and install the Driftsim software:
\nRefer to the Manual.pdf in the Driftsim folder for guidance in using DepositScan.
\nAdditional information is available at https://www.ars.usda.gov/Research/docs.htm?docid=11228
Resource Title: DRIFTSIM.
File Name: Web Page, url: https://www.ars.usda.gov/research/software/download/?softwareid=252&modecode=50-82-05-00
download page
This completed dataset contains daily precipitation measurements from a network of weighing rain gauges (Belfort Universal Precipitation Gauges, Series 5-780) at 58 locations on the Jornada Experimental Range in Dona Ana County, New Mexico, USA between January 1976 and December 2011. Locations and the dates during which data were collected were generally project-oriented. Temporal coverage per location is quite variable and ranges between 1,647 and 13,024 days. The network was maintained by USDA Agricultural Research Service personnel. After 2011 the remaining weighing rain gauges were replaced by tipping bucket gauges and those data are available separately.
Resource Title: Website Pointer to html file.
File Name: Web Page, url: https://portal.edirepository.org/nis/mapbrowse?scope=knb-lter-jrn&identifier=210407001
Webpage with information and links to data files for download
The Dairy Gas Emissions Model (DairyGEM) uses process level simulation and process related emission factors to predict ammonia, hydrogen sulfide, VOC and greenhouse gas emissions along with the carbon, energy and water footprints of dairy production systems. A process-based simulation is used to predict ammonia, hydrogen sulfide, and VOC emissions as influenced by climate and farm management. Net carbon dioxide, methane, and nitrous oxide emissions are also estimated using process simulation or process related emission factors. Environmental footprints are determined that include both primary and secondary sources. Primary sources occur during the farm production process and secondary sources are those occurring during the production of resources used including machinery, fuel, electricity, fertilizer, pesticides, and plastic.
Resource Title: Dairy Gas Emissions Model - home.
File Name: Web Page, url: https://www.ars.usda.gov/northeast-area/up-pa/pswmru/docs/dairy-gas-emissions-model/
Provides description of the DairyGEM model with links to reference manual, download instructions, and training video module.
Representative dairy farms were modeled using the Integrated Farm System Model with 20 farms in each of 6 regions of the United States for the years of 1971 and 2020 to determine improvements made in reducing environmental impacts over the 50-year period. Important data and information describing these farms are documented in these tables. These data include the farm location, number of cows and heifers maintained, milk produced, feeds and nutrient contents fed, crop areas, crop yields, fertilizer and lime application rates, irrigation water applied, milking and housing facilities, manure collection, storage and application methods used, and soil characteristics. These data are published as supplementary information for the article “Fifty years of environmental progress for United States dairy farms” published in the Journal of Dairy Science.
", "title": "Dairy production systems for six regions of the U.S. in 1971 and 2020", "distribution": [ { "@type": "dcat:Distribution", "downloadURL": "https://ndownloader.figshare.com/files/43980837", "format": "xlsx", "mediaType": "application/vnd.openxmlformats-officedocument.spreadsheetml.sheet", "title": "Table S1 US Dairy Farms 1971.xlsx" }, { "@type": "dcat:Distribution", "downloadURL": "https://ndownloader.figshare.com/files/43980873", "format": "xlsx", "mediaType": "application/vnd.openxmlformats-officedocument.spreadsheetml.sheet", "title": "Table S2 US Dairy Farms 2020.xlsx" }, { "@type": "dcat:Distribution", "downloadURL": "https://ndownloader.figshare.com/files/43983702", "format": "docx", "mediaType": "application/vnd.openxmlformats-officedocument.wordprocessingml.document", "title": "Read Me.docx" } ], "license": "https://www.usa.gov/publicdomain/label/1.0/", "bureauCode": [ "005:18" ], "modified": "2024-05-30", "publisher": { "@type": "org:Organization", "name": "Agricultural Research Service" }, "accrualPeriodicity": "irregular", "keyword": [ "dairy farm characteristics", "regional differences in dairy farms", "dairy farms in 1970", "Integrated Farm System Model" ] }, { "identifier": "10.15482/USDA.ADC/1504026", "accessLevel": "public", "contactPoint": { "hasEmail": "mailto:feng.gao@usda.gov", "fn": "Gao, Feng" }, "programCode": [ "005:040" ], "description": "This dataset includes daily two-band Enhanced Vegetation Index (EVI2) at 30-m resolution over a Landsat scene (path 26 and row 31) in central Iowa. Fourteen years of daily EVI2 from 2001 to 2015 (except 2012) were generated through fusing and interpolating Landsat-MODIS data.
\nLandsat surface reflectances were order and used in this study. Mostly clear Landsat images from each year were chosen to pair with MODIS images acquired from the same day to generate daily Landsat-MODIS surface reflectance using the Spatial and Temporal Adaptive Reflectance Fusion Model (STARFM). Partially clear Landsat images were also used in generating the smoothed and gap-filled daily VI time-series. All available Landsat data including Landsat 5 Thematic Mapper (TM), Landsat 7 Enhanced Thematic Mapper Plus (ETM+) and Landsat 8 Operational Land Imager (OLI) were used in this study.
\nThe MODIS data products were downloaded and processed. These include the daily surface reflectance at both 250m (MOD09GQ) and 500m (MOD09GA) resolution, the MODIS Bidirectional Reflectance Distribution Function (BRDF) parameters at 500m resolution, and the MODIS land cover types at 500m resolution (MCD12Q1). They were used to generated daily nadir BRDF-adjusted reflectance (NBAR) at 250m resolution for fusing with Landsat.
\nThe Landsat-MODIS data fusion results for 2001-2014 were generated from a previous study (Gao et al, 2017; doi: 10.1016/j.rse.2016.11.004). Data fusion results for 2015 were generated using Landsat 8 OLI images from day 194, 226, 258 and 338 in this study. Cloud masks were extracted from Landsat and MODIS QA layers and were used to exclude cloud, cloud shadow and snow pixels. Since Landsat 5 TM operational imaging ended in November 2011 and Landsat 8 OLI has not been launched until February 2013, Landsat 7 ETM+ Scan Line Corrector (SLC)-off images are the only available Landsat data. For this reason, 2012 was not included.
\nDue to the cloud contamination in the Landsat and MODIS images, the fused Landsat-MODIS results still have invalid values or gaps. To fill these gaps, a modified Savitzky-Golay (SG) filter approach was built and applied to smooth and gap-fill EVI2. The SG filter is a moving fitting approach. Each point is smoothed using the value computed from the polynomial function fit to the observations within the moving window. The program removes spike points if the fitting errors are larger than the predefined threshold (default 3 standard deviation). The modified SG filter allows us to retain small variations but also fill large gaps in an unevenly distributed time-series EVI2.
\nDaily EVI2 files are saved in one tar file per year. Each tar file contains a binary image file and a text header file that can be displayed in the ENVI software. The binary image file has the dimension of 7201 lines by 8061 samples by 365 days and is saved in BIP (band interleaved by pixel) format. EVI2 data are saved in 4-byte float number. The text header file contains necessary information including projection and geolocation. Daily EVI2 file is named as \"flexfit_evi2.026031.yyyy.bin\", where \"026031\" refers to the Landsat path and row, and yyyy represents year and ranges from 2001-2015.
\nResource Title: Daily EVI2 Data Packages .
File Name: Web Page, url: https://app.globus.org/file-manager?destination_id=e5391440-1d5e-11ec-a0a0-6b21ca6daf73&destination_path=/node22870/
These Daily EVI2 data packages are grouped by year. Each package includes a plain binary file that saves daily EVI2, and a ENVI header file (in text) that contains metadata and geolocation information.\n\nContents are as follows:\ndailyVI.026031.2000.tar.gz\ndailyVI.026031.2001.tar.gz\ndailyVI.026031.2002.tar.gz\ndailyVI.026031.2003.tar.gz\ndailyVI.026031.2004.tar.gz\ndailyVI.026031.2005.tar.gz\ndailyVI.026031.2006.tar.gz\ndailyVI.026031.2007.tar.gz\ndailyVI.026031.2008.tar.gz\ndailyVI.026031.2009.tar.gz\ndailyVI.026031.2010.tar.gz\ndailyVI.026031.2011.tar.gz\ndailyVI.026031.2013.tar.gz\ndailyVI.026031.2014.tar.gz\ndailyVI.026031.2015.tar.gz\n\nSCINet users:\nThe .tar.gz files can be accessed/retrieved with valid SCINet account at this location: /KEEP/ADCdatastorage/NAL/published/node22870/\nSee the SCINet File Transfer guide for more information on moving large files: https://scinet.usda.gov/guides/data/datatransfer\n\nGlobus users:\nThe files can also be accessed through Globus by following this data link.The user will need to log in to Globus in order to retrieve this data. User accounts are free of charge with several options for signing on. Instructions for creating an account are on the login page.\n\nhttps://app.globus.org/file-manager?destination_id=e5391440-1d5e-11ec-a0a0-6b21ca6daf73&destination_path=/node22870/
Gamma-ray spectroscopy (GRS) enables continuous estimation of soil water content (SWC) at the subfield scale with a noninvasive sensor. Hydrological applications, including hyper-resolution land surface models and precision agricultural decision making, could benefit greatly from such SWC information, but a gap exists between established theory and accurate estimation of SWC from GRS in the field. In response, we conducted a robust three-year field validation study at a well instrumented agricultural site in Nebraska, United States. The study involved 27 gravimetric water content sampling campaigns in maize and soybean and 40K specific activity (Bq kg−1) measurements from a stationary GRS sensor. Our analysis showed that the current method for biomass water content correction is appropriate for our maize and soybean field but that the ratio of soil mass attenuation to water mass attenuation used in the theoretical equation must be adjusted to satisfactorily describe the field data. We propose a calibration equation with two free parameters: the theoretical 40K intensity in dry soil and a, which creates an “effective” mass attenuation ratio. Based on statistical analyses of our data set, we recommend calibrating the GRS sensor for SWC estimation using 10 profiles within the footprint and 5 calibration sampling campaigns to achieve a cross-validation root mean square error below 0.035 g g−1.
", "title": "Data From: Gamma-Spectroscopy Method for Soil Water Content Estimation in an Agricultural Field", "distribution": [ { "@type": "dcat:Distribution", "downloadURL": "https://ndownloader.figshare.com/files/46381309", "format": "csv", "mediaType": "application/csv", "title": "ArithmeticAvg.csv" }, { "@type": "dcat:Distribution", "downloadURL": "https://ndownloader.figshare.com/files/46381312", "format": "csv", "mediaType": "text/plain", "title": "CalibrationDataK40.csv" }, { "@type": "dcat:Distribution", "downloadURL": "https://ndownloader.figshare.com/files/46381315", "format": "csv", "mediaType": "application/csv", "title": "CalibrationDataVeg.csv" }, { "@type": "dcat:Distribution", "downloadURL": "https://ndownloader.figshare.com/files/46381318", "format": "csv", "mediaType": "text/plain", "title": "CombinedTimeSeries.csv" }, { "@type": "dcat:Distribution", "downloadURL": "https://ndownloader.figshare.com/files/46381321", "format": "csv", "mediaType": "application/csv", "title": "SOCandLatticeValues.csv" }, { "@type": "dcat:Distribution", "downloadURL": "https://ndownloader.figshare.com/files/46381324", "format": "csv", "mediaType": "text/plain", "title": "V_Wt_AvgPore.csv" }, { "@type": "dcat:Distribution", "downloadURL": "https://ndownloader.figshare.com/files/46381327", "format": "xls", "mediaType": "application/vnd.ms-excel", "title": "2021_08_05_Example_Soil_Vegetation_Calibration_revised_Datasheets.xls" }, { "@type": "dcat:Distribution", "downloadURL": "https://ndownloader.figshare.com/files/46381330", "format": "xls", "mediaType": "application/vnd.ms-excel", "title": "2021_08_19_Example_Soil_Vegetation_Calibration_Datasheets.xls" }, { "@type": "dcat:Distribution", "downloadURL": "https://ndownloader.figshare.com/files/46381333", "format": "xls", "mediaType": "application/vnd.ms-excel", "title": "2021_09_03_Example_Soil_Vegetation_Calibration_Datasheets.xls" }, { "@type": "dcat:Distribution", "downloadURL": "https://ndownloader.figshare.com/files/46381336", "format": "xls", "mediaType": "application/vnd.ms-excel", "title": "2021_09_17_Example_Soil_Vegetation_Calibration_Datasheets.xls" }, { "@type": "dcat:Distribution", "downloadURL": "https://ndownloader.figshare.com/files/46381339", "format": "xls", "mediaType": "application/vnd.ms-excel", "title": "2021_10_15_Example_Soil_Vegetation_Calibration_Datasheets.xls" }, { "@type": "dcat:Distribution", "downloadURL": "https://ndownloader.figshare.com/files/46381342", "format": "xls", "mediaType": "application/vnd.ms-excel", "title": "2021_10_29_Example_Soil_Vegetation_Calibration_Datasheets.xls" }, { "@type": "dcat:Distribution", "downloadURL": "https://ndownloader.figshare.com/files/46381345", "format": "xls", "mediaType": "application/vnd.ms-excel", "title": "2021_11__12_Example_Soil_Vegetation_Calibration_Datasheets.xls" }, { "@type": "dcat:Distribution", "downloadURL": "https://ndownloader.figshare.com/files/46381348", "format": "xls", "mediaType": "application/vnd.ms-excel", "title": "2021_12__03_Example_Soil_Vegetation_Calibration_Datasheets.xls" }, { "@type": "dcat:Distribution", "downloadURL": "https://ndownloader.figshare.com/files/46381354", "format": "xls", "mediaType": "application/vnd.ms-excel", "title": "2022_03_25_Example_Soil_Vegetation_Calibration_Datasheets.xls" }, { "@type": "dcat:Distribution", "downloadURL": "https://ndownloader.figshare.com/files/46381351", "format": "xls", "mediaType": "application/vnd.ms-excel", "title": "2022_04_15_Example_Soil_Vegetation_Calibration_Datasheets.xls" }, { "@type": "dcat:Distribution", "downloadURL": "https://ndownloader.figshare.com/files/46381357", "format": "xls", "mediaType": "application/vnd.ms-excel", "title": "2022_05_18_Example_Soil_Vegetation_Calibration_Datasheets.xls" }, { "@type": "dcat:Distribution", "downloadURL": "https://ndownloader.figshare.com/files/46381360", "format": "xls", "mediaType": "application/vnd.ms-excel", "title": "2022_05_27_Example_Soil_Vegetation_Calibration_Datasheets.xls" }, { "@type": "dcat:Distribution", "downloadURL": "https://ndownloader.figshare.com/files/46381363", "format": "xls", "mediaType": "application/vnd.ms-excel", "title": "2022_08_03_Example_Soil_Vegetation_Calibration_Datasheets.xls" }, { "@type": "dcat:Distribution", "downloadURL": "https://ndownloader.figshare.com/files/46381366", "format": "xls", "mediaType": "application/vnd.ms-excel", "title": "2022_08_17_Example_Soil_Vegetation_Calibration_Datasheets.xls" }, { "@type": "dcat:Distribution", "downloadURL": "https://ndownloader.figshare.com/files/46381369", "format": "xls", "mediaType": "application/vnd.ms-excel", "title": "2022_08_31_Example_Soil_Vegetation_Calibration_corrected_Datasheets.xls" }, { "@type": "dcat:Distribution", "downloadURL": "https://ndownloader.figshare.com/files/46381372", "format": "xls", "mediaType": "application/vnd.ms-excel", "title": "2022_09_17_Example_Soil_Vegetation_Calibration_Datasheets.xls" }, { "@type": "dcat:Distribution", "downloadURL": "https://ndownloader.figshare.com/files/46381375", "format": "xls", "mediaType": "application/vnd.ms-excel", "title": "2022_10_05_Example_Soil_Vegetation_Calibration_Datasheets.xls" }, { "@type": "dcat:Distribution", "downloadURL": "https://ndownloader.figshare.com/files/46381378", "format": "xls", "mediaType": "application/vnd.ms-excel", "title": "2022_10_22_Example_Soil_Vegetation_Calibration_Datasheets.xls" }, { "@type": "dcat:Distribution", "downloadURL": "https://ndownloader.figshare.com/files/46381381", "format": "xlsx", "mediaType": "application/vnd.openxmlformats-officedocument.spreadsheetml.sheet", "title": "2023_05_15_Site3_Soil_Calibration_Datasheets.xlsx" }, { "@type": "dcat:Distribution", "downloadURL": "https://ndownloader.figshare.com/files/46381384", "format": "xlsx", "mediaType": "application/vnd.openxmlformats-officedocument.spreadsheetml.sheet", "title": "2023_06_08_Site3_Soil_Calibration_Datasheets.xlsx" }, { "@type": "dcat:Distribution", "downloadURL": "https://ndownloader.figshare.com/files/46381387", "format": "xlsx", "mediaType": "application/vnd.openxmlformats-officedocument.spreadsheetml.sheet", "title": "2023_06_21_Site3_Soil_Calibration_Datasheets.xlsx" }, { "@type": "dcat:Distribution", "downloadURL": "https://ndownloader.figshare.com/files/46381390", "format": "xlsx", "mediaType": "application/vnd.openxmlformats-officedocument.spreadsheetml.sheet", "title": "2023_07_10_Site3_Soil_Calibration_Datasheets.xlsx" }, { "@type": "dcat:Distribution", "downloadURL": "https://ndownloader.figshare.com/files/46381393", "format": "xlsx", "mediaType": "application/vnd.openxmlformats-officedocument.spreadsheetml.sheet", "title": "2023_07_24_Site3_Soil_Calibration_Datasheets.xlsx" }, { "@type": "dcat:Distribution", "downloadURL": "https://ndownloader.figshare.com/files/46381396", "format": "xlsx", "mediaType": "application/vnd.openxmlformats-officedocument.spreadsheetml.sheet", "title": "2023_08_09_Site3_Soil_Calibration_Datasheets.xlsx" }, { "@type": "dcat:Distribution", "downloadURL": "https://ndownloader.figshare.com/files/46381399", "format": "xlsx", "mediaType": "application/vnd.openxmlformats-officedocument.spreadsheetml.sheet", "title": "2023_08_28_Site3_Soil_Calibration_Datasheets.xlsx" }, { "@type": "dcat:Distribution", "downloadURL": "https://ndownloader.figshare.com/files/46381402", "format": "xlsx", "mediaType": "application/vnd.openxmlformats-officedocument.spreadsheetml.sheet", "title": "2023_09_21_Site3_Soil_Calibration_Datasheets.xlsx" }, { "@type": "dcat:Distribution", "downloadURL": "https://ndownloader.figshare.com/files/46381405", "format": "xlsx", "mediaType": "application/vnd.openxmlformats-officedocument.spreadsheetml.sheet", "title": "2023_10_23_Site3_Soil_Calibration_Datasheets.xlsx" }, { "@type": "dcat:Distribution", "downloadURL": "https://ndownloader.figshare.com/files/46381408", "format": "xlsx", "mediaType": "application/vnd.openxmlformats-officedocument.spreadsheetml.sheet", "title": "Site3BulkDensitySummary2023.xlsx" }, { "@type": "dcat:Distribution", "downloadURL": "https://ndownloader.figshare.com/files/46381585", "format": "R", "mediaType": "text/plain", "title": "CalcArithmeticAverage.R" }, { "@type": "dcat:Distribution", "downloadURL": "https://ndownloader.figshare.com/files/46381588", "format": "R", "mediaType": "text/plain", "title": "CalcVerticalWeightedAverage.R" }, { "@type": "dcat:Distribution", "downloadURL": "https://ndownloader.figshare.com/files/46381591", "format": "R", "mediaType": "text/plain", "title": "DepthWeightsFunction_SensAnalysis.R" }, { "@type": "dcat:Distribution", "downloadURL": "https://ndownloader.figshare.com/files/46381594", "format": "R", "mediaType": "text/plain", "title": "EffectOfNumberSamplesInFootprint.R" }, { "@type": "dcat:Distribution", "downloadURL": "https://ndownloader.figshare.com/files/46381597", "format": "html", "mediaType": "text/html", "title": "gSMS_Results.html" }, { "@type": "dcat:Distribution", "downloadURL": "https://ndownloader.figshare.com/files/46381600", "format": "txt", "mediaType": "text/plain", "title": "gSMS_Results.txt" }, { "@type": "dcat:Distribution", "downloadURL": "https://ndownloader.figshare.com/files/46381603", "format": "R", "mediaType": "text/plain", "title": "NumCalNeeded.R" }, { "@type": "dcat:Distribution", "downloadURL": "https://ndownloader.figshare.com/files/46381606", "format": "md", "mediaType": "text/plain", "title": "README.md" } ], "license": "https://creativecommons.org/licenses/by/4.0/", "bureauCode": [ "005:18" ], "modified": "2024-05-23", "publisher": { "@type": "org:Organization", "name": "Agricultural Research Service" }, "keyword": [ "soil water content", "gamma-ray spectroscopy" ], "spatial": "{\"type\": \"Point\", \"coordinates\": [-96.4397, 41.1797]}" }, { "identifier": "10.15482/USDA.ADC/1528782", "accessLevel": "public", "contactPoint": { "hasEmail": "mailto:Bethany.McGregor@usda.gov", "fn": "McGregor, Bethany" }, "programCode": [ "005:040" ], "description": "Culicoides biting midges are important vectors of diverse microbes such as viruses, protozoa, and nematodes that cause diseases in wild and domestic animals. However, little is known about the role of microbial communities in midge larval habitat utilization in the wild. In this study, we characterized microbial communities (bacterial, protistan, fungal and metazoan) in soils from disturbed (bison and cattle grazed) and undisturbed (non-grazed) pond and spring potential midge larval habitats. We evaluated the influence of habitat and grazing disturbance and their interaction on microbial communities, diversity, presence of midges, and soil properties. These data can be used to better understand environmental microbial communities in tallgrass prairie ecosystems associated with grazed versus ungrazed pond and spring habitats and to draw inferences on the interactions of these communities and soil properties with the presence of biting midge larvae. These data should not be used to make inferences for ecosystems other than tallgrass prairie, for animal management methods other than open cow-calf or bison grazing (such as feedlots, dairies, or stockyards), or for other grazing mammals (such as sheep or goats). These data were collected between the months of September and December and therefore are not representative of microbial communities present from January through August. Abbreviations used include Total Carbon (TC), Total Nitrogen (TN), Organic Matter (OM), Konza Prairie Biological Station (KPBS), Operational Taxonomic Unit (OTU), Principal Coordinates Analysis (PCoA), ribosomal RNA (rRNA), and vesicular stomatitis virus (VSV).
\nThe raw Illumina MiSeq sequence data for this project can be found here: https://www.ncbi.nlm.nih.gov/bioproject/PRJNA862140
\nResources in this dataset:
\nData are from a laboratory experiment conducted to examine the effects of cold temperatures on egg survival of Ageneotettix deorum, the white-whiskered grasshopper which is a common rangeland pest species in the Northern Great Plains region.
\nAbstract from published manuscript:
\nThe effect of cold temperatures and exposure time on egg survival and hatching success were examined in the white-whiskered grasshopper, Ageneotettix deorum. Temperature treatments ranged from 4°C to -35°C, with treatment times ranging from 48 to 240 hours. Both decreasing temperatures and exposure time negatively affected egg survival, with a temperature below -25°C being lethal. Similar lethal temperatures are known for several North American grasshopper species. The relatively shallow location of A. deorum egg pods would result in increased vulnerability of eggs to cold temperatures in the absence of snow.
Resources in this dataset:
\nResource title: Column descriptions for Winter Egg Survival and Daily Hatch\nFile name: Column Heading Winter Egg Survival and Hatch Count.xlsx
\nResource title: Ageneotettix deorum hatch survival\nFile name: Winter Egg Survival.xlsx\nResource description: The data are total numbers of hatched and unhatched eggs at 3 significant temperatures (4, -20, and -25 degrees Celsius).
\nResource title: Daily Hatch\nFile name: Hatch Count.xlsx\nResource description: The data are the daily hatch count for egg pods held at the various time and temperature parameters.
\nThis dataset consists of a data file with raw data from a bioassay that assessed the survival of root knot nematode (J2 life-stage) in the presence of different stilbenoid compounds, as well as another file showing summary descriptive statistics and a summary graph. The experiment consisted of counting the survival of J2 stage root knot nematodes in microplate wells with water amended with 0, 1.25, 2.5, 5, or 10 ppm of the stilbenoid monomer piceid, the stilbenoid dimer epsilon-viniferin, the stilbenoid trimer miyabenol C, or a mix of stilbenoid tetramers vitisin B and hopeaphenol. Counts were made at the beginning of the experiment and 1, 3, or 5 days later. The percent of surviving nematodes at day 5 was used to observe if the stilbenoid compounds would have effects on the root knot nematodes.
Resource Title: RootKnotBioassayData.
File Name: RootKnotBioassayData.xlsx
Resource Description: Raw count data from an experiment assessing the mortality or survival of J2 root knot nematodes over time when exposed to piceid, epsilon-viniferin, miyabenol C, and vitisin B/hopeaphenol at 0, 1.25, 2.5, 5, or 10 ppm.
Resource Title: RootKnotBioassaySummary.
File Name: RootKnotBioassaySummary.xlsx
Resource Description: Descriptive statistics (means and deviations) and ANOVA statistics for survival percentage data of root knot nematodes exposed to four different stilbenoid compounds at different concentrations 1, 3, or 5 days after initial exposure. A graph of survival at day 5 is also provided.
Behavioral data for eight strains of red flour beetles in three behavioral assays and two commercial lures.
\nThe red flour beetle, Tribolium castaneum (Herbst) (Coleoptera: Tenebrionidae), is a major pest of facilities where grain is processed because of its ability to find and colonize food resource patches. Traps baited with pheromone and kairomone lures are commonly used to monitor for the presence of insects in warehouses or flour mills, for example. However, two nonmutually exclusive components, environment and genetics, could influence insect responsiveness to volatiles, impacting the efficacy of monitoring. Intraspecific variation in attraction behavior to food and mates is largely unexplored in stored-product insects, but tapping into natural genetic variation could provide a baseline for identifying genetic mechanisms associated with finding resources. Here, we assess eight strains of T. castaneum for variation in response to kairomone- and pheromone-based lures using three behavioral assays: paired choice with no forced air flow, upwind attraction with forced air flow, and movement pattern in an arena with a single odor source. We find strain-specific responses to kairomones and pheromones and evidence for heritability in behavioral responses. However, environmental coefficients for behavioral responses to both lures are high, suggesting that environment, and its potential interaction with genotype, strongly influences behavioral outcomes in these assays. Furthermore, despite the different environmental conditions among the different behavioral assays, we find a correlation for volatile preference among the assays. Our results provide a baseline assessment of natural variation for preference to kairomone and pheromone lures and suggest that careful consideration of behavioral assay is key to understanding the mechanisms of attraction in these stored-product pests.
Resource Title: Behavior data from petri dish assays with no volatiles.
File Name: petri_control.csv
Resource Description: Data from: Red flour beetle (Coleoptera: Tenebrionidae) response to volatile cues varies with strain and behavioral assay. Data for eight strains, two sexes, and 10 replicates for each strain and sex. No volatiles were used in this part of the experiment. Data were collected using a Sony Handycam and analyzed using Ethovision software. Distance moved is in cm; velocity is cm/s-2. Duration values are in seconds.
Resource Title: Behavior data for petri dish assay with volatiles.
File Name: petri_volatiles.csv
Resource Description: Data from: Red flour beetle (Coleoptera: Tenebrionidae) response to volatile cues varies with strain and behavioral assay. Data for eight strains, two sexes, and 10 replicates for each strain and sex. Volatile used was either a pheromone or kairomone lure. Data were collected using a Sony Handycam and analyzed using Ethovision software. Distance moved is in cm; velocity is cm/s-2. Duration values are in seconds.
Resource Title: Data for behavior in wind tunnel assay with and without volatiles.
File Name: windtunnel_data_final.csv
Resource Description: Data from: Red flour beetle (Coleoptera: Tenebrionidae) response to volatile cues varies with strain and behavioral assay. Data for eight strains, two sexes, and 10 replicates for each strain and sex. Volatile used was either a pheromone or kairomone (oil) lure or there was no volatile (control). Top indicates movement toward the wind source or volatile. Left, right, or bottom indicate movement in that direction.
Resource Title: Behavioral data from y-maze assay with or without volatile.
File Name: ymaze_data_final.csv
Resource Description: Data from: Red flour beetle (Coleoptera: Tenebrionidae) response to volatile cues varies with strain and behavioral assay. Data for eight strains, two sexes, and 10 replicates for each strain and sex. Volatile used was either a pheromone or kairomone (oil) lure or there was no volatile (control). Volatile_Location indicates what volatile was used and if it was in the left or right arm of the y-maze. If final_direction is non_base, the beetle went to the base of the y-maze and did not leave or was located there after 5 minutes.
Resource Title: Data for repeatability of directions within and across days.
File Name: repeatability.csv
Resource Description: Data from: Red flour beetle (Coleoptera: Tenebrionidae) response to volatile cues varies with strain and behavioral assay. Data for lab strain of T. castaneum. Volatile used was pheromone and kairomone (oil) lures or there was no volatile (control). Beetle ID is an identifier specific to each Block. Direction1 is the first direction on a given day, time1 is the time to make that decision; a total of 4 directions were assessed for each day. Each beetle was repeated for 4 days. Rep represents block and day: 1_1 = block 1, day 1. Beetles are the same throughout the block. Top indicates movement toward the wind source or volatile. Left, right, or bottom indicate movement in that direction.
Resource Title: Data Dictionary.
File Name: DataDictionary_RedFlourBeetle.csv
Culex quinquefasciatus is an important target for vector control because of its ability to transmit pathogens that cause disease. Most populations are resistant to pyrethroids and often to organophosphates, the two most common classes of active ingredients used by public health agencies. A knockdown resistance (kdr) mutation, resulting in a change from a leucine to phenylalanine in the voltage gated sodium channel, is one mechanism contributing to the pyrethroid resistant phenotype. Enzymatic resistance has also been shown to play a very important role. Recent studies have shown strong resistance in populations even when kdr is relatively low which indicates factors other than kdr may be larger contributors to resistance. In this study, we examined on a statewide scale (over 70 populations), the strength of the correlation between resistance in the CDC bottle bioassay and the kdr genotypes and allele frequencies. Spearman correlation analysis showed only moderate (-0.51) and weak (-0.29) correlation between the kdr genotype and permethrin and deltamethrin respectively. The frequency of the kdr allele was an even weaker correlate. These results indicate, in contrast to Aedes aegypti, assessing kdr in populations of Culex quinquefasciatus is not a good surrogate for phenotypic resistance testing.
", "title": "Data From: The 1014F knockdown resistance mutation is not a strong correlate of phenotypic resistance to pyrethroids in Florida populations of Culex quinquefasciatus", "distribution": [ { "@type": "dcat:Distribution", "downloadURL": "https://ndownloader.figshare.com/files/44613883", "format": "txt", "mediaType": "text/plain", "title": "Readme.txt" }, { "@type": "dcat:Distribution", "downloadURL": "https://ndownloader.figshare.com/files/44467844", "format": "docx", "mediaType": "application/vnd.openxmlformats-officedocument.wordprocessingml.document", "title": "Table S1.docx" }, { "@type": "dcat:Distribution", "downloadURL": "https://ndownloader.figshare.com/files/44614393", "format": "xlsx", "mediaType": "application/vnd.openxmlformats-officedocument.spreadsheetml.sheet", "title": "File S1.xlsx" }, { "@type": "dcat:Distribution", "downloadURL": "https://ndownloader.figshare.com/files/44612944", "format": "xlsx", "mediaType": "application/vnd.openxmlformats-officedocument.spreadsheetml.sheet", "title": "File S2.xlsx" }, { "@type": "dcat:Distribution", "downloadURL": "https://ndownloader.figshare.com/files/44467838", "format": "xlsx", "mediaType": "application/vnd.openxmlformats-officedocument.spreadsheetml.sheet", "title": "File S3.xlsx" }, { "@type": "dcat:Distribution", "downloadURL": "https://ndownloader.figshare.com/files/44467850", "format": "xlsx", "mediaType": "application/vnd.openxmlformats-officedocument.spreadsheetml.sheet", "title": "File S4.xlsx" } ], "license": "https://creativecommons.org/licenses/by/4.0/", "bureauCode": [ "005:18" ], "modified": "2024-03-20", "publisher": { "@type": "org:Organization", "name": "Agricultural Research Service" }, "accrualPeriodicity": "irregular", "keyword": [ "Culex quinquefasciatus", "Knockdown resistance (kdr)", "L1014F", "insecticide resistance", "pyrethroid insecticide resistance monitoring", "organophosphate insecticide resistance monitoring", "Florida counties", "CDC bottle bioassay", "Topical Application" ] }, { "identifier": "10.15482/USDA.ADC/25054979.v1", "accessLevel": "public", "contactPoint": { "hasEmail": "mailto:amanda.hulse-kemp@usda.gov", "fn": "Hulse-Kemp, Amanda M." }, "programCode": [ "005:040" ], "description": "These files represent the final annotations for two hydrangea genomes derived from BRAKER2 using total RNAs extracted from seven tissue types, including sepals, buds, flowers, nodes, internodes, leaves, and roots, and subjected to library preparation according to the manufacturer’s instructions. The publicly available Iso-seq reads on NCBI (PRJDB9979) were used for genome annotation. Files include normal gff3 format and coding sequence (CDS) files.
", "title": "Data From: Two haplotype-resolved genomes reveal important flower traits in bigleaf hydrangea (Hydrangea macrophylla) and insights into Asterid evolution", "distribution": [ { "@type": "dcat:Distribution", "downloadURL": "https://ndownloader.figshare.com/files/45117895", "format": "gff3", "mediaType": "text/plain", "title": "Bailey.gff3" }, { "@type": "dcat:Distribution", "downloadURL": "https://ndownloader.figshare.com/files/45117892", "format": "gff3", "mediaType": "text/plain", "title": "Veithcii.gff3" }, { "@type": "dcat:Distribution", "downloadURL": "https://ndownloader.figshare.com/files/45117901", "format": "fasta", "mediaType": "text/plain", "title": "Bailey_cds.fasta" }, { "@type": "dcat:Distribution", "downloadURL": "https://ndownloader.figshare.com/files/45117898", "format": "fasta", "mediaType": "text/plain", "title": "Veitchii_cds.fasta" }, { "@type": "dcat:Distribution", "downloadURL": "https://ndownloader.figshare.com/files/45117952", "format": "fasta", "mediaType": "text/plain", "title": "Bailey_primary_order.fasta" }, { "@type": "dcat:Distribution", "downloadURL": "https://ndownloader.figshare.com/files/45117949", "format": "fasta", "mediaType": "text/plain", "title": "Veitchii_primary_order.fasta" } ], "license": "https://creativecommons.org/licenses/by/4.0/", "bureauCode": [ "005:18" ], "modified": "2024-04-02", "publisher": { "@type": "org:Organization", "name": "Agricultural Research Service" }, "keyword": [ "hydrangea", "gene annotation", "flowers", "horticulture production" ] }, { "identifier": "10.15482/USDA.ADC/25436743.v1", "accessLevel": "public", "contactPoint": { "hasEmail": "mailto:alison.gerken@usda.gov", "fn": "Gerken, Alison R." }, "programCode": [ "005:040" ], "description": "The pet food and accessories industry is a multi-billion-dollar business. Goods are shipped and stored in a scheduled manner, but consumers also dictate what is bought and when, introducing extreme variability in the retail system. These products are susceptible to stored product insect pests, such as the Indian meal moth, Plodia interpunctella Hübner (Lepidoptera: Pyralidae) which can cause significant damage to the product. Mating disruption is a form of control where extremely high doses of sex pheromone are used to disable mating. A new formulation of microencapsulated P. interpunctella female sex pheromone was tested in four pet food retail stores from 2021 to 2022 with monthly monitoring. Three stores, classified as high, medium/low, and low starting populations were sprayed with microencapsulated pheromone at 90-day intervals for a year. The fourth store remained an untreated control. Data were analyzed by store, month, and host product category (cat food and supplies; dog food and supplies; cat litter; fish, bird, and small animal products; and backroom area). Stores that were treated with encapsulated pheromone showed significantly lower populations over time. Heat maps demonstrated how unpredictable human interactions in this unique environment. These results show that this new formulation significantly reduces P. interpunctella populations over time and in combination with other IPM strategies can be recommended and brought to the forefront in a challenging commercial retail environment.
The stores that are labeled \"Not Used\" were assessed for baseline populations but numbers were so low that they were not used in further analyses. The numbers in each month column indicate counts of P. interpunctella moths caught in each trap.
", "title": "Data From: Using microencapsulated liquid pheromone for the control of Indian meal moth (Plodia interpunctella) in a retail environment", "distribution": [ { "@type": "dcat:Distribution", "downloadURL": "https://ndownloader.figshare.com/files/45133168", "format": "xlsx", "mediaType": "application/vnd.openxmlformats-officedocument.spreadsheetml.sheet", "title": "IMM MEC Data.xlsx" } ], "license": "https://creativecommons.org/licenses/by/4.0/", "bureauCode": [ "005:18" ], "modified": "2024-06-17", "publisher": { "@type": "org:Organization", "name": "Agricultural Research Service" }, "accrualPeriodicity": "irregular", "keyword": [ "Insect Pest Monitoring", "mating disruption; pheromone", "mating disruption treatment", "Stored products pests", "pet supply", "retail store environment", "spatial distribution" ] }, { "identifier": "10.15482/USDA.ADC/25824370.v1", "accessLevel": "public", "contactPoint": { "hasEmail": "mailto:melissa.johnson@usda.gov", "fn": "Johnson, Melissa, A" }, "programCode": [ "005:040" ], "description": "These data are from a study that characterized the height and time of day that coffee berry borer (CBB, Hypothenemus hampei) fly in commercial coffee fields located on Hawaii Island. We estimated the flight height of coffee berry borer females from 2020-2021 at four farms using alcohol-baited funnel traps set at 1-meter intervals up to 5 meters above the ground. Coffee fruit phenology was quantified to determine if CBB flight patterns changed with fruit availability. Fruit infestation in the low, mid, and high canopy was estimated to see if flight height patterns observed from traps mirrored that observed in trees. Coffee berry borer temporal flight patterns were estimated using timer traps, and temperature, relative humidity, and wind speed were measured using cell-service weather stations. Knowledge of vertical and temporal flight patterns in coffee berry borer could be used to optimize spray timing and precision targeting of areas within the coffee tree.
", "title": "Data From: Vertical and temporal flight patterns of coffee berry borer (Coleoptera: Curculionidae) in Hawaii", "distribution": [ { "@type": "dcat:Distribution", "downloadURL": "https://ndownloader.figshare.com/files/46727863", "format": "xlsx", "mediaType": "application/vnd.openxmlformats-officedocument.spreadsheetml.sheet", "title": "Weather.xlsx" }, { "@type": "dcat:Distribution", "downloadURL": "https://ndownloader.figshare.com/files/46727869", "format": "xlsx", "mediaType": "application/vnd.openxmlformats-officedocument.spreadsheetml.sheet", "title": "CBB Traps_infestation.xlsx" }, { "@type": "dcat:Distribution", "downloadURL": "https://ndownloader.figshare.com/files/46727872", "format": "xlsx", "mediaType": "application/vnd.openxmlformats-officedocument.spreadsheetml.sheet", "title": "Phenology.xlsx" } ], "license": "https://creativecommons.org/licenses/by/4.0/", "bureauCode": [ "005:18" ], "modified": "2024-06-06", "publisher": { "@type": "org:Organization", "name": "Agricultural Research Service" }, "keyword": [ "crop infestation", "weather", "phenology", "trap catch", "integrated pest management" ] }, { "identifier": "10.15482/USDA.ADC/1254010", "accessLevel": "public", "contactPoint": { "hasEmail": "mailto:ars.danny@gmail.com", "fn": "Marks, Danny G." }, "programCode": [ "005:040" ], "description": "Weather, snow, stream, topographic, and vegetation data are presented from the South Mountain Experimental Catchments from water years 2007-2013 (10-1-2007 to 9-30-2013). The data provide detailed information on the weather and hydrologic response for four highly instrumented catchments in the late stages of woodland encroachment. Hourly data from six meteorologic stations and four weirs have been carefully processed and quality checked, are serially complete, and ideal for hydrologic, ecosystem, and biogeochemical modeling. Topographic and vegetation data, as well as stream and drainage area delineations are Lidar-derived. This study site was established in 2007 as a collaborative, long-term research laboratory to address the impacts of western juniper (Juniperus occidentalis Hook) encroachment and treatments in the interior Great Basin region of the western USA.
\nFor more information about this dataset, contact:\nPatrick R. Kormos: patrick.kormos@ars.usda.gov\nDanny G. Marks: ars.danny@gmail.com
", "title": "Data From: Weather, Snow, and Streamflow data from four western juniper-dominated Experimental Catchments in south western Idaho, USA.", "distribution": [ { "@type": "dcat:Distribution", "downloadURL": "https://ndownloader.figshare.com/files/44334659", "format": "csv", "mediaType": "text/plain", "title": "air_temp_final.csv" }, { "@type": "dcat:Distribution", "downloadURL": "https://ndownloader.figshare.com/files/44334662", "format": "txt", "mediaType": "text/plain", "title": "readme_3.txt" }, { "@type": "dcat:Distribution", "downloadURL": "https://ndownloader.figshare.com/files/44334665", "format": "csv", "mediaType": "text/plain", "title": "dewpoint_final.csv" }, { "@type": "dcat:Distribution", "downloadURL": "https://ndownloader.figshare.com/files/44334668", "format": "csv", "mediaType": "text/plain", "title": "incoming_solar_final.csv" }, { "@type": "dcat:Distribution", "downloadURL": "https://ndownloader.figshare.com/files/44334671", "format": "csv", "mediaType": "text/plain", "title": "precipitation_final.csv" }, { "@type": "dcat:Distribution", "downloadURL": "https://ndownloader.figshare.com/files/44334713", "format": "csv", "mediaType": "text/plain", "title": "relative_humidity_final.csv" }, { "@type": "dcat:Distribution", "downloadURL": "https://ndownloader.figshare.com/files/44334722", "format": "csv", "mediaType": "text/plain", "title": "snow_depth_final.csv" }, { "@type": "dcat:Distribution", "downloadURL": "https://ndownloader.figshare.com/files/44334725", "format": "csv", "mediaType": "text/plain", "title": "vapor_pressure.csv" }, { "@type": "dcat:Distribution", "downloadURL": "https://ndownloader.figshare.com/files/44334728", "format": "csv", "mediaType": "text/plain", "title": "wind_speed_final.csv" }, { "@type": "dcat:Distribution", "downloadURL": "https://ndownloader.figshare.com/files/44334731", "format": "csv", "mediaType": "text/plain", "title": "snow_course_final.csv" }, { "@type": "dcat:Distribution", "downloadURL": "https://ndownloader.figshare.com/files/44334734", "format": "csv", "mediaType": "text/plain", "title": "station_coords_0.csv" }, { "@type": "dcat:Distribution", "downloadURL": "https://ndownloader.figshare.com/files/44334737", "format": "csv", "mediaType": "text/plain", "title": "air_temp_raw.csv" }, { "@type": "dcat:Distribution", "downloadURL": "https://ndownloader.figshare.com/files/44334740", "format": "csv", "mediaType": "text/plain", "title": "incoming_solar_raw.csv" }, { "@type": "dcat:Distribution", "downloadURL": "https://ndownloader.figshare.com/files/44334743", "format": "csv", "mediaType": "text/plain", "title": "precipitation_raw.csv" }, { "@type": "dcat:Distribution", "downloadURL": "https://ndownloader.figshare.com/files/44334746", "format": "csv", "mediaType": "text/plain", "title": "relative_humidity_raw.csv" }, { "@type": "dcat:Distribution", "downloadURL": "https://ndownloader.figshare.com/files/44334752", "format": "csv", "mediaType": "text/plain", "title": "snow_course_raw.csv" }, { "@type": "dcat:Distribution", "downloadURL": "https://ndownloader.figshare.com/files/44334758", "format": "csv", "mediaType": "text/plain", "title": "snow_depth_raw.csv" }, { "@type": "dcat:Distribution", "downloadURL": "https://ndownloader.figshare.com/files/44334761", "format": "csv", "mediaType": "text/plain", "title": "wind_dir_raw.csv" }, { "@type": "dcat:Distribution", "downloadURL": "https://ndownloader.figshare.com/files/44334767", "format": "csv", "mediaType": "text/plain", "title": "wind_speed_raw.csv" }, { "@type": "dcat:Distribution", "downloadURL": "https://ndownloader.figshare.com/files/44334770", "format": "zip", "mediaType": "application/zip", "title": "catchment_boundaries.zip" }, { "@type": "dcat:Distribution", "downloadURL": "https://ndownloader.figshare.com/files/44334773", "format": "zip", "mediaType": "application/zip", "title": "weather_stations.zip" }, { "@type": "dcat:Distribution", "downloadURL": "https://ndownloader.figshare.com/files/44334779", "format": "zip", "mediaType": "application/zip", "title": "weirs.zip" }, { "@type": "dcat:Distribution", "downloadURL": "https://ndownloader.figshare.com/files/44334782", "format": "zip", "mediaType": "application/zip", "title": "bare_earth_dem.zip" }, { "@type": "dcat:Distribution", "downloadURL": "https://ndownloader.figshare.com/files/44334785", "format": "zip", "mediaType": "application/zip", "title": "maximum_veg_ht_10m.zip" }, { "@type": "dcat:Distribution", "downloadURL": "https://ndownloader.figshare.com/files/44334833", "format": "zip", "mediaType": "application/zip", "title": "bare_earth_dem_1m.zip" }, { "@type": "dcat:Distribution", "downloadURL": "https://ndownloader.figshare.com/files/44334836", "format": "zip", "mediaType": "application/zip", "title": "maximum_veg_ht_1m.zip" }, { "@type": "dcat:Distribution", "downloadURL": "https://ndownloader.figshare.com/files/44334842", "format": "zip", "mediaType": "application/zip", "title": "mean_veg_ht_1m.zip" }, { "@type": "dcat:Distribution", "downloadURL": "https://ndownloader.figshare.com/files/44334845", "format": "csv", "mediaType": "text/plain", "title": "stream_discharge_final_0.csv" }, { "@type": "dcat:Distribution", "downloadURL": "https://ndownloader.figshare.com/files/44334848", "format": "json", "mediaType": "text/plain", "title": "SouthMountainExperimentalCatchmentsGeoJSON.json" } ], "license": "https://www.usa.gov/publicdomain/label/1.0/", "bureauCode": [ "005:18" ], "modified": "2024-03-13", "publisher": { "@type": "org:Organization", "name": "Agricultural Research Service" }, "keyword": [ "EARTH SCIENCE > TERRESTRIAL HYDROSPHERE > SURFACE WATER", "EARTH SCIENCE > TERRESTRIAL HYDROSPHERE > SURFACE WATER > DISCHARGE/FLOW", "Weather", "EARTH SCIENCE > ATMOSPHERE > PRECIPITATION > SNOW", "EARTH SCIENCE > ATMOSPHERE > PRECIPITATION > PRECIPITATION AMOUNT", "EARTH SCIENCE > ATMOSPHERE > PRECIPITATION > RAIN", "EARTH SCIENCE > ATMOSPHERE > ATMOSPHERIC WINDS > SURFACE WINDS > WIND SPEED/WIND DIRECTION", "EARTH SCIENCE > ATMOSPHERE > ATMOSPHERIC WATER VAPOR > HUMIDITY", "EARTH SCIENCE > ATMOSPHERE > ATMOSPHERIC RADIATION > INCOMING SOLAR RADIATION", "EARTH SCIENCE > ATMOSPHERE > ATMOSPHERIC TEMPERATURE > AIR TEMPERATURE", "EARTH SCIENCE > ATMOSPHERE > ATMOSPHERIC WATER VAPOR > DEW POINT TEMPERATURE", "EARTH SCIENCE > BIOSPHERE > AQUATIC ECOSYSTEMS", "weirs", "woodland", "meteorological data", "western United States", "juniperus occidentalis", "NP211", "data.gov", "ARS" ], "spatial": "{\"type\": \"MultiPolygon\", \"coordinates\": [[[[-116.89633063576, 42.671162157382], [-116.89633063576, 42.671153140742], [-116.89631841701, 42.671153140742], [-116.89631841701, 42.671162157382], [-116.89633063576, 42.671162157382]]], [[[-116.9099362837, 42.674985847107], [-116.9099362837, 42.666415609203], [-116.89633060582, 42.666415609203], [-116.89633060582, 42.674985847107], [-116.9099362837, 42.674985847107]]], [[[-116.91307828414, 42.66968946418], [-116.91307828414, 42.66473418532], [-116.90590622705, 42.66473418532], [-116.90590622705, 42.66968946418], [-116.91307828414, 42.66968946418]]], [[[-116.91225963521, 42.667862222668], [-116.91225963521, 42.658078959399], [-116.90139495895, 42.658078959399], [-116.90139495895, 42.667862222668], [-116.91225963521, 42.667862222668]]], [[[-116.91269849759, 42.660469633725], [-116.91269849759, 42.649118506137], [-116.90199192857, 42.649118506137], [-116.90199192857, 42.660469633725], [-116.91269849759, 42.660469633725]]]]}" }, { "identifier": "10.15482/USDA.ADC/25345426.v1", "accessLevel": "public", "contactPoint": { "hasEmail": "mailto:jcbotsch@gmail.com", "fn": "Botsch, Jamieson C." }, "programCode": [ "005:040" ], "description": "In this experiment, we crossed temperature (20, 25, and 30C) with humidity (<5%, 50%, and >95% RH) and measured the effects on bumble bee (Bombus impatiens) water balance. We had 10 replicates per treatment, with 6 source colonies, resulting in a total of 540 bees. We placed bees singly into tubes and checked for mortality every 2 hours for the first 12 hours and then every 4 hours until 5/10 bees from each temperature, humidity, colony treatment had reached mortality (52h and 48h for the two trials). We measured mass before and after mortality to evaluate water loss and then dried bees to a constant dry weight to get the initial water content and dry mass of each bee.
", "title": "Data and Code: Temperature influences desiccation resistance of bumble bees", "distribution": [ { "@type": "dcat:Distribution", "downloadURL": "https://ndownloader.figshare.com/files/44867044", "format": "xlsx", "mediaType": "application/vnd.openxmlformats-officedocument.spreadsheetml.sheet", "title": "desiccation resistance MASTER.xlsx" }, { "@type": "dcat:Distribution", "downloadURL": "https://ndownloader.figshare.com/files/44867047", "format": "R", "mediaType": "text/plain", "title": "Desiccation Resistance.R" } ], "license": "https://creativecommons.org/licenses/by/4.0/", "bureauCode": [ "005:18" ], "modified": "2024-05-08", "publisher": { "@type": "org:Organization", "name": "Agricultural Research Service" }, "keyword": [ "Bombus impatiens", "desiccation resistance", "water loss rates", "critical water content" ] }, { "identifier": "10.15482/USDA.ADC/25521448.v1", "accessLevel": "public", "contactPoint": { "hasEmail": "mailto:katherine.muller2010@gmail.com", "fn": "Muller, Katherine E." }, "programCode": [ "005:040" ], "description": "During symbiosis, C that rhizobia respire to power N fixation can be stored as polyhydroxybutyrate (PHB), shown to support rhizobia survival under laboratory starvation. We collected soil in 2015 from four replicate plots per treatment in two long-term experiments at Waseca, Minnesota. Treatments differed in the intervals between soybean (Glycine max (L.) Merr.) hosts. We measured PHB accumulation in eight nodules per plant from four soybean (cv. ‘MN0095’) trap plants per soil sample. Trap plants were arranged in a greenhouse, common-garden experiment, and PHB accumulation was measured using flow cytometry. Treatments sampled after long intervals without soybean (greater than two years) showed a greater relative abundance of high-PHB strains. Treatments sampled after the first year of soybean following five years of a non-host crop showed a decreased relative abundance of high-PHB strains, compared to treatments sampled after long intervals without soybean. The latter result is consistent with the hypothesis (not tested directly here) that some high-PHB strains were “sanctioned” by plants as less-beneficial. Our results suggest that rhizobia strains with the tendency to allocate more C to N fixation at the expense of PHB accumulation may be less likely to persist where soybean is grown infrequently or where soil conditions make PHB particularly valuable. However, with typical two-year rotations in Minnesota, differences in PHB storage are unlikely to have a major effect on the relative survival of strains.
See README.md for a detailed description of data files and scripts.
", "title": "Data and analysis scripts for: Prolonged soybean absence in the field selects for rhizobia that accumulate more polyhydroxybutyrate during symbiosis", "distribution": [ { "@type": "dcat:Distribution", "downloadURL": "https://ndownloader.figshare.com/files/45406861", "format": "md", "mediaType": "text/plain", "title": "README.md" }, { "@type": "dcat:Distribution", "downloadURL": "https://ndownloader.figshare.com/files/45406864", "format": "html", "mediaType": "text/html", "title": "analysisOfPHBacrossRotationTreatments.html" }, { "@type": "dcat:Distribution", "downloadURL": "https://ndownloader.figshare.com/files/45406870", "format": "pdf", "mediaType": "application/pdf", "title": "appendix_chl.pdf" }, { "@type": "dcat:Distribution", "downloadURL": "https://ndownloader.figshare.com/files/45406867", "format": "pdf", "mediaType": "application/pdf", "title": "appendix_nodcount.pdf" }, { "@type": "dcat:Distribution", "downloadURL": "https://ndownloader.figshare.com/files/45406873", "format": "pdf", "mediaType": "application/pdf", "title": "appendix_nodmass.pdf" }, { "@type": "dcat:Distribution", "downloadURL": "https://ndownloader.figshare.com/files/45406876", "format": "pdf", "mediaType": "application/pdf", "title": "appendix_plantMetricsByRotation.pdf" }, { "@type": "dcat:Distribution", "downloadURL": "https://ndownloader.figshare.com/files/45406879", "format": "pdf", "mediaType": "application/pdf", "title": "appendix_shootmass.pdf" }, { "@type": "dcat:Distribution", "downloadURL": "https://ndownloader.figshare.com/files/45406882", "format": "pdf", "mediaType": "application/pdf", "title": "Figure1_distributionOfPHB.pdf" }, { "@type": "dcat:Distribution", "downloadURL": "https://ndownloader.figshare.com/files/45406891", "format": "tiff", "mediaType": "image/tiff", "title": "Figure2_hostabResults.tiff" }, { "@type": "dcat:Distribution", "downloadURL": "https://ndownloader.figshare.com/files/45406885", "format": "tiff", "mediaType": "image/tiff", "title": "Figure3_hostpresResults.tiff" }, { "@type": "dcat:Distribution", "downloadURL": "https://ndownloader.figshare.com/files/45406888", "format": "tiff", "mediaType": "image/tiff", "title": "FigureS2_verifyingPHB.tiff" }, { "@type": "dcat:Distribution", "downloadURL": "https://ndownloader.figshare.com/files/45406894", "format": "pdf", "mediaType": "application/pdf", "title": "plantgrowthAndPHB_appendix.pdf" }, { "@type": "dcat:Distribution", "downloadURL": "https://ndownloader.figshare.com/files/45406897", "format": "tiff", "mediaType": "image/tiff", "title": "supplement_nodcountAndShootDWbygroupSROC.tiff" }, { "@type": "dcat:Distribution", "downloadURL": "https://ndownloader.figshare.com/files/45406900", "format": "tiff", "mediaType": "image/tiff", "title": "Supplement_ResultsForAllRotations.tiff" }, { "@type": "dcat:Distribution", "downloadURL": "https://ndownloader.figshare.com/files/45406903", "format": "R", "mediaType": "text/plain", "title": "analysisOfPHBacrossRotationTreatments.R" }, { "@type": "dcat:Distribution", "downloadURL": "https://ndownloader.figshare.com/files/45406906", "format": "R", "mediaType": "text/plain", "title": "Figure1_distributionOfPHB.R" }, { "@type": "dcat:Distribution", "downloadURL": "https://ndownloader.figshare.com/files/45406909", "format": "R", "mediaType": "text/plain", "title": "Figures2and3effectsOfHostAbsenceAndPresence.R" }, { "@type": "dcat:Distribution", "downloadURL": "https://ndownloader.figshare.com/files/45406912", "format": "R", "mediaType": "text/plain", "title": "plantGrowthAndNodulation_Appendices.R" }, { "@type": "dcat:Distribution", "downloadURL": "https://ndownloader.figshare.com/files/45406915", "format": "R", "mediaType": "text/plain", "title": "setUpDataAndContrasts.R" }, { "@type": "dcat:Distribution", "downloadURL": "https://ndownloader.figshare.com/files/45406918", "format": "R", "mediaType": "text/plain", "title": "verifyingPHBWithSplitRootData.R" }, { "@type": "dcat:Distribution", "downloadURL": "https://ndownloader.figshare.com/files/45406921", "format": "RDATA", "mediaType": "application/gzip", "title": "editedPHBData_WREsplitroot1.RDATA" }, { "@type": "dcat:Distribution", "downloadURL": "https://ndownloader.figshare.com/files/45406924", "format": "csv", "mediaType": "application/csv", "title": "isolateCodesForFreezerWRE.csv" }, { "@type": "dcat:Distribution", "downloadURL": "https://ndownloader.figshare.com/files/45406933", "format": "RData", "mediaType": "application/gzip", "title": "brmsMods20220313.RData" }, { "@type": "dcat:Distribution", "downloadURL": "https://ndownloader.figshare.com/files/45406930", "format": "RData", "mediaType": "application/gzip", "title": "modelOutputForPlots.RData" }, { "@type": "dcat:Distribution", "downloadURL": "https://ndownloader.figshare.com/files/45406927", "format": "RDATA", "mediaType": "application/gzip", "title": "phbplusplantdata_forDRUM.RDATA" } ], "license": "https://creativecommons.org/licenses/by/4.0/", "bureauCode": [ "005:18" ], "modified": "2024-05-28", "publisher": { "@type": "org:Organization", "name": "Agricultural Research Service" }, "accrualPeriodicity": "irregular", "keyword": [ "symbiotic nitrogen fixation (SNF)", "Polyhydroxybutyrate (PHB)", "soybean (Glycine max L. Merr.)", "Long-Term Agroecosystem Research Network" ], "spatial": "{\"type\": \"Point\", \"coordinates\": [-93.528657, 44.069167]}" }, { "identifier": "10.15482/USDA.ADC/25790394.v1", "accessLevel": "public", "contactPoint": { "hasEmail": "mailto:claire.phillips@usda.gov", "fn": "Phillips, Claire L." }, "programCode": [ "005:040" ], "description": "This dataset includes soil wet aggregate stability measurements from the Upper Mississippi River Basin LTAR site in Ames, Iowa. Samples were collected in 2021 from this long-term tillage and cover crop trial in a corn-based agroecosystem.
\nWe measured wet aggregate stability using digital photography to quantify disintegration (slaking) of submerged aggregates over time, similar to the technique described by Fajardo et al. (2016) and Rieke et al. (2021). However, we adapted the technique to larger sample numbers by using a multi-well tray to submerge 20-36 aggregates simultaneously. We used this approach to measure slaking index of 160 soil samples (2120 aggregates).
\nThis dataset includes slaking index calculated for each aggregates, and also summarized by samples. There were usually 10-12 aggregates measured per sample.
\nWe focused primarily on methodological issues, assessing the statistical power of slaking index, needed replication, sensitivity to cultural practices, and sensitivity to sample collection date. We found that small numbers of highly unstable aggregates lead to skewed distributions for slaking index. We concluded at least 20 aggregates per sample were preferred to provide confidence in measurement precision. However, the experiment had high statistical power with only 10-12 replicates per sample. Slaking index was not sensitive to the initial size of dry aggregates (3 to 10 mm diameter); therefore, pre-sieving soils was not necessary. The field trial showed greater aggregate stability under no-till than chisel plow practice, and changing stability over a growing season. These results will be useful to researchers and agricultural practitioners who want a simple, fast, low-cost method for measuring wet aggregate stability on many samples.
", "title": "Data and code from: A high throughput approach for measuring soil slaking index", "distribution": [ { "@type": "dcat:Distribution", "downloadURL": "https://ndownloader.figshare.com/files/46226910", "format": "csv", "mediaType": "application/csv", "title": "SlakeIndex_byAggregate.csv" }, { "@type": "dcat:Distribution", "downloadURL": "https://ndownloader.figshare.com/files/46226913", "format": "csv", "mediaType": "text/plain", "title": "SlakeIndex_bySample.csv" }, { "@type": "dcat:Distribution", "downloadURL": "https://ndownloader.figshare.com/files/46226916", "format": "xlsx", "mediaType": "application/vnd.openxmlformats-officedocument.spreadsheetml.sheet", "title": "Data Dictionary for High Throughput Slaking.xlsx" }, { "@type": "dcat:Distribution", "downloadURL": "https://ndownloader.figshare.com/files/46248346", "format": "R", "mediaType": "text/plain", "title": "AnalyzeSlakingData.R" } ], "license": "https://creativecommons.org/licenses/by/4.0/", "bureauCode": [ "005:18" ], "modified": "2024-06-17", "publisher": { "@type": "org:Organization", "name": "Agricultural Research Service" }, "accrualPeriodicity": "R/P1M", "keyword": [ "soil health management", "wet aggregate stability", "no-tillage farming", "Cover Crops", "image analysis routines" ] }, { "identifier": "10.15482/USDA.ADC/25988068.v1", "accessLevel": "public", "contactPoint": { "hasEmail": "mailto:michael.bosch@usda.gov", "fn": "Bosch, Michael, J." }, "programCode": [ "005:040" ], "description": "Datasets and R script used for article accepted to Environmental Entomology (June 5, 2024):\"Avocado cultivar and tree-to-tree leaf compositional differences affect infestation severity of avocado lace bug, Pseudocysta perseae (Hemiptera: Tingidae).\"
Authors: Bosch, Michael; Sun, Xiuxiu; Hall, Sierra; Love, Ken; Cox, David; Matsumoto, Tracie; Liang, Peishih; Follett, Peter; Stockton, Dara
Rep_GLMM_UHKCES.csv: Data used for repeated measures generalized linear mixed model for abundance surveys conducted at the University of Hawai'i Kona Cooperative Extension Service orchard.
Rep_GLMM_CC.csv: Data used for repeated measures generalized linear mixed model for abundance surveys conducted at the Captain Cook orchard.
ALB_Honaunau.csv: Data summarizing avocado lace bug abundance from leaves collected from the Honaunau orchard. Is to be used to perform generalized linear mixed models between lace bug abundance and sugars in corresponding avocado leaves.
LeafTraits_Honaunau.csv: Data for performing generalized linear mixed models between avocado lace bug abundance and several avocado leaf traits from leaves collected from the Honaunau orchard.
Sugars_Honaunau.csv: Data for performing generalized linear mixed models between avocado lace bug abundance and avocado leaf sugar content from leaves collected from the Honaunau orchard.
Fig1_Average.csv: Data averaging avocado lace bug abundance across trees surveyed at the University of Hawai'i Kona Cooperative Extension Service and Captain Cook orchards. To be used to generating figure 1 in manuscript.
Fig1_Sites.csv: Data on avocado lace bug abundance across trees surveyed at the University of Hawai'i Kona Cooperative Extension Service and Captain Cook orchards. To be used to generating figure 1 in manuscript.
LogOdds_USDAGermplasm.csv: Data used for performing a repeated measures proportional odds logistic regression on avocado lace bug infestation category surveys conducted at the USDA Germplasm Repository.
EE_Rscript.R: R script used to run analyses conducted and construct figures presented in the corresponding manuscript. Required R packages include:
This repository contains all data and code required to reproduce the growth curve-fitting analysis from the manuscript:
\nMcMillan, E. A., Berrang, M. E., Read, Q. D., Rasamsetti, S., Richards, A. K., Shariat, N. W., & Frye, J. G. (2022). Buffered peptone water formulation does not influence growth of pESI-positive Salmonella enterica serovar Infantis. Journal of Food Protection, 100033. https://doi.org/10.1016/j.jfp.2022.100033
\nSalmonella enterica is a major cause of human foodborne illness and is often attributed to poultry food sources. S. enterica serovar Infantis, specifically those carrying the pESI plasmid, has become a frequently isolated serotype from poultry meat samples at processing and has caused numerous recent human infections. In 2016, the USDA Food Safety and Inspection Service changed the official sampling method for raw poultry products from BPW to using neutralizing BPW (nBPW) as the rinsing agent in order to prevent residual antimicrobial effects from acidifying and oxidizing processing aids. This change was contemporaneous to the emergence of pESI-positive ser. Infantis as a prevalent serovar in poultry, prompting some to question if nBPW could be selecting for this prevalent serovar. We performed two experiments: a comparison of ser. Infantis growth in BPW versus nBPW, and a simulation of regulatory sampling methods. We found that when inoculated into both broths, ser. Infantis initially grows slightly slower in nBPW than in BPW but little difference was seen in abundance after six hours of growth. Additionally, use of nBPW to simulate poultry rinse sample and overnight cold shipping to a regulatory lab did not affect survival or subsequent growth of ser. Infantis in BPW. We concluded that the change in USDA-FSIS methodology to include nBPW in sampling procedures has likely not affected the emergence of S. ser. Infantis as a prevalent serovar in chicken and turkey meat product samples.
\nAll necessary data are in a single comma-separated file, Sal_Infantis_growth_curve_data_EAM.csv. All R code is in a single RMarkdown document, salmonella_growth_curve_fitting.Rmd. The RMarkdown contains code to read and process the data, produce exploratory plots, fit the model, do all hoc calculations with the posterior output, and produce figures and tables from the manuscript.
Salmonella Infantis growth data: This is a comma-separated file containing data needed to reproduce the growth curve fitting analysis. Columns are:
\nRMarkdown document with all analysis code: This RMarkdown document contains code to read and process the data, produce exploratory plots, fit the model, do all hoc calculations with the posterior output, and produce figures and tables from the manuscript.
\nThis was run on Windows 10, R version 4.1.2. Models were fit using CmdStan version 2.28.2, with brms version 2.17.0, cmdstanr version 0.4.0, emmeans version 1.7.3, and tidybayes version 3.0.2.
\nNational Program: Food Safety (108)
\nProject Plan Number: 6040-32000-085-000-D
Resource Title: Salmonella Infantis growth data.
File Name: Sal_Infantis_growth_curve_data_EAM.csv
Resource Title: RMarkdown document with all analysis code.
File Name: salmonella_growth_curve_fitting.Rmd
This dataset contains all data and R code, in RMarkdown notebook format, needed to reproduce all statistical analysis, figures, and tables in the manuscript:
Jeffers, D., J. S. Smith, E. D. Womack, Q. D. Read, and G. L. Windham. 2024. Comparison of in-field and laboratory-based phenotyping methods for evaluation of aflatoxin accumulation in maize inbred lines. Plant Disease. (citation to be updated upon final acceptance of MS)
There is a critical need to quickly and reliably identify corn genotypes that are resistant to accumulating aflatoxin in their kernels. We compared three methods of determining how resistant different corn genotypes are to aflatoxin accumulation: a field-based assay (side-needle inoculation) and two different lab-based assays (wounding and non-wounding kernel screening assays; KSA). In this data object, we present the data from the lab and field assays, statistical models that are fit to the data, procedures for comparing model fit of different variants of the model, and model predictions. This includes how reliably each assay identifies resistant and susceptible check varieties, and how well correlated the assay methods are with one another. Statistical analyses are done using R software, including Bayesian models fit with Stan software.
The following files are included:
The three .tsv data files should be placed in a subdirectory called \"data\" in the same directory where the .Rmd notebook is located.
", "title": "Data and code from: Comparison of in-field and laboratory-based phenotyping methods for evaluation of aflatoxin accumulation in maize inbred lines", "distribution": [ { "@type": "dcat:Distribution", "downloadURL": "https://ndownloader.figshare.com/files/44697484", "format": "Rmd", "mediaType": "text/plain", "title": "ksa_analysis_revised.Rmd" }, { "@type": "dcat:Distribution", "downloadURL": "https://ndownloader.figshare.com/files/44697505", "format": "html", "mediaType": "text/html", "title": "ksa_analysis_revised.html" }, { "@type": "dcat:Distribution", "downloadURL": "https://ndownloader.figshare.com/files/44697544", "format": "zip", "mediaType": "application/zip", "title": "brmfits.zip" }, { "@type": "dcat:Distribution", "downloadURL": "https://ndownloader.figshare.com/files/44697565", "format": "tsv", "mediaType": "text/plain", "title": "ksa_cov_mod.tsv" }, { "@type": "dcat:Distribution", "downloadURL": "https://ndownloader.figshare.com/files/44697562", "format": "tsv", "mediaType": "text/plain", "title": "step1_ksa.tsv" }, { "@type": "dcat:Distribution", "downloadURL": "https://ndownloader.figshare.com/files/44697559", "format": "tsv", "mediaType": "text/plain", "title": "step1_ksa_field.tsv" } ], "license": "https://creativecommons.org/licenses/by/4.0/", "bureauCode": [ "005:18" ], "modified": "2024-04-26", "publisher": { "@type": "org:Organization", "name": "Agricultural Research Service" }, "keyword": [ "maize (Zea mays)", "Aspergillus flavus", "aflatoxin", "host-plant resistance", "phenotyping", "kernel screening assay (KSA)" ], "spatial": "{\"type\": \"Point\", \"coordinates\": [-88.782831, 33.471436]}" }, { "identifier": "10.15482/USDA.ADC/1529421", "accessLevel": "public", "contactPoint": { "hasEmail": "mailto:quentin.read@usda.gov", "fn": "Read, Quentin" }, "programCode": [ "005:040" ], "description": "[Note 2023-08-14 - Supersedes version 1, https://doi.org/10.15482/USDA.ADC/1528086 ]
\nThis dataset contains all code and data necessary to reproduce the analyses in the manuscript:
\nMengistu, A., Read, Q. D., Sykes, V. R., Kelly, H. M., Kharel, T., & Bellaloui, N. (2023). Cover crop and crop rotation effects on tissue and soil population dynamics of Macrophomina phaseolina and yield under no-till system. Plant Disease. https://doi.org/10.1094/pdis-03-23-0443-re
\nThe .zip archive cropping-systems-1.0.zip contains data and code files.
stem_soil_CFU_by_plant.csv: Soil disease load (SoilCFUg) and stem tissue disease load (StemCFUg) for individual plants in CFU per gram, with columns indicating year, plot ID, replicate, row, plant ID, previous crop treatment, cover crop treatment, and comments. Missing data are indicated with .yield_CFU_by_plot.csv: Yield data (YldKgHa) at the plot level in units of kg/ha, with columns indicating year, plot ID, replicate, and treatments, as well as means of soil and stem disease load at the plot level.cropping_system_analysis_v3.0.Rmd: RMarkdown notebook with all data processing, analysis, and visualization codeequations.Rmd: RMarkdown notebook with formatted equationsformatted_figs_revision.R: R script to produce figures formatted exactly as they appear in the manuscriptThe Rproject file cropping-systems.Rproj is used to organize the RStudio project. Scripts and notebooks used in older versions of the analysis are found in the testing/ subdirectory. Excel spreadsheets containing raw data from which the cleaned CSV files were created are found in the raw_data subdirectory.
This dataset contains data and code from the manuscript:
Heintzman, L.J., McIntyre, N.E., Langendoen, E.J., & Read, Q.D. (2024). Cultivation and dynamic cropping processes impart land-cover heterogeneity within agroecosystems: a metrics-based case study in the Yazoo-Mississippi Delta (USA). Landscape Ecology 39, 29 (2024). https://doi.org/10.1007/s10980-024-01797-0
There are 14 rasters of land use and land cover data for the study region, in .tif format with associated auxiliary files, two shape files with county boundaries and study area extent, a CSV file with summary information derived from the rasters, and a Jupyter notebook containing Python code.
The rasters included here represent an intermediate data product. Original unprocessed rasters from NASS CropScape are not included here, nor is the code to process them.
MS_Delta_maps.zipMSDeltaCounties_UTMZone15N.shp: Depiction of the 19 counties (labeled) that intersect the Mississippi Alluvial Plain in western Mississippi.MS_Delta_MAP_UTMZone15N.shp: Depiction of the study area extent.mf8h_20082021.zipmf8h_XXXX.tif: Yearly, reclassified and majority filtered LULC data used to build comboall1.csv - derived from USDA NASS CropScape. There are 14 .tif files total for years 2008-2021. Each .tif file includes auxiliary files with the same file name and the following extensions: .tfw, .tif.aux.xml, .tif.ovr., .tif.vat.cpg., .tif.vat.dbf.comboall1.csv: Combined dataset of LULC information for all 14 years in study period.analysis.ipynb_.txt: Jupyter Notebook used to analyze comboall1.csv. Convert to .ipynb format to open with Jupyter.This research was conducted under USDA Agricultural Research Service, National Program 211 (Water Availability and Watershed Management).
", "title": "Data and code from: Cultivation and dynamic cropping processes impart land-cover heterogeneity within agroecosystems: a metrics-based case study in the Yazoo-Mississippi Delta (USA)", "distribution": [ { "@type": "dcat:Distribution", "downloadURL": "https://ndownloader.figshare.com/files/43378326", "format": "zip", "mediaType": "application/zip", "title": "mf8h_20082021.zip" }, { "@type": "dcat:Distribution", "downloadURL": "https://ndownloader.figshare.com/files/43378329", "format": "zip", "mediaType": "application/zip", "title": "MS_Delta_maps.zip" }, { "@type": "dcat:Distribution", "downloadURL": "https://ndownloader.figshare.com/files/43378332", "format": "csv", "mediaType": "text/plain", "title": "comboall1.csv" }, { "@type": "dcat:Distribution", "downloadURL": "https://ndownloader.figshare.com/files/43378335", "format": "txt", "mediaType": "text/plain", "title": "analysis.ipynb_.txt" } ], "license": "https://www.usa.gov/publicdomain/label/1.0/", "bureauCode": [ "005:18" ], "modified": "2024-03-13", "publisher": { "@type": "org:Organization", "name": "Agricultural Research Service" }, "keyword": [ "crop rotation", "land use and land cover", "Land Use and Land Cover Change", "landscape", "Mississippi Delta", "NP211", "data.gov", "ARS" ], "spatial": "{\"type\": \"Polygon\", \"coordinates\": [[[-91.232961825034, 35.000788825292], [-91.232961825034, 32.058707084911], [-90.005302292865, 32.058707084911], [-90.005302292865, 35.000788825292], [-91.232961825034, 35.000788825292]]]}" }, { "identifier": "10.15482/USDA.ADC/25673073.v1", "accessLevel": "public", "contactPoint": { "hasEmail": "mailto:quentin.read@usda.gov", "fn": "Read, Quentin D." }, "programCode": [ "005:040" ], "description": "This dataset includes all the data and R code needed to reproduce the analyses in a forthcoming manuscript:
Copes, W. E., Q. D. Read, and B. J. Smith. Environmental influences on drying rate of spray applied disinfestants from horticultural production services. PhytoFrontiers, DOI pending.
Study description: Instructions for disinfestants typically specify a dose and a contact time to kill plant pathogens on production surfaces. A problem occurs when disinfestants are applied to large production areas where the evaporation rate is affected by weather conditions. The common contact time recommendation of 10 min may not be achieved under hot, sunny conditions that promote fast drying. This study is an investigation into how the evaporation rates of six commercial disinfestants vary when applied to six types of substrate materials under cool to hot and cloudy to sunny weather conditions. Initially, disinfestants with low surface tension spread out to provide 100% coverage and disinfestants with high surface tension beaded up to provide about 60% coverage when applied to hard smooth surfaces. Disinfestants applied to porous materials were quickly absorbed into the body of the material, such as wood and concrete. Even though disinfestants evaporated faster under hot sunny conditions than under cool cloudy conditions, coverage was reduced considerably in the first 2.5 min under most weather conditions and reduced to less than or equal to 50% coverage by 5 min.
Dataset contents: This dataset includes R code to import the data and fit Bayesian statistical models using the model fitting software CmdStan, interfaced with R using the packages brms and cmdstanr. The models (one for 2022 and one for 2023) compare how quickly different spray-applied disinfestants dry, depending on what chemical was sprayed, what surface material it was sprayed onto, and what the weather conditions were at the time. Next, the statistical models are used to generate predictions and compare mean drying rates between the disinfestants, surface materials, and weather conditions. Finally, tables and figures are created.
These files are included:
This dataset contains all data and code required to reproduce the time-to-event analysis in the associated manuscript. More detail is found in the associated README.md file.
Yaeger_ReservoirDataset_Oct2022.csv: comma-separated data file with reservoir characteristics, construction times, and water table depths and percent saturation at 5-year intervals from 1975-2015.CGA_reservoir_analysis.Rmd: RMarkdown notebook with all code required to reproduce the time-to-event analysis in the manuscript and generate the associated plots.CGA_reservoir_analysis.html: HTML file rendered from the .Rmd notebook.README.md: additional details, including column descriptions from the CSV file.R version 4.1.2 (https://cran.r-project.org/bin/windows/base/old/4.1.2)
R packages:
Note: Data files will be made available upon manuscript publication
\nThis dataset contains all code and data needed to reproduce the analyses in the manuscript:
\nIDENTIFICATION OF A KEY TARGET FOR ELIMINATION OF NITROUS OXIDE, A MAJOR GREENHOUSE GAS.
\nBlake A. Oakley (1), Trevor Mitchell (2), Quentin D. Read (3), Garrett Hibbs (1), Scott E. Gold (2), Anthony E. Glenn (2)
citation will be updated upon acceptance of manuscript
\nDenitrification is a chemical process that releases nitrous oxide (N2O), a potent greenhouse gas. The NOR1 gene is part of the denitrification pathway in Fusarium. Three experiments were conducted for this study. (1) The N2O comparative experiment compares denitrification rates, as measured by N2O production, of a variety of Fusarium spp. strains with and without the NOR1 gene. (2) The N2O substrate experiment compares denitrification rates of selected strains on different growth media (substrates). For parts 1 and 2, linear models are fit comparing N2O production between strains and/or substrates. (3) The Bioscreen growth assay tests whether there is a pleiotropic effect of the NOR1 gene. In this portion of the analysis, growth curves are fit to assess differences in growth rate and carrying capacity between selected strains with and without the NOR1 gene.
\nAll code is included in a .zip archive generated from a private git repository on 2022-10-13 and archived as part of this dataset.
\nThe code is contained in R scripts and RMarkdown notebooks. There are two components to the analysis: the denitrification analysis (comprising parts 1 and 2 described above) and the Bioscreen growth analysis (part 3). The scripts for each are listed and described below.
\nNOR1_denitrification_analysis.Rmd: The R code to analyze the experimental data comparing nitrous oxide emissions is all contained in a single RMarkdown notebook. This script analyzes the results from the comparative study and the substrate study.n2o_subgroup_figures.R: R script to create additional figures using the output from the RMarkdown notebookbioscreen_analysis.Rmd: This RMarkdown notebook contains all R code needed to analyze the results of the Bioscreen assay comparing growth of the different strains. It could be run as is. However, the model-fitting portion was run on a high-performance computing cluster with the following scripts:\nbioscreen_fit_simpler.R: R script containing only the model-fitting portion of the Bioscreen analysis, fit using the Stan modeling language interfaced with R through the brms and cmdstanr packages.job_bssimple.sh: Job submission shell script used to submit the model-fitting R job to be run on USDA SciNet high-performance computing cluster.Additional scripts developed as part of the analysis but that are not required to reproduce the analyses in the manuscript are in the deprecated/ folder.
Also note the files nor1-denitrification.Rproj (RStudio project file) and gtstyle.css (stylesheet for formatting the tables in the notebooks) are included.
Data required to run the analysis scripts are archived in this dataset, other than strain_lookup.csv, a lookup table of strain abbreviations and full names included in the code repository for convenience. They should be placed in a folder or symbolic link called project within the unzipped code repository directory.
N2O_data_2022-08-03/N2O_Comparative_Study_Trial_(n)_(date range).xlsx: These are the data from the N2O comparative study, where n is the trial number from 1-3 and date range is the begin and end date of the trial.N2O_data_2022-08-03/Nitrogen_Substrate_Study_Trial_(n)_(date range).xlsx: These are the data from the N2O substrate study, where n is the trial number from 1-3 and date range is the begin and end date of the trial.Outliers_NOR1_2022/Bioscreen_NOR1_Fungal_Growth_Assay_(substrate)_(oxygen level)_Outliers_BAO_(date).xlsx: These are the raw Bioscreen data files in MS Excel format. The format of each file name includes the substrate (minimal medium with nitrite or nitrate and lysine), oxygen level (hypoxia or normoxia), and date of the run. This repository includes code to process these files, but the processed data are also included on Ag Data Commons, so it is not necessary to run the data processing portion of the code.clean_data/bioscreen_clean_data.csv: This is an intermediate output file in CSV format generated by bioscreen_analysis.Rmd. It includes all the data from the Bioscreen assays in a clean analysis-ready format.This dataset contains all the data and code needed to reproduce the analyses in the manuscript:
\nPenn, H. J., & Read, Q. D. (2023). Stem borer herbivory dependent on interactions of sugarcane variety, associated traits, and presence of prior borer damage. Pest Management Science. https://doi.org/10.1002/ps.7843
\nIncluded are two .Rmd notebooks containing all code required to reproduce the analyses in the manuscript, two .html file of rendered notebook output, three .csv data files that are loaded and analyzed, and a .zip file of intermediate R objects that are generated during the model fitting and variable selection process.
\n01_boring_analysis.Rmd: This RMarkdown notebook contains R code to read and process the raw data, create exploratory data visualizations and tables, fit a Bayesian generalized linear mixed model, extract output from the statistical model, and create graphs and tables summarizing the model output including marginal means for different varieties and contrasts between crop years. 02_trait_covariate_analysis.Rmd: This RMarkdown notebook contains R code to read raw variety-level trait data, perform feature selection based on correlations between traits, fit another generalized linear mixed model using traits as predictors, and create graphs and tables from that model output including marginal means by categorical trait and marginal trends by continuous trait.These HTML files contain the rendered output of the two RMarkdown notebooks. They were generated by Quentin Read on 2023-08-30 and 2023-08-15.
\n01_boring_analysis.html02_trait_covariate_analysis.htmlThese files contain the raw data. To recreate the notebook output the CSV files should be at the file path project/data/ relative to where the notebook is run. Columns are described below.
BoredInternodes_26April2022_no format.csv: primary data file with sugarcane borer (SCB) damage\nStubble, indicates the crop year (plant cane or first stubble)# Internodes, indicates how many internodes were on the stalkvariety_lookup.csv: summary information for the 16 varieties analyzed in this study\nStubble, indicates which crop years were sampled for that variety (\"PC\" if only plant cane, \"PC, 1S\" if there are data for both plant cane and first stubble crop years)SCB resistance, is a categorical designation with four values: susceptible, moderately susceptible, moderately resistant, resistantSelect_variety_traits_12Dec2022.csv: variety-level traits for the 16 varieties analyzed in this study\nTo recreate the notebook output without having to run computationally intensive steps, unzip the archive. The fitted model objects should be at the file path project/ relative to where the notebook is run.
intermediate_R_objects.zip: This file contains intermediate R objects that are generated during the model fitting and variable selection process. You may use the R objects in the .zip file if you would like to reproduce final output including figures and tables without having to refit the computationally intensive statistical models.\nbinom_fit_intxns_updated_only5yrs.rds: fitted brms model object for the main statistical modelbinom_fit_reduced.rds: fitted brms model object for the trait covariate analysis marginal_trends.RData: calculated values of the estimated marginal trends with respect to year and previous damagemarginal_trend_trs.rds: calculated values of the estimated marginal trend with respect to TRSmarginal_trend_fib.rds: calculated values of the estimated marginal trend with respect to fiber content\nResource Title: Sugarcane borer damage data by internode, 1993-2021.
File Name: BoredInternodes_26April2022_no format.csv
Resource Title: Summary information for the 16 sugarcane varieties analyzed.
File Name: variety_lookup.csv
Resource Title: Variety-level traits for the 16 sugarcane varieties analyzed.
File Name: Select_variety_traits_12Dec2022.csv
Resource Title: RMarkdown notebook 2: trait covariate analysis.
File Name: 02_trait_covariate_analysis.Rmd
Resource Title: Rendered HTML output of notebook 2.
File Name: 02_trait_covariate_analysis.html
Resource Title: RMarkdown notebook 1: main analysis.
File Name: 01_boring_analysis.Rmd
Resource Title: Rendered HTML output of notebook 1.
File Name: 01_boring_analysis.html
Resource Title: Intermediate R objects.
File Name: intermediate_R_objects.zip
This dataset contains all data and code necessary to reproduce the analysis described under the heading \"Experiment 3\" in the manuscript:
\nTaliercio, E., Eickholt, D., Read, Q. D., Carter, T., Waldeck, N., & Fallen, B. (2023). Parental choice and seed size impact the uprightness of progeny from interspecific Glycine hybridizations. Crop Science. https://doi.org/10.1002/csc2.21015
\nThe attached files are:
\nG_max_G_soja_seedweight_seedcolor_analysis.Rmd: RMarkdown notebook containing all analysis code. The CSV data files should be placed in a subdirectory called data within the working directory from which the notebook is rendered.
G_max_G_soja_seedweight_seedcolor_analysis.html: Rendered HTML output from RMarkdown notebook, including figures, tables, and explanatory text.
counts_seedwt.csv: CSV file containing the number of progeny selected and average 100-seed weight data for each combination of cross, size class, and replicate. Columns are:
\"CLA\" or \"FF\"\"Caswell\" or \"Hugo\"seedcolor.csv: CSV file with additional data on number of seeds of each color by population. Columns are:
The data processing and analysis pipeline in the RMarkdown notebook includes:
\nThis research was funded by CRIS 6070-21220-069-00D, United Soybean Board Project # 2333-203-0101, and falls under National Program NP301.
\nResource Title: RMarkdown document with all analysis code.
File Name: G_max_G_soja_seedweight_seedcolor_analysis.Rmd
Resource Title: Rendered HTML version of notebook.
File Name: G_max_G_soja_seedweight_seedcolor_analysis.html
Resource Title: Progeny counts and seed weight data.
File Name: counts_seedwt.csv
Resource Title: Seed color counts data.
File Name: seedcolor.csv
This dataset contains all data and code necessary to reproduce the analysis presented in the manuscript:
\nWinzeler, H.E., Owens, P.R., Read Q.D.., Libohova, Z., Ashworth, A., Sauer, T. 2022. 2022. Topographic wetness index as a proxy for soil moisture in a hillslope catena: flow algorithms and map generalization. Land 11:2018. DOI: 10.3390/land11112018.
\nThere are several steps to this analysis. The relevant scripts for each are listed below. The first step is to use the raw digital elevation data (DEM) to produce different versions of the topographic wetness index (TWI) for the study region (Calculating TWI). Then, these TWI output files are processed, along with soil moisture (volumetric water content or VWC) time series data from a number of sensors located within the study region, to create analysis-ready data objects (Processing TWI and VWC). Next, models are fit relating TWI to soil moisture (Model fitting) and results are plotted (Visualizing main results). A number of additional analyses were also done (Additional analyses).
\nThe DEM of the study region is archived in this dataset as SourceDem.zip. This contains the DEM of the study region (DEM1.sgrd) and associated auxiliary files all called DEM1.* with different extensions. In addition, the DEM is provided as a .tif file called USGS_one_meter_x39y400_AR_R6_WashingtonCO_2015.tif.
The remaining data and code files are archived in the repository created with a GitHub release on 2022-10-11, twi-moisture-0.1.zip. The data are found in a subfolder called data.
2017_LoggerData_HEW.csv through 2021_HEW.csv: Soil moisture (VWC) logger data for each year 2017-2021 (5 files total).2882174.csv: weather data from a nearby station.DryPeriods2017-2021.csv: starting and ending days for dry periods 2017-2021.LoggerLocations.csv: Geographic locations and metadata for each VWC logger.Logger_Locations_TWI_2017-2021.xlsx: 546 topographic wetness indexes calculated at each VWC logger location. note: This is intermediate input created in the first step of the pipeline.To reproduce the analysis in the manuscript run these scripts in the following order. The scripts are all found in the root directory of the repository. See the manuscript for more details on the methods.
\nTerrainAnalysis.R: Taking the DEM file as input, calculates 546 different topgraphic wetness indexes using a variety of different algorithms. Each algorithm is run multiple times with different input parameters, as described in more detail in the manuscript. After performing this step, it is necessary to use the SAGA-GIS GUI to extract the TWI values for each of the sensor locations. The output generated in this way is included in this repository as Logger_Locations_TWI_2017-2021.xlsx. Therefore it is not necessary to rerun this step of the analysis but the code is provided for completeness.read_process_data.R: Takes raw TWI and moisture data files and processes them into analysis-ready format, saving the results as CSV.qc_avg_moisture.R: Does additional quality control on the moisture data and averages it across different time periods.Models were fit regressing soil moisture (average VWC for a certain time period) against a TWI index, with and without soil depth as a covariate. In each case, for both the model without depth and the model with depth, prediction performance was calculated with and without spatially-blocked cross-validation. Where cross validation wasn't used, we simply used the predictions from the model fit to all the data.
\nfit_combos.R: Models were fit to each combination of soil moisture averaged over 57 months (all months from April 2017-December 2021) and 546 TWI indexes. In addition models were fit to soil moisture averaged over years, and to the grand mean across the full study period.fit_dryperiods.R: Models were fit to soil moisture averaged over previously identified dry periods within the study period (each 1 or 2 weeks in length), again for each of the 546 indexes.fit_summer.R: Models were fit to the soil moisture average for the months of June-September for each of the five years, again for each of the 546 indexes.Preliminary visualization of results was done in a series of RMarkdown notebooks. All the notebooks follow the same general format, plotting model performance (observed-predicted correlation) across different combinations of time period and characteristics of the TWI indexes being compared. The indexes are grouped by SWI versus TWI, DEM filter used, flow algorithm, and any other parameters that varied.
\nThe notebooks show the model performance metrics with and without the soil depth covariate, and with and without spatially-blocked cross-validation. Crossing those two factors, there are four values for model performance for each combination of time period and TWI index presented.
\nperformance_plots_bymonth.Rmd: Using the results from the models fit to each month of data separately, prediction performance was averaged by month across the five years of data to show within-year trends.performance_plots_byyear.Rmd: Using the results from the models fit to each month of data separately, prediction performance was averaged by year to show trends across multiple years.performance_plots_dry_periods.Rmd: Prediction performance was presented for the models fit to the previously identified dry periods.performance_plots_summer.Rmd: Prediction performance was presented for the models fit to the June-September moisture averages.Some additional analyses were done that may not be published in the final manuscript but which are included here for completeness.
\n2019dryperiod.Rmd: analysis, done separately for each day, of a specific dry period in 2019.alldryperiodsbyday.Rmd: analysis, done separately for each day, of the same dry periods discussed above.best_indices.R: after fitting models, this script was used to quickly identify some of the best-performing indexes for closer scrutiny.wateryearfigs.R: exploratory figures showing median and quantile interval of VWC for sensors in low and high TWI locations for each water year.\nResource Title: Digital elevation model of study region.
File Name: SourceDEM.zip
Resource Description: .zip archive containing digital elevation model files for the study region. See dataset description for more details.
Resource Title: twi-moisture-0.1: Archived git repository containing all other necessary data and code .
File Name: twi-moisture-0.1.zip
Resource Description: .zip archive containing all data and code, other than the digital elevation model archived as a separate file. This file was generated by a GitHub release made on 2022-10-11 of the git repository hosted at https://github.com/qdread/twi-moisture (private repository). See dataset description and README file contained within this archive for more details.
This entry contains all data and code required to reproduce the analysis of immune response data presented in the manuscript:
\nYeh, H.-Y., J. G. Frye, C. R. Jackson, Q. D. Read, J. E. Line, and A. Hinton. 2023. Use of automated capillary immunoassay for quantification of antibodies in chicken sera against recombinant Salmonella enterica serotype Heidelberg proteins. Journal of Microbiological Methods. https://doi.org/10.1016/j.mimet.2023.106757
\nFiles included are:
\nchicken_salmonella_immunoassay_analysis.Rmd: RMarkdown notebook with all analysis code and full supplementary results, figures, tables, and explanatory notes. The Excel file containing the data should be in the same dictionary as the .Rmd file when the notebook is rendered.chicken_salmonella_immunoassay_analysis.html: rendered output of notebook including full supplementary results, figures, and tables, and explanatory text.Chicken Sera FliD FimA.xlsx: Excel file with chicken immune response data in the form of chemiluminescence values (arbitrary units) that are a proxy for immunoglobulin concentration. Each row contains measurements from an individual bird, across two time points (bleedings); at each time point IgG chemiluminescence values in response to Salmonella FliD and FimA proteins are given, and IgM chemiluminescence as well. This results in a total of eight measurements per bird (2 bleedings x 2 types of immunoglobulin x 2 Salmonella proteins). The first ten rows are non-immunized control birds and the next ten rows are immunized birds.concentration_chemiluminescence.xlsx: Excel file with protein concentration and chemiluminescence data to verify relationship between them. There are three columns, one to identify the protein (FliD and FimA), one for known protein concentration, and one for chemiluminescence. This is used to verify that the chemiluminescence values are suitable proxies for protein concentration.This research is associated with USDA project 6040-32000-079-00D and falls under National Program NP108.
Resource Title: RMarkdown document with immune response model fitting code.
File Name: chicken_salmonella_immunoassay_analysis.Rmd
Resource Title: Rendered HTML version of notebook.
File Name: chicken_salmonella_immunoassay_analysis.html
Resource Title: Immunoglobulin response data.
File Name: Chicken Sera FliD FimA.xlsx
Resource Title: Concentration and chemiluminescence data.
File Name: concentration_chemiluminescence.xlsx
The USDA-Agricultural Research Service Central Plains Experimental Range (CPER) is a Long-Term Agroecosystem Research (LTAR) network site located ~20 km northeast of Nunn, in north-central Colorado, USA. In 1939, scientists established the Long-term Grazing Intensity study (LTGI) with four replications of light, moderate, and heavy grazing. Each replication had three 129.5 ha pastures with the grazing intensity treatment randomly assigned. Today, one replication remains. Light grazing occurs in pasture 23W (9.3 Animal Unit Days (AUD)/ha, targeted for 20% utilization of peak growing-season biomass), moderate grazing in pasture 15E (12.5 AUD/ha, 40% utilization), and heavy grazing in pasture 23E (18.6 AUD/ha, 60% utilization). British- and continental-breed yearling cattle graze the pastures season-long from mid-May to October except when forage limitations shorten the grazing season. Individual raw data on cattle entry and exit weights, as well as weights every 28-days during the grazing season are available from 2000 to 2019. Cattle entry and exit weights are included in this dataset. Weight outliers (± 2 SD) are flagged for calculating summary statistics or performing statistical analysis.
Resource Title: Data Dictionary for LTGI Cattle weights on CPER (2000-2019).
File Name: LTGI_2000-2019_data_dictionary.csv
Resource Description: Data dictionary for data from USDA ARS Central Plains Experimental Range (CPER) near Nunn, CO cattle weight gains managed with light, moderate and heavy grazing intensities
Resource Title: LTGI Cattle weights on CPER (2000-2019).
File Name: LTGI_2000-2019_all_weights_published.csv
Resource Description: Data from USDA ARS Central Plains Experimental Range (CPER) near Nunn, CO cattle weight gains managed with light, moderate and heavy grazing intensities
The USDA-Agricultural Research Service High Plains Grasslands Research Station (HPGRS) is located in Cheyenne, Wyoming, USA. In 1982, a long-term stocking rate study on northern mixed-grass prairie was initiated with season-long (early June to October) grazing. Stocking rates defined as light (35% below NRCS recommended rate, 15 yearlings per 80 ha), moderate (NRCS recommended rate, 4 yearlings per 12ha), and heavy (33% above NRCS recommended rate, 4 yearlings per 9 ha). British- and continental-breed yearling cattle were used throughout the study years. When forage supply was limited due to drought, grazing seasons were shortened or cattle were not grazed for that season. Individual raw data on cattle entry and exit weights are available from 1982 to 2022. No grazing occurred in the years 1989, 2000, and 2002 due to drought conditions. Weight gain outliers (± 2 sd of treatment mean) were removed from the dataset.
Resource Title: Long-Term Grazing Intensity (LTGI) cattle weight gains.
File Name: EastUnit_LTGI.csv
Resource Description: Cattle weight gain data from the Long-Term Grazing Intensity (LTGI) 1982-2022 on the USDA Agricultural Research Service High Plains Grasslands Research Station, near Cheyenne, WY
Resource Title: Data Dictionary for Long-Term Grazing Intensity (LTGI) cattle weight gains .
File Name: EastUnit_LTGI_DataDictionary.csv
Resource Description: Data dictionary for cattle weight gain data from the Long-Term Grazing Intensity (LTGI) 1982-2022 on the USDA Agricultural Research Service High Plains Grasslands Research Station, near Cheyenne, WY
[ NOTE - Data files added 2022-11-01:
\nIn order to produce the best possible de novo, chromosome-scale genome assembly from error prone Pacific BioSciences continuous long reads (CLR) reads, we developed a publicly available, flexible and reproducible workflow that is containerized so it can be run on any conventional HPC, called polishCLR. This dataset provides example input primary contig assemblies to test and reproduce the demonstrated utility of our workflow.
\nThe polishCLR workflow can be easily initiated from three input cases:\nCase 1: An unresolved primary assembly with associated contigs, the output of FALCON 2-asm: p_ctg.fasta and a_ctg.fasta\nCase 2: A haplotype-resolved but unpolished set, the output of FALCON-Unzip 3-unzip: all_p_ctg.fasta and all_h_ctg.fasta\nCase 3: A haplotype-resolved, CLR long-read, Arrow-polished set of primary and alternate contigs, the output of FALCON-Unzip 4-polish: cns_p_ctg.fasta and cns_h_ctg.fasta.
\nThese example data are the input contigs assemblies for the pest Helicoverpa zea. These contigs are built from 49.89 Gb of raw Pacific Biosciences (PacBio) CLR data generated from a single H. zea HzStark_Cry1AcR strain male.
\nAdult H. zea were collected near the USDA-ARS Genetics and Sustainability Agricultural Research Unit, Starkville, MS, USA in 2011, and transported to and maintained in a colony at the USDA Southern Insect Management Unit (SIMRU), Stoneville, MS, USA as described previously. Larvae were selected on a diagnostic dose of 2.0 μg ml-1 purified Cry1Ac, and survivors used to create the strain, HzStark_Cry1AcR. HzStark_Cry1AcR was back-crossed every 5 generations to a susceptible line maintained at USDA-ARS SIMRU.
\nA single male pupa (homogametic, ZZ sex chromosome) from HzStark_Cry1AcR was dissected laterally into eight ~20 μg sections. High molecular weight DNA was extracted. PacBio libraries were generated from unsheared DNA using a SMRTbell Express Template Prep Kit 2.0 (Pacific Biosciences, Menlo Park, CA, USA), and 20 hour run time movies generated on a single SMRT Cell 1M v3 using the Sequel I system (Pacific Biosciences).
\nThe raw continuous long read (CLR) subread bam files were converted to fastq format using bamtools v. 2.5.1 (Barnett et al. 2011), then used as input for the Falcon assembler (Chin et al. 2016) using the pb-assembly conda environment v. 0.0.8.1 (Pacific Biosciences; default parameters). Falcon-Unzip created primary and alternate contigs with one round of haplotype-aware polishing by Arrow (Pacific Biosciences).
Resource Title: Associated assembly contigs output from FALCON/2-asm-falcon.
File Name: a_ctg_all.fasta
Resource Title: Primary assembly contigs output from FALCON/2-asm-falcon.
File Name: p_ctg.fasta
Resource Title: Alternate haplotype assembly contigs output from FALCON Unzip 3-unzip.
File Name: all_h_ctg.fasta
Resource Title: Primary assembly contigs output from FALCON Unzip 3-unzip.
File Name: all_p_ctg.fasta
Resource Title: Alternate assembly contigs output from FALCON Unzip 4-polish.
File Name: cns_h_ctg.fasta
Resource Title: Primary assembly contigs output from FALCON Unzip 4-polish.
File Name: cns_pctg.fasta
Resource Title: Test long reads.
File Name: test.1.filtered.bam.gz
Resource Description: For testing the pipeline, long reads that map to H. zea chromosome 30
Resource Title: Test short reads R1.
File Name: testpolish_R1.fastq
Resource Description: Short reads aligned to Chromosome 30 of H. zea
Resource Title: Test short reads R2.
File Name: testpolish_R2.fastq
Resource Description: Reverse pair (R2) short reads aligned to Chromosome 30 of H. zea
Resource Title: Chromosome 30 of H. zea.
File Name: GCF_022581195.2_ilHelZeax1.1_chr30.fasta
Understanding long-term management effects on soil properties is necessary to determine the sustainability of cropping systems. Documentation of soil property responses to corn-based cropping systems in the Western Corn Belt, however, is limited. A study was conducted near Mead, Nebraska to document the effects of four crop sequences (continuous corn, corn-soybean, corn-oat+clover-grain sorghum-soybean, corn-soybean-grain sorghum-oat+clover) and three nitrogen (N) rates (zero, low, high) on a suite of soil properties. At the time of sampling (spring 1999), treatments had been in place for 16 years. Soil samples were collected from two depths using a 1.8 cm step-down probe: 0-7.6 cm and 0-30.5 cm. Soil pH and electrical conductivity was estimated from a 1:1 soil-water mixture. Soil nitrate-N was measured using 1:10 soil-KCl extracts and the cadmium reduction method. Extractable P was determined by the Bray P-1 method. Particulate organic matter was determined by weight loss-on-ignition. Total carbon and N were determined by dry combustion. Potentially mineralizable N was determined by anerobic incubation, while microbial biomass was estimated by microwave irradiation. Soils data were used to identify associations with 16-year averages of grain and stover yield, grain and stover N uptake, and post-harvest soil nitrate-N. Data may be used to understand soil responses to corn-based cropping systems under rainfed conditions in a humid continental climate. Applicable USDA soil types include Yutan, Tomek, and Fillmore.
", "title": "Data from: Crop Sequence and Nitrogen Fertilization Effects on Soil Properties in the Western Corn Belt", "distribution": [ { "@type": "dcat:Distribution", "downloadURL": "https://ndownloader.figshare.com/files/46822843", "format": "xlsx", "mediaType": "application/vnd.openxmlformats-officedocument.spreadsheetml.sheet", "title": "WCBCropSys_Data Dictionary.xlsx" }, { "@type": "dcat:Distribution", "downloadURL": "https://ndownloader.figshare.com/files/46822846", "format": "xlsx", "mediaType": "application/vnd.openxmlformats-officedocument.spreadsheetml.sheet", "title": "WCBCropSys_Soil_0-7.6cm.xlsx" }, { "@type": "dcat:Distribution", "downloadURL": "https://ndownloader.figshare.com/files/46822849", "format": "xlsx", "mediaType": "application/vnd.openxmlformats-officedocument.spreadsheetml.sheet", "title": "WCBCropSys_Soil_0-30.5cm.xlsx" }, { "@type": "dcat:Distribution", "downloadURL": "https://ndownloader.figshare.com/files/46822852", "format": "xlsx", "mediaType": "application/vnd.openxmlformats-officedocument.spreadsheetml.sheet", "title": "WCBCropSys_Soil&Crop.xlsx" }, { "@type": "dcat:Distribution", "downloadURL": "https://ndownloader.figshare.com/files/46822855", "format": "csv", "mediaType": "application/csv", "title": "WCBCropSys_Soil_0-7.6cm_Data.csv" }, { "@type": "dcat:Distribution", "downloadURL": "https://ndownloader.figshare.com/files/46822858", "format": "csv", "mediaType": "text/plain", "title": "WCBCropSys_Soil_0-7.6cm_Metadata.csv" }, { "@type": "dcat:Distribution", "downloadURL": "https://ndownloader.figshare.com/files/46822861", "format": "csv", "mediaType": "application/csv", "title": "WCBCropSys_Soil_0-30.5cm_Data.csv" }, { "@type": "dcat:Distribution", "downloadURL": "https://ndownloader.figshare.com/files/46822864", "format": "csv", "mediaType": "text/plain", "title": "WCBCropSys_Soil_0-30.5cm_Metadata.csv" }, { "@type": "dcat:Distribution", "downloadURL": "https://ndownloader.figshare.com/files/46822867", "format": "csv", "mediaType": "application/csv", "title": "WCBCropSys_Soil&Crop_Data.csv" }, { "@type": "dcat:Distribution", "downloadURL": "https://ndownloader.figshare.com/files/46822870", "format": "csv", "mediaType": "text/plain", "title": "WCBCropSys_Soil&Crop_Metadata.csv" } ], "license": "https://creativecommons.org/publicdomain/zero/1.0/", "bureauCode": [ "005:18" ], "modified": "2024-06-12", "publisher": { "@type": "org:Organization", "name": "Agricultural Research Service" }, "accrualPeriodicity": "irregular", "keyword": [ "Crop rotation", "Fertilization rate", "Long-term research", "Corn production" ], "spatial": "{\"type\": \"Point\", \"coordinates\": [-96.41867, 41.16719]}" }, { "identifier": "10.15482/USDA.ADC/25208948.v1", "accessLevel": "public", "contactPoint": { "hasEmail": "mailto:Keith.Hopper@usda.gov", "fn": "Hopper, Keith R." }, "programCode": [ "005:040" ], "description": "A colony of Ganaspis near brasiliensis from Yunnan was started from field collections in Kunming, Yunnan, China in 2016. Wild berries of Rubus foliosus Weihe, Rubus niveus Thunberg, Fragaria moupinensis Cardot (Rosaceae), and Sambucus adnate Wallich (Adoxaceae) were collected in the suburbs of Kuming. The berries were often infested by D. suzukii and the closely related Drosophila pulchrella. Initially, about 600 adult parasitoids emerged from imported puparia at the quarantine facility of University of California Berkeley (UCB). These specimens were assigned to two lineages, G1 and G3, based on COI sequences. A colony of the G3 lineage from Yunnan was started at USDA-ARS Beneficial Insects Introduction Research Unit (BIIRU), Newark, Delaware, USA, from about 100 females and 50 males received from UCB in 2018. A colony of parasitoids from Tokyo (referred to as Ganaspis cf. brasiliensis in Girod et al. (2018a); Seehausen et al. (2020) was started from collections in 2016 from D. suzukii on wild cherry Prunus serrulata in Naganuma Park,Hachioji, Tokyo (Girod et al. 2018a). This population was assigned to the G1 lineage based on its COI sequence (Nomano et al. 2017; Seehausen et al. 2020). The colony is maintained in the quarantine laboratory at CABI in Delémont, Switzerland (Girod et al. 2018a). An Italian colony of the parasitoids from Tokyo was started in 2020 from 150 wasps from the CABI colony, and the BIIRU colony was established from about 500 wasps from Italy in 2021. A colony of D. suzukii was started with field collections of infested cherries during 2010 in Davis, California. Some of the material from British Columbia was identified as G3 in the present study. In the rest of this paper, we will refer to the material from these six populations as G1-BC, G1-Tokyo, G1-Yunnan, G3-BC, G3-Nagano, and G3-Yunnan.
\nThe parasitoids were reared and crosses made in plant growth chambers (23 ± 1°C, 146: 10D, 40–60% RH) at the containment facility at BIIRU. Colonies of D. suzukii and the two COI lineages were maintained using the methods decribed by Rossi-Stacconi et al. (2022). Briefly, D. suzukii was maintained on artificial diet in 250 ml flasks. The parasitoid populations were maintained on blueberries infested by D. suzukii. Fruits were exposed to D. suzukii for 1-2 days for oviposition in screen cage (30 x 30 x 30 cm). The parasitoids were reared in clear plastic containers (9.2 x 11.7 x 7.6 cm) by exposing 5–10 female wasps to 10–20 infested blueberries for 4–5 days, with droplets of honey streaked on the container’s screen as food source. Following the exposure, infested fruits were removed from the cage and kept in new plastic containers with filter paper at the bottom to absorb leaking fruit juice. Newly emerged wasps were collected in plastic vials (95 × 25 mm) and honey provided.
\nWe did crosses to test reproductive compatibility between G3-Yunnan and G1-Tokyo. For these crosses, parasitized D. suzukii puparia from the parasitoid colonies were isolated in plastic vials (95 × 25 mm). A piece of moisturized tissue paper was placed in each vial to provide humidity. When individuals emerged, they were supplied with a streak of honey on the bottom of the vial plug and paired within 48-72h with an individual of either the same or different population with the same emergence date. We made four crosses, two within populations and two between populations: G1♀ × G1♂, G3♀ × G3♂, G1♀ × G3♂, and G3♀ × G1♂. To control for thelytoky, that is females developing from unfertilized eggs (e.g., from Wolbachia infection), virgin females were also tested for each parasitoid population. For all crosses and controls, each female was provided with two infested blueberries containing approximately 10 first and second instar D. suzukii larvae, based on counts of initial host eggs laid in berries. After three days, females were removed and placed in 95% ethanol. Exposed host larvae were kept for 6 weeks during which adult flies should emerge (about two weeks) or parasitoids should emerge (about 30 days). All emerged insects were counted, sexed, and stored. The remaining (assumed dead) host puparia were reconstituted in water for 1 day and then dissected under a microscope to determine the presence or absence of parasitoids. The number of parasitoid offspring produced and the percent parasitism were estimated from the flies and wasps that emerged as adults, as well as the dissected hosts with versus without parasitoids, and the sex ratio was estimated from the sexes of adult wasps. We did 20 replicates for each cross, except 10 for G3 ♀ × G3 ♂, and five replicates for the unmated female controls.
\nThe SHIME® (Simulator of the Human Intestinal Microbial Ecology) was used for in vitro cultivation of the human gut microbiota (3 donors) with additions of either soluble or insoluble fractions from rice bran or no addition controls (n=3 treatments.) Data collected include 16S rRNA gene amplicon sequencing and short chain fatty acid (SCFA) concentrations. Raw sequencing data can be found in the NCBI Sequence Read Archive associated with BioProject PRJNA1032541. Data here include sample metadata and SCFA concentrations.
", "title": "Data from: Supplementation with soluble or insoluble rice-bran fibers increases short-chain fatty acid producing bacteria in the gut microbiota in vitro", "distribution": [ { "@type": "dcat:Distribution", "downloadURL": "https://ndownloader.figshare.com/files/46436977", "format": "csv", "mediaType": "application/csv", "title": "Sample_metadata.csv" }, { "@type": "dcat:Distribution", "downloadURL": "https://ndownloader.figshare.com/files/46436980", "format": "csv", "mediaType": "text/plain", "title": "SCFA_processed.csv" } ], "license": "https://creativecommons.org/licenses/by/4.0/", "bureauCode": [ "005:18" ], "modified": "2024-06-04", "publisher": { "@type": "org:Organization", "name": "Agricultural Research Service" }, "keyword": [ "16S rRNA sequencing data", "NP306", "ARS", "Rice bran", "fiber", "gut microbiome", "SHIME", "in vitro fermentation" ] }, { "identifier": "10.15482/USDA.ADC/1347137", "accessLevel": "public", "contactPoint": { "hasEmail": "mailto:Clarice.Coyne@usda.gov", "fn": "Coyne, Clarice" }, "programCode": [ "005:040" ], "description": "Included in this dataset are SNP and fasta data for the Pea Single Plant Plus Collection (PSPPC) and the PSPPC augmented with 25 P. fulvum accessions.
\nThese 6 datasets can be roughly divided into two groups. Group 1 consists of three datasets labeled PSPPC which refer to SNP data pertaining to the USDA Pea Single Plant Plus Collection. Group 2 consists of three datasets labeled PSPPC + P. fulvum which refer to SNP data pertaining to the USDA PSPPC with 25 accessions of Pisum fulvum added. SNPs for each of these groups were called independently; therefore SNP names that are shared between the PSPPC and PSPPC + P. fulvum groups should NOT be assumed to refer to the same locus.
\nFor analysis, SNP data is available in two widely used formats: hapmap and vcf. These formats can be successfully loaded into TASSEL v. 5.2.25 (http://www.maizegenetics.net/tassel). Explanations of fields (columns) in the VCF files are contained within commented (##) rows at the top of the file.
\nDescriptions of the first 11 columns in the hapmap file are as follows:
\nThe fasta sequences containing the SNPs are also available for such downstream applications as development of primers for platform-specific markers.
\nFor more information about this dataset, contact Clarice Coyne at Clarice.Coyne@usda.gov or coynec@wsu.edu.
Resource Title: PSPPC SNPs in hapmap format.
File Name: PSPPC.hmp.txt
Resource Description: 66591 unanchored SNPs for the PSPPC collection in hapmap format
Resource Software Recommended: TASSEL,url: http://www.maizegenetics.net/tassel
Resource Title: PSPPC SNP FASTA Sequences.
File Name: PSPPC.fa.txt
Resource Description: FASTA sequences for each allele of the PSPPC SNP dataset
Resource Title: PPSPPC + P. fulvum SNPs in hapmap format.
File Name: PSPPC+fulvums.hmp.txt
Resource Description: 67400 SNPs from the PSPPC augmented with 25 P. fulvum accessions in hapmap format. SNP names are independent and unrelated to plain PSPPC SNP files.
Resource Software Recommended: TASSEL,url: http://www.maizegenetics.net/tassel
Resource Title: PSPPC + P. fulvum SNP FASTA Sequences.
File Name: PSPPC+fulvums.fa.txt
Resource Description: FASTA sequences for each allele of the PSPPC + P. fulvum SNP dataset. SNP names are independent and unrelated to plain PSPPC SNP files.
Resource Title: PSPPC + P. fulvum SNPs in vcf format.
File Name: PSPPC+fulvums.vcf.txt
Resource Description: 67400 SNPs from the PSPPC augmented with 25 P. fulvum accessions in vcf format. SNP names are independent and unrelated to plain PSPPC SNP files.
Resource Software Recommended: TASSEL,url: http://www.maizegenetics.net/tassel
Resource Title: PSPPC SNPs in vcf format.
File Name: PSPPC.vcf.txt
Resource Description: 66591 SNPs from the PSPPC in vcf format
Resource Software Recommended: TASSEL,url: http://www.maizegenetics.net/tassel
Resource Title: README.
File Name: Data Dictionary.docx
Resource Description: These data are for the Pea Single Plant Plus Collection (PSPPC) and the PSPPC augmented with 25 P. fulvum accessions.
\nThe 6 datasets can be divided into two groups. Group 1 consists of 3 datasets labeled “PSPPC” which refer to SNP data pertaining to the USDA Pea Single Plant Plus Collection. Group 2 consists of 3 datasets labeled “PSPPC + P. fulvum” which refer to SNP data pertaining to the PSPPC with 25 accessions of Pisum fulvum added. SNPs for each of these groups were called independently; therefore any SNP name that is shared between the PSPPC and PSPPC + P. fulvum groups should NOT be assumed to refer to the same locus.
\nFor analysis, SNP data is available in two widely used formats: hapmap and vcf. These files were successfully loaded into the standalone version of TASSEL v. 5.2.25 (http://www.maizegenetics.net/tassel).
\nExplanations of fields (columns) in the VCF files are contained within commented (##) rows at the top of the file.
\nThe first 11 columns required for the hapmap format are as follows:\nrs#- Name of locus (i.e. SNP name)\nalleles- Indicates the SNPs for each allele at the locus\nchrom- N/A, since markers are unordered.\npos- N/A, since markers are unordered.\nstrand- N/A, since markers are unordered\nassembly#- N/A\ncenter- N/A\nprotLSID- N/A\nassayLSID- N/A\npanel- N/A\nQCcode- N/A
\nThe fasta sequences containing the SNPs are also available here for such downstream applications as development of primers for platform-specific markers.\n
The filtered VCF file of 10501 SNPs from the 432 individuals in this study. This dataset was used for genome-wide association study (GWAS) and genomic prediction of sugarcane ratooning ability. It was developed using Rapid Genomics Capture-Seq technology.
\nResources in this dataset:
\nA high-quality reference genome is an essential tool for applied and basic research on arthropods. Long-read sequencing technologies may be used to generate more complete and contiguous genome assemblies than alternate technologies, however, long-read methods have historically had greater input DNA requirements and higher costs than next generation sequencing, which are barriers to their use on many samples. Here, we present a 2.3 Gb de novo genome assembly of a field-collected adult female Spotted Lanternfly (Lycorma delicatula) using a single PacBio SMRT Cell. The Spotted Lanternfly is an invasive species recently discovered in the northeastern United States, threatening to damage economically important crop plants in the region. The DNA from one individual female specimen collected in Reading, Berks County, Pennsylvania was used to make one standard, size-selected library with an average DNA fragment size of ~20 kb. The library was run on one Sequel II SMRT Cell 8M, generating a total of 132 Gb of long-read sequences, of which 82 Gb were from unique library molecules, representing approximately 38x coverage of the genome. The assembly had high contiguity (contig N50 length = 1.5 Mb), completeness, and sequence level accuracy as estimated by conserved gene set analysis (96.8% of conserved genes both complete and without frame shift errors). Further, it was possible to segregate more than half of the diploid genome into the two separate haplotypes. The assembly also recovered two microbial symbiont genomes known to be associated with L. delicatula, each microbial genome being assembled into a single contig. We demonstrate that field-collected arthropods can be used for the rapid generation of high-quality genome assemblies, an attractive approach for projects on emerging invasive species, disease vectors, or conservation efforts of endangered species.
\nSupporting files for the manuscript \"A High-Quality Genome Assembly from a Single, Field-collected Spotted Lanternfly (Lycorma delicatula) using the PacBio Sequel II System\", include several intermediate versions of the assembly (raw output from Falcon, raw output from Falcon unzip, etc.) as well as the final assembly primary contigs and haplotigs (for the regions of the genome that were phased).
Resource Title: Final Assembly file .
File Name: FinalAssembly.zip
Resource Description: Primary and haplotigs contigs in fasta format. File slf.8M.final.primary.fasta are the primary contigs, and slf.8M.final.haplotigs.fasta are the haplotigs
Resource Title: Falcon Raw assembly, polished with arrow.
File Name: FalconAssembly.zip
Resource Description: Raw Primary contig assembly prior to falcon unzip. Contigs were polished with all subreads with arrow polishing tool.
Resource Title: Fasta file of contig assemblies of the two symbiont genomes.
File Name: Symbiont.zip
Resource Description: Contains contig fasta files for Sulcia (Sulciamuelleri.fa) and Vidania (vidania.fa) symbiont genomes recovered from the de novo assembly
Resource Title: Haplotig placement file in PAF format.
File Name: slf.haplotigPlacement.paf.zip
Resource Description: Final assembly placement file , describing the placement of haplotigs on the primary contig assembly
Resource Title: Falcon Unzip assembly Polished with arrow .
File Name: FalconUnzipAssembly.zip
Resource Description: Falcon unzip assembly both the primary and haplotigs, unfiltered
To provide a foundation for identification of genomic loci for insecticide resistance and for discovery of new control technology, we report the sequencing, assembly, and annotation of the horn fly genome.
Resource Title: A Whole Genome Assembly of the Horn Fly, Haematobia irritans, and Prediction of Genes with Roles in Metabolism and Sex Determination.
File Name: Web Page, url: https://doi.org/10.1534/g3.118.200154
Listed data resources also linked in this record's related content.
In support of nutrition research, concentrations of compounds from different parts of the watermelon plant are provided. The parts of the plant for which data are tabulated include (red) flesh, heart tissue, juice, seed, rind, peel, yellow flesh, seedling, leaf, root, other parts of the plant, and detected but plant part undeclared. The collected data include the low value in the range, the high value in the range, deviation from those values, and units (assumed to be fresh or wet weight unless noted). This table also provides for all compounds the citations to the literature and database sources. The “AFC” identifier represents the Agricultural Research Service (ARS) Food Compound; PubChem refers to the identifier from this resource of chemical compounds.
\nResource Title: Catalog of natural products occurring in watermelon.
File Name: Watermelon_NP_catalog_20210623.tsv
Resource Description: This is a table of chemical compounds found in watermelon
Resource Title: Data dictionary.
File Name: Data_dictionary_Watermelon_compounds_NAL_20210623.xlsx
Resource Description: This is the data dictionary
Resource Software Recommended: Microsoft Excel,url: https://products.office.com/en-us/access
Contemporary data (2017/2018): An open area on the north side of the ESGR (GPS coordinates: 42.461808, -84.011128) was the primary site for this study as it corresponds to the location of “Evans’ Old Field”, one of the areas historically sampled for bees. The field was described by Evans as a 7.7 ha abandoned field with a mid-successional community of plants surrounded by oak-hickory woods. It is now 1.3 ha of semi-open habitat with significant encroachment of the surrounding oak-hickory woods and invasive autumn olive (Elaeagnus umbellata Thunb.). The site was visited every other week during the summers of 2017 and 2018 to sample bees. In 2017, the first sampling day was June 1 and the final sampling day was September 25. In 2018, the first sampling day was May 8 and the final day was October 3. We expanded sampling in 2018 to include a wider diversity of bees with narrower phenological periods.
During each visit we sampled bees using three methods. First, we walked to the center of the open field and randomly selected a direction to start the first 25 meter transect. Three other 25 m transects were then established based on the first one, each at a 90-degree angle from the neighboring transect for a total of 100m sampled, with each transect segment moving away from a central location. Each transect was walked for 10 minutes each, a total of 40 minutes of sampling. We used aerial insect nets to collect bees found within 1.5m of the transect, and time was stopped for specimen processing. The host plant was recorded for all specimens captured from flowers. Flowering plants were identified to the lowest taxonomic level in the field using Newcomb’s guide and the PlantNet app, usually to species. Second, we spent 20 minutes collecting bees from plants of any species in the general vicinity of the open field. Third, to most closely match the methods used by Evans (see below), we spent 30 minutes sampling bees at each of the primary blooming plant species located in the field. Total time spent conducting this final sampling method varied based on the number of primary blooming plants at each visit, with a minimum of 30-minutes if there was only one primary plant. This sampling method was always done last, and included any plants that we collected more than one bee from that day. All bees were identified to species (or lowest possible taxonomic level) using relevant keys. All specimens collected in 2017 and 2018 are currently held in the Isaacs Lab at Michigan State University (as of 2024), and will eventually be deposited at the A.J. Cook Arthropod Collection at Michigan State University for long-term inclusion in that collection.
Historical data (1921-1999): The University of Michigan Museum of Zoology Insect Collection (UMMZI), Ann Arbor, MI, holds over 4,000 bee specimens from the historical collections at the ESGR, and specimens were databased as part of this study. Historical data were checked for entry errors and outdated taxonomies. Specimens with questionable species determinations were re-examined and re-identified using relevant keys (see above) where possible. Bees that could not be confidently identified to the species level were excluded from the dataset, and entries that were missing the date of collection were also removed. Excluded entries accounted for less than 1% of the specimens. There were notable gaps in records at the ESGR, as there were no focused survey efforts since Evans’ last efforts in 1989, and only occasional specimen records from 1990-1999. There were no surveys and no records for the ESGR after 1999 and prior to this study in 2017/2018. All specimens from the ESGR were included in this dataset, not only those specifically collected at the Evans’ Old Field.
In addition to the 4,000 plus records from the ESGR since 1921, we also include Evans’ dataset from his 1972 and 1973 collection effort. Evans’ original dataset from 1972/1973 was available through UM records. The dataset is unique compared to the records from the museum, because Evans did not always collect observed bees if he was confident in their identification (especially Bombus spp. and oligolectic species, e.g., Andrena rudbeckiae Robertson, 1891 and Dufourea monardae (Viereck, 1924)), and these records come only from the site now called Evans’ Old Field, whereas the exact sampling locations within the ESGR of many other specimens in the collection are not known. Therefore, his original dataset provides a more complete representation of the community he encountered at the Evans’ Old Field location.
Evans describes his sampling as: “records of the dates and duration of flowering were made at frequent intervals (2-3 days every week) throughout the flowering season…Observation of visitation by bees was usually made between 9:00 am and 4:00 pm and on any given day was limited to a maximum of 30-40 minutes per flower species…no orderly system of monitoring was developed. More attention was given to abundant resources when they were being heavily visited than was paid to them near the beginning or end of their flower periods or to less frequently encountered species\".
Please open the README file first, which has descriptions of each included data file.
", "title": "Data from: A century of wild bee sampling: historical data and neural network analysis reveal ecological traits associated with species loss.", "distribution": [ { "@type": "dcat:Distribution", "downloadURL": "https://ndownloader.figshare.com/files/46541410", "format": "txt", "mediaType": "text/plain", "title": "README for Grahametal2024_DataFiles.txt" }, { "@type": "dcat:Distribution", "downloadURL": "https://ndownloader.figshare.com/files/46398328", "format": "xlsx", "mediaType": "application/vnd.openxmlformats-officedocument.spreadsheetml.sheet", "title": "Grahametal2024_BeeTraits.xlsx" }, { "@type": "dcat:Distribution", "downloadURL": "https://ndownloader.figshare.com/files/46398493", "format": "xlsx", "mediaType": "application/vnd.openxmlformats-officedocument.spreadsheetml.sheet", "title": "Grahametal2024_EvansIsaacs_ESGR_Apisremoved_Undetremoved_MayOct.xlsx" }, { "@type": "dcat:Distribution", "downloadURL": "https://ndownloader.figshare.com/files/46398496", "format": "xlsx", "mediaType": "application/vnd.openxmlformats-officedocument.spreadsheetml.sheet", "title": "Grahametal2024_ESGRbees_UndetRemoved_ApisRemoved_RepeatsRemoved.xlsx" }, { "@type": "dcat:Distribution", "downloadURL": "https://ndownloader.figshare.com/files/46447291", "format": "xlsx", "mediaType": "application/vnd.openxmlformats-officedocument.spreadsheetml.sheet", "title": "Grahametal2024_EvansIsaacsPlantData.xlsx" }, { "@type": "dcat:Distribution", "downloadURL": "https://ndownloader.figshare.com/files/46447303", "format": "csv", "mediaType": "text/plain", "title": "Grahametal2024_ESGRbees_AllBees_NoApis.csv" }, { "@type": "dcat:Distribution", "downloadURL": "https://ndownloader.figshare.com/files/46540765", "format": "csv", "mediaType": "application/csv", "title": "Grahametal2024_RawGBIFdata_final.csv" } ], "license": "https://www.usa.gov/publicdomain/label/1.0/", "bureauCode": [ "005:18" ], "modified": "2024-05-28", "publisher": { "@type": "org:Organization", "name": "Agricultural Research Service" }, "keyword": [ "bees", "native bees", "wild bees" ], "spatial": "{\"type\": \"Polygon\", \"coordinates\": [[[-84.031505584717, 42.463359622468], [-84.024639129639, 42.46715859263], [-84.004383087158, 42.467411849111], [-83.996486663818, 42.460320280355], [-83.996486663818, 42.448921433425], [-84.011936187744, 42.446134733059], [-84.024982452393, 42.445881390515], [-84.031505584717, 42.463359622468]]]}" }, { "identifier": "10.15482/USDA.ADC/1528392", "accessLevel": "public", "contactPoint": { "hasEmail": "mailto:karl.roeder@usda.gov", "fn": "Roeder, Karl" }, "programCode": [ "005:040" ], "description": "Data files for manuscript titled \"A checklist of South Dakota bumble bees (Hymenoptera: Apidae) \", https://doi.org/10.3897/jhr.94.94584.
\nExcel file with 4 tabs: Metadata, county maps, species data, and species matrix. Metadata is contained within Excel file that describes all variables for each tab.
\nAbstract from paper:\nSeveral bumble bee species (Bombus Latreille) are declining and efforts to conserve populations will be strengthened by an improved knowledge of their geographic distribution. Knowledge gaps exist, however, especially in central portions of North America. Here we report 29 species of bumble bees from South Dakota in the north-central USA, based on 130 years of records from 1891 to 2021. Specimens or observations were available for >90% of the 66 counties, though they were not distributed evenly as most records came from Pennington, Lawrence, Custer, Brookings, and Day Counties. The five most commonly collected or reported bumble bee species were B. griseocollis (54 counties), B. pensylvanicus (41 counties), B. fervidus (39 counties), B. huntii (27 counties), and B. bimaculatus (25 counties). Twenty species were recorded from 10 or fewer counties. Despite differences in occurrence, 66% of the Bombus species in South Dakota were collected or observed since 2020, including six of the nine species of conservation concern (B. fraternus, B. pensylvanicus, B. fervidus, B. occidentalis, B. terricola, and B. morrisoni). However, the critically endangered B. affinis, B. variabilis, and B. suckleyi have not been collected or observed for over 50 years. While this checklist is the first for South Dakota bumble bees in nearly 100 years, data are still lacking as ~55% of counties had fewer than five species reported. We suggest future efforts should focus on these under-sampled areas to fill in baseline knowledge of the wild bee fauna towards completing a more holistic view of bumble bee distributions across the Great Plains.
Resource Title: Data from: A checklist of South Dakota bumble bees (Hymenoptera: Apidae).
File Name: South Dakota Bumble Bees - Final Data File.xlsx
Resource Description: Excel file with 4 tabs: Metadata, county maps, species data, and species matrix.
\nAutomated in situ soil sensor network - the data set includes hourly and daily measurements of volumetric water content, soil temperature, and bulk electrical conductivity, collected at 42 monitoring locations and 5 depths (30, 60, 90, 120, and 150 cm) across Cook Agronomy Farm. Data collection was initiated in April 2007 and is ongoing.
\nCAF_sensors: folder with Daily and Hourly subfolders, each containing 42 '.txt' files of water content and temperature sensor readings.\nEach file represents readings from a single location, indicated in the file name (i.e. CAF003.txt) and in the 'Location' field of the table.\nReadings are organized by 'Date' (4/20/2007 - 6/16/2016), ‘Time’ (24 hr clock, only in hourly files), and with property (VW or T) and sensor 'Depth' as follows:
\nVolumetric water content readings are calibrated according to:\nGasch, CK, DJ Brown, ES Brooks, M Yourek, M Poggio, DR Cobos, CS Campbell. 2017. A pragmatic, automated approach for retroactive calibration\nof soil moisture sensors using a two-step, soil specific correction. Computers and Electronics in Agriculture, 137: 29-40.\nTemperature readings are factory calibrated.
\nCAF_BulkDensity.txt: file containing bulk density values ('BulkDensity' in g/cm^3) for sensor depths at each of the 42 instrumented\nlocations at Cook Farm. Location is indicated in 'Location' field, and sample depths are defined (in cm) by the ’Depth’ field.
\nCAF_CropID.txt: file containing crop codes for each sub-field (A, B and C) and strip (1-6 for A and B, 1-8 for C) at Cook Farm for 2007-2016.\nThis is also part of the attribute table for 'CAF_strips.shp'
\nCAF_CropCodes.txt: file containing crop code names and crop identities, used in 'CAF_CropID.txt' and 'CAF_strips.shp'
\nCAF_ParticleSize.txt: file containing particle size fractions ('Sand', 'Silt', and 'Clay' as percent) for each 'Location' at sensor depths\n('Depth', in cm).
\nAll spatial data have spatial reference NAD83, UTM11N
\nCAF_sensors.shp: file containing locations of each of the 42 monitoring locations, the 'Location' field contains the location name,\nwhich coincides with locations in tabular files.
\nCAF_strips.shp: file containing areal extents of each sub-field, stip, and crop identities for 2007-2016. Crop identity codes are listed\nin 'CAF_CropCodes.txt'
\nCAF_DEM.tif: file containing a 10 x 10 m elevation (in m) grid for Cook Farm.
\nCAF_Spring_ECa.tif, CAF_Fall_ECa.tif: files containing 10 x 10 m apparent electrical conductivity (dS/m) grids to 1.5 m depth for spring\nand fall at Cook Farm.
\nCAF_Bt_30cm.tif, CAF_Bt_60cm.tif, CAF_Bt_90cm.tif, CAF_Bt_120cm.tif, CAF_Bt_150cm.tif: files containing 10 x 10 m predictive surfaces for\nprobability (0-1) of Bt horizon at the five sensor depths.
\nThe Flags folder consists of the files containing the quality control flags for the Cook Farm Sensor Dataset.
\nThe nomenclature for the files indicates flags for either temperature (T) or water content (VW) and sensor depths. For example:
\nFiles starting with “missing” contain flags (“M”) for locations and dates (mm/dd/yyyy) with missing data (NA in original dataset).
\nFiles starting with “range” contain flags for locations and dates (mm/dd/yyyy) with values outside acceptable ranges:
\nFiles starting with the name “flats” contain flags (“D”) for locations, dates (mm/dd/yyyy), and times (hh:mm) with constant values (within 1%) for a 24 hour period, as in Dorigo et al. 2013.
\nFiles starting with the name “spikes” contain flags (“D”) for locations, dates (mm/dd/yyy), and times (hh:mm) with sudden spikes in VWC readings.
\nFiles starting with the name “breaks” contain flags (“D”) for locations, dates (mm/dd/yyy), and times (hh:mm) with sudden breaks (jumps or drops) in VWC readings.
\nCode (implemented in R) for the screening and flagging is included in “Code Snippet.txt”
\nA list of the sensor versions as of 06/16/16 at each location and depth.
\nResource Title: Data package for automated in situ soil sensor network.
File Name: CAF_Sensor_Dataset.zip
Resource Description: Data file descriptions for Cook Farm sensor network data set (CAF_Sensor_Dataset). \n\nData set compiled by Caley Gasch, under supervision of David Brown, Department of Crop and Soil Sciences, Washington State University, \nPullman, WA.\nUpdated: 04/01/2017\n\nTabular data:\nCAF_sensors: folder with Daily and Hourly subfolders, each containing 42 '.txt' files of water content and temperature sensor readings. \nEach file represents readings from a single location, indicated in the file name (i.e. CAF003.txt) and in the 'Location' field of the table. \nReadings are organized by 'Date' (4/20/2007 - 6/16/2016), ‘Time’ (24 hr clock, only in hourly files), and with property (VW or T) and sensor \n'Depth' as follows:\nVW_30cm: volumetric water readings at 30 cm depth (m^3/m^3)\nVW_60cm: volumetric water readings at 60 cm depth (m^3/m^3)\nVW_90cm: volumetric water readings at 90 cm depth (m^3/m^3)\nVW_120cm: volumetric water readings at 120 cm depth (m^3/m^3)\nVW_150cm: volumetric water readings at 150 cm depth (m^3/m^3)\nT_30cm: temperature readings at 30 cm depth (C)\nT_60cm: temperature readings at 60 cm depth (C)\nT_90cm: temperature readings at 90 cm depth (C)\nT_120cm: temperature readings at 120 cm depth (C)\nT_150cm: temperature readings at 150 cm depth (C)\nVolumetric water content readings are calibrated according to:\nGasch, CK, DJ Brown, ES Brooks, M Yourek, M Poggio, DR Cobos, CS Campbell. 2017. A pragmatic, automated approach for retroactive calibration\nof soil moisture sensors using a two-step, soil specific correction. Computers and Electronics in Agriculture, 137: 29-40.\nTemperature readings are factory calibrated.\n\nCAF_BulkDensity.txt: file containing bulk density values ('BulkDensity' in g/cm^3) for sensor depths at each of the 42 instrumented \nlocations at Cook Farm. Location is indicated in 'Location' field, and sample depths are defined (in cm) by the ’Depth’ field.\n\nCAF_CropID.txt: file containing crop codes for each sub-field (A, B and C) and strip (1-6 for A and B, 1-8 for C) at Cook Farm for 2007-2016.\nThis is also part of the attribute table for 'CAF_strips.shp'\n\nCAF_CropCodes.txt: file containing crop code names and crop identities, used in 'CAF_CropID.txt' and 'CAF_strips.shp'\n\nCAF_ParticleSize.txt: file containing particle size fractions ('Sand', 'Silt', and 'Clay' as percent) for each 'Location' at sensor depths \n('Depth', in cm).\n\nSpatial data: all spatial data have spatial reference NAD83, UTM11N\nCAF_sensors.shp: file containing locations of each of the 42 monitoring locations, the 'Location' field contains the location name, \nwhich coincides with locations in tabular files.\n\nCAF_strips.shp: file containing areal extents of each sub-field, stip, and crop identities for 2007-2016. Crop identity codes are listed\nin 'CAF_CropCodes.txt'\n\nCAF_DEM.tif: file containing a 10 x 10 m elevation (in m) grid for Cook Farm.\n\nCAF_Spring_ECa.tif, CAF_Fall_ECa.tif: files containing 10 x 10 m apparent electrical conductivity (dS/m) grids to 1.5 m depth for spring \nand fall at Cook Farm.\n\nCAF_Bt_30cm.tif, CAF_Bt_60cm.tif, CAF_Bt_90cm.tif, CAF_Bt_120cm.tif, CAF_Bt_150cm.tif: files containing 10 x 10 m predictive surfaces for \nprobability (0-1) of Bt horizon at the five sensor depths.\n\n(Dataset updated on 10/23/2017 to include QC information.)
Sorghum supplies the daily calorie needs of millions of inhabitants in Senegal, West Africa. However, Exserohilum turcicum, causal agent of leaf blight significantly reduces the crop's productivity and profitability. Data based on a total of 120 sorghum lines (60 lines each from Niger and Senegal) planted in replicated plots in three locations in Senegal, West Africa. The leaf blight incidence and severity were collected by Louis K Prom, Mame Penda Sarr, Cyril Diatta, Coumba Fall, and Clint Magill. Disease incidence was based on the number of plants infected with leaf blight in a row divided by the total number of plants in the same row multiplied by 100. The severity scale 0 to 11 with mid-points, where 1=5.5, 2=15.5, 3=25.5, 4=35.5, 5=45.5, 6=55.5, 7=65.5, 8=75.5, 9=85.5, 10=95.5, and 11=100 previously described by Prom et al. 2023 was used. the dataset was used to perform genome-wide association studies to identify single-nucleotide polymorphisms associated with leaf blight incidence.
", "title": "Data from: A genome-wide association study of Nigerien and Senegalese sorghum germplasm of Exserohilum turcicum, the causal agent of leaf blight", "distribution": [ { "@type": "dcat:Distribution", "downloadURL": "https://ndownloader.figshare.com/files/46382200", "format": "csv", "mediaType": "application/csv", "title": "Prom_GWAS_Leaf_Blight_2022.csv" } ], "license": "https://www.usa.gov/publicdomain/label/1.0/", "bureauCode": [ "005:18" ], "modified": "2024-05-28", "publisher": { "@type": "org:Organization", "name": "Agricultural Research Service" }, "keyword": [ "Sorghum", "Exserohilum turcicum", "Leaf blight", "Disease incidence", "Disease severity", "Fungi", "GWAS" ], "spatial": "{\"type\": \"Point\", \"coordinates\": [-14.452362, 14.497401]}" }, { "identifier": "10.15482/USDA.ADC/1523121", "accessLevel": "public", "contactPoint": { "hasEmail": "mailto:Tori.Kaster@usda.gov", "fn": "Kaster, Tori" }, "programCode": [ "005:040" ], "description": "Includes accelerometer data using an ActiGraph to assess usual sedentary, moderate, vigorous, and very vigorous activity at baseline, 6 weeks, and 10 weeks. Includes relative reinforcing value (RRV) data showing how participants rated how much they would want to perform both physical and sedentary activities on a scale of 1-10 at baseline, week 6, and week 10. Includes data on the breakpoint, or Pmax of the RRV, which was the last schedule of reinforcement (i.e. 4, 8, 16, …) completed for the behavior (exercise or sedentary). For both Pmax and RRV score, greater scores indicated a greater reinforcing value, with scores exceeding 1.0 indicating increased exercise reinforcement. Includes questionnaire data regarding preference and tolerance for exercise intensity using the Preference for and Tolerance of Intensity of Exercise Questionnaire (PRETIEQ) and positive and negative outcome expectancy of exercise using the outcome expectancy scale (OES). Includes data on height, weight, and BMI. Includes demographic data such as gender and race/ethnicity.
Resource Title: Actigraph activity data.
File Name: AGData.csv
Resource Description: Includes data from Actigraph accelerometer for each participant at baseline, 6 weeks, and 10 weeks.
Resource Title: RRV Data.
File Name: RRVData.csv
Resource Description: Includes data from RRV at baseline, 6 weeks, and 10 weeks, OES survey data, PRETIE-Q survey data, and demographic data (gender, weight, height, race, ethnicity, and age).
This data set contains images of potato tubers from clones in the A08241 F1 breeding population grown in Aberdeen, Idaho during the 2019 field season. Each clone was grown as 8-hill plots and replicated twice. Five tubers per sample were imaged. Each face of the tuber was imaged on two different backgrounds. The five tubers were also halved lengthwise and one of side was imaged using a flatbed scanner.
\nResources in this dataset:
\nResource Title: A08241_scanner_images\nFile Name: tubers.zip\nResource description: These are images of halved potato tubers collected from clones in the A08241 breeding population using a Hewlett Packard HP ColorJet 6200C flatbed scanner. No color correction was performed on these images.
\nResource Title: A08241_lightbox_images\nFile Name: box.zip\nResource description: These are images of potato tubers from the A08241 breeding population captured on a lightbox background using a Nikon D7100 camera. No color correction was performed on these images.
\nResource Title: A08241_black_background_images\nFile Name: std.zip\nResource description: These are images of potato tubers from the A08241 breeding population captured on a black background using a Nikon D7100 camera. No color correction was performed on these images.
\nResource Title: A08241_lightbox_color_corrected_images\nFile Name: lightbox_color_corrected.zip\nResource description: These are images of potato tubers from the A08241 breeding population captured on a lightbox background using a Nikon D7100 camera. Color correction was performed in MATLAB by Nathan Miller.
\nResource Title: A08241_black_background_color_corrected_images\nFile Name: blackbackground_color_corrected.zip\nResource description: These are images of potato tubers from the A08241 breeding population captured on a non-reflective black background using a Nikon D7100 camera. Color correction was performed in MATLAB by Nathan Miller.
\nRaster data providing site suitability results for the production of castor throughout Brazil. The pixel value range from 1 (currently not suitable) to 10 (highly suitable) for a suitability ranking in the given pixel location. The site suitability for castor was conducted using data associated with agronomic and disease characteristics. The various characteristics were subject to a weighted overlay analysis in conjunction with an analytical hierarchy process. The raster was the result of these analytics.
", "title": "Data from: A site suitability analysis for castor (Ricinus communis L.) production during Brazil's second harvest accounting for potential disease", "distribution": [ { "@type": "dcat:Distribution", "downloadURL": "https://ndownloader.figshare.com/files/44540579", "format": "zip", "mediaType": "application/zip", "title": "Site_Suitability_V2.zip" }, { "accessURL": "https://geodata.nal.usda.gov/geonetwork/srv/api/records/d0e9a6e7-9e28-497c-a944-cb1ee892c542/formatters/xml", "@type": "dcat:Distribution", "format": "xml", "mediaType": "text/xml", "conformsTo": "http://www.isotc211.org/2005/gmd", "title": "Geodata ISO 19139 metadata" } ], "license": "https://www.usa.gov/publicdomain/label/1.0/", "bureauCode": [ "005:18" ], "modified": "2024-02-20", "publisher": { "@type": "org:Organization", "name": "Agricultural Research Service" }, "theme": [ "geospatial" ], "keyword": [ "site suitability", "gray mold", "oil seed crop", "brazil", "castor", "raster data", "NP215", "NP211", "NP216", "theme:geospatial", "data.gov", "ARS" ], "spatial": "{\"type\": \"Polygon\", \"coordinates\": [[[-69.60934817791, -38.25545322619], [-69.60934817791, 4.9377242743025], [-26.484362483025, 4.9377242743025], [-26.484362483025, -38.25545322619], [-69.60934817791, -38.25545322619]]]}" }, { "identifier": "10.15482/USDA.ADC/1522297", "accessLevel": "public", "contactPoint": { "hasEmail": "mailto:william.morrison@usda.gov", "fn": "Morrison, Rob" }, "programCode": [ "005:040" ], "description": "A systematic search of the literature using Google Scholar, (https://scholar.google.com/) and Web of Science was used to identify studies that examined the effects of individual compounds or mixtures of MVOCs on the behavioral responses of stored-product arthropods. Stored-product arthropods were defined as those insects and arachnids attacking stored, durable commodities in the post-harvest supply chain at any of the successive links, including storage, transportation, processing, and marketing. Where applicable, we parsed studies into component experiments where behavioral responses or other factors such as type of assays or measured variables may have differed (e.g. dosage, compound, etc.). We classified each test as resulting in statistically significant attraction (+), repellence (−), or neither (○) compared to a negative or positive control. We excluded any studies lacking appropriate negative or positive controls, lacking replication, or lacking sufficient details on the identity of tested substrates to enable appropriate interpretation. Terms used to search databases included the following singly and/or in combination: “fungal”, “volatiles”, “stored products”, “insect behavior”, “insect-microbe”, “interactions”, “semiochemicals”, “mycotoxin”, “behavioral response”, “attraction”, and “postharvest”, and combinations thereof. In addition, we kept track of methodology used for tests, response variables, target insect, insect stage, and microbial taxon. We split our analysis up between tests with complex (but usually uncharacterized) blends of MVOCs, and those with known individual or known component mixtures of MVOCs.
Resource Title: Stored product arthropod behavioral response to complex microbial cues.
File Name: ponce_response_to_complex_mvocs.csv
Resource Description: A systematic search of the literature using Google Scholar, (https://scholar.google.com/) and Web of Science was used to identify studies that examined the effects of complex mixtures of MVOCs on the behavioral responses of stored-product arthropods. Stored-product arthropods were defined as those insects and arachnids attacking stored, durable commodities in the post-harvest supply chain at any of the successive links, including storage, transportation, pro-cessing, and marketing. Where applicable, we parsed studies into component experiments where behavioral responses or other factors such as type of assays or measured variables may have differed (e.g. dosage, compound, etc.). We classified each test as resulting in statistically significant attraction (+), repellence (−), or neither (○) compared to a negative or positive control. We excluded any studies lacking appropriate negative or positive controls, lacking replication, or lacking sufficient details on the identity of tested substrates to enable appropriate interpretation. Terms used to search databases included the following singly and/or in combination: “fungal”, “volatiles”, “stored products”, “insect behavior”, “insect-microbe”, “interactions”, “semiochemicals”, “mycotoxin”, “behavioral response”, “attraction”, and “postharvest”, and combinations thereof. In addition, we kept track of methodology used for tests, response variables, target insect, insect stage, and microbial taxon. This dataset comprises results for response to complex (but usually uncharacterized) blends of MVOCs by stored product arthropods.
Resource Software Recommended: Microsoft Excel,url: https://www.microsoft.com/en-us/microsoft-365/excel
Resource Title: Stored product arthropod behavioral response to individual microbial cues.
File Name: ponce_response_to_individual_mvocs.csv
Resource Description: A systematic search of the literature using Google Scholar, (https://scholar.google.com/) and Web of Science was used to identify studies that examined the effects of individual microbial components on the behavioral responses of stored-product arthropods. Stored-product arthropods were defined as those insects and arachnids attacking stored, durable commodities in the post-harvest supply chain at any of the successive links, including storage, transportation, pro-cessing, and marketing. Where applicable, we parsed studies into component experiments where behavioral responses or other factors such as type of assays or measured variables may have differed (e.g. dosage, compound, etc.). We classified each test as resulting in statistically significant attraction (+), repellence (−), or neither (○) compared to a negative or positive control. We excluded any studies lacking appropriate negative or positive controls, lacking replication, or lacking sufficient details on the identity of tested substrates to enable appropriate interpretation. Terms used to search databases included the following singly and/or in combination: “fungal”, “volatiles”, “stored products”, “insect behavior”, “insect-microbe”, “interactions”, “semiochemicals”, “mycotoxin”, “behavioral response”, “attraction”, and “postharvest”, and combinations thereof. In addition, we kept track of methodology used for tests, response variables, target insect, insect stage, and microbial taxon. This dataset comprises results for response to individual and known components of MVOCs by stored product arthropods.
Resource Software Recommended: Microsoft Excel,url: https://www.microsoft.com/en-us/microsoft-365/excel
This is digital research data corresponding to a manuscript, Above-ground plant properties are not leading indicators of grazing-induced soil carbon accrual in the Northern Great Plains, published in Ecological Indicators.
Little is known about how grazing-induced shifts in plant properties correspond with shifts in soil organic carbon (SOC) stocks. To help fill this gap, we used data from a field experiment to test whether above-ground plant properties (i.e. biomass, species richness) act as leading indicators of grazing-induced SOC accrual in the Northern Great Plains, USA.
Our 5-yr bovine grazing experiment had a randomized complete block design and pre-treatment data. Moderate summer grazing (control) is widely used in the Northern Great Plains, and treatments that may alter grassland vegetation and SOC included: severe summer grazing, moderate fall grazing, and severe fall grazing. The four grazing treatments were applied to 20 paddocks (60 × 30 m) arranged in a randomized complete block design with 5 replications. Grazing intensities approximated recommended (i.e. moderate; 1 animal unit month [AUM] × ha-1 × year-1) and severe (1.5 AUM × ha-1 × year-1) stocking rates. Summer grazing occurred during the third week of June and fall grazing was after killing frosts at the end of October.
This study's dataset is of a subset of data for this grazing experiment. Given the study aim's, the dataset included a single measure of SOC stock (0-60 cm depth increment) and three plant properties (current-year above-ground biomass, older dead above-ground biomass, and plant species richness). SOC data were for 2013 and 2018 while plant data were for 2014 and 2017. Additional details can be found in the readme file, open access manuscript, and manuscript's supplement.
", "title": "Data from: Above-ground plant properties are not leading indicators of grazing-induced soil carbon accrual in the Northern Great Plains", "distribution": [ { "@type": "dcat:Distribution", "downloadURL": "https://ndownloader.figshare.com/files/45538203", "format": "md", "mediaType": "text/plain", "title": "README.md" }, { "@type": "dcat:Distribution", "downloadURL": "https://ndownloader.figshare.com/files/45538209", "format": "csv", "mediaType": "application/csv", "title": "geospatial data.csv" }, { "@type": "dcat:Distribution", "downloadURL": "https://ndownloader.figshare.com/files/45538212", "format": "csv", "mediaType": "text/plain", "title": "SOC data.csv" }, { "@type": "dcat:Distribution", "downloadURL": "https://ndownloader.figshare.com/files/45538206", "format": "csv", "mediaType": "application/csv", "title": "plant data.csv" }, { "accessURL": "https://geodata.nal.usda.gov/geonetwork/srv/api/records/9d169f1e-529d-4edc-ba49-0454ffe4bd5c/formatters/xml", "@type": "dcat:Distribution", "format": "xml", "mediaType": "text/xml", "conformsTo": "http://www.isotc211.org/2005/gmd", "title": "Geodata ISO 19139 metadata" } ], "license": "https://creativecommons.org/licenses/by/4.0/", "bureauCode": [ "005:18" ], "modified": "2024-04-30", "publisher": { "@type": "org:Organization", "name": "Agricultural Research Service" }, "accrualPeriodicity": "irregular", "theme": [ "geospatial" ], "keyword": [ "carbon dioxide removal", "carbon ranching", "carbon sequestration", "soil carbon sequestration (SCS)", "climate change", "co-benefits", "livestock grazing", "natural climate solution", "Northern Great Plains", "grassland", "mixed-grass prairie", "grazing experiment", "soil carbon" ] }, { "identifier": "10.15482/USDA.ADC/1518735", "accessLevel": "public", "contactPoint": { "hasEmail": "mailto:amy.vincent@usda.gov", "fn": "Vincent, Amy" }, "programCode": [ "005:040" ], "description": "A controlled influenza A virus transmission experiment was conducted in biosafety level 2 containment from January 23, 2018- February 13, 2018 assessing the respiratory droplet transmission efficiency of A(H3N2)/swine/Ohio/A01354299/2017 from experimentally inoculated pigs to naïve, contact ferrets. This experimental setting models the human-swine interface at agricultural fairs, where human infection with influenza viruses of swine origin has been well documented. Five pigs were housed in a standard enclosure and four ferrets were housed in isolators placed 7.5cm from the pig enclosure. Nasal swab samples from pigs were collected on 0, 1, 3, and 5 days post infection and nasal wash samples from ferrets were collected 0, 2, 4, 6, 8, and 15 days post contact. The whole genome sequences of 15 swine and 12 ferret virus isolates were obtained from respiratory samples cultured on Madin-Darby Canine Kidney cells. Sequencing was performed on an Illumina MiSeq platform and consensus sequences for each gene segment were generated using in-house software at the USDA-APHIS National Veterinary Services Laboratory.
Resource Title: Swine and Ferret Consensus Sequences.
File Name: Consensus_Sequences.txt
Resource Description: WGS consensus sequences of influenza virus from \"Aerosol transmission from infected swine to ferrets of an H3N2 virus collected from an agricultural fair and associated with human variant infections\".
These files are 250bp Illumina MiSeq paired-end sequencing reads in fastq format. Libraries were prepared from DNA fragments amplified from tomato bulk (heterogenous) samples around the fruit weight locus.
", "title": "Data from: Agile Genetics: Single gene resolution without the fuss", "distribution": [ { "@type": "dcat:Distribution", "downloadURL": "https://ndownloader.figshare.com/files/44718094", "format": "gz", "mediaType": "application/x-gzip", "title": "HIGH_B07_R1_001.fastq.gz" }, { "@type": "dcat:Distribution", "downloadURL": "https://ndownloader.figshare.com/files/44718109", "format": "gz", "mediaType": "application/gzip", "title": "HIGH_B07_R2_001.fastq.gz" }, { "@type": "dcat:Distribution", "downloadURL": "https://ndownloader.figshare.com/files/44718112", "format": "gz", "mediaType": "application/x-gzip", "title": "LOW_A07_R1_001.fastq.gz" }, { "@type": "dcat:Distribution", "downloadURL": "https://ndownloader.figshare.com/files/44718115", "format": "gz", "mediaType": "application/gzip", "title": "LOW_A07_R2_001.fastq.gz" }, { "@type": "dcat:Distribution", "downloadURL": "https://ndownloader.figshare.com/files/44718130", "format": "gz", "mediaType": "application/gzip", "title": "HIGH_E07_R1_001.fastq.gz" }, { "@type": "dcat:Distribution", "downloadURL": "https://ndownloader.figshare.com/files/44718127", "format": "gz", "mediaType": "application/x-gzip", "title": "HIGH_E07_R2_001.fastq.gz" }, { "@type": "dcat:Distribution", "downloadURL": "https://ndownloader.figshare.com/files/44718133", "format": "gz", "mediaType": "application/x-gzip", "title": "LOW_D07_R1_001.fastq.gz" }, { "@type": "dcat:Distribution", "downloadURL": "https://ndownloader.figshare.com/files/44718136", "format": "gz", "mediaType": "application/gzip", "title": "LOW_D07_R2_001.fastq.gz" } ], "license": "https://creativecommons.org/licenses/by/4.0/", "bureauCode": [ "005:18" ], "modified": "2024-03-12", "publisher": { "@type": "org:Organization", "name": "Agricultural Research Service" }, "keyword": [ "Illumina sequencing reads", "ID-seq amplicons", "Tomato fruit weight gene" ] }, { "identifier": "10.15482/USDA.ADC/1524468", "accessLevel": "public", "contactPoint": { "hasEmail": "mailto:christopher.wallis@usda.gov", "fn": "Wallis, Christopher" }, "programCode": [ "005:040" ], "description": "Amino acid, sugar, phenolic, and terpenoid compound level data collected from different citrus species that were healthy or infected with different CTV strains, with CTV titer and symptoms provided. This data was analyzed in a peer-reviewed manuscript, and provided for transparency or to use to evaluate variables not discussed within the manuscript (e.g. individual CTV strain effects on chemistry versus group effects).
Resource Title: Healthy and CTV-Infection Effects on Amino Acid, Sugar, Phenolic, and Terpenoid Levels and Titer/Disease Data.
File Name: Citrus CTV Chemistry.xlsx
Resource Description: Data utilized in the associated manuscript, including titer/disease measurements, amino acid levels, sugar levels, phenolic levels, and terpenoid levels.
The average American’s diet does not align with the Dietary Guidelines for Americans (DGA) provided by the U.S. Department of Agriculture and the U.S. Department of Health and Human Services (2020). The present study aimed to compare fruit and vegetable consumption among those who had and had not heard of the DGA, identify characteristics of DGA users, and identify barriers to DGA use. A nationwide survey of 943 Americans revealed that those who had heard of the DGA ate more fruits and vegetables than those who had not. Men, African Americans, and those who have more education had greater odds of using the DGA as a guide when preparing meals relative to their respective counterparts. Disinterest, effort, and time were among the most cited reasons for not using the DGA. Future research should examine how to increase DGA adherence among those unaware of or who do not use the DGA.
\nComparative analyses of fruit and vegetable consumption among those who were aware/unaware and use/do not use the DGA were completed using independent samples t tests. Fruit and vegetable consumption variables were log-transformed for analysis. Binary logistic regression was used to examine whether demographic features (race, gender, and age) predict DGA awareness and usage. Data were analyzed using SPSS version 28.1 and SAS/STAT® version 9.4 TS1M7 (2023 SAS Institute Inc).
", "title": "Data from: An Exploratory Analysis of Barriers to Usage of the USDA Dietary Guidelines for Americans", "distribution": [ { "@type": "dcat:Distribution", "downloadURL": "https://ndownloader.figshare.com/files/44541002", "format": "xlsx", "mediaType": "application/vnd.openxmlformats-officedocument.spreadsheetml.sheet", "title": "S337_DSQ_Data.xlsx" }, { "@type": "dcat:Distribution", "downloadURL": "https://ndownloader.figshare.com/files/44541005", "format": "docx", "mediaType": "application/vnd.openxmlformats-officedocument.wordprocessingml.document", "title": "dsq_codebook_teleform.docx" } ], "license": "https://www.usa.gov/publicdomain/label/1.0/", "bureauCode": [ "005:18" ], "modified": "2024-02-15", "publisher": { "@type": "org:Organization", "name": "Agricultural Research Service" }, "keyword": [ "food", "nutrition", "diet", "Dietary Guidelines", "adherence", "Health Belief Model", "attitudes", "opinions", "adults", "dietary recommendations", "NP107", "data.gov", "ARS" ], "spatial": "{\"type\": \"Point\", \"coordinates\": [-97.061778903008, 47.921551611456]}" }, { "identifier": "10113/AA23222", "accessLevel": "public", "contactPoint": { "hasEmail": "mailto:xiaohua.he@ars.usda.gov", "fn": "He, Xiaohua" }, "programCode": [ "005:040" ], "description": "Treating Shiga toxin-producing Escherichia coli (STEC) gastrointestinal infections is difficult. The utility of antibiotics for STEC treatment is controversial, since antibiotic resistance among STEC isolates is widespread and certain antibiotics dramatically increase the expression of Shiga toxins (Stxs), which are some of the most important virulence factors in STEC. Stxs contribute to life-threatening hemolytic uremic syndrome (HUS), which develops in considerable proportions of patients with STEC infections. Understanding the antibiotic resistance profiles of STEC isolates and the Stx induction potential of promising antibiotics is essential for evaluating any antibiotic treatment of STEC. In this study, 42 O157:H7 or non-O157 STEC isolates (including the “big six” serotypes) were evaluated for their resistance against 22 antibiotics by using an antibiotic array. Tigecycline inhibited the growth of all of the tested STEC isolates and also inhibited the production of Stxs (Stx2 in particular). In combination with neutralizing antibodies to Stx1 and Stx2, the tigecycline-antibody treatment fully protected Vero cells from Stx toxicity, even when the STEC bacteria and the Vero cells were cultured together. The combination of an antibiotic such as tigecycline with neutralizing antibodies presents a promising strategy for future STEC treatments.
Resource Title: Supplemental Materials.
File Name: Web Page, url: https://aac.asm.org/content/59/9/5435/figures-only#fig-data-additional-files
Table S1: Descriptions and characteristics of antibiotics used in this study. XLS, 35K
\nTable S2: MICs of antibiotics for STEC serotypes and probiotics. XLS, 30K
\nTable S3: MICs of antibiotics for individual isolates. XLS, 47K
\nTable S4: Induction of Stx1 and Stx2 by selected antibiotics. XLS, 35K
[Note: Title updated 2024-04-23]
Liquid chromatography-mass spectrometry (LC-MS) experiment data files for bovine milk lipid extracts, standards, and blanks, in mzML format. For use with \"An Open-Source R-Based Workflow for Qualitative and Quantitative Lipidomics of Bovine Milk\". Chromatography used a fast (10 minute) non-aqueous reversed-phase UHPLC separation. MS analysis was performed on a ThermoScientific QExactive Orbitrap high-resolution, accurate-mass mass spectrometer operated in electrospray ionization (ESI) mode.
Resources in this dataset:
The impact of lactose on the gut microbiota of healthy adults was examined, using a short-term, in vitro strategy where fecal samples harvested from 18 donors were cultured anaerobically with and without lactose. Donors represented 3 adult age groups. Data collected include: amplicon sequencing of the V1-V2 regions of the 16S rRNA gene (available in the NCBI Sequence Read Archive associated with BioProject PRJNA883645: https://www.ncbi.nlm.nih.gov/bioproject/PRJNA883645), RT-qPCR of Bifidobacterium 16S rRNA genes, and short-chain fatty acid concentrations.
\nResources in this dataset:
\nResource Title: lactose sample attributes\nFile Name: lactose_sample_metadata.csv
\nResource Title: lactose SCFA, pH, and gas production data\nFile Name: lactose_SCFA_data.csv
\nResource Title: Total bacterial and Bifidobacterium genus qPCR\nFile Name: lactose_qPCR_all_bacteria_and_bifido.csv
\nThe stable fly, Stomoxys calcitrans L. (Diptera: Muscidae), is one of the most significant pests of livestock in the United States. The identification of targets for the development of novel control for this pest species, focusing on those molecules that play a role in successful feeding and reproduction, is critical to mitigating its impact on confined and rangeland livestock. This data set was obtained from pyrosequencing of stable fly immature and adult specimens, comprising genes expressed at these stages. Stable fly specimens were obtained from an in vitro colony that is maintained at the Knipling-Bushland U.S. Livestock Insects Research Laboratory (Kerrville, TX) at 27°C, 60% RH, and a photoperiod of 12:12 [L:D] h. The stages included 1 g each of newly laid (t0) and 24 h post-oviposition (t24) embryos, 5 g of pooled 2nd–3rd instar larvae (late larvae), 2.5 g newly pupariated pupae (early pupae), 5 g pharate adults (pupae 2 d prior to eclosion; late pupae), and 1.5 g each of heads from unfed adult females and males (adult). Total RNA was isolated from various stages using the ToTALLY RNA Isolation Kit (Ambion, Foster City, CA) following the manufacturer’s protocol. Five micrograms of normalized cDNA was prepared for sequencing on the 454/ Roche GS-FLX. Double-stranded cDNA was nebulized to generate nominal 500-kb fragments and a shotgun library prepared for GS-FLX sequencing as per the manufacturer’s instructions (Roche, Indianapolis, IN). The sequencing library was run on a full picotitre plate and resulting data submitted to NCBI Short Read Archive (SRX018014). The resulting sequence data was assembled using newbler (RocheN) and the assembly optimized using a beta version of NGEN (DNAstar, Madison, WI) and Seqman (DNAstar, Oxford, UK). BLASTx was utilized based upon W.ND-BLAST (Dowd et al., 2005) against an embl-derived database for Drosophila (2008). Functional annotations were derived using DAVID (Dennis et al., 2003).
\nRaw reads were submitted to the Sequence Read Archive (SRA) Database at NCBI.
\nResource Title: Analysis of expressed sequence tags from a significant livestock pest, the stable fly (Stomoxys calcitrans), identifies transcripts with a putative role in chemosensation and sex-determination.
File Name: Web Page, url: https://www.ncbi.nlm.nih.gov/bioproject/79611
Sample description: The stable fly, Stomoxys calcitrans L. (Diptera: Muscidae), is one of the most significant pests of livestock in the United States. The identification of targets for the development of novel control for this pest species, focusing on those molecules that play a role in successful feeding and reproduction, is critical to mitigating its impact on confined and rangeland livestock. A database was developed representing genes expressed at the immature and adult lifestages of the stable fly, comprising data obtained from pyrosequencing both immature and adult stages and from small scale sequencing of an antennal/maxillary palp expressed sequence tag library. The full-length sequence and expression of 21 transcripts that may have a role in chemosensation is presented, including 13 odorant binding proteins, 6 chemosensory proteins, and 2 odorant receptors. Transcripts with potential roles in sex determination and reproductive behaviors are identified, including evidence for the sex-specific expression of stable fly doublesex- and transformer-like transcripts. The current database will be a valuable tool for target identification and for comparative studies with other Diptera.
Resource Software Recommended: SRA Toolkit,url: https://trace.ncbi.nlm.nih.gov/Traces/sra/sra.cgi?view=software
We tested the extent to which reproductive effort by an iterocarpic native thistle Cirsium undulatum provided within-season tolerance for insect floral herbivory through plant response to apical damage. We imposed apical damage and used insecticide to reduce herbivory damage to manipulate plant response and potential outcomes in reproductive compensation. Data include: 1) detailed size and fecundity data per plant individual under different treatments; and 2) insect damage score and seeds produced per individual flower head.
Resource Title: Wavyleaf thistle individual plant data.
File Name: West_2021 Wavyleaf plant data.csv
Resource Description: Includes detailed information on whole plant morphology (e.g., number of branches and flowerheads), fecundity, and insect damage estimates.
Resource Title: Wavyleaf thistle per flowerhead data.
File Name: West_2021 Wavyleaf flowerhead data.csv
Resource Description: Includes visual damage score and seed production estimate from individual flowerhead dissections.
Resource Title: Wavyleaf thistle Plant and Flowerhead data description.
File Name: West_2021 Wavyleaf dataset.txt
Resource Description: Explanation of variables and information on Wavyleaf thistle data files
An investigation of antigenic relationships between North American swine H3N2 influenza A viruses (IAV) and human seasonal vaccine strains was conducted to assess the zoonotic risk to humans. Human seasonal H3N2 vaccine strains isolated from 1973 to 2014 (n=20) were obtained from the World Health Organization Global Influenza Surveillance and Response Network through St. Jude Children’s Research Hospital to use for serological assays, such as hemagglutination inhibition (HI) assays. Human seasonal vaccine strains were cultured on MDCK cells or eggs and the HA gene was verified by sequencing on a Sanger method at National Animal Disease Center (NADC). A consensus HA sequence was generated using Geneious Software.
\nResource Title: Consensus sequences of hemagglutinin (HA) gene segments.
File Name: Vincent_H3N2 HuVac strains.rtf
Resource Description: The data set includes sequences of hemagglutinin (HA) gene of human seasonal influenza A vaccine strains used in hemagglutination inhibition (HI) assays as references to assess the zoonotic risk of North American swine H3N2 strains to humans. The text file lists the consensus sequence of HA gene segment from each human H3N2 influenza A vaccine strain.\n
To optimize fruit production, a portion of the flowers and fruitlets of apple trees must be removed early in the growing season. The proportion to be removed is determined by the bloom intensity, i.e., the number of flowers present in the orchard. Several automated computer vision systems have been proposed to estimate bloom intensity, but their overall performance is still far from satisfactory even in relatively controlled environments. With the goal of devising a technique for flower identification which is robust to clutter and to changes in illumination, this paper presents a method in which a pre-trained convolutional neural network (CNN) is fine-tuned to become specially sensitive to flowers. Experimental results on a challenging dataset demonstrate that our method significantly outperforms three approaches that represent the state of the art in flower detection, with recall and precision rates higher than 90%. Moreover, a performance assessment on three additional datasets previously unseen by the network, which consist of different flower species and were acquired under different conditions, reveals that the proposed method highly surpasses baseline approaches in terms of generalization capability. This dataset comprises mp4 video sequences illustrating each combination of datasets and methods.
Resource Title: Supplementary data - Video mmc1 (7MB).
File Name: 1-s2.0-S016636151730502X-mmc1.mp4
Resource Description: Dataset = AppleA.
\nMethod on left-hand side: second baseline algorithm mentioned in the paper, where HSV is hue-saturation-value, and 'Bh' is Bhattacharyya distance.
\nMethod on right-hand side: our proposed method, the CNN + SVM, where CNN = convolutional neural network and SVM = support vector machine.
\nTrue Positives (blue), False Positives (cyan), and False Negatives (red).
Resource Title: Supplementary data - Video mmc2 (7MB).
File Name: 1-s2.0-S016636151730502X-mmc2.mp4
Resource Description: Dataset = AppleA.
\nMethod on left-hand side: third baseline algorithm mentioned in the paper, HSV + SVM, where HSV is hue-saturation-value and SVM is support vector machine.
\nMethod on right-hand side: our proposed method, the CNN + SVM, where CNN = convolutional neural network and SVM = support vector machine.
\nTrue Positives (blue), False Positives (cyan), and False Negatives (red).
Resource Title: Supplementary data - Video mmc3 (7MB).
File Name: 1-s2.0-S016636151730502X-mmc3.mp4
Resource Description: Dataset = AppleA.
\nMethod on left-hand side: first baseline algorithm mentioned in the paper, where HSV is hue-saturation-value.
\nMethod on right-hand side: our proposed method, the CNN + SVM, where CNN = convolutional neural network and SVM = support vector machine.
\nTrue Positives (blue), False Positives (cyan), and False Negatives (red).
Resource Title: Supplementary data - Video mmc4 (3MB).
File Name: 1-s2.0-S016636151730502X-mmc4.mp4
Resource Description: Dataset = AppleB.
\nMethod on left-hand side: third baseline algorithm mentioned in the paper, HSV + SVM, where HSV is hue-saturation-value and SVM is support vector machine.
\nMethod on right-hand side: our proposed method, the CNN + SVM, where CNN = convolutional neural network and SVM = support vector machine.
\nTrue Positives (blue), False Positives (cyan), and False Negatives (red).
Resource Title: Supplementary data - Video mmc5 (3MB).
File Name: 1-s2.0-S016636151730502X-mmc5.mp4
Resource Description: Dataset = AppleC.
\nMethod on left-hand side: third baseline algorithm mentioned in the paper, HSV + SVM, where HSV is hue-saturation-value and SVM is support vector machine.
\nMethod on right-hand side: our proposed method, the CNN + SVM, where CNN = convolutional neural network and SVM = support vector machine.
\nTrue Positives (blue), False Positives (cyan), and False Negatives (red).
Resource Title: Supplementary data - Video mmc6 (3MB).
File Name: 1-s2.0-S016636151730502X-mmc6.mp4
Resource Description: Dataset = Peach.
\nMethod on left-hand side: third baseline algorithm mentioned in the paper, HSV + SVM, where HSV is hue-saturation-value and SVM is support vector machine.
\nMethod on right-hand side: our proposed method, the CNN + SVM, where CNN = convolutional neural network and SVM = support vector machine.
\nTrue Positives (blue), False Positives (cyan), and False Negatives (red).
Information on crop genotype- and phenotype-metabolite associations can be of value to trait development as well as to food security and safety. The unique study presented here assessed seed metabolomic and ionomic diversity in a soybean (Glycine max) lineage representing ~35 years of breeding (launch years 1972–2008) and increasing yield potential. Selected varieties included six conventional and three genetically modified (GM) glyphosate-tolerant lines. A metabolomics approach utilizing capillary electrophoresis (CE)-time-of-flight-mass spectrometry (TOF-MS), gas chromatography (GC)-TOF-MS and liquid chromatography (LC)-quadrupole (q)-TOFMS resulted in measurement of a total of 732 annotated peaks. Ionomics through inductively-coupled plasma (ICP)-MS profiled twenty mineral elements. Orthogonal partial least squares-discriminant analysis (OPLS-DA) of the seed data successfully differentiated newer higher-yielding soybean from earlier lower-yielding accessions at both field sites. This result reflected genetic fingerprinting data that demonstrated a similar distinction between the newer and older soybean. Correlation analysis also revealed associations between yield data and specific metabolites. There were no clear metabolic differences between the conventional and GM lines. Overall, observations of metabolic and genetic differences between older and newer soybean varieties provided novel and significant information on the impact of varietal development on biochemical variability. Proposed applications of omics in food and feed safety assessments will need to consider that GM is not a major source of metabolite variability and that trait development in crops will, of necessity, be associated with biochemical variation.
Resource Title: Pointer to Electronic Supplementary Material.
File Name: Web Page, url: https://link.springer.com/article/10.1007/s11306-014-0702-6#Sec17
Link to Electronic Supplementary Material at Metabolomics. Files are:
\nSupplementary material 1: Full metabolite profile and ionomic dataset - Download Excel
\nSupplementary material 2: List of annotated metabolites - Download Excel
\nSupplementary material 3: Monsanto_ionomics_Data_Baxterla - Download Excel
\nSupplementary material 4: Metabolomics metadata - Download .docx
\nSupplementary material 5: Spearman correlations between yield and metabolites/ions - Download Excel
\nSupplementary material 6: Supporting Tables and Figures - Download .docx
\nThese data describe aspects of the abiotic environment for 1000 randomly selected points and 529 points where Oklahoma phlox was observed along the 2020 and 2021 survey route.
\nResources in this dataset:
\nResource Title: Random locations along 2020 and 2021 survey route\nFile Name: phlox_study_data-RandLoc.kml
\nResource Title: Locations along 2020 and 2021 survey route where Oklahoma phlox was observed\nFile Name: phlox_study_data-PhloxLoc.kml
\nResource Title: Survey route with cultivation adjacent the route noted\nFile Name: phlox_study_data-SurveyRoute.kml\nResource Description: The survey route used in 2020 and 2021 with information as to whether the land adjacent on each segment was cultivated or not and if so, which side was cultivated during the period.
\nFile Title: Data Dictionary\nFile Name: DataDictionary.csv
\nThe objective of this study was to explore the R. microplus microbiome by applying the bacterial 16S tag-encoded FLX-titanium amplicon pyrosequencing (bTEFAP) technique to characterize its bacterial diversity.
\nPyrosequencing was performed on adult males and females, eggs, and gut and ovary tissues from adult females derived from samples of R. microplus collected during outbreaks in southern Texas. Raw data from bTEFAP were screened and trimmed based upon quality scores and binned into individual sample collections. Bacteria identified to the species level include Staphylococcus aureus, Staphylococcus chromogenes, Streptococcus dysgalactiae, Staphylococcus sciuri, Serratia marcescens, Corynebacterium glutamicum, and Finegoldia magna. One hundred twenty-one bacterial genera were detected in all the life stages and tissues sampled. The total number of genera identified by tick sample comprised: 53 in adult males, 61 in adult females, 11 in gut tissue, 7 in ovarian tissue, and 54 in the eggs. Notable genera detected in the cattle tick include Wolbachia, Coxiella, and Borrelia. The molecular approach applied in this study allowed us to assess the relative abundance of the microbiota associated with R. microplus.
\nTicks are regarded as the most relevant vectors of disease-causing pathogens in domestic and wild animals. The cattle tick, Rhipicephalus (Boophilus) microplus, hinders livestock production in tropical and subtropical parts of the world where it is endemic. Tick microbiomes remain largely unexplored.
Resource Title: Table 1: Estimated operational taxonomic units in samples of Rhipicephalus (Boophilus) microplus through Rarefaction, Ace, and Chao1. .
File Name: Table 1_Estimated operational taxonomic units in samples of Rhipicephalus (Boophilus) microplus through Rarefaction, Ace, and Chao1.xlsx
Resource Title: Table 1_Estimated operational taxonomic units in samples of Rhipicephalus (Boophilus) microplus through Rarefaction, Ace, and Chao1_0.
File Name: Table 1_Estimated operational taxonomic units in samples of Rhipicephalus (Boophilus) microplus through Rarefaction, Ace, and Chao1_0.csv
Resource Description: Rarefaction values are averaged for adult male and female (n = 2), and egg (n = 3) samples.
\nAndreotti et al. BMC Microbiology 2011 11:6 doi:10.1186/1471-2180-11-6
Resource Title: Data Dictionary, Tables 1 and S1.
File Name: CattleTickBacterialDiversity_DataDictionary.csv
Resource Description: Machine readable CSV defines variables, sample sources for bacterial richness and diversity based on Operational Taxonomic Unit (OTU).
Resource Title: Additional file 1. Table S1 - Bacterial genera detected in R. (B.) microplus. Bacterial genera detected in R. (B.) microplus samples..
File Name: 12866_2010_1293_MOESM1_ESM.PDF
Resource Description: Automatic PDF file download. Detection sites: AF ‐ Adult Female Tick; AM ‐ Adult Male Tick; EG ‐ Egg; GT ‐ Adult Female Gut; OV ‐ Ovary.
\nAssociation mapping is an efficient approach for the identification of the molecular basis of agronomic traits in crop plants. For this purpose in pea (Pisum sativum L.), we genotyped and phenotyped individual lines of the single-plant-derived core collection of the USDA pea collection including accessions from 330 landraces and cultivars of Pisum sativum subsp. sativum var. sativum, 28 P. sativum subsp. elatius var. elatius, 16 P. sativum subsp. sativum var. arvense, four P. sativum subsp. elatius var. pumilio, three P. abyssinicum, two P. fulvum, and one P. sativum subsp. transcaucasicum. These 384 accessions were collected or donated from a total of 64 countries. The accessions were genotyped with 256 informative SNPs using a primer extension chemistry and matrix-assisted laser desorption/ionization (MALDI–TOF) mass spectrometry assay. Genetic structure analysis showed that the collection was structured into two main groups, corresponding roughly to the cultivated types/landraces and the more primitive form species and subspecies, with some intermediates. Linkage disequilibrium of pairwise loci and population structure of the collection were analyzed, and an association analysis between SNP genotypes and 25 valuable traits such as disease resistance, seed type/color, flower color, seed low molecular weight carbohydrate concentration, and seed mineral nutrient concentration was performed using a mixed linear model. A total of 71 marker–trait associations were detected as significant with 1–34 markers per trait based on the false discovery rate (FDR < 0.05). This study demonstrates the potential of using association mapping to identify markers for pea breeding.
Resource Title: Supplementary material.
File Name: Web Page, url: https://link.springer.com/article/10.1007/s11032-015-0277-6#Sec16
Seedlings of the GDP were also infiltrated with cultures containing the necrotrophic effectors (NEs) Ptr ToxA and Ptr ToxB. Approximately 20 μl of NE-containing culture filtrate (CF) was infiltrated into two plants (1 leaf per plant) in each cone using a needleless 1-ml syringe. The infiltrated area (~3 cm) was marked with permanent marker on the leaves, and the plants were placed in a growth chamber (21 °C, 12-h photoperiod) for 5 days. The reactions were scored using a 0–3 scale where 0 indicated no reaction and 3 indicated severe necrosis or chlorosis. The expansion of chlorosis beyond the boundaries of Ptr ToxB infiltration to the distal end of the leaf was scored separately using 0 or 1 meaning the absence or presence of the symptom, respectively. This trait is noted as ‘ToxB_Spread’ in the data file.
\nGenotypic data: The GDP lines were genotyped using the Illumina iSelect 90K SNP array. Markers were filtered using previously published genetic maps, and marker sequences were aligned to the Svevo.v1 reference genome. SNP imputation was performed, and the redundant markers were pruned based on genome wide linkage disequilibrium, which resulted in a data set with no missing SNP calls. The hapmap information of 855 genotypes and 13,373 SNPs developed by M. Maccaferri is located on the GrainGenes website (https://wheat.pw.usda.gov/GG3/global_durum_genomic_resources). The haplotype map of the 855 genotypes was reduced to 510 genotypes that were selected for phenotypic tests. The SNP data set was selected according to the set filtering for minor allele frequency (MAF) > 5% that resulted in a marker set containing 12,222 SNPs.
", "title": "Data from: Association mapping of resistance to tan spot in the Global Durum Panel", "distribution": [ { "@type": "dcat:Distribution", "downloadURL": "https://ndownloader.figshare.com/files/44540867", "format": "xlsx", "mediaType": "application/vnd.openxmlformats-officedocument.spreadsheetml.sheet", "title": "GDP tan spot phenotypic data.xlsx" }, { "@type": "dcat:Distribution", "downloadURL": "https://ndownloader.figshare.com/files/44540870", "format": "xlsx", "mediaType": "application/vnd.openxmlformats-officedocument.spreadsheetml.sheet", "title": "GDP tan spot genotypic data.xlsx" } ], "license": "https://www.usa.gov/publicdomain/label/1.0/", "bureauCode": [ "005:18" ], "modified": "2024-02-15", "publisher": { "@type": "org:Organization", "name": "Agricultural Research Service" }, "keyword": [ "Triticum turgidum subsp. durum", "tan spot", "Disease", "GWAS", "NP301", "data.gov", "ARS" ], "spatial": "{\"type\": \"Point\", \"coordinates\": [-96.800537109375, 46.888823798104]}" }, { "identifier": "10.15482/USDA.ADC/1528475", "accessLevel": "public", "contactPoint": { "hasEmail": "mailto:Devan.Mcgranahan@usda.gov", "fn": "McGranahan, Devan" }, "programCode": [ "005:040" ], "description": "This study examined how indirect fire effects (improved forage quality) affect the density of and offtake by grasshoppers at two different times since fire and in unburned plots. Data include total aboveground forage removal inside and outside grasshopper exclosures, crude protein content of aboveground plant material, and grasshopper densities throughout the study period. Both forage offtake and grasshopper density were significantly higher in burned plots compared to unburned plots. Burned plot grasshopper density increased over time, with greater rates of increase in recently burned plots, while density remained constant in unburned locations. These density and offtake patterns appear to be the result of higher crude protein content in burned plots, on account of them having a much higher proportion of recent growth after fire removed aboveground senesced material.
Resource Title: Rangeland fire grasshopper forage data.
File Name: RangelandFireGrasshopperForage.xlsx
Resource Description: Excel file containing plot-level data used in formal analysis.
Resource Title: Script.
File Name: ScriptSupplement.pdf
Resource Description: R script used for data wrangling and statistical analysis
Resource Software Recommended: R 4.0.3,url: https://cran.r-project.org
Our goals were to 1) isolate, and culture two fungal morphotypes, 2) characterize the volatile emissions from grain inoculated by each fungal morphotype (Aspergillus flavus or Fusarium spp.) compared to uninoculated and sanitized grain, and 3) understand how MVOCs from each morphotype affects mobility, attraction, and preference by L. serricorne. Headspace collection revealed that the Fusarium- and A. flavus-inoculated grain produced significantly different volatiles compared to sanitized grain or the positive control. Changes in MVOC emissions affected close-range foraging during an Ethovision assay, with a greater frequency of entering and spending time in a small zone with kernels inoculated with A. flavus compared to other treatments. In the release-recapture assay, MVOCs were found to be attractive to L. serricorne at a longer distances in commercial pitfall traps. While there was no preference shown among semiochemical stimuli in a still-air, four-way olfactometer, it is possible that methodological limitations prevented robust interpretation from this assay. Overall, our study suggests that MVOCs are important for close- and long-range orientation of L.serricorne during foraging, and that MVOCs may have the potential for inclusion in behaviorally-based tactics for this species.
\nResource Title: 4-way olfactometer assay.
File Name: Sierra_2021_olfactometer_Ag_Data_commons.csv
Resource Software Recommended: Microsoft Excel,url: https://www.microsoft.com/en-us/microsoft-365/excel
Resource Title: Release-recapture Assay .
File Name: sierra_release_recapture_exp_2021_fungal_volatiles_agdata_commons.csv
Resource Software Recommended: Microsoft Excel,url: https://www.microsoft.com/en-us/microsoft-365/excel
Resource Title: Ethovision Movement Assay .
File Name: ethovision_sierra_2021_microbial_volatiles_agdatacommons.csv
Resource Software Recommended: Microsoft Excel,url: https://www.microsoft.com/en-us/microsoft-365/excel
Resource Title: Headspace volatile collection assay.
File Name: headspace_compounds_sierra_2021_fungal_volatiles_final_agdatacommons.csv
Resource Software Recommended: Microsoft Excel,url: https://www.microsoft.com/en-us/microsoft-365/excel
Resource Title: Sequencing Data.
File Name: sequencing_data.zip
Resource Title: File list.
File Name: File_list_L_serricone_attraction_data.txt
This Data is a zipped, ArcGIS Pro (V3.1.2) project. The project geodatabase contains the model. In this project there are five maps representing different datasets.
NOTE (2024-05-13): ISO xml metadata files added to the root of the zipped folder, describing specific items in the project, saved in ArcGIS Pro V.3.2.2.
", "title": "Data from: Automated Detection of On-Farm Irrigation Reservoirs: A Necessary Precursor for Conjunctive Water Management in Two Critical Groundwater Regions of Arkansas", "distribution": [ { "@type": "dcat:Distribution", "downloadURL": "https://ndownloader.figshare.com/files/46309375", "format": "zip", "mediaType": "application/zip", "title": "Modeling_updated_Metadata_5_13_2024.zip" }, { "accessURL": "https://geodata.nal.usda.gov/geonetwork/srv/api/records/3b5bf181-2449-46c5-917c-292d1dc6b100/formatters/xml", "@type": "dcat:Distribution", "format": "xml", "mediaType": "text/xml", "conformsTo": "http://www.isotc211.org/2005/gmd", "title": "Geodata ISO 19139 metadata" } ], "license": "https://www.usa.gov/publicdomain/label/1.0/", "bureauCode": [ "005:18" ], "modified": "2024-05-14", "publisher": { "@type": "org:Organization", "name": "Agricultural Research Service" }, "accrualPeriodicity": "irregular", "theme": [ "geospatial" ], "keyword": [ "elevation", "reservoir detection", "irrigation reservoir" ], "spatial": "{\"type\": \"Polygon\", \"coordinates\": [[[-92.38952527754, 34.66620545269], [-92.243041126058, 34.678252710635], [-92.202757699415, 34.53055417488], [-92.133177844808, 34.355388499181], [-92.118529295549, 34.176825984086], [-92.067259876058, 34.043414402199], [-91.851195199415, 33.997885084175], [-91.668089507148, 34.098017334845], [-91.506957141683, 33.991812756117], [-91.305540679023, 33.931064499906], [-91.144408313558, 33.80943849458], [-91.030882475898, 33.973592890152], [-90.814818469808, 34.167736419112], [-90.613402007148, 34.467174472707], [-90.855102650821, 34.893440552429], [-90.973205678165, 35.2829953554], [-90.94482421875, 35.356202887127], [-90.921936091036, 35.474837212373], [-90.888976939023, 35.591063279264], [-90.794677846134, 35.730163510714], [-90.871581975371, 35.811131416438], [-90.761718694121, 36.020965690048], [-90.682983454317, 36.12604372262], [-90.562133677304, 36.366747502391], [-90.532835824415, 36.500667462497], [-91.023558704183, 36.494779755767], [-91.220397516154, 36.108224711352], [-91.396178766154, 35.758330555768], [-91.383361159824, 35.588759952046], [-91.715697376058, 35.3381408237], [-92.03796277754, 35.026857065014], [-92.265013782308, 34.861754800257], [-92.38952527754, 34.66620545269]]]}" }, { "identifier": "10.15482/USDA.ADC/1173243", "accessLevel": "public", "contactPoint": { "hasEmail": "mailto:nalkharouf@towson.edu", "fn": "Alkharouf, Nadim W." }, "programCode": [ "005:040" ], "description": "This dataset is supplemental to the article \"BBGD: an online database for blueberry genomic data,\" (2007); it is titled \"list of genes printed on microarray slides.\"
\nThe article, \"BBGD: an online database for blueberry genomic data,\" (2007) involving blueberry cold hardiness experiments has a list of all the genes that were printed on microarray slides. This dataset, supplemental to the article, is called: \"list of genes printed on microarray slides.\" 1471-2229-7-5-s1.xls 663k.\nBy using the BBGD database, researchers developed EST-based markers for mapping, and have identified a number of \"candidate\" cold tolerance genes that are highly expressed in blueberry flower buds after exposure to low temperatures. \n\nBBGD (http://bioinformatics.towson.edu/BBGD/) is a public online database, and was developed for blueberry genomics. BBGD is both a sequence and gene expression database: it stores both EST and microarray data, and allows scientists to correlate expression profiles with gene function. Presently, the main focus of the database is the identification of genes in blueberry that are significantly induced or suppressed after low temperature exposure.
\nData was collected sometime between 2000 and 2007 - exact dates are unknown.
Resource Title: List of genes printed on microarray slides, 1471-2229-7-5-s1.xls.
File Name: 1471-2229-7-5-s1.xls
Resource Title: Data dictionary.
File Name: BBGD-data-dictionary.csv
Resource Description: Defines fields for list of genes.
These data represent a meta-analysis testing if Streptomyces biological control agents reduce disease caused by fungal plant pathogens and identify factors that alter biological control efficacy of these bacteria. Meta-data and control and treatment data were compiled from 160 studies representing 44 publications that tested the effect of Streptomyces on diseases caused by fungal plant pathogens of agronomic and horticultural crops. Effect sizes and variances were calculated based on the log-response ratio.
Resource Title: Meta-data and effect size calculations used in meta-analysis.
File Name: AgDataCommonsEffectSizes.txt
Resource Description: Descriptor of column headers are listed below.
\nReference: Original publication reporting data from a given study\nDisease pressure: Level of disease pressure when biological control agent was tested\nPlant: Species of plant\nPathogen: Species of pathogen\nDisease: Type of disease\nInoculation method: Method used to apply bacteria for biological control\nEnvironment: Environment that experiments were conducted under\nLRR: Log response ratio effect size estimated from individual studies\nVarianceL Variance estimate associated with effect size calculation
House flies (Musca domestica L.) are vectors of human and animal pathogens at livestock operations. Microbial communities in flies are acquired from, and correlate with, their local environment. However, variation among microbial communities carried by flies from farms in different geographical areas is not well understood. We characterized bacterial communities of female house flies collected from beef and dairy farms in Oklahoma, Kansas, and Nebraska and further evaluated the prevalence of antibiotic resistance genes in bacteria within flies. We evaluated the influence of farm type and farm location on bacterial communities, diversity, pathogenic bacteria strains and prevalence of antibiotic resistance genes. These data can be used for better understanding of abundance and prevalence of bacterial communities in house flies associated with livestock operations. These data were collected in September 2019. Abbreviations used include Operational Taxonomic Units(OTUs), Canonical Correspondence analysis (CCA), Infectious Bovine Keratoconjunctivitis (IBK), Anti Microbial Resistance (AMR), and Antibiotic Resistance Genes (ARGs).
\nThe raw Illumina MiSeq sequence data for this project can be found here:\nhttps://www.ncbi.nlm.nih.gov/bioproject/PRJNA863664
\nResources in this dataset:
\nCover crops provide many agroecosystem services, including weed suppression, which is partially exerted through release of allelopathic benzoxazinoid (BX) compounds. This research characterizes (1) changes in concentrations of BX compounds in shoots, roots, and soil at three growth stages (GS) of cereal rye (Secale cereale L.), and (2) their degradation over time following termination. Concentrations of shoot dominant BX compounds, DIBOA-glc and DIBOA, were least at GS 83 (boot). The root dominant BX compound, HMBOA-glc, concentration was least at GS 54 (elongation). Rhizosphere soil BX concentrations were 1000 times smaller than in root tissues. Dominant compounds in soil were HMBOA-glc and HMBOA. Concentrations of BX compounds were similar for soil near root crowns and between-rows. Soil BX concentrations following cereal rye termination declined exponentially over time in three of four treatments: incorporated shoots (S) and roots (R), no-till S+R (cereal rye rolled flat), and no-till R (shoots removed), but not in no-till S. On the day following cereal rye termination, soil concentrations of HMBOA-glc and HMBOA in these three treatments increased above initial concentrations. Concentrations of these two compounds decreased the fastest while DIBOA-glc declined the slowest (half-life of 4 d in no-till S+R soil). Placement of shoots on the surface of an area where cereal rye had not grown (no-till S) did not increase soil concentrations of BX compounds. The short duration and complex dynamics of BX compounds in soil prior to and following termination illustrate the limited window for enhancing weed suppression by cereal rye allelochemicals; valuable information for programs breeding for enhanced weed suppression.
\nIn addition to the data analyzed for this article, we also include the R code.
Resource Title: BX data following termination.
File Name: FinalBXsForMatt-20200908.csv
Resource Description: For each sample, gives the time, depth, location, and plot treatment, and then the compound concentrations. This is the principal data set analyzed with the R (anal2-cleaned.r) code, see that code for use.
Resource Title: BX compounds from 3rd sampling time before termination.
File Name: soil2-20201123.csv
Resource Description: These data are for comparison with the post termination data. They were taken at the 3rd sampling time (pre-termination), a day prior to termination. Each sample is identified with a treatment, date, and plot location, in addition to the BX concentrations. See R code (anal2-cleaned.r) for how this file is used.
Resource Title: Soil location (within row versus between row) values of BX compounds.
File Name: s2b.csv
Resource Description: Each row gives the average BX compound for each soil location (within row versus between row) for the second sample for each plot. These data are combined with bx3 (the data set read in from the file , \"FinalBXsForMatt-20200908.csv\"). See R (anal2-cleaned.r) code for use.
Resource Title: R code for analysis of the decay (post-termination) BX data..
File Name: anal2-cleaned.r
Resource Description: This is the R code used to analyze the termination data. It also creates and writes out some data subsets (used for analysis and plots) that are later read in.
Resource Software Recommended: R version 3.6.3,url: https://www.R-project.org/
Resource Title: Tissue BX compounds.
File Name: tissues20210728b.csv
Resource Description: Data file holding results from a tissue analysis for BX compounds, in ug, from shoots and roots, and at various sampling times. Read into the R file, anal1-cleaned.r where it is used in a statistical analysis and to create figures.
Resource Title: BX compounds from soil with a live rye cover crop.
File Name: soil2-20201214.csv
Resource Description: BX compounds (in ng/g dry wt), by treatment, sampling time, date, and plot ID. These are data are read into the R program, anal1-cleaned.r, for analysis and to create figures. These are soil samples taken from locations with a live rye plant cover crop.
Resource Title: R code for BX analyses of soil under rye and plant tissues.
File Name: anal1-cleaned.r
Resource Description: R code for analysis of the soil BX compounds under a live rye cover crop at different growing stages, and for the analysis of tissue BX compounds. In addition to statistical analyses, code in this file creates figures, also some statistical output that is used to create a file that is later read in for figure creation (s2-CLD20220730-Stage.csv).
Resource Software Recommended: R version 3.6.3,url: https://www.R-project.org/
Resource Title: Description of data files for anal2-cleaned.r.
File Name: readme2.txt
Resource Description: Describes the input files used in the R code in anal2-cleaned.r, including descriptions and formats for each field. The file also describes some output (results) files that were uploaded to this site. This is a plain ASCII text file.
Resource Title: Estimates produced by anal2-cleaned.r from statistical modeling..
File Name: Estimates20201110.csv
Resource Description: Estimates produced by anal2-cleaned.r from statistical modeling (see readme2.txt)
Resource Title: Summary statistics from anal2-cleaned.r.
File Name: CV20210412.csv
Resource Description: Summary statistics from anal2-cleaned.r, used for plots
Resource Title: Data summaries (same as CV20210412.csv), rescaled.
File Name: RESCALE-20210412.csv
Resource Description: Same as \"CV20210412.csv\" except log of data have been rescaled to minimum at least zero and maximum one, see readme2.txt
Resource Title: Statistical summaries for different stages.
File Name: s2-CLD20220730-Stage.csv
Resource Description: Statistical summaries used for creating a figure (not used in paper), used in anal1-cleaned.r; data for soil BX under living rye.
Resource Title: Description of data files for anal1-cleaned.r.
File Name: readme1.txt
Resource Description: Contains general descriptions of data imported into anal1-cleaned.r, and a description of each field. Also contains some descriptions of files output by anal1-cleaned.r, used to create tables or figures.
This is digital research metadata corresponding to a published manuscript in Energies (MDPI) entitled \"Biochar stability in a highly weathered sandy soil under four years of continuous corn production\", Volume 14, Issue 19, 6157. Dataset may be accessed via the included link at the Dryad data repository.
\nBiochar is being considered a climate change mitigation tool by increasing soil organic carbon contents (SOC), however, questions remain concerning its longevity in soil. We applied 30,000 kg ha−1 of biochars to plots containing a Goldsboro sandy loam (Fine-loamy, siliceous, sub-active, thermic Aquic Paleudults) and then physically disked all plots. Thereafter, the plots were agronomically managed under 4 years (Y) of continuous corn (Zea mays, L.) planting. Annually, incremental soil along with corresponding bulk density samples were collected and SOC concentrations were measured in topsoil (down to 23-cm). The biochars were produced from Lodgepole pine (Pinus contorta) chip (PC) and Poultry litter (PL) feedstocks. An untreated Goldsboro soil (0 biochar) served as a control. After four years, SOC contents in the biochar treated plots were highest in the top 0–5 and 5–10 cm depth suggesting minimal deeper movement. Declines in SOC contents varied with depth and biochar type. After correction for SOC declines in controls, PL biochar treated soil had a similar decline in SOC (7.9 to 10.3%) contents. In contrast, the largest % SOC content decline (20.2%) occurred in 0–5 cm deep topsoil treated with PC biochar. Our results suggest that PC biochar had less stability in the Goldsboro soil than PL biochar after 4 years of corn grain production.
\nMethods are described in the manuscript: https://doi.org/10.3390/en14196157. Descriptions corresponding to each figure and table in the manuscript are placed on separate tabs in the Excel file to clarify abbreviations and summarize the data headings and units.
Resource Title: Digital research data for Biochar stability in a highly weathered sandy soil under four years of continuous corn production.
File Name: Web Page, url: https://doi.org/10.5061/dryad.xpnvx0kh2
Novak, Jeffrey et al. (2021), Digital research data from: Biochar stability in a highly weathered sandy soil under four years of continuous corn production, Dryad, Dataset, https://doi.org/10.5061/dryad.xpnvx0kh2
The dataset contains measurements from a swine research study evaluating for biomarkers with influenza A vaccine associated enhanced respiratory disease. Hematology, plasma chemistry, serum antibody, and acute phase proteins in blood and viral titers in nasal swabs were evaluated over five days following infection. Additionally at 5 days post infection tissues were evaluated for lesions and bronchoalveolar lavage fluid collected for cytokine and viral assessment to develop a panel of potential biomarkers.
", "title": "Data from: Biomarkers associated with vaccine-associated enhanced respiratory disease following influenza A virus infection in swine", "distribution": [ { "@type": "dcat:Distribution", "downloadURL": "https://ndownloader.figshare.com/files/44359526", "format": "xlsx", "mediaType": "application/vnd.openxmlformats-officedocument.spreadsheetml.sheet", "title": "MWB Biomarkers Data.xlsx" } ], "license": "https://www.usa.gov/publicdomain/label/1.0/", "bureauCode": [ "005:18" ], "modified": "2024-05-30", "publisher": { "@type": "org:Organization", "name": "Agricultural Research Service" }, "keyword": [ "influenza A viruses (IAVs)", "Swine", "vaccine associated enhanced respiratory disease (VAERD)", "Biomarkers", "Influenza Vaccine" ] }, { "identifier": "10.15482/USDA.ADC/1524712", "accessLevel": "public", "contactPoint": { "hasEmail": "mailto:amy.vincent@usda.gov", "fn": "Vincent, Amy" }, "programCode": [ "005:040" ], "description": "Influenza A virus is a major respiratory pathogen in swine that leads to significant economic loss in the swine industry, and there is a critical need to improve on commercial vaccines. Traditional vaccines target the hemagglutinin (HA) portion of the IAV virus, lose protection to as viruses change, and may even lead to vaccine-associated enhanced respiratory disease (VAERD) after infection with a dissimilar influenza virus. A newer replicon particle (RP) vaccine platform targeting the influenza HA protein offers multiple advantages over traditional vaccines for swine, but have not yet been evaluated for the ability to avoid VAERD or the use of HA along with an additional viral vaccine target, such as neuraminidase (NA). In this work we demonstrated RP HA and NA influenza vaccines stimulate immune responses, protect from disease, and avoid VAERD following infection with a distantly related virus. This demonstrates the potential utility of RP vaccines against influenza and the importance in utilizing the NA in influenza vaccine design. Such improvement of IAV vaccines will reduce influenza disease and economic loss in commercial swine and reduce the risk of influenza transmission to people. These data include individual pig responses used in statistical analyses and figures to support the conclusions of the paper.
Resource Title: Data from: Bivalent hemagglutinin and neuraminidase influenza replicon particle vaccines protect without causing vaccine associated enhanced respiratory disease in swine.
File Name: Data Repository.xlsx
Phytochemicals in red and purple bran rice have potential health benefit to humans. The phytochemicals in brans of 32 red and purple global rice varieties are determined. The description of the origin and physical traits of the whole grain (color, length, width, thickness and 100-kernel weight) of this germplasm collection are provided along with data of total flavonoid and total phenolic contents, oxygen radical absorbance capacity and total proanthocyanidin contents. The contents and proportions of individual oligomers, from degree of polymerization of monomers to 14-mers, and polymers in bran of these 32 rice (Oryza sativa L.) varieties are presented (DOI: http://dx.doi.org/10.1016/j.foodchem.2016.04.004)
Resource Title: Bran data of total flavonoid and total phenolic contents, oxygen radical absorbance capacity, and profiles of proanthocyanidins and whole grain physical traits of 32 red and purple rice varieties.
File Name: Web Page, url: https://www.sciencedirect.com/science/article/pii/S235234091630289X
Data in Brief article providing the description of the origin and physical traits of the whole grain (color, length, width, thickness and 100-kernel weight) of this germplasm collection, along with data of total flavonoid and total phenolic contents, oxygen radical absorbance capacity, and total proanthocyanidin contents.
Technologies are now available to continuously monitor livestock foraging behaviours, but it remains unclear whether such measurements can meaningfully inform livestock grazing management decisions. Empirical studies in extensive rangelands are needed to quantify relationships between short-term foraging behaviours (e.g. minutes to days) and longer-term measures of animal performance. The objective of this study was to examine whether four different ways of measuring daily foraging behaviour (grazing-bout duration, grazing time per day, velocity while grazing, and turn angle while grazing) were related to weight gain by free-ranging yearling steers grazing semiarid rangeland. These data include measurements interpreted from yearling steer outfitted with neck collars supporting a solar-powered device that measured GPS locations at 5 minute intervals and used an accelerometer to predict grazing activity at 4 second intervals. Average daily weight gains of steers are included as well as an estimate of standing forage biomass derived from the Harmonized Landsat-Sentinel remote-sensing product. These data support research to advance knowledge regarding the use of on-animal sensors that monitor foraging behaviour, which have the potential to transmit indicators to livestock managers in real time (e.g. daily). This approach can help inform decisions such as when to move animals among paddocks, or when to sell or transition animals from rangeland to confined feeding operations.
Resource Title: Means of Moonitor Metrics from 2019-2020 Study Periods.
File Name: Moo2019-20_dailymetrics_w_ADG_by_studyperiod.csv
Resource Title: Data Dictionary for Means of Moonitor Metrics from 2019-2020 Study Period.
File Name: Moo2019-20_dailymetrics_w_ADG_by_studyperiod_dictionary.csv
Resource Title: Daily Moonitor Metrics from 2019-2020.
File Name: Moo2019-20_dailymetrics_database.csv
Resource Title: Data Dictionary for Daily Moonitor Metrics from 2019-2020.
File Name: Moo2019-20_dailymetrics_database_dictionary.csv
The increase in corn (Zea mays L.) and soybean [Glycine max (L.) Merr.] production in rainfed cropping systems of the northern Great Plains has altered the delivery of ecosystem services from agricultural land. A study was conducted to quantify carbon balance of a spring wheat (Triticum aestivum L.)-corn-soybean rotation under no-till management using eddy covariance techniques over a 3-yr period. Paired field sites with the same soil type near Mandan, ND USA were used for the study. Data from the study included fluxes of carbon dioxide and water vapor, precipitation, air temperature, relative humidity, photosynthetically active radiation, soil temperature, soil water content, vegetation phenology, green chromatic coordinate, aboveground biomass, leaf area index, and grain yield. Data were used to generate estimates of net ecosystem exchange, ecosystem respiration, gross ecosystem production, net ecosystem carbon balance, evapotranspiration, vapor pressure deficit, relative greenness of vegetation, and carbon-, water-, and light-use efficiencies. Data are generally applicable to rainfed conditions under a semiarid Continental climate for Temvik-Wilton silt loams (fine silty, mixed, superactive, frigid Typic and Pachic Haplustolls) and related soil types (i.e., Grassna, Linton, Mandan, and Williams).
", "title": "Data from: Carbon Fluxes from a Spring Wheat-Corn-Soybean Crop Rotation Under No-Tillage Management", "distribution": [ { "@type": "dcat:Distribution", "downloadURL": "https://ndownloader.figshare.com/files/44540447", "format": "txt", "mediaType": "text/plain", "title": "ReadMe.txt" }, { "@type": "dcat:Distribution", "downloadURL": "https://ndownloader.figshare.com/files/44540450", "format": "xlsx", "mediaType": "application/vnd.openxmlformats-officedocument.spreadsheetml.sheet", "title": "Data_dictionary_LTAR-CCE-NP-BAU-Fields_2016-2018_0.xlsx" }, { "@type": "dcat:Distribution", "downloadURL": "https://ndownloader.figshare.com/files/44540453", "format": "zip", "mediaType": "application/zip", "title": "Polygons_points_h5_i2_2016-2018.zip" }, { "@type": "dcat:Distribution", "downloadURL": "https://ndownloader.figshare.com/files/44540456", "format": "zip", "mediaType": "application/zip", "title": "h5_i2_fields_points_i2-EC-station-photo.zip" }, { "@type": "dcat:Distribution", "downloadURL": "https://ndownloader.figshare.com/files/44540459", "format": "csv", "mediaType": "text/plain", "title": "Daily_micromet-EC-flux-h5-i2_2016-2018_0.csv" }, { "@type": "dcat:Distribution", "downloadURL": "https://ndownloader.figshare.com/files/44540462", "format": "csv", "mediaType": "text/plain", "title": "Cumulative_NEP_GEP_ET_PAR_h5-i2_2016-2018.csv" }, { "@type": "dcat:Distribution", "downloadURL": "https://ndownloader.figshare.com/files/44540465", "format": "csv", "mediaType": "application/csv", "title": "AGB_GY_HI_NEP_NECB_h5_i2_2016-2018.csv" }, { "@type": "dcat:Distribution", "downloadURL": "https://ndownloader.figshare.com/files/44540468", "format": "csv", "mediaType": "text/plain", "title": "LAI-max_h5_i2_2016-2018.csv" }, { "@type": "dcat:Distribution", "downloadURL": "https://ndownloader.figshare.com/files/44540471", "format": "csv", "mediaType": "text/plain", "title": "Monthly_micromet_h5-i2_2016-2018.csv" }, { "@type": "dcat:Distribution", "downloadURL": "https://ndownloader.figshare.com/files/44540474", "format": "csv", "mediaType": "application/csv", "title": "half-hourly_micromet-EC-flux_2016-2018.csv" }, { "@type": "dcat:Distribution", "downloadURL": "https://ndownloader.figshare.com/files/44540477", "format": "csv", "mediaType": "application/csv", "title": "PhenoCam_2016-2018.csv" } ], "license": "https://www.usa.gov/publicdomain/label/1.0/", "bureauCode": [ "005:18" ], "modified": "2024-02-20", "publisher": { "@type": "org:Organization", "name": "Agricultural Research Service" }, "keyword": [ "net ecosystem production", "aboveground net primary productivity", "gross primary productivity", "carbon use efficiency", "Northern Great Plains", "NP216", "data.gov", "ARS" ], "spatial": "{\"type\": \"MultiPoint\", \"coordinates\": [[-100.950978, 46.775561], [-100.925719, 46.761311]]}" }, { "identifier": "10.15482/USDA.ADC/25343395.v1", "accessLevel": "public", "contactPoint": { "hasEmail": "mailto:alison.gerken@usda.gov", "fn": "Gerken, Alison R." }, "programCode": [ "005:040" ], "description": "The work completed here assessed the repellency behavior of different essential oils on the red flour beetle, Tribolium castaneum. The goal was to understand how non-chemical and naturally occurring oils could serve as repellents to stored product insect pests, leading to lower risk integrated pest management techniques. The work assessed 15 different oils for initial repellency in a small wind tunnel assay and performed further repellency assays on 7 that showed some potential in repelling the insects. Other assays used on the 7 potential oils were a larger wind tunnel assay, a bin assay that assessed taxis to the oil, and an overall behavioral assay that assessed distance moved, speed, and angular turning in the presence of the oil. We found inconsistent results of repellency of these oils, but a significant impact of the oils and whether red flour beetles were by themselves or in groups. The data provided here detail proximity to the oil for the small and large wind tunnel and the bin assays as well as distance metrics as calculated by the behavioral tracking program Ethovision XT.
Small wind tunnel data: treatment (oil or water), close = number of individuals close to the treatment, far = number of individuals far from the treatment, experiment = group or individual.
Large wind tunnel data: treatment (oil or water), S = number of individuals at stimulus edge, NS = no response, A = Away from treatment, B = close to tunnel.
Ethovision Data: rep = replicate beetle, all treatments are across the top, ethovision_output = identity of Ethovision calculation.
Bin Taxis: Treatment = repellent oil present, close = near oil, far = away from oil, oil_pair = what the control was paired with (for oils it is just repeated), time = duration of exposure.
", "title": "Data from: Challenges in assessing repellency as an integrated pest management tool to protect stored grains, using the global pest Tribolium castaneum", "distribution": [ { "@type": "dcat:Distribution", "downloadURL": "https://ndownloader.figshare.com/files/44862250", "format": "xlsx", "mediaType": "application/vnd.openxmlformats-officedocument.spreadsheetml.sheet", "title": "large wind tunnel_data.xlsx" }, { "@type": "dcat:Distribution", "downloadURL": "https://ndownloader.figshare.com/files/44862253", "format": "xlsx", "mediaType": "application/vnd.openxmlformats-officedocument.spreadsheetml.sheet", "title": "bin taxis_data.xlsx" }, { "@type": "dcat:Distribution", "downloadURL": "https://ndownloader.figshare.com/files/45262138", "format": "xlsx", "mediaType": "application/vnd.openxmlformats-officedocument.spreadsheetml.sheet", "title": "ethovision_all_data.xlsx" }, { "@type": "dcat:Distribution", "downloadURL": "https://ndownloader.figshare.com/files/45262213", "format": "xlsx", "mediaType": "application/vnd.openxmlformats-officedocument.spreadsheetml.sheet", "title": "small wind tunnel_data.xlsx" } ], "license": "https://creativecommons.org/licenses/by/4.0/", "bureauCode": [ "005:18" ], "modified": "2024-04-05", "publisher": { "@type": "org:Organization", "name": "Agricultural Research Service" }, "accrualPeriodicity": "irregular", "keyword": [ "repellency behaviour", "stored product insect", "volatile choice", "Integrated pest management (IPM)", "essential oils" ] }, { "identifier": "10.15482/USDA.ADC/1256513", "accessLevel": "public", "contactPoint": { "hasEmail": "mailto:curt.vantassell@usda.gov", "fn": "Van Tassell, Curtis P." }, "programCode": [ "005:040" ], "description": "Aggregate means for six traits (milk, fat, and protein yields, somatic cell score, length of productive life, and daughter pregnancy rate)
Resource Title: Holstein Milk Yield.
File Name: HO_M.csv
Resource Description: Aggregate means of Holstein predicted breeding values for milk yield and birth dates
Resource Title: Holstein Fat Yield.
File Name: HO_f.csv
Resource Description: Aggregate means of Holstein predicted breeding values for fat yield and birth dates
Resource Title: Holstein Protein Yield.
File Name: HO_p.csv
Resource Description: Aggregate means of Holstein predicted breeding values for protein yield and birth dates
Resource Title: Holstein Somatic Cell Score.
File Name: HO_scs.csv
Resource Description: Aggregate means of Holstein predicted breeding values for somatic cell score and birth dates
Resource Title: Holstein Productive Life.
File Name: HO_pl.csv
Resource Description: Aggregate means of Holstein predicted breeding values for productive life and birth dates
Resource Title: Holstein Daughter Pregnancy Rate.
File Name: HO_DPR.csv
Resource Description: Aggregate means of Holstein predicted breeding values for daughter pregnancy rate and birth dates
Resource Title: Data Dictionary.
File Name: data_dictionary.csv
Resource Description: Defines variables / sub-components with examples as used in column headers. Filenames:
\nThese data come from a roughly 4-year study on the growth response of a highly invasive woody plant to the damage induced by its biological control agent (an insect) and to soil fertilizer levels. The study design was an interrupted time series in which data were collected from plants for 2 years (\"pre\"), agents were introduced, and data collection continued for 2 years with sustained agent releases (\"post\"). Each month, stem tip counts and other measurements were collected from roughly 200 plants: 100 in each of two garden plots (IPRL and UF/IRREC). As plants grew larger (eventually to ~250 cm tall), data collection was spaced to roughly every 2 months and some replicates within each treatment were dropped. In addition to the \"interruption\" of introducing the agents, the other treatment was the addition of various concentrations of liquid fertilizer to the soil throughout the study. While there were no control plants that did not receive insects, each plant was followed over the course of the pre-post design experiment and Bayesian mixed modelling was used to interpret the effect of releasing the insect on how plant growth parameters changed over time and under different fertilizer levels. We have included raw data in .csv and .xlsx formats, one set for each garden plot as plots were analyzed separately. The Excel files have notes in the header column providing more information about each variable. However, not all variables were analyzed in the published study. The R code is also attached, which runs the Bayesian analyses for each plot and each response variable of interest in the published study. Raw data are also provided for soil and foliar nitrogen content. Soil nitrogen was analyzed at both plots, but foliar nitrogen was only analyzed at one of the plots (IPRL).
", "title": "Data from: Changes in plant architecture in Brazilian peppertree damaged by the biological control agent, Pseudophilothrips ichini Hood (Thysanoptera: Phlaeothripidae)", "distribution": [ { "@type": "dcat:Distribution", "downloadURL": "https://ndownloader.figshare.com/files/43593159", "format": "csv", "mediaType": "text/plain", "title": "All_UF.csv" }, { "@type": "dcat:Distribution", "downloadURL": "https://ndownloader.figshare.com/files/43593162", "format": "R", "mediaType": "text/plain", "title": "BayesianMixedModelIPRL.R" }, { "@type": "dcat:Distribution", "downloadURL": "https://ndownloader.figshare.com/files/43593165", "format": "R", "mediaType": "text/plain", "title": "BayesianMixedModelUF.R" }, { "@type": "dcat:Distribution", "downloadURL": "https://ndownloader.figshare.com/files/43593168", "format": "csv", "mediaType": "text/plain", "title": "IPRL CHN leaves stems.csv" }, { "@type": "dcat:Distribution", "downloadURL": "https://ndownloader.figshare.com/files/43593171", "format": "csv", "mediaType": "text/plain", "title": "soil.csv" }, { "@type": "dcat:Distribution", "downloadURL": "https://ndownloader.figshare.com/files/43593174", "format": "csv", "mediaType": "text/plain", "title": "All_IPRL.csv" }, { "@type": "dcat:Distribution", "downloadURL": "https://ndownloader.figshare.com/files/43612581", "format": "xlsx", "mediaType": "application/vnd.openxmlformats-officedocument.spreadsheetml.sheet", "title": "All_IRREC.xlsx" }, { "@type": "dcat:Distribution", "downloadURL": "https://ndownloader.figshare.com/files/43612584", "format": "xlsx", "mediaType": "application/vnd.openxmlformats-officedocument.spreadsheetml.sheet", "title": "All_IPRL.xlsx" } ], "license": "https://www.usa.gov/publicdomain/label/1.0/", "bureauCode": [ "005:18" ], "modified": "2023-12-27", "publisher": { "@type": "org:Organization", "name": "Agricultural Research Service" }, "accrualPeriodicity": "R/P1M", "keyword": [ "plant demography", "foliar nitrogen (N)", "interrupted time series study", "Bayesian mixed model", "stem tip mortality", "stem tip density" ] }, { "identifier": "10.15482/USDA.ADC/1461648", "accessLevel": "public", "contactPoint": { "hasEmail": "mailto:meg.allen@usda.gov", "fn": "Allen, Margaret L." }, "programCode": [ "005:040" ], "description": "Expressed genes from two individual sibling specimens of Coleomegilla maculata (Coleoptera: Coccinellidae). One individual was fed only insect eggs as an adult, and one was fed only pollen as an adult. Two sequenced samples, total RNA from a single individual adult specimen of Coleomegilla maculata, a beneficial lady beetle common in agroecosystems and native to North America. One sample was an adult fed only insect eggs (carnivore diet) and one sample was an adult fed only pollen (plant-based diet); insects were reared from the same egg mass (siblings), fed identical diet while in larval stage.
\nBioProject: Coleomegilla maculata strain:inbred Mississippi Transcriptome or Gene expression\nTaxonomy: Coleomegilla maculata\nProject data type: Transcriptome or Gene expression\nScope: Multiisolate\nUS Department of Agriculture\nAccession: PRJNA236444\nID: 236444
Resource Title: Total RNA from individual adult fed only eggs as adult; first one of two files (paired Illumina)..
File Name: filtered_LEO_TGACCA_L002_R1fastq.gz
Resource Description: Two sequenced samples, total RNA from a single individual adult specimen of Coleomegilla maculata, a beneficial lady beetle common in agroecosystems and native to North America. One sample was an adult fed only insect eggs (carnivore diet) and one sample was an adult fed only pollen (plant-based diet); insects were reared from the same egg mass (siblings), fed identical diet while in larval stage.\nBioProject: Coleomegilla maculata strain:inbred Mississippi Transcriptome or Gene expression\nTaxonomy: Coleomegilla maculata\nProject data type: Transcriptome or Gene expression\nScope: Multiisolate\nUS Department of Agriculture\nAccession: PRJNA236444\nID: 236444\nColeomegilla maculata (Coleoptera: Coccinellidae). Common name unassigned, but commonly referred to as Pink Lady Beetle. Native to North America, widespread. Beneficial insect that feeds on spider mites, Lepidoptera eggs, eggs of Colorado potato beetle and many others.
Resource Title: Total RNA sequences from single adult C. maculata fed insect eggs as adult. Second of two (paired Illumina) files..
File Name: filtered_LEO_TGACCA_L002_R2fastq.gz
Resource Description: Two sequenced samples, total RNA from a single individual adult specimen of Coleomegilla maculata, a beneficial lady beetle common in agroecosystems and native to North America. One sample was an adult fed only insect eggs (carnivore diet) and one sample was an adult fed only pollen (plant-based diet); insects were reared from the same egg mass (siblings), fed identical diet while in larval stage.\nBioProject: Coleomegilla maculata strain:inbred Mississippi Transcriptome or Gene expression\nTaxonomy: Coleomegilla maculata\nProject data type: Transcriptome or Gene expression\nScope: Multiisolate\nUS Department of Agriculture\nAccession: PRJNA236444\nID: 236444\nColeomegilla maculata (Coleoptera: Coccinellidae). Common name unassigned, but commonly referred to as Pink Lady Beetle. Native to North America, widespread. Beneficial insect that feeds on spider mites, Lepidoptera eggs, eggs of Colorado potato beetle and many others. Sequenced by U. of Wash http://www.htseq.org/
Resource Title: Total RNA sequenced from one adult lady beetle fed pollen as adult. First of two (paired Illumina) files..
File Name: filtered_PO_CGATGT_L002_R1fastq.gz
Resource Description: Two sequenced samples, total RNA from a single individual adult specimen of Coleomegilla maculata, a beneficial lady beetle common in agroecosystems and native to North America. One sample was an adult fed only insect eggs (carnivore diet) and one sample was an adult fed only pollen (plant-based diet); insects were reared from the same egg mass (siblings), fed identical diet while in larval stage.\nBioProject: Coleomegilla maculata strain:inbred Mississippi Transcriptome or Gene expression\nTaxonomy: Coleomegilla maculata\nProject data type: Transcriptome or Gene expression\nScope: Multiisolate\nUS Department of Agriculture\nAccession: PRJNA236444\nID: 236444\nColeomegilla maculata (Coleoptera: Coccinellidae). Common name unassigned, but commonly referred to as Pink Lady Beetle. Native to North America, widespread. Beneficial insect that feeds on spider mites, Lepidoptera eggs, eggs of Colorado potato beetle and many others. Sequenced by U. of Wash http://www.htseq.org/
Resource Title: Total RNA from pollen-fed adult lady beetle. Second of two (paired Illumina) files..
File Name: filtered_PO_CGATGT_L002_R2fastq.gz
Resource Description: Two sequenced samples, total RNA from a single individual adult specimen of Coleomegilla maculata, a beneficial lady beetle common in agroecosystems and native to North America. One sample was an adult fed only insect eggs (carnivore diet) and one sample was an adult fed only pollen (plant-based diet); insects were reared from the same egg mass (siblings), fed identical diet while in larval stage.\nBioProject: Coleomegilla maculata strain:inbred Mississippi Transcriptome or Gene expression\nTaxonomy: Coleomegilla maculata\nProject data type: Transcriptome or Gene expression\nScope: Multiisolate\nUS Department of Agriculture\nAccession: PRJNA236444\nID: 236444
Data collected from Phenotypic Microarray (PM) plates PM01 and PM02, using an Omnilog system for the characterization of four species of Levilactobacillus brevis autochthonous to commercial cucumber fermentations and two ATCC reference strains, ATCC14869 and ATCC367. Each PM plate was duplicated for each isolate and the cells were prepared as suggested by the manufacturer. Omnilog data is the result of a screening and phenotypes should be confirmed using conditions that mimic the habitat of interest. This dataset was generated for scientific research purpose only. The Levilactobacillus brevis isolates included in this dataset have publicly available genome sequences described in the Microbiology Resource Announcement peer reviewed journal.
\nResources in this dataset:
\nData from publication characterizing two commercially available cricket protein powders and their impact on the molecular weight distribution when incorporated into wheat dough.
\nData collected from duplicate laboratory analysis of protein composition of cricket protein powders, wheat flour, and wheat dough mixed with cricket protein powders. Samples were analyzed using gel electrophoresis and size exclusion chromatography along with differential solubility. Samples were analyzed to determine the effect of cricket protein powder on the solubility and molecular weight of wheat flour proteins when mixed into a dough.
\nResources in this dataset:
\nResource Title: Readme.txt file\nFile Name: ReadMe.txt\nResource Description: Description of data included.
\nResource Title: Figure 1. Size exclusion chromatographs of cricket protein powders\nFile Name: Figure1.JPG\nResource Description: Graph of size exclusion chromatographs of cricket protein powders
\nResource Title: Figure 2: Size exclusion chromatographs of wheat flour and cricket protein powder fractions.\nFile Name: Figure2.JPG\nResource Description: Size exclusion chromatographs of soluble and insoluble protein fractions from cricket powder and wheat flour. Both with disulfide bonds reduced (\"reduced\") and intact (\"unreduced\").
\nResource Title: SDS page analysis of wheat flour and cricket protein powders\nFile Name: Figure3.JPG\nResource Description: Photograph of an SDS-PAGE gel showing separation of proteins extracted from wheat flour and two commercially available cricket protein powders
\nResource Title: Data definitions for SEC peak area data file\nFile Name: data definitions.txt\nResource Description: File contains abbreviation list for SEC peak area data file
\nResource Title: SEC peak area data\nFile Name: SEC peak area data.csv\nResource Description: Data file of SEC peak areas
\nThis is USDA-ARS data from the publication, \"Characterization of particle size distributions and water-soluble ions in particulate matter measured at a broiler farm.\" This study was conducted in June of 2018. Data included here are from several measurements:
\nResources in this dataset:
\nResource Title: Ammonia Sensor Measurements\nFile Name: SensorNH3.txt
\nResource Title: Optical Particle Counter 1\nFile Name: OpticalParticleCounter1.txt
\nResource Title: Optical Particle Counter 2\nFile Name: OpticalParticleCounter2.txt
\nResource Title: Scanning Mobility Particle Sizer Data (Matrix)\nFile Name: SMPS Data.txt
\nResource Title: Scanning Mobility Particle Sizer Axes\nFile Name: SMPS Axes.txt
\nResource Title: AIM Particulate Chemical Composition\nFile Name: AIM Composition.txt
\nWithin this dataset:
\nLinum lewisii, a perennial blue flax native to North America, holds potential as a sustainable perennial crop for oilseed production due to its ecological adaptability, upright harvestable structure, nutritious seeds, and low insect and disease issues. Its native distribution spans a large geographic range, from the Pacific Coast to the Mississippi River, and from Alaska to Baja California. Tolerant to cold and drought conditions, this species is also important for native ecosystem rehabilitation. Its enhancement of soil health, support for pollinators, and carbon sequestration underscore its agricultural relevance.
\nThis study presents a high-quality, chromosome-scale assembly of the L. lewisii (2n = 2x = 18) genome, derived from PacBio HiFi and Dovetail Omni-C sequencing of the “Maple Grove” variety. The initial assembly contained 642,903,787 base pairs across 2,924 scaffolds. Following HiRise scaffolding, the final assembly contained 643,041,835 base pairs, across 1,713 scaffolds, yielding an N50 contig length of 66,209,717 base pairs. Annotation of the assembly revealed 38,808 genes, including 37,599 protein-coding genes and 7,108 putative transposable elements. Analysis of synteny with other flax species revealed a striking number of chromosomal rearrangements. We also found an intriguing absence of the single-copy TSS1 gene in the L. lewisii genome, potentially linked to its transition from heterostyly to homostyly.
\nTaken together, these findings represent a significant advancement in our understanding of the Linum genus and provide a resource for future domestication efforts and basic research on Lewis flax.
", "title": "Data from: Chromosome-scale Genome Assembly of Lewis Flax (Linum lewisii Pursh.)", "distribution": [ { "@type": "dcat:Distribution", "downloadURL": "https://ndownloader.figshare.com/files/44541020", "format": "gz", "mediaType": "application/gzip", "title": "NDSU_LiLewi_1.0.fasta.gz" }, { "@type": "dcat:Distribution", "downloadURL": "https://ndownloader.figshare.com/files/44541023", "format": "gz", "mediaType": "application/gzip", "title": "NDSU_LiLewi_1.0.annotation.gff_.gz" }, { "@type": "dcat:Distribution", "downloadURL": "https://ndownloader.figshare.com/files/44541026", "format": "gz", "mediaType": "application/gzip", "title": "preflower-tissue_R1_001.fastq.gz" }, { "@type": "dcat:Distribution", "downloadURL": "https://ndownloader.figshare.com/files/44541044", "format": "gz", "mediaType": "application/gzip", "title": "preflower-tissue_R2_001.fastq.gz" }, { "@type": "dcat:Distribution", "downloadURL": "https://ndownloader.figshare.com/files/44541062", "format": "gz", "mediaType": "application/gzip", "title": "post-flower-tissue_R1_001.fastq.gz" }, { "@type": "dcat:Distribution", "downloadURL": "https://ndownloader.figshare.com/files/44541065", "format": "gz", "mediaType": "application/gzip", "title": "post-flower-tissue_R2_001.fastq.gz" }, { "@type": "dcat:Distribution", "downloadURL": "https://ndownloader.figshare.com/files/44541074", "format": "gz", "mediaType": "application/gzip", "title": "light-seedlings_R1_001.fastq.gz" }, { "@type": "dcat:Distribution", "downloadURL": "https://ndownloader.figshare.com/files/44541086", "format": "gz", "mediaType": "application/gzip", "title": "light-seedlings_R2_001.fastq.gz" }, { "@type": "dcat:Distribution", "downloadURL": "https://ndownloader.figshare.com/files/44541089", "format": "gz", "mediaType": "application/gzip", "title": "dark-seedlings_R1_001.fastq.gz" }, { "@type": "dcat:Distribution", "downloadURL": "https://ndownloader.figshare.com/files/44541110", "format": "gz", "mediaType": "application/gzip", "title": "dark-seedlings_R2_001.fastq.gz" }, { "@type": "dcat:Distribution", "downloadURL": "https://ndownloader.figshare.com/files/44541119", "format": "gz", "mediaType": "application/gzip", "title": "flower-tissue_R1_001.fastq.gz" }, { "@type": "dcat:Distribution", "downloadURL": "https://ndownloader.figshare.com/files/44541125", "format": "gz", "mediaType": "application/gzip", "title": "flower-tissue_R2_001.fastq.gz" }, { "@type": "dcat:Distribution", "downloadURL": "https://ndownloader.figshare.com/files/44541134", "format": "gz", "mediaType": "application/gzip", "title": "cold-meristem_R1_001.fastq.gz" }, { "@type": "dcat:Distribution", "downloadURL": "https://ndownloader.figshare.com/files/44541152", "format": "gz", "mediaType": "application/gzip", "title": "cold-meristem_R2_001.fastq.gz" }, { "@type": "dcat:Distribution", "downloadURL": "https://ndownloader.figshare.com/files/44541158", "format": "gz", "mediaType": "application/zip", "title": "DTG-OmniC-232_R1_001.fastq.gz" }, { "@type": "dcat:Distribution", "downloadURL": "https://ndownloader.figshare.com/files/44541167", "format": "gz", "mediaType": "application/zip", "title": "DTG-OmniC-232_R2_001.fastq.gz" } ], "license": "https://www.usa.gov/publicdomain/label/1.0/", "bureauCode": [ "005:18" ], "modified": "2024-02-14", "publisher": { "@type": "org:Organization", "name": "Agricultural Research Service" }, "accrualPeriodicity": "irregular", "keyword": [ "Linum", "S-Locus", "perennials", "oilseed crop", "genome assembly", "HiRise scaffolding", "gene annotation", "transposable elements", "mating system evolution", "heterostyly", "homostyly", "crop domestication", "sustainable agriculture", "NP301", "data.gov", "ARS" ], "spatial": "{\"type\": \"Point\", \"coordinates\": [-113.11111450195, 39.035886280382]}" }, { "identifier": "10.15482/USDA.ADC/1429061", "accessLevel": "public", "contactPoint": { "hasEmail": "mailto:joanne.crouch@ars.usda.gov", "fn": "Crouch, Jo Anne" }, "programCode": [ "005:040" ], "description": "Dollar spot is one of the most destructive globally distributed diseases of turfgrass. The identity of the fungus responsible for the disease has been the subject of debate for more than 75 years. These datasets provide the phylogenetic evidence from three nucleotide sequence markers (CaM, ITS and Mcm7) that underlie the establishment of the new fungal genus Clarireedia, which includes four species that cause turfgrass dollar spot disease: Clarireedia homoeocarpa, C. bennettii, C. jacksonii, and C. monteithiana. Datasets include the DNA sequence alignments for the CaM, ITS and Mcm7 markers for exemplar Clarireedia isolates, and the complete combined phylogenetic dataset and phylogenetic tree file.
Resource Title: DNA sequence alignment, combined dataset.
File Name: Allgenes_alignment.txt
Resource Title: Phylogenetic tree file.
File Name: Allgenes_phylogenyMrBayes.nex.con.tre.txt
Resource Description: Derived from analysis of DNA sequence alignment
Resource Title: DNA sequence alignment of CaM marker for dollar spot fungi exemplars.
File Name: CaM_DS_diagnostic sites.txt
Resource Title: DNA sequence alignment of ITS marker for dollar spot fungi exemplars.
File Name: ITS_DS_diagnostic sites.txt
Resource Title: DNA sequence alignment of Mcm7 marker for dollar spot fungi exemplars.
File Name: Mcm7_DS_diagnostic sites.txt
The scope and complexity of interactions within community food webs necessitates their simplification to a community module scale for conducting empirical studies. An outdoor mesocosm study in the USA quantified the strengths of direct and indirect interactions between two herbivore congeners that fed on two aquatic plant species while sharing a parasitoid. Kalopolynema ema (Hymenoptera: Mymaridae) is a stenophagous native egg parasitoid that attacks the hemipteran species in this study, Megamelus davisi (Hemiptera: Delphacidae), a native herbivore that feeds on the native aquatic species Nuphar advena, and the introduced biological control agent Megamelus scutellaris (Hemiptera: Delphacidae) that feeds on the non-native aquatic species waterhyacinth, Pontederia crassipes. The presence of M. scutellaris did not significantly increase parasitism of M. davisi indicating that apparent competition was not a factor in this community module. There was no evidence of any trophic cascades caused by these interactions based on the relative growth rates of biomass and leaf area for both plant species. The relative strengths of interactions varied with herbivore densities suggesting that should negative indirect effects occur they would likely be transient and closely linked to population dynamics as influenced by abiotic factors like temperature. The primary negative interaction was biotic resistance to Megamelus scutellaris from attack by Kalopolynema ema. Despite identifying potential negative interactions using path analysis, we saw no apparent competition following the insertion of a weed biological control agent into a community that contains an ecological analog.
Resource Title: Indirect Effects SS mesocosm .
File Name: MS Indirect Data Commons version.xlsx
Resource Description: Raw data from MS Indirect study in mesocosms. NA = Nuphar advena, WH = Pontederia crassipes, MD = Megamelus davisi, MS = M. scutellaris., KE = Kalopolynema ema, BGBM = below ground biomass.
737 PI accessions from the US Department of Agriculture, Agricultural Research Service Sweetpotato Collection were grown in the field and in greenhouse pots, and storage roots were harvested. The periderm (skin) and stele (flesh) of storage roots were measured using a Konica Minolta Chroma Meter (CR 400, Konica Minolta, Inc., Tokyo, Japan), and data were recorded using the CIE 1976 Lab and CIE LCh color spaces. Data from this study is contained in a manuscript that will be submitted to Genetic Resources and Crop Evolution under the title \"Color Analysis of Storage Roots from the USDA, ARS Sweetpotato Germplasm Collection.\" Data parameters presented are lightness (L), red-green coordinate (a), yellow-blue coordinate (b), color intensity or chroma (C), and hue angle (H*). Also included in this data set are percentage dry matter and root densities as these data are correlated to color values.
Resource Title: Sweetpotato Periderm-Field.
File Name: Sweetpotato-Periderm-Field.xlsx
Resource Description: Colorimeter data for the periderm of field-grown sweetpotato storage roots
Resource Title: Sweetpotato Periderm - Pots.
File Name: Sweetpotato-Periderm-Pots.xlsx
Resource Description: Colorimeter data for the periderm of pot-grown sweetpotato storage roots
Resource Title: Sweetpotato Stele - Field.
File Name: Sweetpotato-Stele-Field.xlsx
Resource Description: Colorimeter data for the stele of field-grown sweetpotato storage roots
Resource Title: Sweetpotato Stele - Pots.
File Name: Sweetpotato-Stele-Pots.xlsx
Resource Description: Colorimeter data for the stele of pot-grown sweetpotato storage roots
Resource Title: Sweetpotato Dry Weights - Field.
File Name: Sweetpotato-DryWt-Field.xlsx
Resource Description: Dry weight and root density data for the stele of field-grown sweetpotato storage roots
Resource Title: Sweetpotato Periderm - Summary Table.
File Name: Sweetpotato-Periderm-Summary Table.xlsx
Resource Description: Colorimeter and dry weight summaries for the periderm of field-grown and pot-grown sweetpotato storage roots
Resource Title: Sweetpotato Stele - Summary Table.
File Name: Sweetpotato-Stele-Summary Table.xlsx
Resource Description: Colorimeter and dry weight summaries for the stele of field-grown and pot-grown sweetpotato storage roots
Resource Title: Sweetpotato Stele - Summary Table.
File Name: Sweetpotato-Stele-Summary Table.csv
Resource Description: CSV version of the data for Colorimeter and dry weight summaries for the stele of field-grown and pot-grown sweetpotato storage roots
\nResource Title: Sweetpotato Dry Weights - Field.
File Name: Sweetpotato-DryWt-Field.csv
Resource Description: CSV version of Dry weight and root density data for the stele of field-grown sweetpotato storage roots
\nResource Title: Sweetpotato Stele - Field.
File Name: Sweetpotato-Stele-Field.csv
Resource Description: CSV version of the Colorimeter data for the stele of field-grown sweetpotato storage roots
\nResource Title: Sweetpotato Periderm-Field.
File Name: Sweetpotato-Periderm-Field.csv
Resource Description: CSV version of Colorimeter data for the periderm of field-grown sweetpotato storage roots
\nResource Title: Data Dictionary - Color Analysis of Storage Roots from the USDA, ARS Sweetpotato Germplasm Collection.
File Name: sweetpotato_DD.csv
Resource Title: Sweetpotato Stele - Pots.
File Name: Sweetpotato-Stele-Pots.csv
Resource Description: CSV version of Colorimeter data for the stele of pot-grown sweetpotato storage roots
\nResource Title: Sweetpotato Periderm - Pots.
File Name: Sweetpotato-Periderm-Pots.csv
Resource Description: CSV version of Colorimeter data for the periderm of pot-grown sweetpotato storage roots
\nResource Title: Sweetpotato Periderm - Summary Table.
File Name: Sweetpotato-Periderm-Summary Table.csv
Resource Description: CSV version of data for Colorimeter and dry weight summaries for the periderm of field-grown and pot-grown sweetpotato storage roots
\nFor this study, 737 sweetpotato accessions were obtained from the USDA, ARS, PGRCU, Griffin, GA. Each PI was grown in the field in replicated plots at the U. S. Vegetable Laboratory, Charleston, SC. The mature leaves of each PI was collected and measured using a Konica Minolta Chroma Meter (CR 400). Data were recorded using CIE 1976 Lab and CIE LCh color spaces. Data from this study is contained in a manuscript that will be submitted to Genetic Resources and Crop Evolution under the title \"Color Analysis of Sweetpotato Leaves from the USDA, ARS Germplasm Collection.\" Data parameters collected were lightness (L), red-green coordinate (a), yellow-blue coordinate (b), color intensity or chroma (C), and hue angle (h*).
Resource Title: Sweetpotato Leaf Color - Raw Data (Mid-Season).
File Name: Sweetpotato-Leaf Color (Mid-Season)-Raw Field Data.xlsx
Resource Description: Raw colorimetry data from 737 sweetpotato PIs
Resource Title: Sweetpotato Leaf Color Data Summary (Mid-Season).
File Name: Sweetpotato-Leaf Color (Mid-Season)-Summary Table.xlsx
Resource Description: Summary table of sweetpotato leaf color data from mid-season
Resource Title: Sweetpotato Leaf Color - Raw Data (Late-Season).
File Name: Sweetpotato-Leaf Color (Late-Season Purple)-Raw Field Data.xlsx
Resource Description: Raw colorimetry data from late-season sweetpotato leaves
Resource Title: Sweetpotato Leaf Color Data Summary (Late-Season).
File Name: Sweetpotato-Leaf Color (Late-Season Purple)-Summary Table.xlsx
Resource Description: Summary table of late-season colorimetry data from sweetpotato leaves
Resource Title: Sweetpotato Leaf Color - Raw Data (Late Season).
File Name: Sweetpotato-Leaf Color (Late-Season Purple)-Raw Field Data.csv
Resource Description: Raw colorimetry data from late-season sweetpotato leaves
Resource Title: Sweetpotato Leaf Color Data Summary (Mid Season).
File Name: Sweetpotato-Leaf Color (Mid-Season)-Summary Table.csv
Resource Description: Summary table of sweetpotato leaf color data from mid-season
Resource Title: Sweetpotato Leaf Color Data Summary (Late Season).
File Name: Sweetpotato-Leaf Color (Late-Season Purple)-Summary Table.csv
Resource Description: Summary table of late-season colorimetry data from sweetpotato leaves
\nResource Title: Sweetpotato Leaf Color - Raw Data (Mid Season) .
File Name: Sweetpotato-Leaf Color (Mid-Season)-Raw Field Data.csv
Resource Description: Raw colorimetry data from 737 sweetpotato PIs
\nResource Title: Data Dictionary.
File Name: Data Dictionary.csv
Resource Title: Sweetpotato Clomazone Injury- Raw Data.
File Name: Sweetpotato-Clomazone Injury-Raw Data.xlsx
Resource Description: Injury (rated 1-7) caused by applications of clomazone to 564 sweetpotato accessions.
\n(Note: This information was added to the publication after the review process had begun and after the Ag Data Commons dataset had been published and DOI assigned)
Resource Title: Sweetpotato Clomazone Injury- Summary.
File Name: Sweetpotato-Clomazone Injury-Summary.xlsx
Resource Description: Summary of clomazone injury on 564 sweetpotato accessions.
\n(Note: This information was added to the publication after the review process had begun and after the Ag Data Commons dataset had been published and DOI assigned)
Resource Title: Sweetpotato Clomazone Injury- Raw Data .
File Name: Sweetpotato-Clomazone Injury-Raw Data.csv
Resource Description: Injury (rated 1-7) caused by applications of clomazone to 564 sweetpotato accessions.
\n(Note: This information was added to the publication after the review process had begun and after the Ag Data Commons dataset had been published and DOI assigned)
Resource Title: Sweetpotato Clomazone Injury- Summary.
File Name: Sweetpotato-Clomazone Injury-Summary.csv
Resource Description: Summary of clomazone injury on 564 sweetpotato accessions.
\n(Note: This information was added to the publication after the review process had begun and after the Ag Data Commons dataset had been published and DOI assigned)
Insect pollinator community data collected from three types of insect traps/collecting methods (colored pan traps, blue vane traps, targeted sweep netting) from four power line right of ways in Alabama. Data are from one growing season (May-October 2018), and collection methods were employed once per month. Data include: 1) insect pollinator community composition data; 2) relative diversity calculations by insect Order; 3) overall insect pollinator community diversity summary by trap type/collecting method and month. These data reflect the community as sampled through different means in the same time period.
\nResources in this dataset:
\nResource title: Insect Pollinator Community Composition Matrix\nFile name: Pollinator communty matrix.csv\nResource description: Pollinator community composition (taxon, abundance) by site, insect trap type, and season. See Supplemental Table 1 in Campbell et al. 2023 for detailed taxa information.
\nResource title: Insect Pollinator Community Diversity by Order\nFile name: Pollinator community diversity by Order.csv\nResource description: Insect Pollinator community diversity metrics separated by Order for each site, for each insect trap type and season.
\nResource title: Summary of Overall Insect Pollinator Community Diversity\nFile name: Overall Pollinator community diversity.csv\nResource description: Overall Insect Pollinator community diversity summarized by trap type and season.
\nResource title: Dataset key\nFile name: Dataset key table.pdf\nResource description: Column titles and variable descriptions for three datasets, of: 1) Pollinator Community Composition; 2) Pollinator Community Diversity by Order; and 3) Overall Pollinator Community Diversity summarized by Trap Type and Season
\nWe compared all combinations of three commercial traps and five different attractants on the capture of stored-product insects for two consecutive years in three food processing facilities in Central Greece. Specifically, Facility 1 and 2 were pasta factories and Facility 3 was a flour mill. The traps that were used in the experiments were Dome Trap (Trécé Inc., USA), Wall Trap (Trécé Inc., USA) and Box Trap (Insects Limited, Ltd., USA). The attractants that were evaluated were 0.13 g of : 1) of PantryPatrol gel (Insects Limited, Inc., USA), 2) Storgard kairomone food attractant oil (Trece Inc.), 3) wheat germ (Honeyville, USA), 4) Dermestid tablet attractant (Insects Limited Inc., USA). The traps were inspected approximately every 15 days and rotated clockwise. The captured insects were transferred to the Laboratory of Entomology and Agricultural Zoology (LEAZ) at University of Thessaly for identification. The results indicated that there was a wide range of species within the three facilities throughout the trapping period, with the Indian meal moth, Plodia interpunctella (Hübner), the red flour beetle, Tribolium castaneum (Herbst) and the cigarette beetle, Lasioderma serricorne (F.), being the most abundant. Although there were noticeable differences among the different traps and attractants for the capture of certain species, all combinations provided comparable population fluctuation patterns. In general, Dome traps, baited with either the oil or the gel, were found to be the most effective.
\nThere are not much data available so far for the simultaneous comparable use of different trapping devices and different attractants in commercial facilities for long-term monitoring. Certain lures are marketed toward particular pests or classes of pests, while others might be more generic, multi-species lures. To shed light on this issue, we evaluated a series of combinations of floor traps and attractants, in three commercial facilities in Greece, for a period of two years. Our questions included both which trap was broadly most effective as well as whether different combinations of traps and types of attractants were delivering novel information about the stored product insect community. The traps include two types of floor traps, and the wall trap used in the USDA khapra beetle detection programs. The lures included the Insects Limited ™ dermestid tab that is more specifically focused on food kairomones for only that taxon, and the same company’s PantryPatrol gel, which uses wheat kairomones and the pheromones of multiple species, including dermestids. We also use the Trécé Storgard kairomone oil, and simple wheat germ, which are both multi-species kairomones with no pheromones.
\nResources in this dataset:
\nResource Title: 2018 and 2019 field trapping data
\nFile Name: kb_greek_data_ag_data_commons.csv
\nResource Description:
\n2.1 Storage facilities: The storage facilities in which this study took place are located in Central Greece. The selection of these facilities was based on their size, the accessibility from University of Thessaly (UTH) personnel and the known historical presence of stored product insect species and other arthropods. The sampling was conducted in three types of storage facilities refereed as Facility 1, Facility 2 and Facility 3. Facilities 1 and 2 are pasta factories, with substantial quantities of soft and hard wheat, flour and bran, but also some barley and maize, while Facility 3 is a flour mill, mostly focused on soft wheat processing. The deployment of the traps on each facility was conducted at 18 June 2018, 4 July 2018, and 3 July 2018 for Facility 1, 2 and 3, respectively.
\n2.2. Traps, attractants and inspection: The trap types that were used in our experiments were Dome Trap (Trécé Inc., USA), Wall Trap (Trécé Inc., USA) and Box Trap (Insects Limited, Ltd., USA). These traps have been proven effective for monitoring purposes based on previous studies (Toews et al., 2009; Athanassiou and Arthur, 2018; Gerken and Campbell, 2021). Four attractants (noted also as lures) were used in our experiments, which were 0.13 g: 1) PantryPatrol gel (gel, Insects Limited, Inc., USA), 2) Storgard™ Oil kairomone food attractant (oil, Trécé Inc.), 3) wheat germ (WG, Honeyville, USA), 4) Dermestid tablet attractant (bait, Insects Limited Inc., USA). Also, an additional series of traps was used without any attractant, and served as “control” (e.g., ctrl). In Facility 1, the different traps and attractant combinations were replicated two times. In Facilities 2 and 3, the combinations were replicated three times, based on larger space availability. For each Facility, the traps were inspected approx. every 15 days, with the exception of some intervals where access to the trapping areas was not possible (e.g. due to fumigations in certain areas etc.). The traps were rotated clockwise after each inspection. The attractants were replaced at 15-day intervals, while the traps were replaced whenever it was considered necessary (damaged or lost traps). All captured insects were transferred to the Laboratory of Entomology and Agricultural Zoology (LEAZ), Department of Agriculture, Crop Protection and Rural Environment, University of Thessaly.
\n2.3 Identification: The morphological identification of the captured individuals was carried out up to the species level, or lowest taxonomic unit, whenever this was possible using taxonomic keys, but in general many specimens are referred to as taxa. The insects found were classified into species (species identification) using different taxonomic keys (Bousquet, 1990; Peacock, 1993; USDA 1991).
\nData dictionary: rfb = red flour beetle cfb = confused flour beetle hfb = hairy fungus beetle lgb = lesser grain borer stgb = saw-toothed grain beetle cb = cigarette beetle rw = rice weevil gw = granary weevil imm = indianmeal moth rgb = rusty grain beetle trogoderma = dermestid genus
\n
These data were generated to evaluate the effects of compound hydroclimatic extremes – a deluge during drought – on production and carbon cycling in a semi-arid (shortgrass steppe) grassland in Colorado (USA). The study experimentally imposed an extreme drought and then interrupted this drought with either a single extreme deluge event or the equivalent amount of precipitation provided in several smaller events. This design, focused on how the combined effects of extreme drought and deluge altered productivity and carbon cycling relative to a control treatment receiving ambient rainfall and a drought treatment that received an equal amount of precipitation delivered as events more typical of contemporary rainfall regimes.
\nResearch was conducted at the 6,500 ha USDA-Central Plains Experimental Range (CPER), which is part of the Long-Term Agroecosystem Research network (LTAR; 2012-present; https://ltar.ars.usda.gov/), a former Long-Term Ecological Research station (LTER, 1983-2012), and located in the shortgrass steppe of north-central Colorado, USA. Additional information and referenced materials about many of the long-term studies initiated on the CPER can be found: https://dx.doi.org/10.25675/10217/81141.
\nDuring the 2019 growing season (May-Aug), four precipitation treatments were randomly assigned to forty 1 m^2 plots spaced 2 m apart (n = 10 per precipitation treatment). Precipitation was excluded during the growing season by installing clear plastic roofs (2.2 x 2.2 m) over each plot and then added water to simulate four precipitation treatments: 1. a control treatment (“CON”; based on the exact pattern and amount that occurred at the site in 1989 – a year with an average precipitation regime, see below), 2. a drought treatment (“DRT”; a 77.5% reduction in each event added to the control plots), 3. a drought plus deluge treatment (“DRT+DEL”; the DRT treatment with a 60 mm deluge added mid-July) and 4. a drought plus small events treatment (“DRT+SE”; the DRT treatment, with a total of 60 mm of precipitation added to nine events from mid-July through mid-August).
\nOver the course of the experiment, four response variables were measured: soil moisture, greenness, carbon fluxes, and productivity. Soil moisture was measured weekly from 0-100 cm at 10 cm increments using a Sentek Diviner probe on a subset of plots (n=3 per treatment), using a site-based calibration to calculate volumetric water content. Weekly plot canopy greenness was estimated using repeat digital photography, by calculating the average green chromatic coordinates (GCC) of the pixels in each photograph. Carbon flux measurements were conducted on a subset of plots (n = 5) using a custom portable flux chamber (0.5 x 0.5 x 0.5 m) attached to a LI-6400. During each measurement, data were logged over a 2 min period to collect the light measurement (net ecosystem exchange; NEE), then the chamber was vented for 7 sec and another measurement was taken during a 2 min period of darkness imposed by an opaque chamber cover (ecosystem respiration; ER). After collection, the data were processed, and the last 30 sec of the measurement were averaged to produce a single value for NEE and ER per measurement. Gross primary production (GPP) was calculated as GPP = NEE – ER. Aboveground net primary production (ANPP) was measured in all plots (n = 10 per treatment) at the end of the growing season (mid-September). In each plot, all plant material from two 0.1 m^2 subplots was harvested to ground height. Belowground net primary production (BNPP) was estimated as fine root mass production measured using root ingrowth cores. Net primary production (NPP) was estimated by summing ANPP and BNPP from each plot.
Resource Title: Experimental precipitation.
File Name: CPER-DEX_Precipitation.csv
Resource Title: Data Dictionary for Experimental Precipitation.
File Name: CPER-DEX_Precipitation_DataDictionary.csv
Resource Title: Experimental Soil Moisture.
File Name: CPER-DEX_SoilMoisture.csv
Resource Title: Data Dictionary for Experimental Soil Moisture.
File Name: CPER-DEX_SoilMoisture_DataDictionary.csv
Resource Title: Experimental Greenness.
File Name: CPER-DEX_Greenness.csv
Resource Title: Data Dictionary for Experimental Greenness.
File Name: CPER-DEX_Greenness_DataDictionary.csv
Resource Title: Experimental Carbon Fluxes.
File Name: CPER-DEX_CarbonFluxes.csv
Resource Title: Data Dictionary for Experimental Carbon Fluxes.
File Name: CPER-DEX_CarbonFluxes_DataDictionary.csv
Resource Title: Experimental Productivity.
File Name: CPER-DEX_Productivity.csv
Resource Title: Data Dictionary for Experimental Productivity.
File Name: CPER-DEX_Productivity_DataDictionary.csv
The data are the number and proportion of female weevils (Ceratapion basicorne) that oviposited after exposure to three different environmental hibernation conditions for three different durations (4, 8 and 11 weeks). The conditions were Greenhouse [ambient temperature and photoperiod], glass door Refrigerator [5°C and ambient photoperiod], and incubator [5°C and 24 h dark]).
Resource Title: Data from: Conditions to terminate reproductive diapause of a univoltine insect: Ceratapion basicorne (Coleoptera: Apionidae), a biological control agent of yellow starthistle.
File Name: Ceba_diapause.csv
Resource Description: The data are the number and proportion of female weevils (Ceratapion basicorne) that oviposited after exposure to three different environmental hibernation conditions for three different durations (4, 8 and 11 weeks). The conditions were Greenhouse [ambient temperature and photoperiod], glass door Refrigerator [5°C and ambient photoperiod], and incubator [5°C and 24 h dark]).
Resource Software Recommended: Microsoft Excel,url: https://www.microsoft.com/microsoft-365/excel
Resource Title: Meta data for: Conditions to terminate reproductive diapause of a univoltine insect: Ceratapion basicorne (Coleoptera: Apionidae), a biological control agent of yellow starthistle.
File Name: Ceba_diapause_meta.csv
Resource Description: Description of the meaning of the variables.
Resource Software Recommended: Microsoft Excel,url: https://www.microsoft.com/microsoft-365/excel
The ascomycete Neofusicoccum parvum, one of the causal agents of Botryosphaeria dieback, is a destructive wood‐infecting fungus and a serious threat to grape production worldwide. The capability to colonize woody tissue, combined with the secretion of phytotoxic compounds, is thought to underlie its pathogenicity and virulence. Here, we describe the repertoire of virulence factors and their transcriptional dynamics as the fungus feeds on different substrates and colonizes the woody stem. We assembled and annotated a highly contiguous genome using single‐molecule real‐time DNA sequencing. Transcriptome profiling by RNA sequencing determined the genome‐wide patterns of expression of virulence factors both in vitro (potato dextrose agar or medium amended with grape wood as substrate) and in planta. Pairwise statistical testing of differential expression, followed by co‐expression network analysis, revealed that physically clustered genes coding for putative virulence functions were induced depending on the substrate or stage of plant infection. Co‐expressed gene clusters were significantly enriched not only in genes associated with secondary metabolism, but also in those associated with cell wall degradation, suggesting that dynamic co‐regulation of transcriptional networks contributes to multiple aspects of N. parvum virulence. In most of the co‐expressed clusters, all genes shared at least a common motif in their promoter region, indicative of co‐regulation by the same transcription factor. Co‐expression analysis also identified chromatin regulators with correlated expression with inducible clusters of virulence factors, suggesting a complex, multi‐layered regulation of the virulence repertoire of N. parvum.
Resource Title: Link to Supporting Information.
File Name: Web Page, url: https://bsppjournals.onlinelibrary.wiley.com/doi/10.1111/mpp.12491#support-information-section
Link to Supporting Information at Molecular Plant Pathology. Files are:
\nAppendix S1 Supplementary tables and figures - Download
\nAppendix S2 Genome assemblies and protein‐coding gene coordinates - Download
\nAppendix S3 Functional annotations - Download Excel (.xlsx) file.
\nAppendix S4 Normalized RNA‐sequencing counts - Download\nNormalized RNA‐sequencing counts in the in vitro (A) and in planta (B) experiments, list of genes up‐regulated in the presence of wood (C) and exclusively expressed in planta (D), and groups of co‐expressed genes during Neofusicoccum parvum colonization obtained by both K‐means and hierarchical clustering analysis (E). Gene co‐expression modules obtained from Weighted Gene Co‐expression Network Analysis (WGCNA) and the corresponding degree of connectivity in the unweighted network (F), genomic clusters identified among the gene co‐expression modules (G), network properties of the gene co‐expression modules (H) and transcription factor‐coding genes and PHD finger domain‐containing protein genes identified among the most highly connected genes (5%) (I).
\nAppendix S5 Shared motifs showing similarity to yeast motifs - Download\nShared motifs showing similarity to yeast motifs (MacIsaac_v1 database) and Saccharomyces cerevisiae motifs and motif‐associated proteins (ScAPs) (SCPD database) (E < 1 and motif length ≤ 9) (A) and Neofusicoccum parvum protein homologues of ScAPs (B).
\nCropland expansion and reduced crop rotation diversity throughout the northern Great Plains has negatively impacted soil quality, creating a need to identify conservation practices that can counteract this trend. A study was conducted to quantify soil property responses to crop diversity/intensity, cover crops, and livestock integration under controlled experimental conditions, and land use (dryland cropping, native grassland, untilled pasture) on working farms and ranches, all on a common soil type in southcentral North Dakota, USA. Data from this study included near-surface (0-5 cm) measurements of soil physical, chemical, and biological properties over a 3-yr period for contrasting long-term experimental treatments at the USDA-ARS Northern Great Plains Research Laboratory, Mandan, North Dakota. Soil profile (0-100 cm) assessments of soil physical and chemical properties complemented near-surface measurements. Data were used to generate soil quality index scores using the Soil Management Assessment Framework. Annual spring wheat grain yields for experimental treatments complemented soils data. Similar evaluations were conducted on six on-farm sites in Emmons County, North Dakota, USA, but only for one year and without grain yield data. Data may be used to better understand soil property responses to cropland conservation practices and different land uses. Data are generally applicable to rainfed conditions under a semiarid Continental climate for Temvik-Wilton silt loams (fine silty, mixed, superactive, frigid Typic and Pachic Haplustolls) and associated soil types (i.e., Grassna, Linton, Mandan, and Williams).
Resource Title: SES_Data Dictionary.
File Name: SES_Data Dictionary.xlsx
Resource Title: SES_On-Farm_Integrative Measures_SMAF.
File Name: SES_On-Farm_Integrative Measures_SMAF.xlsx
Resource Title: SES_On-Farm_Soil Properties_Near Surface.
File Name: SES_On-Farm_Soil Properties_Near Surface.xlsx
Resource Title: SES_On-Farm_Soil Properties_Profile.
File Name: SES_On-Farm_Soil Properties_Profile.xlsx
Resource Title: SES_On Station_Integrative Measures_Crop Yield.
File Name: SES_On-Station_Integrative Measures_Crop Yield.xlsx
Resource Title: SES_On-Station_Integrative Measures_SMAF.
File Name: SES_On-Station_Integrative Measures_SMAF.xlsx
Resource Title: SES_On-Station_Soil Properties_Near Surface.
File Name: SES_On-Station_Soil Properties_Near Surface.xlsx
Resource Title: SES_On-Station_Soil Properties_Profile.
File Name: SES_On-Station_Soil Properties_Profile.xlsx
Resource Title: On-Farm_SMAF.
File Name: SES_On-Farm_Integrative Measures_SMAF.csv
Resource Title: On-Farm_SMAF_Metadata.
File Name: SES_On-Farm_Integrative Measures_SMAF_Metadata.csv
Resource Title: On-Farm_Surface.
File Name: SES_On-Farm_Soil Properties_Near Surface.csv
Resource Title: On-Farm_Surface_Metadata.
File Name: SES_On-Farm_Soil Properties_Near Surface_Metadata.csv
Resource Title: On-Farm_Profile.
File Name: SES_On-Farm_Soil Properties_Profile.csv
Resource Title: On-Farm_Profile_Metadata.
File Name: SES_On-Farm_Soil Properties_Profile_Metadata.csv
Resource Title: On-Station_Crop Yield.
File Name: SES_On-Station_Integrative Measures_Crop Yield.csv
Resource Title: On-Station_Crop Yield_Metadata.
File Name: SES_On-Station_Integrative Measures_Crop Yield_Metadata.csv
Resource Title: On-Station_SMAF.
File Name: SES_On-Station_Integrative Measures_SMAF.csv
Resource Title: On-Station_SMAF_Metadata.
File Name: SES_On-Station_Integrative Measures_SMAF_Metadata.csv
Resource Title: On-Station_Surface.
File Name: SES_On-Station_Soil Properties_Near Surface.csv
Resource Title: On-Station_Surface_Metadata.
File Name: SES_On-Station_Soil Properties_Near Surface_Metadata.csv
Resource Title: On-Station_Profile.
File Name: SES_On-Station_Soil Properties_Profile.csv
Resource Title: On-Station_Profile_Metadata.
File Name: SES_On-Station_Soil Properties_Profile_Metadata.csv
Resource Title: SES_Data Dictionary.
File Name: SES_Data Dictionary.csv
The American cranberry (Vaccinium macrocarpon Ait.) is a recently domesticated, economically important, fruit crop with limited molecular resources. New genetic resources could accelerate genetic gain in cranberry through characterization of its genomic structure and by enabling molecular-assisted breeding strategies. To increase the availability of cranberry genomic resources, genotyping-by-sequencing (GBS) was used to discover and genotype thousands of single nucleotide polymorphisms (SNPs) within three interrelated cranberry full-sib populations. Additional simple sequence repeat (SSR) loci were added to the SNP datasets and used to construct bin maps for the parents of the populations, which were then merged to create the first high-density cranberry composite map containing 6073 markers (5437 SNPs and 636 SSRs) on 12 linkage groups (LGs) spanning 1124 cM. Interestingly, higher rates of recombination were observed in maternal than paternal gametes. The large number of markers in common (mean of 57.3) and the high degree of observed collinearity (mean Pair-wise Spearman rank correlations >0.99) between the LGs of the parental maps demonstrates the utility of GBS in cranberry for identifying polymorphic SNP loci that are transferable between pedigrees and populations in future trait-association studies. Furthermore, the high-density of markers anchored within the component maps allowed identification of segregation distortion regions, placement of centromeres on each of the 12 LGs, and anchoring of genomic scaffolds. Collectively, the results represent an important contribution to the current understanding of cranberry genomic structure and to the availability of molecular tools for future genetic research and breeding efforts in cranberry.
Resource Title: Journal article with supplementary data files.
File Name: Web Page, url: https://academic.oup.com/g3journal/article/7/4/1177/6031795#supplementary-data
Data based on a total of 179 sorghum accessions from Ethiopia, Gambia, and Senegal maintained by the USDA-ARS, Plant Genetic Resources Conservation Unit, Griffin, Georgia, USA, and planted in replicated plots in Isabela, Puerto Rico. Data for anthracnose, grain mold and rust infections with various agronomic traits such as anthracnose, grain mold, rust, seed weight, percent germination rate, and grain yield, seed weight, panicle height, panicle length, and flowering time were collected in 2017 and 2018 by L. K. Prom, H. Cuevas, E. Ahn, T. S. Isakeit, and C. W. Magill. The disease rating was based on previously published scale of 1 to 5. Seed weight in grams was based on the weight of 100 randomly selected seeds from each replication. Percent germination based on the number of seeds that germinated out of 100 seeds placed on germination paper. At maturity, plant height was measured from the soil to the top of the plant in centimeters, and panicle length was measured from the first branch with racemes to the top of the panicle. Grain yield in grams was based on three harvested panicles per accession, and each panicle was threshed and weighed in grams. The flowering date was based on Julian days.
This is digital research data corresponding to a published manuscript, Cover cropping history affects cotton boll distribution, lint yields, and fiber quality, in Crop Science, Vol. 63 p. 1209–1220.
\nThere has been limited introduction of new cover crop species into cotton (Gossypium hirsutum L.) production within the last 30 years. Mounting evidence shows that traditional cover cropping species may be detrimental to cotton production, either by depleting soil fertility with crop removal, immobilizing minerals from high carbon residue, or excessive quantity of residue remaining at planting. The objective of this study was to determine the effects of growing a novel cover crop species, carinata (Brassica carinata A. Braun), as a winter annual cover crop for cotton rotation in the southeastern Coastal Plain. Over a 2-year period, carinata, winter wheat (Triticum aestivum L.), and fallow covers were maintained over winter months, then rotated into cotton. Each year, seedcotton and lint yields were collected, along with subsamples for ginning and subsequent fiber quality analyses. Additionally, end-of-season plant mapping was conducted on plants from 1-m of row per plot to determine cover crop effects on boll formation, retention, and distribution, as well as canopy architecture.
", "title": "Data from: Cover cropping history affects cotton boll distribution, lint yields, and fiber quality", "distribution": [ { "@type": "dcat:Distribution", "downloadURL": "https://datadryad.org/stash/dataset/doi:10.5061/dryad.1g1jwsv2b", "mediaType": "text/html", "title": "https://datadryad.org/stash/dataset/doi:10.5061/dryad.1g1jwsv2b" } ], "license": "https://www.usa.gov/publicdomain/label/1.0/", "bureauCode": [ "005:18" ], "modified": "2024-03-25", "publisher": { "@type": "org:Organization", "name": "Agricultural Research Service" }, "keyword": [ "cover crops", "cotton", "Brassica carinata", "coastal plain", "winter wheat", "NP301", "data.gov", "ARS" ], "spatial": "{\"type\": \"MultiPolygon\", \"coordinates\": [[[[-79.74239319301, 34.309502307881], [-79.74239319301, 34.309502307881], [-79.74239319301, 34.309502307881], [-79.74239319301, 34.309502307881]]], [[[-79.745216066076, 34.308990275108], [-79.745216066076, 34.310447589702], [-79.73739593901, 34.310447589702], [-79.73739593901, 34.308990275108], [-79.745216066076, 34.308990275108]]]]}" }, { "identifier": "10.15482/USDA.ADC/1503703", "accessLevel": "public", "contactPoint": { "hasEmail": "mailto:christopher.clarke@ars.usda.gov", "fn": "Clarke, Christopher" }, "programCode": [ "005:040" ], "description": "All data from the paper \"Cultivar resistance to common scab disease of potato is dependent on the pathogen species.\" Three separate datasets are included:
\nA csv file with the disease severity of three common scab pathogens across 55 different potato cultivars in a greenhouse pot assay (Figures 2-5 in the associated paper). The included R script was used with this data to perform the ANOVA for the data from the greenhouse pot assay (Table 2 in the associated paper). This script can be used in R for any similar dataset to calculate the significance and percent of total variation for any number of user-defined fixed effects.
\nA zipped file with all of the qPCR data for the expression of the txtAB genes (Figure 6 in the associated paper).
\nAn Excel file with the HPLC data for making the thaxtomin detection standard curve and quantifying the amount of thaxtomin in the test sample.
Resource Title: Streptomyces pot assay data.
File Name: 18.4.2updatedfileAllDataPotAssay.csv
Resource Description: Combined data from all Streptomyces - potato pot assays from the paper \"Cultivar resistance to common scab disease of potato is dependent on the pathogen species.\" This csv file can be used with the example R script \"DiseaseseverityEstimateScript.\"
Resource Title: Combined qPCR data..
File Name: CombinedtxtABqPCRresults.zip
Resource Description: Zipped file that contains all qPCR data of txtAB gene expression in all experimental conditions. Combined qPCR data from Figure 6 of the paper \"Cultivar resistance to common scab disease of potato is dependent on the pathogen species.\"
Resource Title: R script for estimating disease severity.
File Name: DiseaseSeverityEstimateScript.txt
Resource Description: R script used in combination with the \"18.4.2updatedfileAllDataPotAssay.csv\" file for generating the disease severity estimates (Figures 2-4) in the paper \"Combined qPCR data from Figure 6 of the paper \"Cultivar resistance to common scab disease of potato is dependent on the pathogen species.\"
Resource Title: Thaxtomin standard curve and quantification - All data.
File Name: Thaxtomin_CalCurve_log_log-Scale_12072018 (003).xlsx
Resource Description: Excel file with two sheets. The first sheet is all of the HPLC data used for calculating the standard curve of thaxtomin using known standards. The second sheet is the quantification data for the abundance of thaxtomin across the experimental groups. Data presented as Figure 6 in the paper \"Combined qPCR data from Figure 6 of the paper \"Cultivar resistance to common scab disease of potato is dependent on the pathogen species.\"
The datasets and code presented in this Data in Brief article are related to the research article entitled \"Comprehensiveness of conservation of useful wild plants: an operational indicator for biodiversity and sustainable development targets\". The indicator methodology includes five main steps, each requiring and producing data, which are fully described and available here. These data include: species taxonomy, uses, and general geographic information (dataset 1); species occurrence data (dataset 2); global administrative areas data (dataset 3); eco-geographic predictors used in species distribution modeling (dataset 4); a world map raster file (dataset 5); species spatial distribution modeling outputs (dataset 6); ecoregion spatial data used in conservation analyses (dataset 7); protected area spatial data used in conservation analyses (dataset 8); and countries, sub-regions, and regions classifications data (dataset 9). These data are available at http://dx.doi.org/10.17632/2jxj4k32m2.1. In combination with the openly accessible methodology code (https://github.com/CIAT-DAPA/UsefulPlants-Indicator), these data facilitate indicator assessments and serve as a baseline against which future calculations of the indicator can be measured. The data can also contribute to other species distribution modeling, ecological research, and conservation analysis purposes.
Resource Title: Data for the calculation of an indicator of the comprehensiveness of conservation of useful wild plants - Mendeley dataset.
File Name: Web Page, url: https://data.mendeley.com/datasets/2jxj4k32m2/1
Khoury, Colin K.; Amariles, Daniel; Soto, Jonatan; Diaz, Maria Victoria; Sotelo, Steven; Sosa, Chrystian C.; Ramírez-Villegas , Julian; Achicanoy, Harold; Castañeda-Álvarez , Nora P.; León, Blanca; Wiersema, John H. (2018), Data for the calculation of an indicator of the comprehensiveness of conservation of useful wild plants, Mendeley Data, v1. http://dx.doi.org/10.17632/2jxj4k32m2.1
\nThe datasets presented here are related to the research article entitled “Comprehensiveness of conservation of useful wild plants: an operational indicator for biodiversity and sustainable development targets” (Khoury et al., 2019). The indicator methodology includes five main steps, each requiring and producing data, which are fully described and available here. These data include: species taxonomy, uses, and general geographic information (dataset 1); species occurrence data (dataset 2); global administrative areas data (dataset 3); eco-geographic predictors used in species distribution modeling (dataset 4); a world map raster file (dataset 5); species spatial distribution modeling outputs (dataset 6); ecoregion spatial data used in conservation analyses (dataset 7); protected area spatial data used in conservation analyses (dataset 8); and countries, sub-regions, and regions classifications data (dataset 9). These data are available at http://dx.doi.org/10.17632/2jxj4k32m2.1. In combination with the openly accessible methodology code (https://github.com/CIAT-DAPA/UsefulPlants-Indicator), these data facilitate indicator assessments and serve as a baseline against which future calculations of the indicator can be measured. The data can also contribute to other species distribution modeling, ecological research, and conservation analysis purposes.
Symptoms of mycosis induced by two native fungal entomopathogens of the citrus orthezia scale, Praelongorthezia praelonga (Hemiptera: Ortheziidae), an important pest of citrus orchards, are described. The data presented in this article are related to the article entitled \"Seasonal prevalence of the insect pathogenic fungus Colletotrichum nymphaeae in Brazilian citrus groves under different chemical pesticide regimes\". The endemic fungal pathogen, C. nymphaeae, emerges through the thin cuticular intersegmental regions of the citrus orthezia scale body revealing orange salmon-pigmented conidiophores bearing conidial masses, as well as producing rhizoid-like hyphae that extend over the citrus leaf. By contrast, nymphs or adult females of this scale insect infected with Lecanicillium longisporum exhibit profuse outgrowth of bright white-pigmented conidiophores with clusters of conidia emerging from the insect intersegmental membranes, and mycosed cadavers are commonly observed attached to the leaf surface by hyphal extensions. These morphological differences are important features to discriminate these fungal entomopathogens in citrus orthezia scales.
\nResource Title: Data on morphological features of mycosis induced by Colletotrichum nymphaeae and Lecanicillium longisporum on citrus orthezia scale.
File Name: Web Page, url: https://www.sciencedirect.com/science/article/pii/S2352340916302967
Data in Brief article with photographs and microphotographs portraying typical signs of mycosis of two fungal pathogens infecting the citrus orthezia scale.
This article contains consolidated proteomic data obtained from xylem sap collected from tomato plants grown in Fe- and Mn-sufficient control, as well as Fe-deficient and Mn-deficient conditions. Data presented here cover proteins identified and quantified by shotgun proteomics and Progenesis LC-MS analyses: proteins identified with at least two peptides and showing changes statistically significant (ANOVA; p ≤ 0.05) and above a biologically relevant selected threshold (fold ≥ 2) between treatments are listed. The comparison between Fe-deficient, Mn-deficient and control xylem sap samples using a multivariate statistical data analysis (Principal Component Analysis, PCA) is also included. Data included in this article are discussed in depth in \"Effects of Fe and Mn deficiencies on the protein profiles of tomato (Solanum lycopersicum) xylem sap as revealed by shotgun analyses\", Ceballos-Laita et al., J. Proteomics, 2018. This dataset is made available to support the cited study as well to extend analyses at a later stage.
Resource Title: ProteomeExchange submission PXD007517. Xylem sap shotgun proteomics from Fe- and Mn-deficient and Mn-toxic tomato plants. .
File Name: Web Page, url: http://proteomecentral.proteomexchange.org/cgi/GetDataset?ID=PXD007517
The MS proteomics data have been deposited to the ProteomeXchange Consortium via the Pride partner repository with the data set identifier PXD007517. Also includes FTP location.
\nFiles available at https://www.ebi.ac.uk/pride/archive/projects/PXD007517 via HTML, FTP, or Fast (Aspera) download : 1 SEARCH.xml file, 1 Peak file, 24 RAW files, 1 Mascot information.xlsx file.
\nSupplementary data associated with this article can be found in the online version at http://dx.doi.org/10.1016/j.dib.2018.01.034
This dataset is a label-free quantitation of proteins milk and dry secretions from the end of lactation through day 21 of the dry period using liquid chromatography with tandem mass spectrometry (LC-MS/MS). The data supplied in this article supports the accompanying publication entitled “Characterization of bovine mammary gland dry secretions and their proteome from the end of lactation through day 21 of the dry period”. The Thermo mass spectrometry raw files and MaxQuant files have been deposited to the ProteomeXchange Consortium via the PRIDE partner repository with the dataset number PXD017837.
Resource Title: Characterization of Bovine Dry Secretions and their Proteome from the End of Lactation Through Day 21 of the Dry Period - ProteomeXchange Consortium via the PRIDE partner repository, Project PXD017837.
File Name: Web Page, url: https://www.ebi.ac.uk/pride/archive/projects/PXD017837
Thermo raw file code for Pride raw files and supplemental Excel files. The 3 technical replicates are denoted as a letter A, B and C. The number following is the cow identification number for 11 cows used. The final two-digit number after the underscore is the day sampled where _01 = day 1, _03 = day 3, _10 = day 10 and _21 = day 21 of dry period. For example, A1313_01 is technical replicate A for cow 1313 collected on day 1. B1313_03 is technical replicate B for cow 1313 collected on day 3. Details of sample and data processing protocols are provided.
Blueberry is an economically important berry crop. Both production and consumption of blueberries have increased sharply worldwide in recent years at least partly due to their known health benefits. The development of improved genomic resources for blueberry, such as a well-assembled genome and transcriptome, could accelerate breeding through genomic-assisted approaches. To enrich available transcriptome data and identify genes potentially involved in fruit quality, RNA sequencing was performed on fruit tissue from two northern-adapted hybrid blueberry breeding populations. RNA-seq was carried out using the Illumina HiSeqTM 2500 platform. Because of the absence of a reference-grade genome for blueberry, a transcriptome was de novo assembled from this RNA-seq data and other publicly available transcriptome data from blueberry downloaded from the National Center for Biotechnology Information (NCBI) Short Read Archive (SRA) using Trinity. After removing redundancy, this resulted in a dataset of 91,861 blueberry unigenes. This unigene dataset was functionally annotated using the NCBI-Nr protein database. All raw reads from the breeding populations were deposited in the NCBI SRA with accession numbers SRR6281886, SRR6281887, SRR6281888, and SRR6281889. The de novo transcriptome assembly was deposited at NCBI Transcriptome Shotgun Assembly (TSA) database with accession number GGAB00000000. These data will provide real expression evidence for the blueberry genome gene prediction and gene functional annotation and a reference transcriptome for future gene expression studies involving blueberry fruit.
Resource Title: Dataset of de novo assembly and functional annotation of the transcriptome of blueberry (Vaccinium spp.).
File Name: Web Page, url: https://doi.org/10.1016/j.dib.2019.104390
A GeXP multiplex, RT-PCR assay was developed and optimized that simultaneously measures expression of a suite of immune-relevant genes in rainbow trout (Oncorhynchus mykiss), concentrating on tumor necrosis factor and interleukin-1 ligand/receptor systems and acute phase response genes. The dataset includes expression values for drpt, il11a, il1b1, il1b2, il1b3, il1r-like-1(e3-5), il1r-like-1(e9-11), il1r1-like-a, il1r1-like-b, il1r2, saa, tnfa1, tnfa2, tnfa3, tnfrsf1a, tnfrsf1a-like-a, tnfrsf1a-like-b, tnfrsf5, and tnfrsf9. Gene expression was measured at four time-points post-challenge in both a resistant line (ARS-Fp-R) and a susceptible line (ARS-Fp-S) of rainbow trout. In addition, fish body weight, spleen index and the Flavobacterium psychrophilum load are reported. These data are an extension of information presented and discussed in the article \"Proinflammatory cytokine and cytokine receptor gene expression kinetics following challenge with Flavobacterium psychrophilum in resistant and susceptible lines of rainbow trout (Oncorhynchus mykiss)\" (Kutyrev et al., 2016).
Resource Title: Dataset of proinflammatory cytokine and cytokine receptor gene expression in rainbow trout (Oncorhynchus mykiss) measured using a novel GeXP multiplex, RT-PCR assay.
File Name: Web Page, url: https://www.sciencedirect.com/science/article/pii/S2352340917300331
Data in Brief data article providing expression values for a suite of immune-relevant genes in rainbow trout (Oncorhynchus mykiss), concentrating on tumor necrosis factor and interleukin-1 ligand/receptor systems and acute phase response genes. Data are available for download as Excel spreadsheet.
Resource Software Recommended: Microsoft Excel,url: https://office.microsoft.com/excel/
The data herein is related to the research article entitled \"Functional analyses of the interaction of chicken interleukin 23 subunit p19 with IL-12 subunit p40 to form the IL-23 complex\", where it is demonstrated that the chicken interleukin (IL)-23α, IL-12p40, and IL-23 complex regulates Th1, Th17, and Treg cytokine production through heterodimer receptors as well as a homodimer receptor consisting of IL-12Rβ1 and IL-23R, and activates the JAK/STAT signaling pathways. Here, the effects of the recombinant chicken IL-23α, IL-12p40, and IL-23 complex protein on cell proliferation and nitric oxide (NO) production in chicken macrophage (HD11) and CU91 T cell lines are evaluated. In addition, the expression of IL-6, IL-17A, and interferon-γ mRNA were upregulated in vivo and in vitro. Moreover, treatment with the chicken IL-23α, IL-12p40, and IL-23 complex activated phosphorylation of tyrosine and serine residues in JAK2, STAT1, TYK2, and SOCS1 in chicken cell lines.
Resource Title: Dataset on characterization of recombinant interleukin-23α, IL-12p40 and IL-23 complex protein, which activates JAK-STAT signaling pathway in chicken cell lines using immunocytochemical staining.
File Name: Web Page, url: https://www.sciencedirect.com/science/article/pii/S2352340917307035
Data in Brief article providing the nucleotide and amino acid sequences of the chicken IL-23α coding region. The data provide information about the effect of chicken IL-23α, IL-12p40, and IL-23 complex protein on cell proliferation and production of reactive oxygen species in the form of NO in both cell lines.
Corn (Zea mays) is one of the most widely grown crops throughout the world. However, many corn fields develop pest problems such as corn borers every year that seriously affect its yield and quality. Corn's response to initial insect damage involves a variety of changes to the levels of defensive enzymes, toxins, and communicative volatiles. Such a dramatic change secondary metabolism necessitates the regulation of gene expression at the transcript level. This Data In Brief paper summarizes the datasets of the transcriptome of corn plants in response to corn stalk borers (Ostrinia furnacalis) and/or methyl jasmonate (MeJA). Altogether, 39, 636 genes were found to be differentially expressed. The sequencing data are available in the NCBI SRA database under accession number SRS965087. This dataset will provide more scientific and valuable information for future work such as the study of the functions of important genes or proteins and develop new insect-resistant maize varieties. Includes supplementary tables and data in fasta and GTF format.
Resource Title: Datasets for transcriptomic analyses of maize leaves in response to Asian corn borer feeding and/or jasmonic acid.
File Name: Web Page, url: https://www.sciencedirect.com/science/article/pii/S2352340916301792
Data in Brief Article including supplemental data in fasta and GTF format.
Grassland restoration is largely focused on creating plant communities that match reference conditions. However, these communities reflect only a subset of the biodiversity of grassland systems. We conducted a multi-trophic study to assess ecosystem recovery following energy development for oil and gas extraction in northern U.S. Great Plains rangelands. We compared soil factors, plant species composition and cover, and nematode trophic structuring between reclaimed oil and gas well sites (\"reclaims\") that comprise a chronosequence of two – 33 years since reclamation and adjacent, undeveloped rangeland at distances of 50 m and 150 m from reclaim edges. Soils and plant communities in reclaims did not match those on undeveloped rangeland even after 33 years. Reclaimed soils had higher salt concentrations and pH than undeveloped soils. Reclaims had lower overall plant cover, a greater proportion of exotic and ruderal plant cover and lower native plant species richness than undeveloped rangeland. However, nematode communities appear to have recovered following reclamation. Although total and omni-carnivorous nematode abundances differed between reclaimed well sites and undeveloped rangeland, community composition and structure did not. These findings suggest that current reclamation practices recover the functional composition of nematode communities, but not soil conditions or plant communities. Our results show that plant communities have failed to recover through reclamation: high soil salinity may create a persistent impediment to native plant growth and ecosystem recovery.
Resource Title: Vegetation Cover Data (xlsx).
File Name: Sylvain et al PeerJ 2019 Vegetation data.xlsx
Resource Description: Vegetation cover collected using percent cover estimation method. Second worksheet contains metadata including species associated with each species code found as column headers in the data worksheet and brief collection methods.
Resource Title: Nematode trophic group data (xlsx).
File Name: Sylvain et al PeerJ 2019 Nematode data.xlsx
Resource Description: Nematodes identified to trophic group. Metadata including brief extraction methods and how to standardize data can be found on the second worksheet.
Resource Title: Soil physical and chemical factors (xlsx).
File Name: Sylvain et al PeerJ 2019 Soils data.xlsx
Resource Description: Data for soil physical and chemical factors. Second worksheet includes metadata explaining units for each measurement in the data worksheet.
Resource Title: Soil physical and chemical factors (csv).
File Name: Sylvain-PeerJ-2019-Soils.csv
Resource Description: Data for soil physical and chemical factors.
Resource Title: Nematode trophic group data (csv).
File Name: Sylvain-PeerJ-2019-Nematode.csv
Resource Description: Nematodes identified to trophic group.
Resource Title: Vegetation Cover Data (csv).
File Name: Sylvain-PeerJ-2019-Vegetation.csv
Resource Description: Vegetation cover collected using percent cover estimation method.
Resource Title: Data Dictionary.
File Name: Sylvain-et-al-PeerJ-2019-DataDictionary.csv
Resource Description: Details Species and Habitat codes and variables for abundance data collected.
Deer keds are blood-feeding flies from which several human and animal pathogens have been detected, including the causative agent of Lyme Disease (Borrelia burgdorferi). Cervids, which are the primary hosts of deer keds, are not natural reservoirs of B. burgdorferi, and it has been suggested that deer keds may acquire bacterial pathogens by co-feeding near ticks that are infected with the bacteria. We tested this hypothesis by using a molecular assay to screen for presence of Anaplasma spp., Bartonella spp., Borrelia spp., and Rickettsia spp. in specimens of European deer keds (n=306) and blacklegged ticks (n=315) collected from 38 individual white-tailed deer in Pennsylvania. There was limited similarity in the bacterial DNA detected between these ectoparasites per host, suggesting that co-feeding may not be a mechanism by which deer keds acquire these bacteria. We discuss these results in relation to deer ked feeding biology, life history, and collection timepoints. In addition, we screened specimens of European deer keds (n=410), Neotropical deer keds (n=13), Western American deer keds (n=10), and Pacific deer keds (n=14) for these same bacterial pathogens.
Resource Title: Borrelia spp. flaB from Ixodes scapularis.
File Name: Borrelia_flaB_Iscapularis_Olafsonetal.csv
Resource Description: A PCR assay targeting Borrelia spp. flagellin (flaB, 650 bp; (Barbour et al. 1996)) was used to detect presence of this bacterium in DNAs isolated from field-collected samples.\nBarbour, A. G., G. O. Maupin, G. J. Teltow, C. J. Carter, and J. Piesman. 1996. Identification of an uncultivable Borrelia species in the hard tick Amblyomma americanum: possible agent of a Lyme disease-like illness. J Infect Dis 173: 403-409
Resource Title: Bartonella ribC from Lipoptena spp and Neolipoptena ferrisi.
File Name: Bartonella_ribC_DeerKed_Olafsonetal_2.csv
Resource Description: A PCR assay targeting Bartonella spp. riboflavin synthase (ribC, 575 bp; (Johnson et al. 2003) was used to detect presence of this bacterium in DNAs isolated from field-collected deer ked samples.\nJohnson, G., M. Ayers, S. C. McClure, S. E. Richardson, and R. Tellier. 2003. Detection and identification of Bartonella species pathogenic for humans by PCR amplification targeting the riboflavin synthase gene (ribC). J Clin Microbiol 41: 1069-1072.\n
Resource Title: Rickettsia spp. sca0 from Lipoptena cervi and Ixodes scapularis.
File Name: Rickettsia_sca0_DeerKed-Iscap_Olafsonetal_1.csv
Resource Description: A PCR assay targeting Rickettsia sp. surface cell antigen, sca0 (rompA, 525 bp; (Regnery et al. 1991)) was used to detect presence of this bacterium in DNAs isolated from field-collected samples.\nRegnery, R. L., C. L. Spruill, and B. D. Plikaytis. 1991. Genotypic identification of rickettsiae and estimation of intraspecies sequence divergence for portions of two rickettsial genes. J Bacteriol 173: 1576-1589.\n
Resource Title: Anaplasma spp. groEL from Lipoptena cervi and Ixodes scapularis.
File Name: Anaplasma_groEL_Lcervi-Iscap_Olafson_0.csv
Resource Description: A PCR assay targeting the Anaplasmataceae family heat shock protein (groEL, 350 bp; (Tabara et al. 2007), was used to detect presence of this bacterium in DNAs isolated from field-collected samples.\nTabara, K., S. Arai, T. Kawabuchi, A. Itagaki, C. Ishihara, H. Satoh, N. Okabe, and M. Tsuji. 2007. Molecular survey of Babesia microti, Ehrlichia species and Candidatus Neoehrlichia mikurensis in wild rodents from Shimane Prefecture, Japan. Microbiol Immunol 51: 359-367\n
Endosymbiont interactions with hosts have important effects on fitness, including the fitness of many pest and beneficial species. Among these interactions, facultative endosymbiotic bacteria can protect aphids from parasitoids. Aphis craccivora and Acyrthosiphon pisum can harbor the symbiotic bacteria Hamiltonella defensa and its bacteriophage APSE. Infection by H. defensa defends these aphids against some but not all parasitoid species in the hymenopteran family Braconidae. Here, we report results on the effect of H. defensa on parasitism of these aphids by species in the other major lineage of aphid parasitoids, Aphelinus species in the family Aphelinidae. Parasitism of aphids infected with H. defensa /APSE by two Aphelinus species did not differ from that of uninfected aphids. While Aphelinus atriplicis showed no difference in fitness components between infected and uninfected aphids, Aphelinus glycinis actually produced more adult progeny and larger female progeny on infected than on uninfected aphids. Aphelinus glycinis may increase host quality for itself by changing the titer of nutritional versus protective bacteria in such a way that aphids infected with H. defensa can be made more suitable for parasitoid development than uninfected aphids. Our results and reasoning suggest that these Aphelinus species may be less prone to harm by H. defensa /APSE that affect eggs because they have anhydropic, heavily chorionated eggs, which may not absorb toxins during embryogenesis.
\nSee the included methods-DefensiveAphidSymbiont.txt file for more information on the methods and design structure of this study.
", "title": "Data from: Defensive aphid symbiont Hamiltonella defensa effects on Aphelinus glycinis and Aphelinus atriplicis", "distribution": [ { "@type": "dcat:Distribution", "downloadURL": "https://ndownloader.figshare.com/files/44335895", "format": "csv", "mediaType": "text/plain", "title": "Parasitism_Hamiltonella.csv" }, { "@type": "dcat:Distribution", "downloadURL": "https://ndownloader.figshare.com/files/44335898", "format": "csv", "mediaType": "text/plain", "title": "Data Dictionary - Defensive aphid symbiont Hamitonella defensa effects on Aphelinus glycinis and Aphelinus atriplicis_1.csv" }, { "@type": "dcat:Distribution", "downloadURL": "https://ndownloader.figshare.com/files/44335901", "format": "txt", "mediaType": "text/plain", "title": "file-list-DefensiveAphidSymbiont.txt" }, { "@type": "dcat:Distribution", "downloadURL": "https://ndownloader.figshare.com/files/44335904", "format": "txt", "mediaType": "text/plain", "title": "methods-DefensiveAphidSymbiont.txt" } ], "license": "https://www.usa.gov/publicdomain/label/1.0/", "bureauCode": [ "005:18" ], "modified": "2024-02-08", "publisher": { "@type": "org:Organization", "name": "Agricultural Research Service" }, "accrualPeriodicity": "irregular", "keyword": [ "Aphelinus atriplicis", "Aphelinus glycinis", "Aphis craccivora", "Acyrthosiphon pisum", "Hamiltonella defensa", "APSE", "aphid endosymbionts", "Republic of Georgia", "China", "biological control", "beneficial insects", "introduced species", "NP304", "data.gov", "ARS" ], "spatial": "{\"type\": \"MultiPolygon\", \"coordinates\": [[[[110.339188, 18.678395], [109.47521, 18.197701], [108.655208, 18.507682], [108.626217, 19.367888], [109.119056, 19.821039], [110.211599, 20.101254], [110.786551, 20.077534], [111.010051, 19.69593], [110.570647, 19.255879], [110.339188, 18.678395]]], [[[127.657407, 49.76027], [129.397818, 49.4406], [130.582293, 48.729687], [130.987282, 47.790132], [132.506672, 47.78897], [133.373596, 48.183442], [135.026311, 48.47823], [134.500814, 47.57844], [134.112362, 47.212467], [133.769644, 46.116927], [133.097127, 45.144066], [131.883454, 45.321162], [131.025212, 44.967953], [131.288555, 44.11152], [131.144688, 42.92999], [130.633866, 42.903015], [130.640016, 42.395009], [129.994267, 42.985387], [129.596669, 42.424982], [128.052215, 41.994285], [128.208433, 41.466772], [127.343783, 41.503152], [126.869083, 41.816569], [126.182045, 41.107336], [125.079942, 40.569824], [124.265625, 39.928493], [122.86757, 39.637788], [122.131388, 39.170452], [121.054554, 38.897471], [121.585995, 39.360854], [121.376757, 39.750261], [122.168595, 40.422443], [121.640359, 40.94639], [120.768629, 40.593388], [119.639602, 39.898056], [119.023464, 39.252333], [118.042749, 39.204274], [117.532702, 38.737636], [118.059699, 38.061476], [118.87815, 37.897325], [118.911636, 37.448464], [119.702802, 37.156389], [120.823457, 37.870428], [121.711259, 37.481123], [122.357937, 37.454484], [122.519995, 36.930614], [121.104164, 36.651329], [120.637009, 36.11144], [119.664562, 35.609791], [119.151208, 34.909859], [120.227525, 34.360332], [120.620369, 33.376723], [121.229014, 32.460319], [121.908146, 31.692174], [121.891919, 30.949352], [121.264257, 30.676267], [121.503519, 30.142915], [122.092114, 29.83252], [121.938428, 29.018022], [121.684439, 28.225513], [121.125661, 28.135673], [120.395473, 27.053207], [119.585497, 25.740781], [118.656871, 24.547391], [117.281606, 23.624501], [115.890735, 22.782873], [114.763827, 22.668074], [114.152547, 22.22376], [113.80678, 22.54834], [113.241078, 22.051367], [111.843592, 21.550494], [110.785466, 21.397144], [110.444039, 20.341033], [109.889861, 20.282457], [109.627655, 21.008227], [109.864488, 21.395051], [108.522813, 21.715212], [108.05018, 21.55238], [107.04342, 21.811899], [106.567273, 22.218205], [106.725403, 22.794268], [105.811247, 22.976892], [105.329209, 23.352063], [104.476858, 22.81915], [103.504515, 22.703757], [102.706992, 22.708795], [102.170436, 22.464753], [101.652018, 22.318199], [101.80312, 21.174367], [101.270026, 21.201652], [101.180005, 21.436573], [101.150033, 21.849984], [100.416538, 21.558839], [99.983489, 21.742937], [99.240899, 22.118314], [99.531992, 22.949039], [98.898749, 23.142722], [98.660262, 24.063286], [97.60472, 23.897405], [97.724609, 25.083637], [98.671838, 25.918703], [98.712094, 26.743536], [98.68269, 27.508812], [98.246231, 27.747221], [97.911988, 28.335945], [97.327114, 28.261583], [96.248833, 28.411031], [96.586591, 28.83098], [96.117679, 29.452802], [95.404802, 29.031717], [94.56599, 29.277438], [93.413348, 28.640629], [92.503119, 27.896876], [91.696657, 27.771742], [91.258854, 28.040614], [90.730514, 28.064954], [90.015829, 28.296439], [89.47581, 28.042759], [88.814248, 27.299316], [88.730326, 28.086865], [88.120441, 27.876542], [86.954517, 27.974262], [85.82332, 28.203576], [85.011638, 28.642774], [84.23458, 28.839894], [83.898993, 29.320226], [83.337115, 29.463732], [82.327513, 30.115268], [81.525804, 30.422717], [81.111256, 30.183481], [79.721367, 30.882715], [78.738894, 31.515906], [78.458446, 32.618164], [79.176129, 32.48378], [79.208892, 32.994395], [78.811086, 33.506198], [78.912269, 34.321936], [77.837451, 35.49401], [76.192848, 35.898403], [75.896897, 36.666806], [75.158028, 37.133031], [74.980002, 37.41999], [74.829986, 37.990007], [74.864816, 38.378846], [74.257514, 38.606507], [73.928852, 38.505815], [73.675379, 39.431237], [73.960013, 39.660008], [73.822244, 39.893973], [74.776862, 40.366425], [75.467828, 40.562072], [76.526368, 40.427946], [76.904484, 41.066486], [78.187197, 41.185316], [78.543661, 41.582243], [80.11943, 42.123941], [80.25999, 42.349999], [80.18015, 42.920068], [80.866206, 43.180362], [79.966106, 44.917517], [81.947071, 45.317027], [82.458926, 45.53965], [83.180484, 47.330031], [85.16429, 47.000956], [85.720484, 47.452969], [85.768233, 48.455751], [86.598776, 48.549182], [87.35997, 49.214981], [87.751264, 49.297198], [88.013832, 48.599463], [88.854298, 48.069082], [90.280826, 47.693549], [90.970809, 46.888146], [90.585768, 45.719716], [90.94554, 45.286073], [92.133891, 45.115076], [93.480734, 44.975472], [94.688929, 44.352332], [95.306875, 44.241331], [95.762455, 43.319449], [96.349396, 42.725635], [97.451757, 42.74889], [99.515817, 42.524691], [100.845866, 42.663804], [101.83304, 42.514873], [103.312278, 41.907468], [104.522282, 41.908347], [104.964994, 41.59741], [106.129316, 42.134328], [107.744773, 42.481516], [109.243596, 42.519446], [110.412103, 42.871234], [111.129682, 43.406834], [111.829588, 43.743118], [111.667737, 44.073176], [111.348377, 44.457442], [111.873306, 45.102079], [112.436062, 45.011646], [113.463907, 44.808893], [114.460332, 45.339817], [115.985096, 45.727235], [116.717868, 46.388202], [117.421701, 46.672733], [118.874326, 46.805412], [119.66327, 46.69268], [119.772824, 47.048059], [118.866574, 47.74706], [118.064143, 48.06673], [117.295507, 47.697709], [116.308953, 47.85341], [115.742837, 47.726545], [115.485282, 48.135383], [116.191802, 49.134598], [116.678801, 49.888531], [117.879244, 49.510983], [119.288461, 50.142883], [119.279366, 50.582908], [120.18205, 51.643566], [120.738191, 51.964115], [120.725789, 52.516226], [120.177089, 52.753886], [121.003085, 53.251401], [122.245748, 53.431726], [123.571507, 53.458804], [125.068211, 53.161045], [125.946349, 52.792799], [126.564399, 51.784255], [126.939157, 51.353894], [127.287456, 50.739797], [127.657407, 49.76027]]], [[[41.554084, 41.535656], [41.703171, 41.962943], [41.45347, 42.645123], [40.875469, 43.013628], [40.321394, 43.128634], [39.955009, 43.434998], [40.076965, 43.553104], [40.922185, 43.382159], [42.394395, 43.220308], [43.756017, 42.740828], [43.9312, 42.554974], [44.537623, 42.711993], [45.470279, 42.502781], [45.77641, 42.092444], [46.404951, 41.860675], [46.145432, 41.722802], [46.637908, 41.181673], [46.501637, 41.064445], [45.962601, 41.123873], [45.217426, 41.411452], [44.97248, 41.248129], [43.582746, 41.092143], [42.619549, 41.583173], [41.554084, 41.535656]]]]}" }, { "identifier": "10.15482/USDA.ADC/1528995", "accessLevel": "public", "contactPoint": { "hasEmail": "mailto:alison.gerken@usda.gov", "fn": "Gerken, Alison" }, "programCode": [ "005:040" ], "description": "Drosophila melanogaster is a fruit fly pest found around the world. This insect responds plastically to variation in temperature and has been known to be locally adapted to different locations across the globe, with varying maximum and minimum thermal limits. Artificial selection can be used to create adaptive responses in a laboratory setting, which can be used to mimic a range of thermal responses. Previous research has shown that within 30 generations of selection, naturally caught D. melanogaster from North Carolina, USA, can produce populations with both increased and decreased responses to cold stress as demonstrated by the chill-coma recovery trait (Gerken et al. 2016). This dataset expands on cross-tolerances to reproductive capacity and includes data from the four artificially selected D. melanogaster populations and two control populations. Egg production and total lifespan were measured in a laboratory setting at five different temperatures. Two data resources are included: full egg production and longevity for each fly assayed. This study was used to establish how selection for cold tolerance can affect reproductive capacity and longevity.
\nResources in this dataset:
\nResource Title: Oviposition (egg laying) data for entire lifespan\nFile Name: Full_egg_data.csv\nResource Description: Egg laying (oviposition) data for entire lifespan for 6 populations of Drosophila melanogaster. Fly_ID is a unique identifier for each female fly assayed. SelectionLine is the specific replicate line and SelectionRegime is the overall increased (Resistant) or decreased (Susceptible) cold tolerance parameter (or Control, no selection). Treatment is in degrees Celsius and is the temperature at which the female was put to lay eggs. The remaining columns represent each day of egg counting. The first count was on day 6 after introduction to the temperature assigned, and counts were conducted every 6 days until the female died or until day 210.
\nResource Title: Longevity (in days) for Drosophila melanogaster populations\nFile Name: Full_longevity_data.csv\nResource Description: Longevity data (survival) for 6 populations of Drosophila melanogaster. Fly_ID is a unique identifier for each female fly assayed. SelectionLine is the specific replicate line which includes the overall selection regime of increased (Resistant) or decreased (Susceptible) cold tolerance parameter (or Control, no selection) and the specific replicate for each selection regime (1 or 2). Treatment is in degrees Celsius and is the temperature at which the female was put to lay eggs. Longevity_days is the total lifespan of the individual female fly. If the Longevity_days is set at -9, the fly outlived the maximum days of 210 and was not counted in overall survival parameters.
\nOur goal was to manipulate and observe the density-mediated effects of crowding on the behavioral response of both species to common food-based and pheromonal stimuli, and how the volatile emission patterns from grain differed under increasing densities. To accomplish this, the density of colonies for both species was altered (10–500 adults) on a fixed quantity of food (10 g of flour or whole wheat), then the behavioral response to common food and pheromonal cues was evaluated in a wind tunnel and release-recapture experiment, and the volatiles from the colonies were examined through gas chromatography coupled with mass spectrometry (GC-MS). Importantly, our results suggest that, at least for T. castaneum, crowded conditions attenuates attraction to food-based stimuli, but not pheromonal stimuli. Crowding seemed to have no effect on R. dominica response to food stimuli at the densities tested. The relative composition and abundance of headspace volatiles emitted varied significantly with different densities of beetles and was also species-specific. Overall, our results have implications for behaviorally-based management tactics that may be able to improve the sustainability of post-harvest agriculture.
", "title": "Data from: Density-mediated emissions by Rhyzopertha dominica (Coleoptera: Bostrichidae) and Tribolium castaneum (Coleoptera: Tenebrionidae) modulates foraging by conspecifics", "distribution": [ { "@type": "dcat:Distribution", "downloadURL": "https://ndownloader.figshare.com/files/44570357", "format": "csv", "mediaType": "text/plain", "title": "density_exp_2018_final_marco_ponce_rr_lgb.csv" }, { "@type": "dcat:Distribution", "downloadURL": "https://ndownloader.figshare.com/files/44570360", "format": "csv", "mediaType": "application/csv", "title": "density_exp_2018_final_marco_ponce_rr_rfb.csv" }, { "@type": "dcat:Distribution", "downloadURL": "https://ndownloader.figshare.com/files/44570363", "format": "csv", "mediaType": "text/plain", "title": "ponce_etal_2018_density_cues_lgb_wt.csv" }, { "@type": "dcat:Distribution", "downloadURL": "https://ndownloader.figshare.com/files/44570366", "format": "csv", "mediaType": "application/csv", "title": "ponce_etal_2018_density_cues_rfb_wt.csv" }, { "@type": "dcat:Distribution", "downloadURL": "https://ndownloader.figshare.com/files/44570369", "format": "csv", "mediaType": "application/csv", "title": "ponce_etal_2018_density_cues_volatiles_gcms.csv" } ], "license": "https://creativecommons.org/publicdomain/zero/1.0/", "bureauCode": [ "005:18" ], "modified": "2024-06-03", "publisher": { "@type": "org:Organization", "name": "Agricultural Research Service" }, "accrualPeriodicity": "irregular", "keyword": [ "lesser grain borer", "red flour beetle", "Tribolium castaneum", "Rhyzopertha dominica", "stored products", "stored product pests", "semiochemicals", "integrated pest management", "IPM", "behavior", "behavioral ecology", "density", "carrying capacity", "postharvest", "Kansas", "USDA", "cgahr", "wheat", "grain", "release-recapture", "wind tunnel", "GAS CHROMATOGRAPHS", "pheromone lure", "food lure", "kairomone lure", "flour", "data.gov", "ARS" ], "spatial": "{\"type\": \"Point\", \"coordinates\": [-96.599111258984, 39.195940010466]}" }, { "identifier": "10.15482/USDA.ADC/24777069.v1", "accessLevel": "public", "contactPoint": { "hasEmail": "mailto:manan.sharma@usda.gov", "fn": "Sharma, Manan" }, "programCode": [ "005:040" ], "description": "Alternative irrigation waters (rivers, ponds, and reclaimed water) can harbor bacterial foodborne pathogens like Salmonella enterica and Listeria monocytogenes, potentially contaminating fruit and vegetable commodities. Detecting foodborne pathogens using qPCR-based methods may accelerate testing methods and procedures compared to culture-based methods. This study compared detection of S. enterica and L. monocytogenes by qPCR (real-time PCR) and culture methods in irrigation waters to determine the influence of water type (river, pond, and reclaimed water), season (winter, spring, summer, and fall), or volume (0.1, 1, and 10 L) on sensitivity, accuracy, specificity, and positive (PPV), and negative (NPV) predictive values of these methods. Water samples were collected by filtration through modified Moore swabs (MMS) over a 2-year period at 11 sites in the Mid-Atlantic U.S. on a bi-weekly or monthly schedule. For qPCR, bacterial DNA from culture-enriched samples (n = 1,990) was analyzed by multiplex qPCR specific for S. enterica and L. monocytogenes. For culture detection, enriched samples were selectively enriched, isolated, and PCR confirmed. PPVs for qPCR detection of S. enterica and L. monocytogenes were 68% and 67%, respectively. The NPV were 87% (S. enterica) and 85% (L. monocytogenes). Higher levels of qPCR/culture agreement were observed in spring and summer compared to fall and winter for S. enterica; for L. monocytogenes, lower levels of agreement were observed in winter compared to spring, summer, and fall. Reclaimed and pond water supported higher levels of qPCR/culture agreement compared to river water for both S. enterica and L. monocytogenes, indicating that water type may influence the agreement of these results.
", "title": "Data from: Detection of Salmonella enterica and Listeria monocytogenes in alternative irrigation water by culture and qPCR-based methods in the Mid-Atlantic U.S.", "distribution": [ { "@type": "dcat:Distribution", "downloadURL": "https://ndownloader.figshare.com/files/43695837", "format": "xlsx", "mediaType": "application/vnd.openxmlformats-officedocument.spreadsheetml.sheet", "title": "cnsv_pcr_vs_culture_data_11 08 2023.xlsx" }, { "@type": "dcat:Distribution", "downloadURL": "https://ndownloader.figshare.com/files/44471915", "format": "docx", "mediaType": "application/vnd.openxmlformats-officedocument.wordprocessingml.document", "title": "Supplemental material 9 14 2023.docx" } ], "license": "https://creativecommons.org/licenses/by/4.0/", "bureauCode": [ "005:18" ], "modified": "2024-02-21", "publisher": { "@type": "org:Organization", "name": "Agricultural Research Service" }, "accrualPeriodicity": "R/P1M", "keyword": [ "water", "Listeria monocytogenes", "Salmonella enterica", "irrigation", "detection", "qPCR", "culture based methods" ] }, { "identifier": "10.15482/USDA.ADC/25008827.v1", "accessLevel": "public", "contactPoint": { "hasEmail": "mailto:barbara.drolet@usda.gov", "fn": "Drolet, Barbara" }, "programCode": [ "005:040" ], "description": "Vesicular stomatitis (VS) is a reportable viral disease which affects horses, cattle, and pigs in the Americas. Outbreaks of vesicular stomatitis virus New Jersey serotype (VSV-NJ) in the United States typically occur on a 5–10-year cycle, usually affecting western and southwestern states.
\nIn 2019–2020, an outbreak of VSV Indiana serotype (VSV-IN) extended eastward into the states of Kansas and Missouri for the first time in several decades, leading to 101 confirmed premises in Kansas and 37 confirmed premises in Missouri. In order to investigate which vector species contributed to the outbreak in Kansas, we conducted insect surveillance at two farms that experienced confirmed VSV-positive cases, one each in Riley County and Franklin County. Centers for Disease Control and Prevention miniature light traps were used to collect biting flies on the premises. Two genera of known VSV vectors, Culicoides biting midges and Simulium black flies, were identified to species, pooled by species, sex, reproductive status, and collection site, and tested for the presence of VSVIN RNA by RT-qPCR.
\nIn total, eight positive pools were detected from Culicoides sonorensis (1), Culicoides stellifer (3), Culicoides variipennis (1), and Simulium meridionale (3). The C. sonorensis- and C. variipennis-positive pools were from nulliparous individuals, possibly indicating transovarial or venereal transmission as the source of virus. This is the first report of VSV-IN in field caught C. stellifer and the first report of either serotype in S. meridionale near outbreak premises. These results improve our understanding of the role midges and black flies play in VSV epidemiology in the United States and broadens the scope of vector species for targeted surveillance and control.
", "title": "Data from: Detection of Vesicular Stomatitis Virus Indiana from Insects Collected during the 2020 Outbreak in Kansas, USA", "distribution": [ { "@type": "dcat:Distribution", "downloadURL": "https://ndownloader.figshare.com/files/44073650", "format": "pdf", "mediaType": "application/pdf", "title": "pathogens-1342920-supplementary.pdf" }, { "@type": "dcat:Distribution", "downloadURL": "https://ndownloader.figshare.com/files/44073854", "format": "csv", "mediaType": "text/plain", "title": "VSV-Pool and qPCR Raw Data.csv" } ], "license": "https://creativecommons.org/publicdomain/zero/1.0/", "bureauCode": [ "005:18" ], "modified": "2024-01-30", "publisher": { "@type": "org:Organization", "name": "Agricultural Research Service" }, "keyword": [ "vesicular stomatitis virus", "Indiana", "VSV-IN", "Rhabdoviridae", "vesiculovirus", "Culicoides", "Simulium", "Kansas" ] }, { "identifier": "10.15482/USDA.ADC/1529211", "accessLevel": "public", "contactPoint": { "hasEmail": "mailto:sliu@ag.tamu.edu", "fn": "Liu, Shuyu" }, "programCode": [ "005:040" ], "description": "Wheat streak mosaic virus (WSMV) can cause significant yield loss in wheat (Triticum aestivum L.) in the Great Plains of North America. A recently identified WSMV resistance gene, Wsm2, was mapped to chromosome 3BS in germplasm line 'CO960293–2'. Effective genetic markers tightly linked to the gene will enhance the selection of WSMV-resistant lines through marker-assisted selection. We have mapped Wsm2 using a high-density map developed from the wheat 90K Infinium iSelect single-nucleotide polymorphism (SNP) array with recombinant inbred lines from the cross between CO960293–2 and susceptible cultivar 'TAM 111'. Array-based SNPs that mapped within 4 cM of Wsm2 on chromosome 3BS were converted to Kompetitive Allele Specific Polymerase Chain Reaction (KASP) assays in this study. Six KASP SNPs were validated in two doubled haploid populations developed from crosses of 'RonL' × 'Ripper' and 'Snowmass' × 'Antero'. RonL and Snowmass possess the Wsm2 gene from CO960293–2. Three closely linked KASP SNPs, converted from IAAV6442, BS00018764_51, and wsnp_Ra_c16264_24873670, showed high sensitivity and specificity (0.83 ≤ sensitivity ≤ 0.97, 0.89 ≤ specificity ≤ 0.99). The latter two were also validated in six F2 breeding populations. These three KASP SNPs were effective in differentiating resistant and susceptible genotypes. Comparative mapping was performed using sequences of SNPs flanking Wsm2 and identified candidate genes and regions in Brachypodium and rice (Oryza sativa L. ssp. japonica). The KASP SNPs developed in this study should be useful for marker-assisted selection of Wsm2 in wheat breeding programs, and the newly constructed map will also facilitate map based cloning of Wsm2.
Resource Title: Supplemental Table S1: A list of candidate genes identified in the region between wheat markers GENE-1856_1005 and Tdurum_contig57914_1144 2 to Brachypodium and rice orthologoues - Download PDF.
File Name: csc2cropsci2016040234-sup-0001.pdf
Resource Description: Brachypodium and rice candidates for Wsm2 orthologous to the colinear region in wheat chromosome 3B that were identified are presented.
The P Loss in runoff Events from Agricultural fields Database (PLEAD) is a compilation of event-based, field-scale dissolved and/or total P loss runoff loadings from agricultural fields collected at various research sites located in the US Heartland and Southern US. The database also includes runoff and erosion rates; soil test P; tillage practices; planting and harvesting rates and practices; fertilizer application rate, method, and timing; manure application rate, method, and timing; and livestock grazing density and timing. In total, over 1800 individual runoff events – ranging in duration from 0.4 to 97 hr – have been included in the database. Event runoff P losses ranged from less than 0.05 to 1.3 and 3.0 kg P/ha for dissolved and total P, respectively. The data contained in this database have been used in multiple research studies to address important modeling questions relevant to P management planning. We provide these data to encourage additional studies by other researchers.
Resource Title: PLEAD Database - Excel.
File Name: PLEAD_2018-11-16.xlsx
Resource Description: Includes data spreadsheets for: Land Use, Soil Data, Soil Chem Data, Inorganic P Application, Grazing Data, Organic P Application, Tillage, Irrigation, Planting, Harvesting, Runoff Data, Sampling Info, Runoff Collection Notes, Daily Weather Data, Weather Stations, Other Notes, Contact Info.
Resource Title: PLEAD Database Data Dictionary.
File Name: PLEAD_data_dictionary.csv
Resource Description: Defines the column headers/variables, units, and data type represented in each spreadsheet.
This data set contains 32 million annotated SNPs having an average SNP density of 30 SNPs per kb and 12 non-synonymous SNPs per gene model. These SNPs were identified from a genetically diverse, worldwide, collection of soybean germplasm representing wild, landrace, and improved cultivars. A combination of new and publicly available re-sequencing data was used in this analysis. The accession genotypes and their annotations are described in the manuscript titled: \"Analysis and characterization of 1500 diverse genome sequences as a versatile resource for post-genomics research\".
Resource Title: AnLab_1.5K.SampleIDs.txt.
File Name: AnLab_1.5K.SampleIDs.txt
Resource Description: Defines sample id's used in the vcf files
Resource Title: Chr01.AnLab_1.5K.gtf.gz.
File Name: Chr01.AnLab1.5K.gtf.gz
Resource Description: Chromosome 1 SNP annotation
Resource Title: Chr01.AnLab_1.5K.vcf.gz.
File Name: Chr01.AnLab1.5K.vcf.gz
Resource Description: Chromosome 1 sample genotypes
Resource Title: Chr02.AnLab_1.5K.gtf.gz.
File Name: Chr02.AnLab1.5K.gtf.gz
Resource Description: Chromosome 2 SNP annotation
Resource Title: Chr02.AnLab_1.5K.vcf.gz.
File Name: Chr02.AnLab1.5K.vcf.gz
Resource Description: Chromosome 2 sample genotypes
Resource Title: Chr03.AnLab_1.5K.gtf.gz.
File Name: Chr03.AnLab1.5K.gtf.gz
Resource Description: Chromosome 3 SNP annotation
Resource Title: Chr03.AnLab_1.5K.vcf.gz.
File Name: Chr03.AnLab1.5K.vcf.gz
Resource Description: Chromosome 3 sample genotypes
Resource Title: Chr04.AnLab_1.5K.gtf.gz.
File Name: Chr04.AnLab1.5K.gtf.gz
Resource Description: Chromosome 4 SNP annotation
Resource Title: Chr04.AnLab_1.5K.vcf.gz.
File Name: Chr04.AnLab1.5K.vcf.gz
Resource Description: Chromosome 4 sample genotypes
Resource Title: Chr05.AnLab_1.5K.gtf.gz.
File Name: Chr05.AnLab1.5K.gtf.gz
Resource Description: Chromosome 5 SNP annotation
Resource Title: Chr05.AnLab_1.5K.vcf.gz.
File Name: Chr05.AnLab1.5K.vcf.gz
Resource Description: Chromosome 5 sample genotypes
Resource Title: Chr06.AnLab_1.5K.gtf.gz.
File Name: Chr06.AnLab1.5K.gtf.gz
Resource Description: Chromosome 6 SNP annotation
Resource Title: Chr06.AnLab_1.5K.vcf.gz.
File Name: Chr06.AnLab1.5K.vcf.gz
Resource Description: Chromosome 6 sample genotypes
Resource Title: Chr07.AnLab_1.5K.gtf.gz.
File Name: Chr07.AnLab1.5K.gtf.gz
Resource Description: Chromosome 7 SNP annotation
Resource Title: Chr07.AnLab_1.5K.vcf.gz.
File Name: Chr07.AnLab1.5K.vcf.gz
Resource Description: Chromosome 7 sample genotypes
Resource Title: Chr08.AnLab_1.5K.gtf.gz.
File Name: Chr08.AnLab1.5K.gtf.gz
Resource Description: Chromosome 8 SNP annotation
Resource Title: Chr08.AnLab_1.5K.vcf.gz.
File Name: Chr08.AnLab1.5K.vcf.gz
Resource Description: Chromosome 8 sample genotypes
Resource Title: Chr09.AnLab_1.5K.gtf.gz.
File Name: Chr09.AnLab1.5K.gtf.gz
Resource Description: Chromosome 9 SNP annotation
Resource Title: Chr09.AnLab_1.5K.vcf.gz.
File Name: Chr09.AnLab1.5K.vcf.gz
Resource Description: Chromosome 9 sample genotypes
Resource Title: Chr10.AnLab_1.5K.gtf.gz.
File Name: Chr10.AnLab1.5K.gtf.gz
Resource Description: Chromosome 10 SNP annotation
Resource Title: Chr10.AnLab_1.5K.vcf.gz.
File Name: Chr10.AnLab1.5K.vcf.gz
Resource Description: Chromosome 10 sample genotypes
Resource Title: Chr11.AnLab_1.5K.gtf.gz.
File Name: Chr11.AnLab1.5K.gtf.gz
Resource Description: Chromosome 11 SNP annotation
Resource Title: Chr11.AnLab_1.5K.vcf.gz.
File Name: Chr11.AnLab1.5K.vcf.gz
Resource Description: Chromosome 11 sample genotypes
Resource Title: Chr12.AnLab_1.5K.gtf.gz.
File Name: Chr12.AnLab1.5K.gtf.gz
Resource Description: Chromosome 12 SNP annotation
Resource Title: Chr12.AnLab_1.5K.vcf.gz.
File Name: Chr12.AnLab1.5K.vcf.gz
Resource Description: Chromosome 12 sample genotypes
Resource Title: Chr13.AnLab_1.5K.gtf.gz.
File Name: Chr13.AnLab1.5K.gtf.gz
Resource Description: Chromosome 13 SNP annotation
Resource Title: Chr13.AnLab_1.5K.vcf.gz.
File Name: Chr13.AnLab1.5K.vcf.gz
Resource Description: Chromosome 13 sample genotypes
Resource Title: Chr14.AnLab_1.5K.gtf.gz.
File Name: Chr14.AnLab1.5K.gtf.gz
Resource Description: Chromosome 14 SNP annotation
Resource Title: Chr14.AnLab_1.5K.vcf.gz.
File Name: Chr14.AnLab1.5K.vcf.gz
Resource Description: Chromosome 14 sample genotypes
Resource Title: Chr15.AnLab_1.5K.gtf.gz.
File Name: Chr15.AnLab1.5K.gtf.gz
Resource Description: Chromosome 15 SNP annotation
Resource Title: Chr15.AnLab_1.5K.vcf.gz.
File Name: Chr15.AnLab1.5K.vcf.gz
Resource Description: Chromosome 15 sample genotypes
Resource Title: Chr16.AnLab_1.5K.gtf.gz.
File Name: Chr16.AnLab1.5K.gtf.gz
Resource Description: Chromosome 16 SNP annotation
Resource Title: Chr16.AnLab_1.5K.vcf.gz.
File Name: Chr16.AnLab1.5K.vcf.gz
Resource Description: Chromosome 16 sample genotypes
Resource Title: Chr17.AnLab_1.5K.gtf.gz.
File Name: Chr17.AnLab1.5K.gtf.gz
Resource Description: Chromosome 17 SNP annotation
Resource Title: Chr17.AnLab_1.5K.vcf.gz.
File Name: Chr17.AnLab1.5K.vcf.gz
Resource Description: Chromosome 17 sample genotypes
Resource Title: Chr18.AnLab_1.5K.gtf.gz.
File Name: Chr18.AnLab1.5K.gtf.gz
Resource Description: Chromosome 18 SNP annotation
Resource Title: Chr18.AnLab_1.5K.vcf.gz.
File Name: Chr18.AnLab1.5K.vcf.gz
Resource Description: Chromosome 18 sample genotypes
Resource Title: Chr19.AnLab_1.5K.gtf.gz.
File Name: Chr19.AnLab1.5K.gtf.gz
Resource Description: Chromosome 19 SNP annotation
Resource Title: Chr19.AnLab_1.5K.vcf.gz.
File Name: Chr19.AnLab1.5K.vcf.gz
Resource Description: Chromosome 19 sample genotypes
Resource Title: Chr20.AnLab_1.5K.gtf.gz.
File Name: Chr20.AnLab1.5K.gtf.gz
Resource Description: Chromosome 20 SNP annotation
Resource Title: Chr20.AnLab_1.5K.vcf.gz.
File Name: Chr20.AnLab1.5K.vcf.gz
Resource Description: Chromosome 20 sample genotypes
Resource Title: Data_Directory.AnLab_1.5k.csv.
File Name: Data_Directory.AnLab_1.5k.csv
Resource Description: This is the data directory for this data set
This dataset accompanies a manuscript submission to Water Resources Research. The data herein consists of all of the hourly meteorological forcing variables needed to execute the iSnobal physically based snow model over the Tuolumne River Basin in the Sierra Nevada of California for water years 2013 to 2016. The variables are presented as vectors and include (1) air temperature, (2) relative humidity, (3) computed dew point temperature, (4) computed vapor pressure, (5) precipitation mass, (6) wind speed, (7) wind direction, (8) incoming solar radiation, and (9) a computed cloud factor product. Each variable has been through rigorous quality assurance and quality control to ensure that the data is model-ready. That is, there are no temporal data gaps over the total model domain, yet measurements from singular meteorological sites can go offline from time to time.
Resource Title: Dataset: Direct insertion of NASA Airborne Snow Observatory-derived snow depth time-series into the iSnobal energy balance snow model (Zenodo).
File Name: Web Page, url: https://zenodo.org/record/1228400#.W8YDzGhKiUk
The file structure is organized as follows:
\nASO_50m_depth_surfaces - This folder contains the Airborne Snow Observatory lidar-derived snow depth products aggregated to 50m gridded spatial resolution. Each file is titled with a date such as ‘TBYYYYMMDD_SUPERsnow_depth.asc’. The coordinates are in UTM zone 11N and use the WGS84 coordinate system.
\nstatic_grids
\nThe directories for each water year contain the configuration file for that year along with the vector meteorological data from measurement sites and site metadata in .csv format.
\nThis dataset reports discovery and initial comparative analysis of 88 presumptive microRNA (miRNA) sequences from the stable fly, obtained using high-throughput sequencing of small RNAs. The majority of stable fly miRNAs were 22-23 nucleotides (nt) in length. Many miRNAs were arthropod specific, and several mature miRNA sequences showed greater sequence identity to miRNAs from other blood-feeding dipterans such as mosquitoes rather than to Drosophilids. This initial step in characterizing the stable fly microRNAome provides a basis for further analyses of life stage-specific and tissue-specific expression to elucidate their functional roles in stable fly biology.
\nThe stable fly, Stomoxys calcitrans (L.), is a serious ectoparasite affecting animal production and health of both animals and humans. Stable fly control relies largely on chemical insecticides; however, the development of insecticide resistance as well as environmental considerations requires continued discovery research to develop novel control technologies. MicroRNAs are a class of short noncoding RNAs that have been shown to be important regulators of gene expression across a wide variety of organisms, and may provide an innovative approach with regard to development of safer more targeted control technologies.
Resource Title: Table 1. miRNAs identified in pooled life stages of the stable fly S. calcitrans and corresponding miRBase 18 entries.
File Name: Web Page, url: https://academic.oup.com/view-large/91020692
miRNAs identified in pooled life stages of the stable fly S. calcitran. and corresponding miRBase 18 entries (≥10 reads, sorted by abundance).
Four to six-week-old larvae of Trogoderma variabile and Trogoderma inclusum were used for the experiment. Both strains were originally obtained from the field in north-central Kansas in 2016 and 2012, respectively. Colonies of these species were reared under controlled conditions in an environmental chamber set to a temperature of 27.5 °C, 65% RH, and 14:10 (L:D) h photoperiod. Both species were fed 300 g of ground dog food (SmartBlend, Lamb flavor, PurinaOne, St. Louis, MO, USA) with oats sprinkled on top and a moistened, crumpled paper towel placed on the surface in a 950-ml mason jar.
\nTreatments\nThe long-lasting insecticide-incorporated polyethylene netting (2 × 2 mm mesh, D-Terrance, Vestergaard Inc., Lausanne, Switzerland) included 0.4% deltamethrin, or control netting that was identical in physical properties but without insecticide. These were used with the movement assay. We assessed the movement in the vicinity of important pheromonal and food kairomones after exposure to LLIN or control netting. Food consisted of 0.01 g of organic, unbleached flour (Heartland Mills, Marienthal, KS, USA), and pheromonal stimuli included a broad spectrum, multi-species lure (PTL lure, IL-108-10, Batch#1288200321, Insects Limited, Westfield, IN, USA), including Trogoderma spp pheromone (Ranabhat et al. 2023a). In each replicate, we used a single pellet (white color), and affixed it in place so it did not move in a Petri dish using a 1 × 1 mm square of parafilm. For each replication of testing, we used a fresh lure.
\nMovement Assay\nThe movement of larvae after exposure to the 0.4 % deltamethrin LLIN or a control netting in response to food cues (using 0.01 g of flour) or with conspecific sex pheromones (using a single bead from a disaggregated PTL lure held in place with a small square of parafilm), was tracked in six individual arenas (100 × 15 mm D: H) with a piece of filter paper (85 mm D, Ahlstrom-Munksjö, Helsinki, Finland) lining the bottom for 30 min using a network camera (GigE, Basler AG, Ahrenburg, Germany) affixed 76 cm above and centered over the dishes. The Petri dishes were backlit using a LED light box (42 × 30 cm W:L LPB3, Litup, Shenzhen, China) to increase contrast and affixed in place with white foam board. The video was streamed to a computer and processed in Ethovision (v.14.5 Noldus Inc., Leesburg, VA, USA). Prior to use in the movement assay, larvae of T. variabile or T. inclusum were exposed to the 0.4% deltamethrin LLIN or a control netting for 1 min in a 21 × 21 cm square Petri dish, then their movement was tracked individually after a post-exposure holding duration of 1 min or 24 h. A small 1.1 cm hidden stimulus zone encircled each stimulus, midway and centered on each half of the arena wherein movement was tracked separately from each half of the arena (control vs. treatment). The total distance moved (cm), instantaneous velocity (cm/s), frequency of entering each half of the petri dish and stimulus zone, cumulative duration spent in each zone (s), and latency of entering each zone (s) over a 30 min trial period was logged after exposure to a given treatment. The control side of the arena remained empty. A total of n = 16 replicates were run per treatment combination for both species
\nNo-Choice Release-Recapture Assay\nA release- recapture experiment was conducted for the larvae of both T. variabile and T. inclusum where larvae were exposed to the 0.4% deltamethrin LLIN and control netting for 1 min. After exposure, treated insects were released at one corner of the sanded plastic bin (60 × 41.6 × 16.5 cm L:W:H ). A commercial pitfall trap (Dome Trap™, Trécé, Inc., Adair, OK, USA) that contained a PTL lure (used only white beads as above), or 0.01 g flour, or no stimuli (unbaited for control), was deployed in the opposite corner, diagonally across from the release point in the bin. The bins were located in a large (4.8 × 2.1 × 6 m, L:W:H) walk-in environmental chamber (Percival Instruments, Dallas County, IA, USA) set at constant conditions (27.5°C, 60% RH, and 14:10 L:D). A total of 10 larvae were released in each bin during each replicate. Treated larvae were given 24 h to disperse to the semiochemicals in each trap, and then the number of insects captured inside the trap, found on the bottom of the trap, on the stimulus half of container or on the non-stimulus half of the container were recorded. A total of n = 12 replicates were performed per treatment combination for the larvae of each species.
\nResources in this dataset:
\nResource Title: Ethovision Movement Assay\nFile Name: ranabhat_etal_larval_dermestid_et_LLIN_olfactory_agdata_commons.csv
\nResource Title: No-Choice Release-Recapture Assay for Larger Cabinet Beetle\nFile Name: ranabhat_etal_larval_dermestid_rr_lcb_LLIN_agdata_commons.csv
\nResource Title: No-Choice Release-Recapture Assay for Warehouse Beetle\nFile Name: ranabhat_etal_larval_dermestid_rr_whb_LLIN_agdata_commons.csv
\nRed flour beetles have been known to readily infest wheat flour but their likelihood to choose other types of flours is unknown. Red flour beetles will lay eggs in many types of flours but their choice to infest low- and no-gluten flours remains to be tested. Here we test a panel of 14 different commercially available flours in three different choice assays. We find that the beetles lay similar amounts of eggs in buckwheat, teff, millet, rice, and rye flours but that they show significant declines in preference for sorghum, potato, quinoa, cassava, oat, amaranth, garbanzo, spelt, and corn flours. By using three different assays - a wind tunnel, a large arena, and a small arena - we can further parse out differences in whether volatiles or texture of the flour may play a bigger role in choosing these flours to lay their eggs. The number of eggs laid in each of these 14 flours, plus a wheat control, is reported for both the large and small arenas and preference or movement toward the flour source is reported for a wind tunnel assay.
Resource Title: Eggs laid in flours in larger arena.
File Name: large_arena_choice_test.csv
Resource Description: Number of eggs laid in each flour patch in the larger arena tested (45.7 x 55 x 8.9 cm). Flours were placed on a 110-mm filter paper and 20 mixed sex adults were introduced to the arena for four days. Dataset reports whether the arenas were on the left or right of the humidity and temperature controlled chamber (Side), the position from the door from front to back (Position), how many eggs were laid in the wheat (control) flour (Eggs_Wheat), what side of the container the wheat flour was on (aisle or wall, Wheat_Side_of_Box), how many eggs were laid in the other flour tested (Eggs_Other), what the other flour tested was (Other_Flour), where the other flour was in the container (aisle or wall, Other_Flour_Side_of_Box), date experiment was started (Start) and date experiment was ended (End). Eggs were counted after sieving from the flour patch using a dissecting microscope.
Resource Title: Eggs laid in flour in smaller arena.
File Name: small_arena_choice_test.csv
Resource Description: Number of eggs laid in each patch of flour in smaller arena tested (90-mm petri dish). Flour was placed on a 30-mm filter paper on opposite sides of the arena. A single female was introduced to the arena for 48 hours. Eggs were then sieved from the flour and counted using a dissecting microscope. Data reported include what alternative flour was present (Treatment), replicate within each block (rep), the number of eggs counted (egg_count), when the arena was set up and the female introduced (setup), when the eggs were counted (count), what of six blocks was tested (block), and whether the flour patch counted was the wheat (control) or the alternative flour (Alternative) listed in the Treatment column (flour).
Resource Title: Preference for flour as tested in a wind tunnel.
File Name: wind_tunnel_preference_tests_flours_2022.csv
Resource Description: Individual beetles were tested for preference to flour volatiles in a wind tunnel with air flow of 0.45 - 0.53 m/s. Beetles were observed for a maximum of 2 minutes or how long it took for them to leave a 21.59 x 27.94 cm white paper arena placed 55.5 cm from the wind source and 25 cm from the flour. Each beetle was used once and 5 beetles were tested for each flour on each day. Choices are recorded as U for upwind (exited towards the flour source), L for left (exited left side of arena), R for right (exited right side of arena), and D for downwind (exited away from the flour source). Data presented are: Flour tested, Choice, Beetle (1-5 for each flour tested on each day), and Date that assay was run.
Data and analysis from:
Ewing, P. M., Chim, B. K., Lehman, R. M., & Osborne, S. L. (2024). Diversified grain rotations can be highly and reliably productive in unstable climates. Field Crops Research, 310, 109361.
Data was collected from the \"Alternative Rotation\" managed by Dr. Shannon Osborne at the USDA-ARS North Central Agricultural Research Laboratory in Brookings, SD USA. The study was established in 2000 and is a randomized complete block comparing the corn-soybean rotation with some regionally relevant, diversified rotations. It is still being conducted at the Eastern South Dakota Soil and Water Research Farm, also in Brookings. The presented data covers 2001-2016 and is the yield of eight crops grown in 6 rotations of 2-4 crops and years per rotation. Weather data is included.
Analyses in this repository tested whether diversified rotations could a) match the productivity (grain yield) of simplified rotations while b) stabilizing productivity against variable weather in the western Corn Belt. Follow-up analyses look at mechanisms behind observed productivity-stability patterns at the rotation scale.
This is an R repository. See README.md for use instructions. A full and possibly easier-to-use version of this repository is on github: https://github.com/PatrickEwing-USDA/NCARL_altrot_yield
", "title": "Data from: Diversified grain rotations can be highly and reliably productive in unstable climates", "distribution": [ { "@type": "dcat:Distribution", "downloadURL": "https://ndownloader.figshare.com/files/44975242", "format": "zip", "mediaType": "application/zip", "title": "NCARL_altrot_yield.zip" } ], "license": "https://creativecommons.org/licenses/by/4.0/", "bureauCode": [ "005:18" ], "modified": "2024-04-04", "publisher": { "@type": "org:Organization", "name": "Agricultural Research Service" }, "accrualPeriodicity": "R/P1Y", "keyword": [ "Long-term research", "crop rotation and succession", "diversity-productivity relationship", "niche complementarity effect", "overyielding", "diversity-stability relationship" ], "spatial": "{\"type\": \"Point\", \"coordinates\": [-96.80493825807973, 44.352833828501446]}" }, { "identifier": "10.15482/USDA.ADC/1529273", "accessLevel": "public", "contactPoint": { "hasEmail": "mailto:klopp.hans@gmail.com", "fn": "Klopp, Hans" }, "programCode": [ "005:040" ], "description": "This is the Data Set from a paper titled \"Does Increasing the Diversity of Small Grain Cropping Systems Improve Aggregate Stability and Soil Hydraulic Properties?\" The paper is published in the journal Agronomy. The doi for the paper is https://doi.org/10.3390/agronomy13061567. We measured wet and dry aggregate stability, water retention hydraulic conductivity, bulk density and soil carbon concentration on a dryland small grain cropping system study. This study was a dryland study located in Sidney, Montana, USA with 10 cropping systems. We sampled this study after 2 cycles of the four year cropping systems. The 10 cropping systems were continuous spring wheat, continuous winter wheat, continuous barley, pea-spring wheat, pea-barley, pea-winter wheat, pea-barley-camelina-spring wheat, pea-barley-canola-spring wheat, pea-winter wheat-camelina-spring wheat and pea-winter wheat-canola-spring wheat. We found that increasing the diversity of the cropping system did not improve the soil properties that we measured.
", "title": "Data from: Does Increasing the Diversity of Small Grain Cropping Systems Improve Aggregate Stability and Soil Hydraulic Properties?", "distribution": [ { "@type": "dcat:Distribution", "downloadURL": "https://ndownloader.figshare.com/files/43375602", "format": "xlsx", "mediaType": "application/vnd.openxmlformats-officedocument.spreadsheetml.sheet", "title": "RUS Physical Properties_0.xlsx" } ], "license": "https://www.usa.gov/publicdomain/label/1.0/", "bureauCode": [ "005:18" ], "modified": "2023-11-30", "publisher": { "@type": "org:Organization", "name": "Agricultural Research Service" }, "keyword": [ "Small grains", "Cropping Systems", "no-till cropping system", "spring wheat", "barley", "Climate", "Climate, Soils, and Atmosphere", "NP216", "data.gov", "ARS" ], "spatial": "{\"type\": \"Point\", \"coordinates\": [-104.23450469971, 47.739835637551]}" }, { "identifier": "10.15482/USDA.ADC/1518905", "accessLevel": "public", "contactPoint": { "hasEmail": "mailto:warren.copes@usda.gov", "fn": "Copes, Warren" }, "programCode": [ "005:040" ], "description": "The objective was to generate a high-quality draft assembly of the whole genome as a resource for future applications such as temporal and spatial dispersal studies of the pathogen and to investigate genotype diversity relevant in fungicide resistance studies and cypress breeding programs. We report here the genome sequence of Passalora sequoiae 9LC2 that was isolated from Leyland cypress 'Leighton Green' (Cupressocyparis leylandii) in 2017 in southern Mississippi. The draft genome was obtained using Pacific Biosciences (PacBio) SMRT and Illumina HiSeq 2500 sequencing. Illumina reads were mapped to PacBio assembled contigs to determine base call consistency. Based on a total of 44 contigs with 722 kilobase (kb) average length (range 9.4 kb to 3.4 Mb), the whole genome size was estimated at 31,768,716 bp. Mapping of Illumina reads to PacBio contigs resulted in a 1000 x coverage and were used to confirm accuracy of the consensus sequences.
\nThe figures and methods files are documentation in support of a BMC Data Notes publication 'Draft Genome Assembly of Passalora sequoiae a Needle Blight Pathogen on Leyland Cypress'. The images illustrate
\n.
\nResource Title: Fig 1 Leyland cypress blight symptoms.
File Name: Fig1 LC blight.JPG
Resource Description: Leyland cypress tree showing Passalora twig blight symptoms.
Resource Title: Fig 2 Passalora sporulation.
File Name: Fig2 LC sporulation.png
Resource Description: Fig. 2. Infected Leyland cypress leaf with sporulating conidioma of Passalora sequoiae.
Resource Title: Fig 4 Passalora 9LC2 phylogeny.
File Name: Fig 4 Passalora 9LC2 phylogeny.pdf
Resource Description: See Methodology for details about generating the phylogenetic tree.
Resource Title: Fig 3 Passalora conidia.
File Name: Fig 3 Passalora conidia.jpg
Resource Description: Fig. 3. Conidia of *Passalora sequoiae*.
Resource Title: Methodology.
File Name: Copes Methodology.docx
Resource Description: This is a more detailed account of methods used in the 'Draft Genome Assembly of *Passalora sequoiae* a Needle Blight Pathogen on Leyland Cypress'.
Resource Software Recommended: Microsoft WORD,url: http://www.microsoft.com
Draft genome sequences of five Enterococcus faecium, two Enterococcus hirae, and one Enterococcus gallinarum from enviromental sources and chicken carcass rinsates. Isolates were selected for their resistance to the streptogramin antibiotic, Quinupristin-Dalfopristin and were all collected in the United States between 2001 and 2004. Antimicrobial resistance genes were identified conferring resistance to the macrolide-lincosamide-streptogramins, aminoglycosides, tetracycline, beta-lactams, and glycopeptides.
Resource Title: Streptogramin resistant Enterococcus.
File Name: Web Page, url: https://www.ncbi.nlm.nih.gov/bioproject/PRJNA398373
This is digital research data corresponding to a published manuscript in \"Earthworms increase the potential for enzymatic bio-activation of biochars made from co-pyrolyzing animal manures and plastic wastes\" J. Hazardous Materials 2021, Vol. 408, 124405. Dataset may be assessed via the included link at the Dryad data repository.\nWe assessed the enzymatic activation of four different biochars produced from pyrolyzing swine manure and poultry litter, and by co-pyrolyzing these livestock residues with agricultural spent mulch plastic film wastes (plastichars). Enzymatic activation consisted of incubating biochars in soil inoculated with earthworms (Lumbricus terrestris), which acted as biological vectors to facilitate retention of extracellular enzymes onto biochar surface. The activity of carboxylesterase ‒a pesticide-detoxifying enzyme‒ was measured in non-bioturbed soils (reference), linings of the burrows created by earthworms, casts (feces) and biochar particles recovered from the soil.\nMethods are described in the manuscript https://doi.org/10.1016/j.jhazmat.2020.124405. Descriptions corresponding to each figure and table in the manuscript are placed on separate tabs to clarify abbreviations and summarize the data headings and units.
\nResource Title: Earthworms increase the potential for enzymatic bio-activation of biochars made from co-pyrolyzing animal manures and plastic wastes - Dryad Dataset.
File Name: Web Page, url: https://doi.org/10.5061/dryad.kprr4xh6q
The data file, Fig2-5.xslx is an Excel spreadsheet consisting of multiple sub-tabs which are associated with Figures 2, 3, 4, and 5.\nTab “Fig 2A and 2B” - raw data for earthworm mortality and weight for Fig. 2A and 2B along with descriptive statistics such as mean, standard deviation, etc.\nTab “Fig 3” - raw data for carboxylesterase activity in biochar-amended soils after 30 days of incubation. All replicate sample data for different regions of soil are included for Figure 3.\nTab “Fig 4” - all replicate raw data for carboxylesterase activity of biochar particles recovered after incubation for Figure 4.\nTab “Fig 5” - all replicate raw data for enzyme activities in fresh and bioturbed soil and the means and standard deviations for Figure 5.\n
The purpose of the present study was to examine how information source (control—no source, USDA, fictitious hospital, or fictitious social media) impacts perceptions of diet information. Participants included 943 American adults who were aged 18-74 years (M = 37.51, SD = 9.50) and were recruited from across the United States through Amazon Mechanical Turk (MTurk). As a manipulation check we assessed whether participants accurately completed the manipulation by ensuring their response to the question of who made the flyer. Participants who answered the question incorrectly were excluded from the analysis. In total, 537 answered correctly and were included in the analyses (Control = 113, Hospital = 144, Social Media = 121, USDA = 159). The majority of our eligible sample identified as men (N = 350), while the remainder identified as women (N = 185), nonbinary (N = 1), or “other” (N = 1).Participants completed an online survey in which they viewed one flyer containing dietary information and guidance on consuming pulses. The purported source of the flyer information was manipulated to create the 4 conditions. Participants rated the flyer in terms of perceived accuracy, trustworthiness, reliability, desirability for learning more from the source, and likelihood of following the advice. Attitudes, perceived control and norms, and past behavior were used to measure components of the Theory of Planned Behavior (TPB). ANOVA results indicated that the USDA and hospital sources were perceived as more accurate, trustworthy, reliable, and more desirable to learn more from relative to control and social media. There were no differences in likelihood of following guidance depending on source. Multiple regression showed that measures of the TPB were predictors of likelihood of following advice. Participants also ranked their top 3 most trusted sources for health information from a list of 29 sources. Doctors, scientists, nurses, and family and friends were among the most frequently trusted sources. Overall, these findings suggest that trust in the source of information does not influence perceived likelihood of following dietary recommendations for pulses.
Resource Title: Effect of Source on Trust of Pulse Nutrition Information and Perceived Likelihood of Following Dietary Guidance.
File Name: EffectofSource_Data.xlsx
Resource Description: One-way analyses of variance (ANOVA) were used to assess between-condition differences for ratings of each of the 5 primary dependent variables (i.e., perceptions of the flyer; variables named Flyer_InfoAccuracy, Flyer_TrustInSource, Flyer_SourceReliability, Flyer_LearnMore, Flyer_FollowAdvice). Tukey tests were used to examine all pairwise comparisons for each of the significant ANOVA effects. A bivariate Pearson correlation was used to examine the relationship between trust in source and likelihood of following advice (variables Flyer_TrustInSource and Flyer_FollowAdvice). Multiple regression/correlation (MRC) was used to assess whether components of the TPB (TPB_Attitudes1, TPB_Attitudes2, TPB_PerceivedNorms1, TPB_PerceivedNorms2, TPB_PerceivedControl1, TPB_PerceivedControl2, TPB_PastBehavior) were predictive of likelihood of following advice (Flyer_FollowAdvice). Finally, frequency data was used to assess percentage with which participants selected sources as being in their top 3 most trusted (Trust_Ald_2_0_GROUP1-Trust_Ald_2_0_29_RANK). Sources that were selected are noted as either 1, 2, or 3 depending on rank, and the sources participants did not select are listed as #NULL!. Data was analyzed using SPSS statistical software, version 28.
Resource Software Recommended: SPSS,url: https://www.ibm.com/products/spss-statistics?utm_content=SRCWW&p1=Search&p4=43700050715561164&p5=e&gclid=EAIaIQobChMI2fnV4I6e-AIVErfICh00pwcfEAAYASAAEgIkHfD_BwE&gclsrc=aw.ds
Data collected from duplicate laboratory analysis of the functional properties of wheat flour dough mixed with cricket protein powders. Dough properties were evaluated for dough strength and elasticity. Breads were baked from all flour treatments and bread quality evaluated from image analysis of crumb structure, loaf volume, and texture analysis.
\nResources in this dataset:
\nResource Title: Water absorption data\nFile Name: Water Absorption Data.csv\nResource Description: Water absorption for control wheat flours (CF), with added cricket protein powder (E = Entomo Farms; G=GrioPro) at 0 to 20% addition levels.
\nResource Title: Kieffer ratio data\nFile Name: Kieffer analysis R to E ratio.csv\nResource Description: Kieffer data on wheat flour dough with 0 to 20% cricket protein powder added. All terms defined in the included dataset.
\nResource Title: Kieffer force and distance data\nFile Name: Kieffer force and distance.csv\nResource Description: Kieffer force and distance data for wheat flour with cricket protein powder added at 0 to 20% levels. All terms defined in attached data set.
\nDough mixing properties\nFile Name: mixing properties.csv\nResource Description: Dough mixing properties of wheat flour with cricket protein powder added to 0 to 20% (all terms defined in attached data set).
\nResource Title: Texture profile analysis\nFile Name: Texture Profile analysis over time.csv\nResource Description: Texture profile analysis of bread made from wheat flour with cricket protein powder added at 0 to 20% levels. All terms defined in attached data set.
\nData of the biomass production and forage quality (nutritive value) of 13 different tepary bean genotypes managed at four different cutting heights and three different cutting dates. The data was collected during 2020 and 2021 to compare cutting management of tepary bean with forage soybean.\nThe study occurred at the Oklahoma and Central Plains Agricultural Research Center, El Reno, OK (35◦ 34’ N; 98◦ 2’ W, 414 m a.s.l.). Total rainfall was 340 mm in 2019 and 271 mm in 2020. No supplemental irrigation was applied. Weedy grasses were controlled with Clethodim 2EC throughout the growing season at a rate of 231.5 g a.i. ha-1).\nThe study began June 10th 2020 and lasted 90 days. The study was replicated June 10th 2021 and lasted 90 days.\nBiomass was harvested from 0.5 m row lengths at 30-, 45-, or 90-day (end of season) intervals and at heights of 5, 10, or 15 cm above ground level to determine biomass production and regrowth ability. The 90-day interval was cut at 5 cm only and served as a control.\nSubsampling occurred 3 times for the 30 day, 2 times for the 45 day, and once for the 90 day. The 3–30-day samplings were summed to compare to the 90-day cutting. Likewise, the 2–45-day samplings were summed to compare to the 90-day cutting.\nFresh weight of biomass was determined for clipped biomass, samples were dried at 60 ◦C for 72 hr, re-weighed to define dry matter, and subsequently ground to a 2.0 mm particle size for laboratory analysis using a Thomas Scientific Wiley Mill (Swedesboro, NJ, USA). The ground particles were thoroughly mixed and ~50g were scanned with a benchtop NIR (Unity Scientific Spectra Star XT with UCal calibration software, Westborough, MA, USA), and measures of forage quality [acid detergent fiber (ADF), in vitro True Digestibility (IVTD), neutral detergent fiber (NDF), total nitrogen content (N), total digestible nutrients (TDN), and a TDN:CP ratio] were evaluated. The benchtop NIR was validated with wet chemistry each year using approximately 10% of the samples. Occasionally, due to reduced plant growth, replications were combined to determine the forage quality of a genotype.\nCollected biomass (gm-2) was converted to Mgha-1). Data were analyzed with the Proc GLIMMIX procedure in SAS Studio 3.8. Genotype, cutting management (cutting height and cutting interval), and their interactions were considered fixed effects while the intercept of the linear predictor was considered a random effect with year as the subject (level).\nDuring the 90-day period from June to September, some genotypes of tepary bean provided greater amounts of biomass and forage quality than Laredo (forage soybean). The optimal management regime for tepary bean for forage was noted for one end of season (90-day) harvest as this was the best combination of biomass accumulation and forage nutritive value (forage quality).\nBreeding efforts to improve the forage characteristics and agronomic performance of tepary bean are required. Studies to determine the optimal planting rate/density are needed to refine and expand the use of tepary bean as an alternative forage.
\nResource Title: Tepary bean forage yield and quality.
File Name: Tepary data final v2.xlsx
Resource Description: data of the biomass production and forage quality of 13 different tepary bean genotypes
Response of Tribolium castaneum to exposure to long-lasting insecticide treated netting (LLIN). Includes data on multiple exposures over 5 days and exposures to different biotic and abiotic conditions. Also includes data on movement on the LLIN under different conditions. This was collected to understand cumulative effects of exposure to LLIN and provide information on population recovery parameters in using LLIN as a pest management tactic against stored-product insect pests.
Resource Title: Affected Tribolium castaneum post-exposure to long-lasting insecticide treated netting.
File Name: all_alternative_factors_data_stacked_to_upload.xlsx
Resource Description: Beetles were exposed 10 mixed sex adults at a time in a single 90 mm petri dish to either Treated or Control (untreated) insecticide treated netting. After exposure a single beetle was placed in a well of a 24-well plate under described Condition Tested. Beetles were assessed for whether they were affected (uncoordinated or no movement) after 6 hours and again after 24 hours. Most Conditions were tested in 3 blocks (different dates). If the adult beetle was affected it was scored with a 1; unaffected (normal movement) was scored as 0.
Resource Title: Behavior of Tribolium castaneum under different age and time of day conditions on netting.
File Name: all_behavior_data_to_upload.csv
Resource Description: Behavioral data of Tribolium castaneum on long-lasting insecticide treated netting under different age and time of day conditions. There were 3 blocks of data collected on different dates with 10 beetles exposed to untreated (control) netting and 10 beetles exposed to treated netting. Output is exported from Ethovision XT software. Distances are measured in cm and time is measured in seconds. Frequency is the number of events within the assay time frame. Moving and not moving categories are based on velocity. Highly mobile, mobile, and immobile are based on change in body movements over frames within the video.
Resource Title: Temperature and relative humidity of incubator versus bench.
File Name: all_bench_vs_incubator_temp_RH_to_upload.csv
Resource Description: Temperature (degrees C) and relative humidity recorded by Hobo Dataloggers for the bench, or general laboratory space, and an incubator. These two locations were used to compare recovery of beetles from exposure to long-lasting insecticide treated netting.
Resource Title: Proportion affected for short-term exposure on 5 days and 1 day longer-term exposure.
File Name: all_multiple_exposures_to_upload.csv
Resource Description: These data were collected on adult Tribolium castaneum in groups of 10 adult beetles exposed to either Treated netting or Control (untreated) netting in a 90 mm petri dish. The number affected out of 10 is reported as well as the proportion of affected adults. Affected is uncoordinated or no movement. Three blocks were conducted on 3 different dates and 10 replicate petri on each date. Exposure is represented by the Day and duration of exposure. For example, Day1_10min means day 1 (first exposure) for 10 minutes on the netting. The 30 minute exposure only has Day1_30min and was not repeated multiple days. The same group of 10 replicates for each block were tested 5 days in a row for 10 minutes.
Resource Title: Data Dictionary with Column Descriptions.
File Name: data_dictionary.xlsx
Resource Description: Column descriptions for all datasets included in Data from: Effectiveness of Long-Lasting Insecticide Netting on Tribolium castaneum is Modulated by Multiple Exposures, Biotic, and Abiotic Factors.
Resource Title: Data dictionary with column descriptions.
File Name: data_dictionary.csv
Resource Description: Column descriptions for all datasets included in Data from: Effectiveness of Long-Lasting Insecticide Netting on Tribolium castaneum is Modulated by Multiple Exposures, Biotic, and Abiotic Factors.
With these data, I evaluated whether the diet of Mormon cricket parents affected the diapause and development rate of the eggs that they laid. This was completed with two lab experiments. The first was a ten year experiment conducted at the ARS Northern Plains Agricultural Laboratory in Sidney Montana on a population from Utah (UT, 38.4249 N, 112.8618 W, 1853 m above sea level). Eggs were laid in the lab by males and females collected from the field, and hatched F1 nymphs were fed natural diet until they molted to 7th instar when they were sexed and randomly assigned one of three diet treatments. We prepared diets consisting of 42% macronutrients (protein P and carbohydrates C, in select ratios of P:C), 54% cellulose, 1.8% Wesson’s salt mixture, and 2.2% vitamins, linoleic acid, and cholesterol. We gave each insect one of three diet treatments: 2:1, 1:1, and 1:2 P:C (which we label hi P, PC, and hi C, respectively). They were given this diet until they were 9 day old adults. On June 3, 2013, three females of each diet treatment were paired with males of the same diet treatment (e.g., hi C females were paired with hi C males) and each pair of adults was placed in a nylon cage with a pan of dry sand to mate and lay eggs.
The F2 eggs were collected on July 26, 2013, placed in 25% moistened sand (as above) in a cup marked with the parentage and covered with a lid. One PC female died shortly after being placed in the mating cage and had no eggs; the other mating pairs were alive when the eggs were collected. We placed the eggs in a seasonal temperature program which is best described as 6 weeks of winter, 2 weeks of spring, 10 weeks of summer, and 2 weeks of autumn. The temperature program is then repeated. Eggs were screened for development in the final two weeks of each cycle (the autumn period), and the developed eggs were separated from the undeveloped eggs. Half-developed eggs were also separated from the undeveloped eggs to follow the completion of their development separately. For each egg in the sibling group, we tracked the timing of the fate of each egg: either fully developed (and thus ready to enter winter and hatch the following spring), discard (due to being flat, black, or invaded by fungus), broken, or missing. For some mating pairs, we also collected a few eggs and fixed them, which killed the eggs, but cleared the chorion so that we could review their developmental stages (fate=fixed). The temperature treatments were applied for approximately 10 calendar years starting in 2013 when the eggs were collected and ending in April 2024.
The second experiment was conducted at the ARS Northern Plains Agricultural Laboratory in Sidney Montana on a population from Wyoming (WY, 44.8264 N, 107.8280 W, 2773 m a.s.l). To vary maternal diets for this study, Mormon crickets were caged with or without Northern grasshoppers (Melanoplus borealis) in thirty-two 1 m2 cages on a mountain meadow on Forest Service Road 14 (FSR 14), Bighorn County, Wyoming (location given above). Northern grasshopper 3rd and a few 4th instar nymphs were collected from FSR 14 and placed into cages on June 29, 2018 at densities of 0, 9, 18, and 27 grasshoppers m-2. In order to examine the effects of Mormon cricket density, an equal number of male and female Mormon cricket nymphs (2nd or 3rd instars) were added to the cages on FSR 14 on July 1 at combined densities of 6 and 12 m-2. The thirty-two cages amounted to four replicates of each grasshopper x Mormon cricket density treatment. Adult Mormon crickets were collected from the cages on August 28, 2018 and transported to the insect rearing facility in Sidney, Montana.
To measure development rate as a function of temperature, I aimed to collect five eggs per treatment temperature from 15 mating pairs. Eggs oviposited in the previous 24 h were sifted from the sand and placed in a petri dish with filter paper moistened with water, covered with a lid, and sealed with parafilm. Twelve females oviposited enough eggs to fill all eight temperature treatments (averaging 4.6 eggs per treatment temperature); three females only had enough to fill five or six of the temperature treatments. For each mating pair, eight petri dishes were marked to indicate the source mating pair, date set up, and one of eight treatment temperatures (Tmean): 22:14°C (Tmean=18°C), 24:16°C (Tmean=20°C), 26:18°C (Tmean=22°C), 28:20°C (24°C), 30:22°C (26°C), 32:24°C (28°C), 34:26°C (30°C), and 36:28°C (32°C). Each of eight incubators cycled between 12 h warm and 12 h cool about its Tmean in continuous darkness. Initially, development of embryos was scored every three to four days beginning at day 34 from when the eggs were laid. The developing eyespot was the first embryonic tissue visible with aid of a dissecting scope. Eggs were given six months to show signs of development. None of the eggs at the lowest temperature (22:14°C) showed any development, and so I placed the same petri dishes of eggs in 38:30°C (Tmean=34°C) to measure development at this ninth experimental temperature with the explicit assumption that exposure to the cold temperature for six months did not affect development rate in this high temperature treatment. Development rate is the inverse of time in days from when the eggs were oviposited to Stage 19 when the cricket fills half of the egg. Relatively few embryos grew to stage 23 due to aestivation at high temperatures.
", "title": "Data from: Effects of Parental Diet on Mormon cricket Egg Diapause and Embryonic Development Rate", "distribution": [ { "@type": "dcat:Distribution", "downloadURL": "https://ndownloader.figshare.com/files/46539982", "format": "rtf", "mediaType": "text/rtf", "title": "ReadMe.rtf" }, { "@type": "dcat:Distribution", "downloadURL": "https://ndownloader.figshare.com/files/46539985", "format": "csv", "mediaType": "text/plain", "title": "UtahEggDiapause.csv" }, { "@type": "dcat:Distribution", "downloadURL": "https://ndownloader.figshare.com/files/46539997", "format": "csv", "mediaType": "text/plain", "title": "WY development to stage 19.csv" } ], "license": "https://www.usa.gov/publicdomain/label/1.0/", "bureauCode": [ "005:18" ], "modified": "2024-05-31", "publisher": { "@type": "org:Organization", "name": "Agricultural Research Service" }, "accrualPeriodicity": "irregular", "keyword": [ "diapause", "katydid", "phenology", "maternal effects", "thermal performance", "transgenerational effects", "development rate", "diet", "nutrition" ], "spatial": "{\"type\": \"MultiPoint\", \"coordinates\": [[-112.8618, 38.4249], [-107.828, 44.8264]]}" }, { "identifier": "10.1016/j.dib.2017.08.004", "accessLevel": "public", "contactPoint": { "hasEmail": "mailto:jon.bates@oregonstate.edu", "fn": "Bates, Jonathan D." }, "programCode": [ "005:040" ], "description": "Conifer control in sagebrush steppe of the western United States causes various levels of site disturbance influencing vegetation recovery and resource availability. The data set presented in this article include growing season availability of soil micronutrients and levels of total soil carbon, organic matter, and N spanning a six year period following western juniper (Juniperus occidentalis spp. occidentalis) reduction by mechanical cutting and prescribed fire of western juniper woodlands in southeast Oregon. These data can be useful to further evaluate the impacts of conifer woodland reduction to soil resources in sagebrush steppe plant communities.
Resource Title: Bates, J. D., & Davies, K. W. (2017). Data set on the effects of conifer control and slash burning on soil carbon, total N, organic matter and extractable micro-nutrients. Data in Brief 14:515-523.
File Name: Web Page, url: https://www.sciencedirect.com/science/article/pii/S2352340917303815
The data shows micronutrient availability, 2007–2012, for two big sagebrush-bunchgrass communities following western juniper control. Soil carbon, SOM, and TSN are presented for the BLUEBUNCH and FESCUE sites. All graphical data are in means and standard errors.
Pulmonate snails are the first intermediate host in the life cycle of Bolbophorus damnificus, an important digenetic trematode in Mississippi catfish aquaculture. Two species, the marsh ramshorn snail Planorbella trivolvis and the ghost ramshorn snail Biomphalaria havanensis, commonly inhabit commercial catfish ponds in northwest Mississippi, USA. Low-level, repeated applications of copper sulfate have negative effects on snail reproduction and are effective in reducing snail populations in commercial catfish ponds, although they must be applied judiciously to minimize the phytotoxic and ichthyotoxic effects of copper. At present, little is known regarding population dynamics of these snails and underlying mechanisms driving their proliferation in catfish aquaculture ponds. This study investigated effects of mate availability on egg production in both snail species. Twelve individuals of each species were assigned to one of three treatments based on access to potential mates: continuously (“control”), weekly (“cyclic”), or at a single timepoint (“solitary”). Eggs were collected weekly, and the number of clutches, eggs, and non-viable eggs counted. The study ended at 21 weeks, one week after the final B. havanensis had died. More than 93,000 eggs were counted during the study, with over 60% from P. trivolvis.
", "title": "Data from: Effects of mate availability on egg production in the marsh ramshorn snail, Planorbella trivolvis, and ghost ramshorn snail, Biomphalaria havanensis", "distribution": [ { "@type": "dcat:Distribution", "downloadURL": "https://ndownloader.figshare.com/files/44201492", "format": "xlsx", "mediaType": "application/vnd.openxmlformats-officedocument.spreadsheetml.sheet", "title": "Richardson_etal_Mate Availability_Snail Reproduction_DATA.xlsx" } ], "license": "https://www.usa.gov/publicdomain/label/1.0/", "bureauCode": [ "005:18" ], "modified": "2024-01-24", "publisher": { "@type": "org:Organization", "name": "Agricultural Research Service" }, "accrualPeriodicity": "irregular", "keyword": [ "Reproduction", "mate availability", "planorbid snail hosts", "aquaculture disease", "parasite vector", "catfish", "pulmonate snails", "data.gov", "ARS" ] }, { "identifier": "10.15482/USDA.ADC/25006886.v1", "accessLevel": "public", "contactPoint": { "hasEmail": "mailto:william.morrison@usda.gov", "fn": "Morrison, William R." }, "programCode": [ "005:040" ], "description": "2.1 Experimental insects
\nA laboratory colony of T. castaneum maintained at the USDA Center for Grain and Animal Health Research for over 30 years free of exposure to insecticide was used for these studies. The colony was kept in 0.95-L glass jars with filter paper lids for air flow with a rearing diet consisting of 95% unbleached, organic flour with 5% brewer's yeast added. Jars were held in an environmental chamber set at a temperature of 30 °C, relative humidity (RH) of 65%, and a 16:8 h light/dark photoperiod.
\n2.2 Manipulating diet nutritional quality
\nUnbleached, organic wheat flour was mixed with microcrystalline cellulose (Thermo Fisher Scientific, Waltham, MA, USA), a nonnutritive and nontoxic filler that has a similar particle size to wheat flour to produce three diet treatments that differed in nutritional quality: 0% flour (0 flour:100 cellulose), 25% flour (25:75), and 100% flour (100:0). A treatment with no flour or cellulose was also included, as a no-food control.
\n2.3 Long-lasting insecticide-incorporated polyethylene netting
\nTwo types of Long-lasting insecticide-incorporated nettings (LLINs), both commercially labeled in the USA, were used: CarifendTM (BASF, Ludwigshafen, Germany) and D-TerrenceTM (Vestergaard, Lausanne, Switzerland),. Carifend netting incorporated 0.34% (w/w) α-cypermethrin while D-Terrence netting incorporated 0.4% (w/w) deltamethrin. Control netting was physically identical to the Carifend netting or D-Terrence netting but lacked any insecticide.
\n2.4 Effects of diet on recovery of T. castaneum adults after exposure to LLIN
\nThe netting was cut into squares and secured to the bottoms of square Petri dishes (100 × 100 × 15 mm, L × W × H, VWRTM, Radnor, PA, USA) with double-sided tape and label tape. 20 mixed-sex adults (2- to 3-week-old) were exposed to one of the three netting types (Carifend, D-Terrence, and control) for 2, 24, 48, 72, 96, 120, 144, and 168 h, respectively, with a total of 24 combinations of netting and exposure time treatment. Immediately following exposure, 20 adults were examined for health condition (unaffected, affected and dead) and transferred from the netting arena to recovery arenas. Recovery arenas were Petri dishes (35 × 10 mm, D × H, FalconTM, Franklin Lakes, NJ, USA) with 0.5 g of one of the three flour:cellulose diets (0:100, 25:75, and 100:0)). In addition, arenas without any food were also included as controls. There were 4 replicates for each combination of netting × exposure time × diet.
\nThe condition of T. castaneum were assessed as number of unaffected, affected and dead at 0, 1, 2, 3, 4, 5, 6, and 7 d post-exposure to netting. Adults were recorded as unaffected if they were active and behaving normally with coordinated walking and species-specific movements; affected if they had uncoordinated walking and sluggish movements or were on their backs with legs twitching, and/or could not right themselves after being prodded (i.e., knocked down); finally, dead if they were completely motionless even after prodding. During exposure and recovery, insects were kept in an environmental chamber under the same conditions as described above. Because no T. castaneum adults were observed to be affected and the number of dead was very low after exposure to control netting (Fig. 1), recovery experiments on control netting were not included in rest of the study.
\n2.5 Effects of diet and netting exposure on mobility of T. castaneum adults
\nEighteen newly emerged (≤ 2-day-old), mixed-sex adults that had been reared on standard lab diet were transferred to 0.5 g of one of the assigned diets (0:100, 25:75, and 100:0 flour:cellulose) in Petri dishes (35 × 10 mm, D × H, FalconTM, Franklin Lakes, NJ, USA) for one week. As above, there was also a no food treatment as a control. After the one-week time period, 18 adults from each of the diet treatments were exposed to netting (Carifend, D-Terrence, or control) for 10, 30, 60, or 90 min. Only adults rated as unaffected or affected (e.g., not dead) were further evaluated for impacts on mobility. Immediately following the exposure, adults were recorded for a 30-min period using a video-tracking apparatus combined with Ethovision Software (v.16.0, Noldus, Inc., Leesburg, VA, USA). The equipment was set up to track 6 arenas simultaneously, within each arena a single adult was measured. A piece of white filter paper (85 mm, Ahlstrom-Munksjö, Mt. Holly Springs, PA, USA) was taped to the bottom of Petri dishes (100 × 15 mm, D × H, VWRTM, Radnor, PA, USA). The Petri dishes were affixed with white foamboard 80 cm below a network camera (GigE, Basler AG, Ahrenburg, Germany) and backlit with a LED light box (42 × 30 cm, W × L, LPB3, Litup, Shenzhen, China). The program calculated the total distance moved (cm), and the mean instantaneous velocity (cm/s) over the 30 min period for each adult. In total, there were 18 replicates for each of the treatment combinations (netting × exposure time × diet).
\nData files for manuscript titled \"Effects of solar energy development on ants in the Mojave Desert\".
\nExcel file with 4 tabs: Metadata; Abundance, Richness, Shannon; Community Composition; and Functional Traits. Metadata is contained within Excel file that describes all variables for each tab.
\nAbstract from paper:\nLand-use change from solar energy development may affect desert ecosystems and the soils, plants, and animals therein, yet our understanding of these interactions is nascent. With their ubiquity, criticality as ecosystem constituents, and sensitivity to environmental variation, ants may be useful study organisms for elucidating ecological effects of solar energy development in deserts. Our objectives were to disentangle the response of a desert ant community to solar energy development decisions and test the efficacy of ants as bioindicators at Ivanpah Solar Electric Generating System (ISEGS, 392 MW) in the Mojave Desert, USA. We used pitfall traps to collect ants in treatments representing different solar energy development decisions, including variably intense site preparation practices: blading (i.e., bulldozing) and mowing, and establishment of undeveloped patches in solar fields replicated across three power blocks comprising ISEGS and in undeveloped control sites surrounding ISEGS. We determined that ant abundance, species richness, Shannon Diversity Index, and functional richness was lower in bladed treatments than in all other treatments and controls. For most taxonomic and functional ant responses, we detected no difference between non-bladed treatments and controls; these results suggest that less intensive site preparation and increased spatial heterogeneity (i.e., undeveloped patches in solar fields) reduce negative effects of solar energy development on desert ants. However, our results suggest that ants may serve as useful bioindicators of the severity of anthropogenic disturbance from solar energy development in deserts, and indicator analysis signifies that solar energy infrastructure may negatively affect some species with high ecological value (e.g., harvester ants). Negative effects of solar energy development on ants can have significant implications for desert ecosystem function and integrity, but conservation-minded solar facility design and construction may lead to avoidance of “bottom-up” ecological ramifications of increased solar production during the renewable energy transition.
", "title": "Data from: Effects of solar energy development on ants in the Mojave Desert", "distribution": [ { "@type": "dcat:Distribution", "downloadURL": "https://ndownloader.figshare.com/files/44540822", "format": "xlsx", "mediaType": "application/vnd.openxmlformats-officedocument.spreadsheetml.sheet", "title": "Mojave Ants MASTER.xlsx" } ], "license": "https://www.usa.gov/publicdomain/label/1.0/", "bureauCode": [ "005:18" ], "modified": "2024-02-15", "publisher": { "@type": "org:Organization", "name": "Agricultural Research Service" }, "keyword": [ "anthropogenic disturbance", "ants", "Formicidae", "functional diversity", "Ivanpah Valley", "land-use change", "Mojave Desert", "site preparation", "solar energy", "NP304", "data.gov", "ARS" ], "spatial": "{\"type\": \"Point\", \"coordinates\": [-115.470714, 35.55653]}" }, { "identifier": "10.15482/USDA.ADC/24851658.v1", "accessLevel": "public", "contactPoint": { "hasEmail": "mailto:erica.spackman@usda.gov", "fn": "Spackman, Erica" }, "programCode": [ "005:040" ], "description": "Tabulated individual data points for data reported in the associated publication: Spackman E, Suarez DL, Lee CW, Pantin-Jackwood MJ, Lee SA, Youk S, Ibrahim S. Efficacy of inactivated and RNA particle vaccines against a North American Clade 2.3.4.4b H5 highly pathogenic avian influenza virus in chickens. Vaccine. 2023 Nov 30;41(49):7369-7376. doi: 10.1016/j.vaccine.2023.10.070. Epub 2023 Nov 4. PMID: 37932132.
The highly pathogenic avian influenza virus (HPAIV) isolate A/turkey/Indiana/22-003707-003/2022 H5N1 (TK/IN/22) and A/Gyrfalcon/Washington/41088/2014 H5N8 (GF/WA/14) isolate were each propagated and titrated in embryonating specific pathogen free (SPF) chicken eggs using standard procedures and titers were determined using the Reed-Muench method.
An in-house vaccine was produced by de novo synthesizing the HA gene of TK/IN/22 that was modified to be low pathogenic (LP) and placing it in a PR8 backbone using rg methods as described . The vaccine (SEP-22-N9) contained 6 genes from PR8 and a de novo synthesized N9 NA from A/blue winged teal/Wyoming/AH0099021/2016 (H7N9). The rg virus was inactivated by treatment with 0.1% beta-propiolactone. Vaccines were produced with Montanide ISA 71 VG (Seppic Inc., Fairfield, NJ) adjuvant at ambient temperature in a L5M-A high shear mixer (Silverson Machines, Inc., East Longmeadow, MA) for 30sec at 1,000rpm, then for 3min at 4,000rpm using an emulsifying screen in accordance with the adjuvant manufacturer’s instructions.
Sham vaccine was prepared in-house using sterile phosphate buffered saline as described above.
Commercial vaccines were supplied by the manufacturers. The commercial inactivated vaccine (1057.R1 serial 590088) (rgH5N1) (Zoetis Inc., Parsippany, NJ) was produced with the GF/WA/14 (clade 2.3.4.4c HA gene) and the remaining 7 gene segments including the NA from PR8 (1). The Sequivity vaccine (serial V040122NCF) (RP) (Merck and Co. Inc., Rahway, NJ) is an updated version of their replication restricted alphavirus vector vaccine that expresses the TK/IN/22 H5 HA (modified to be low pathogenic LP).
Three-week-old, mixed sex, SPF white leghorn chickens (Gallus gallus domesticus) were obtained from in-house flocks and were randomly assigned to vaccine groups.
All vaccines were administered by the subcutaneous route at the nape of the neck. Commercial vaccines were given at the volumes instructed by the manufacturer (0.5ml each). In-house vaccine was given at a dose of 512 hemagglutination units per bird in 0.5ml. Three weeks post vaccination chickens were challenged with 6.7 log10 50% egg infectious doses (EID50) of TK/IN/22 in 0.1ml by the intrachoanal route.
Oropharyngeal (OP) and cloacal (CL) swabs were collected from all birds at 2-, 4-, and 7-days post challenge (DPC). Swabs were also collected from dead and euthanized sham vaccinates at 1DPC.
To evaluate antibody-based DIVA-VI tests, blood for serum was collected from the RP and SEP-22-N9 vaccinated groups at 7, 10 and 14DPC because the SEP-22-N9 vaccine does not elicit antibodies to N1 and the RP vaccine does not elicit antibodies to the N1 or NP proteins.
Mortality and morbidity were recorded for 14DPC after which time the remaining birds were euthanized. If birds were severely lethargic or had neurological signs they were euthanized and were counted as mortality at the next observation time for mean death time calculations.
To determine if there was a difference in antibody levels based on the order of vaccination with the RP vaccine and an inactivated vaccine, groups of 20 chickens (hatch-mates of the chickens in the challenge study) were given one dose of each vaccine three weeks apart (Supplementary Table 1). The first dose was administered at three weeks of age using the RP or SEP-22-N9 vaccine as described above. Then a second dose of either the same vaccine or the other vaccine was administered three weeks later (six weeks of age). All birds were bled for serum three weeks after the second vaccination (nine weeks of age). Antibody was quantified by hemagglutination inhibition (HI) assay as described below using the homologous antigen (TK/IN/22).
RNA was extracted from OP and CL swabs using the MagMax (Thermo Fisher Scientific, Waltham, MA) magnetic bead extraction kit with the modifications described by Das et al., (2). Quantitative real-time RT-PCR was conducted as described previously (3) on a QuantStudio 5 (Thermo Fisher Scientific). A standard curve was generated from a titrated stock of TK/IN/22 and was used to calculate titer equivalents using the real time PCR instrument’s software.
Hemagglutination inhibition assays were run in accordance with standard procedures. All pre-challenge sera were tested against the challenge virus. Sera from birds vaccinated with the rgH5N1 vaccine were also tested against the vaccine antigen, GF/WA/14. Titers of 8 or below were considered non-specific binding, therefore negative.
Pre-vaccination sera from 30 chickens were tested to confirm the absence of antibodies to AIV with a commercial AIV antibody ELISA (IDEXX laboratories, Westbrook, ME) in accordance with the manufacturer’s instructions. Pre- and post-challenge sera from the RP vaccine group (the only vaccine utilized here that does not induce antibodies to the NP) were also tested with this ELISA to characterize the detection of anti-NP antibodies post-challenge.
The ELLA assay was performed in accordance with a previously published protocol with minor modifications (4). Absorbance data were fit to a non-linear regression curve with Prism 9.5 (GraphPad Software LLC, Boston, MA) to determine the effective concentration, and the 98% effective concentration (EC98) of the N1 source virus was subsequently used for NI assays.
To detect N1 antibody with the optimized N1 NA concentrations, serum samples from the sham, SEP-22-N9, and RP vaccinated groups collected pre-challenge, 7, 10 and 14DPC, were heat inactivated at 56°C for one hour and diluted 1:20 and 1:40 using sample dilution buffer. Equal volumes of the N1 NA source virus at a concentration of 2X EC98 was added to each of the diluted serum samples. Then 100µl of the serum-virus mixture was added to the fetuin coated plates after the fetuin plates were washed as described above for the NA assay. Fetuin plates with the serum-virus mixture were then incubated overnight (approximately 17-19hr) at 37°C. The NA assay protocol described above was followed for the remaining NI assay steps.
The percent NI activity of individual serum samples was determined by subtracting percent NA activity from 100. To calculate the percent NA activity, the average background absorbance value was subtracted from the sample absorbance value. The result was then divided by the average value of the NA source virus only (no serum) wells then multiplying by 100. A cut-off value for NI activity for positive detection of N1 antibody from chickens post-challenge was calculated by adding three standard deviations to the mean value obtained from pre-challenge sera of corresponding vaccine group for each dilution tested (1:20 and 1:40).
1. Kapczynski DR, Sylte MJ, Killian ML, Torchetti MK, Chrzastek K, Suarez DL. Protection of commercial turkeys following inactivated or recombinant H5 vaccine application against the 2015U.S. H5N2 clade 2.3.4.4 highly pathogenic avian influenza virus. Vet Immunol Immunopathol. 2017;191:74-9. Epub 2017/09/13. doi: 10.1016/j.vetimm.2017.08.001.
2. Das A, Spackman E, Pantin-Jackwood MJ, Suarez DL. Removal of real-time reverse transcription polymerase chain reaction (RT-PCR) inhibitors associated with cloacal swab samples and tissues for improved diagnosis of Avian influenza virus by RT-PCR. Journal of Veterinary Diagnostic Investigation. 2009;21(6):771-8.
3. Spackman E, Senne DA, Myers TJ, Bulaga LL, Garber LP, Perdue ML, et al. Development of a real-time reverse transcriptase PCR assay for type A influenza virus and the avian H5 and H7 hemagglutinin subtypes. Journal of Clinical Microbiology. 2002;40(9):3256-60.
4. Bernard MC, Waldock J, Commandeur S, Strauss L, Trombetta CM, Marchi S, et al. Validation of a Harmonized Enzyme-Linked-Lectin-Assay (ELLA-NI) Based Neuraminidase Inhibition Assay Standard Operating Procedure (SOP) for Quantification of N1 Influenza Antibodies and the Use of a Calibrator to Improve the Reproducibility of the ELLA-NI With Reverse Genetics Viral and Recombinant Neuraminidase Antigens: A FLUCOP Collaborative Study. Front Immunol. 2022;13:909297. Epub 2022/07/06.
", "title": "Data from: Efficacy of Inactivated and RNA Particle Vaccines in Chickens Against Clade 2.3.4.4b H5 Highly Pathogenic Avian Influenza in North America", "distribution": [ { "@type": "dcat:Distribution", "downloadURL": "https://ndownloader.figshare.com/files/44342078", "format": "xlsx", "mediaType": "application/vnd.openxmlformats-officedocument.spreadsheetml.sheet", "title": "Archive data from clade 2344 HPAIV vaccine study.xlsx" } ], "license": "https://www.usa.gov/publicdomain/label/1.0/", "bureauCode": [ "005:18" ], "modified": "2024-02-12", "publisher": { "@type": "org:Organization", "name": "Agricultural Research Service" }, "accrualPeriodicity": "irregular", "keyword": [ "Highly pathogenic avian influenza", "Vaccine trial", "poultry diseases", "chickens" ], "spatial": "{\"type\": \"Polygon\", \"coordinates\": [[[-126.9140625, 50.138185230437], [-125.33203125, 28.096212229438], [-75.9375, 24.472150437227], [-58.0078125, 46.517295753698], [-126.9140625, 50.138185230437]]]}" }, { "identifier": "10.15482/USDA.ADC/25533952.v1", "accessLevel": "public", "contactPoint": { "hasEmail": "mailto:erica.spackman@usda.gov", "fn": "Spackman, Erica" }, "programCode": [ "005:040" ], "description": "Two commercially available vaccines based on the recombinant herpes virus of turkeys (rHVT) vector were tested against a recent North American clade 2.3.4.4b HPAI virus isolate: A/turkey/Indiana/22-003707-003/2022 H5N1 in specific pathogen free white leghorn (WL) chickens and commercial broiler chickens. One rHVT-H5 vaccine encodes a hemagglutinin (HA) gene designed by the computationally optimized broadly reactive antigen method (COBRA-HVT vaccine). The other encodes an HA gene of a clade 2.2 virus (2.2-HVT vaccine). There was 100% survival of both breeds in the COBRA-HVT vaccinated groups and in the 2.2-HVT vaccinated groups there was 94.8% and 90% survival of the WL and broilers respectively. Compared to the 2.2-HVT vaccinated groups, WL in the COBRA-HVT vaccinated group shed significantly lower mean viral titers by the cloacal route and broilers shed significantly lower titers by the oropharyngeal route than broilers. Virus titers detected in oral and cloacal swabs were otherwise similar among both vaccine groups and chicken breeds. To assess antibody-based tests to identify birds that have been infected after vaccination (DIVA-VI), sera collected after the challenge were tested with enzyme-linked lectin assay-neuraminidase inhibition (ELLA-NI) for N1 neuraminidase antibody detection and by commercial ELISA for detection of antibodies to the NP protein. As early as 7 days post challenge (DPC) 100% of the chickens were positive by ELLA-NI. ELISA was less sensitive with a maximum of 75% positive at 10DPC in broilers vaccinated with 2.2-HVT. Both vaccines provided protection from challenge to both breeds of chickens and ELLA-NI was sensitive at identifying antibodies to the challenge virus therefore should be evaluated further for DIVA-VI.
Methods
Viruses. All procedures using infectious material were reviewed and approved by the Institutional Biosafety Committee of US National Poultry Research Center (USNPRC), US Department of Agriculture-Agricultural Research Service, Athens, GA. The HPAI virus isolate A/turkey/Indiana/22-003707-003/2022 H5N1 (TK/IN/22) was provided by Dr. Mia Torchetti, National Veterinary Services Laboratories, US Department of Agriculture-Animal and Plant Health Inspection Service, Ames, IA. The A/Vietnam/1203/2004 H5N1 HPAI virus (Viet/04), A/Whooper Swan/Mongolia/244/2005 H5N1 (WS/Mongolia/05) HPAI virus, and A/Flycatcher/CA/14875-1/1994 H7N1 low pathogenic avian influenza virus isolates were provided by the repository at the USNPRC. Virus isolates were propagated and titrated in SPF embryonating chicken eggs using standard procedures [1]. Titers were determined using the Reed-Muench method [2].
Vaccines. Two commercial rHVT-H5 vaccines were selected because they are licensed in the US (and may be licensed elsewhere) and were supplied by the manufacturers: 2.2-HVT (Vectormune HVT AIV, Ceva Animal Health LLC, Lenexa, KS) (serial 395-134); and COBRA-HVT (Vaxxitek HVT+IBD+H5, Boehringer-Ingelheim Animal Health USA, Ridgefield, CT) (serial EW003). The amino acid similarity between the vaccine antigens and the challenge virus HA1 was 91.7% (COBRA-HVT) and 91.2% (2.2-HVT).
Challenge study design. All animal work was reviewed and approved by the USNPRC Institutional Animal Care and Use Committee. Mixed sex, SPF WL chickens (Gallus gallus domesticus) were obtained at hatch from in-house flocks. Broiler chicken eggs were obtained from a commercial hatchery at 18 days of incubation prior to administration of any in ovo vaccines and were hatched on-site. All birds were randomly assigned to vaccine groups based on breed. Vaccine groups are shown in Table 1. All vaccines were prepared and administered on the day of hatch by the subcutaneous route at the nape of the neck in accordance with the manufacturer’s instructions (0.2ml per chicken). Serum was collected from all chickens 25 days post vaccination to evaluate the antibody response to the vaccines.
Four weeks post vaccination (four weeks of age) chickens were challenged with a target dose 6.0log10 50% egg infectious doses (EID50) per bird of TK/IN/22 in 0.1ml by the intrachoanal route (titration of the challenge virus after dilution confirmed the challenge dose to be 6.7log10 EID50 per bird). Oropharyngeal and CL swabs were collected from all birds at 2-, 4-, and 7-days post challenge (DPC). Swabs were also collected from dead and euthanized birds.
To evaluate antibody-based DIVA-VI tests, serum was collected at 7-, 10- and 14DPC. Mortality and morbidity were recorded for 14DPC. Surviving birds were euthanized at 14DPC. If birds were severely lethargic or presented with neurological signs, they were euthanized and were counted as mortality at the next observation time for mean death time calculations. Euthanasia was performed by cervical dislocation in accordance with American Veterinary Medical Association guidelines.
Quantitative rRT-PCR (qRRT-PCR). RNA was extracted from OP and CL swabs using the MagMax magnetic bead extraction kit (Thermo Fisher Scientific, Waltham, MA) with the wash modifications as described by Das et al., [3]. Quantitative real-time RT-PCR was conducted as described previously [4] on a QuantStudio 5 (Thermo Fisher Scientific) instrument. A standard curve was generated from a titrated stock of TK/IN/22 and was used to calculate titer equivalents using the real time PCR instrument’s software.
Hemagglutination inhibition assay. Hemagglutination inhibition (HI) assays were run in accordance with standard procedures [5]. All pre-challenge sera collected at 25 days post vaccination were tested against the challenge virus and the closest isolates available to the vaccine antigens. The serum from the 2.2-HVT group was tested against WS/Mongolia/05 (99.3% similarity) and the serum from the COBRA-HVT group was tested against Viet/04 (98.2% similarity). Titers of eight or below were considered negative.
Commercial ELISA. A commercial AIV antibody ELISA (AI Ab Test, IDEXX laboratories, Westbrook, ME) was used in accordance with the manufacturer’s instructions. Sera were tested to detect anti-NP antibodies pre-challenge (25days pos-vaccination) and at 7-, 10- and 14DPC.
Enzyme-linked lectin assay (ELLA) for detection of neuraminidase inhibition (NI) antibody. The ELLA was performed as previously described with minor modifications [6, 7]. Briefly, the NA activity of a beta-propiolactone inactivated H7N1 virus (A/Flycatcher/CA/14875-1/1994) was quantified to determine the effective concentration (EC) of antigen. The 98% EC (EC98) of antigen was subsequently used for the ELLA-NI assays. For ELLA-NI assay, the antigen and serum mixture was incubated overnight (approximately18hr) at 37°C and the NA activity was determined following the procedure as described in Spackman et al. [7]. The average background absorbance value was subtracted from the sample absorbance value then that value was divided by the average values of wells with only NA antigen. This value was multiplied by a factor of 100 to calculate the percent NA activity. The percent NI activity of individual serum samples was determined by subtracting the percent NA activity from 100%. A cut-off value for positive NI activity was determined by adding three standard deviations to the mean NI activity of pre-challenge sera (i.e., NA antibody negative sera) of each corresponding group of chickens at 7-, 10- and 14DPC. Each serum was tested at dilutions of 1:20 and 1:40.
References.
1. Spackman E, Killian ML. Avian Influenza Virus Isolation, Propagation, and Titration in Embryonated Chicken Eggs. Methods Mol Biol. 2020;2123:149-64. Epub 2020/03/15.
2. Reed LJ, Muench H. A simple method for estimating fifty percent endpoints. American Journal of Hygiene. 1938;27:493-7.
3. Das A, Spackman E, Pantin-Jackwood MJ, Suarez DL. Removal of real-time reverse transcription polymerase chain reaction (RT-PCR) inhibitors associated with cloacal swab samples and tissues for improved diagnosis of Avian influenza virus by RT-PCR. Journal of Veterinary Diagnostic Investigation. 2009;21(6):771-8.
4. Spackman E, Senne DA, Myers TJ, Bulaga LL, Garber LP, Perdue ML, et al. Development of a real-time reverse transcriptase PCR assay for type A influenza virus and the avian H5 and H7 hemagglutinin subtypes. Journal of Clinical Microbiology. 2002;40(9):3256-60.
5. Spackman E, Sitaras I. Hemagglutination Inhibition Assay. Methods Mol Biol. 2020;2123:11-28. Epub 2020/03/15.
6. Bernard MC, Waldock J, Commandeur S, Strauss L, Trombetta CM, Marchi S, et al. Validation of a Harmonized Enzyme-Linked-Lectin-Assay (ELLA-NI) Based Neuraminidase Inhibition Assay Standard Operating Procedure (SOP) for Quantification of N1 Influenza Antibodies and the Use of a Calibrator to Improve the Reproducibility of the ELLA-NI With Reverse Genetics Viral and Recombinant Neuraminidase Antigens: A FLUCOP Collaborative Study. Front Immunol. 2022;13:909297. Epub 20220617.
7. Spackman E, Suarez DL, Lee CW, Pantin-Jackwood MJ, Lee SA, Youk S, Ibrahim S. Efficacy of inactivated and RNA particle vaccines against a North American Clade 2.3.4.4b H5 highly pathogenic avian influenza virus in chickens. Vaccine. 2023. Epub 20231104.
", "title": "Data from: Efficacy of commercial recombinant HVT vaccines against a North American clade 2.3.4.4b H5N1 Highly Pathogenic Avian Influenza Virus in chickens", "distribution": [ { "@type": "dcat:Distribution", "downloadURL": "https://ndownloader.figshare.com/files/45435619", "format": "xlsx", "mediaType": "application/vnd.openxmlformats-officedocument.spreadsheetml.sheet", "title": "Lee et al HVT HPAI vaccine in chickens data.xlsx" } ], "license": "https://creativecommons.org/licenses/by/4.0/", "bureauCode": [ "005:18" ], "modified": "2024-04-24", "publisher": { "@type": "org:Organization", "name": "Agricultural Research Service" }, "keyword": [ "Avian influenza", "veterinary vaccine", "poultry vaccine", "vectored vaccines", "highly pathogenic H5N1 avian influenza virus", "highly pathogenic avian influenza A virus", "herpes virus of turkeys vectored vaccine", "Enzyne linked lectin assay", "differentiation of infected from vaccinated animals", "DIVA test", "HVT vaccine" ] }, { "identifier": "10.15482/USDA.ADC/1528656", "accessLevel": "public", "contactPoint": { "hasEmail": "mailto:william.morrison@usda.gov", "fn": "Morrison, William" }, "programCode": [ "005:040" ], "description": "Two grain surface treatment insecticides (deltamethrin and pirimiphos-methyl were evaluated in laboratory assays as a surface treatment for maize to control adult Prostephanus truncatus and Sitophilus zeamais. Both insecticides were applied to 20 g of maize placed in a vial or to the upper one half, one fourth, or one-eighth layer of the maize. Insects were either added to the vials before or after the maize. Mortality, progeny production, and insect damaged kernels (IDK) were then evaluated for each vial. Introduction method (before or after) did not have any impact on any of the variables. Mortality was nearly 100% for all treatments for both insecticides for P. truncatus. Subsequently, progeny production and the number of insect damaged kernels was very low or zero for P. truncatus. Mortality for S. zeamais remained low across layer treatments for deltamethrin. However, S. zeamais was easily controlled by primiphos-methyl. The results of this laboratory study show that while deltamethrin and pirimiphos-methyl has some effectiveness as a layer treatment on a column of maize, efficacy will be dependent on the target species, and the depth of the treated layer, as well as the location on which the insects are present.
Resources in this dataset:
Resource Title: Grain Layer Experiment with P. truncatus & Sitophilus zeamais.
File Name: quellhorst_etal_layer_experiment.csvResource
Description: Insect Mortality on Treated Maize and Progeny Production. For each replicate, 500 g of maize were treated with each insecticide or H2O (e.g., control) as described above. Before proceeding with the experiments, the grain moisture content (m.c.) was assessed, using a moisture meter (mini GAC plus, Dickey-John Europe S.A.S., Colombes, France). The standard plastic cylindrical vials of the Laboratory of Entomology and Agricultural Zoology (LEAZ) were used (3 × 8 cm in diameter by height, Rotilabo Sample tins Snap on lid, Carl Roth, Germany). These were filled with 20g of maize. In each vial, we treated either all the grain (1/1), 1/2, 1/4 or 1/8 of the maize with one of the two insecticides (deltamethrin or pirimiphos-methyl) at the labeled rate. We also either placed the insects at the bottom of the vial (before the maize has been added) or at the top (after the maize has been added). Sets A, B, and C were treated with insecticide on separate days. Insects were given 14 days before mortality counts were performed. After this interval, the mortality was assessed. It is difficult to estimate the upper 1/8 etc. of maize, therefore we based our experiments on ratios of 20 g treated, 20 g untreated, 10 g treated with 10 g untreated, 5 g treated with 15 g untreated and 2 g treated with 18 g untreated. The exact quantities of the samples were weighed with a Precisa XB3200D compact balance (Alpha Analytical Instruments, Gerakas, Greece). The upper rings of the vials were treated with Fluon (Northern Products Inc., Woonsocket, USA) to prevent insects from moving away from the grain and or escaping. The top of each vial also had small holes punched to allow ventilation. Each vial then received 10 P. truncatus adults of mixed sex and age from the Tanzania strain or 10 S. zeamais from Brazil. The vials were placed inside incubators set at 30°C and 65% R.H. After the parental mortality count, all adults were removed, and the vials with maize were returned to the incubator at the conditions indicated above. Sixty days later, the vials were opened again to check progeny production and the number of insect damaged kernels (IDK). For each combination, e.g., insecticide × insect species, there were three replicates with three subreplicates (total 3 × 3 = 9 vials or replicates per combination). There were 2 insecticides × 2 insect species × 4 grain treatments (1/1, 1/2, 1/4, 1/8) × 2 insect introduction methods (before or after) × 9 replicates/subreplicates = 288 vials total, 5760 g of maize, 10 insects per vial × 288 = 2880 total (1440 per LAGB and MW). We also had a separate set of vials for the control with no insecticide= 9 × 2 insect species = 18 vials, 360 g of maize, and 180 insects (90 per species).
Resource Software Recommended: Microsoft Excel,url: https://www.microsoft.com/en-us/microsoft-365/excel
Methods
\nCotton plants were grown in a well-controlled greenhouse in the NC State Phytotron as described previously (Pierce et al, 2019). Flowers were tagged on the day of anthesis and harvested three days post anthesis (3 DPA). The distinct fiber shapes had already formed by 2 DPA (Stiff and Haigler, 2016; Graham and Haigler, 2021), and fibers were still relatively short at 3 DPA, which facilitated the visualization of multiple fiber tips in one image.
\nCotton fiber sample preparation, digital image collection, and image analysis:
\nOvules with attached fiber were fixed in the greenhouse. The fixative previously used (Histochoice) (Stiff and Haigler, 2016; Pierce et al., 2019; Graham and Haigler, 2021) is obsolete, which led to testing and validation of another low-toxicity, formalin-free fixative (#A5472; Sigma-Aldrich, St. Louis, MO; Fig. S1). The boll wall was removed without damaging the ovules. (Using a razor blade, cut away the top 3 mm of the boll. Make about 1 mm deep longitudinal incisions between the locule walls, and finally cut around the base of the boll.) All of the ovules with attached fiber were lifted out of the locules and fixed (1 h, RT, 1:10 tissue:fixative ratio) prior to optional storage at 4°C. Immediately before imaging, ovules were examined under a stereo microscope (incident light, black background, 31X) to select three vigorous ovules from each boll while avoiding drying. Ovules were rinsed (3 x 5 min) in buffer [0.05 M PIPES, 12 mM EGTA. 5 mM EDTA and 0.1% (w/v) Tween 80, pH 6.8], which had lower osmolarity than a microtubule-stabilizing buffer used previously for aldehyde-fixed fibers (Seagull, 1990; Graham and Haigler, 2021). While steadying an ovule with forceps, one to three small pieces of its chalazal end with attached fibers were dissected away using a small knife (#10055-12; Fine Science Tools, Foster City, CA). Each ovule piece was placed in a single well of a 24-well slide (#63430-04; Electron Microscopy Sciences, Hatfield, PA) containing a single drop of buffer prior to applying and sealing a 24 x 60 mm coverslip with vaseline.
\nSamples were imaged with brightfield optics and default settings for the 2.83 mega-pixel, color, CCD camera of the Keyence BZ-X810 imaging system (www.keyence.com; housed in the Cellular and Molecular Imaging Facility of NC State). The location of each sample in the 24-well slides was identified visually using a 2X objective and mapped using the navigation function of the integrated Keyence software. Using the 10X objective lens (plan-apochromatic; NA 0.45) and 60% closed condenser aperture setting, a region with many fiber apices was selected for imaging using the multi-point and z-stack capture functions. The precise location was recorded by the software prior to visual setting of the limits of the z-plane range (1.2 µm step size). Typically, three 24-sample slides (representing three accessions) were set up in parallel prior to automatic image capture. The captured z-stacks for each sample were processed into one two-dimensional image using the full-focus function of the software. (Occasional samples contained too much debris for computer vision to be effective, and these were reimaged.)
\nResource Title: Deltapine 90 - Manually Annotated Training Set.
File Name: GH3 DP90 Keyence 1_45 JPEG.zip
Resource Description: These images were manually annotated in Labelbox.
Resource Title: Deltapine 90 - AI-Assisted Annotated Training Set.
File Name: GH3 DP90 Keyence 46_101 JPEG.zip
Resource Description: These images were AI-labeled in RoboFlow and then manually reviewed in RoboFlow.\n
Resource Title: Deltapine 90 - Manually Annotated Training-Validation Set.
File Name: GH3 DP90 Keyence 102_125 JPEG.zip
Resource Description: These images were manually labeled in LabelBox, and then used for training-validation for the machine learning model.
Resource Title: Phytogen 800 - Evaluation Test Images.
File Name: Gb cv Phytogen 800.zip
Resource Description: These images were used to validate the machine learning model. They were manually annotated in ImageJ.
Resource Title: Pima 3-79 - Evaluation Test Images.
File Name: Gb cv Pima 379.zip
Resource Description: These images were used to validate the machine learning model. They were manually annotated in ImageJ.
Resource Title: Pima S-7 - Evaluation Test Images.
File Name: Gb cv Pima S7.zip
Resource Description: These images were used to validate the machine learning model. They were manually annotated in ImageJ.
Resource Title: Coker 312 - Evaluation Test Images.
File Name: Gh cv Coker 312.zip
Resource Description: These images were used to validate the machine learning model. They were manually annotated in ImageJ.
Resource Title: Deltapine 90 - Evaluation Test Images.
File Name: Gh cv Deltapine 90.zip
Resource Description: These images were used to validate the machine learning model. They were manually annotated in ImageJ.
Resource Title: Half and Half - Evaluation Test Images.
File Name: Gh cv Half and Half.zip
Resource Description: These images were used to validate the machine learning model. They were manually annotated in ImageJ.
Resource Title: Fiber Tip Annotations - Manual.
File Name: manual_annotations.coco_.json
Resource Description: Annotations in COCO.json format for fibers. Manually annotated in Labelbox.
Resource Title: Fiber Tip Annotations - AI-Assisted.
File Name: ai_assisted_annotations.coco_.json
Resource Description: Annotations in COCO.json format for fibers. AI annotated with human review in Roboflow.\n\n
Resource Title: Model Weights (iteration 600).
File Name: model_weights.zip
Resource Description: The final model, provided as a zipped Pytorch `.pth` file. It was chosen at training iteration 600.\nThe model weights can be imported for use of the fiber tip type detection neural network in Python.
Resource Software Recommended: Google Colab,url: https://research.google.com/colaboratory/
Detailed hydrometeorological data from the mountain rain-to-snow transition zone are present for water years 2004 through 2014. The Johnston Draw watershed (1.8 km2), ranging from 1497 – 1869 m in elevation, is a sub-watershed of the Reynolds Creek Experimental Watershed (RCEW) in southwestern Idaho. The dataset includes continuous hourly hydrometeorological variables across a 372 m elevation gradient, on north- and south-facing slopes, including air temperature, relative humidity and snow depth from 11 sites in the watershed. Hourly measurements of solar radiation, precipitation, wind speed and direction, and soil moisture and temperature are available at selected stations. The dataset includes hourly stream discharge measured at the watershed outlet. These data provide the scientific community with a unique dataset useful for forcing and validating models in interdisciplinary studies and will allow for better representation and understanding of the complex processes that occur in the rain-to-snow transition zone.
\nThis version of the data set fixes errors in all data files and supersedes the earlier datasets https://doi.org/10.15482/USDA.ADC/1258769 and https://doi.org/10.15482/USDA.ADC/1245163.
\nSee the file inventory included with this dataset for more information on individual data files.
\nFor more information about this dataset contact:\nClarissa L. Enslin: enslclar@gmail.com\nSarah Godsey: godsey@isu.edu\nDanny G. Marks: ars.danny@gmail.com
\nResource Title: Instrumentation Information.
File Name: Instrumentation_Information.pdf
Resource Title: File name conventions.
File Name: Naming_Convention.pdf
Resource Title: Precipitation from weather station 124.
File Name: precipitation_from_weather_station_124.csv
Resource Title: Precipitation from weather station 125.
File Name: precipitation_from_weather_station_125.csv
Resource Title: Weather Data from 124.
File Name: weather_data_124.csv
Resource Title: Weather Data from 124b.
File Name: weather_data_124b.csv
Resource Title: Weather Data from 125.
File Name: weather_data_125.csv
Resource Title: Weather Data from jdt1.
File Name: weather_data_jdt1.csv
Resource Title: Weather Data from jdt2.
File Name: weather_data_jdt2.csv
Resource Title: Weather Data from jdt2b.
File Name: weather_data_jdt2b.csv
Resource Title: Weather Data from jdt3.
File Name: weather_data_jdt3.csv
Resource Title: Weather Data from jdt3b.
File Name: weather_data_jdt3b.csv
Resource Title: Weather Data from jdt4.
File Name: weather_data_jdt4.csv
Resource Title: Weather Data from jdt4b.
File Name: weather_data_jdt4b.csv
Resource Title: Soil Moisture and Temperature Data from 124ba.
File Name: rc.tg_.dc_.jd-124ba_stm.csv
Resource Title: Weather Data from jdt5.
File Name: weather_data_jdt5.csv
Resource Title: Precipitation Data - original text file uploads.
File Name: Precipitation Data.zip
Resource Title: Weather Data - original text file uploads.
File Name: Weather Data.zip
Resource Title: Soil Moisture and Temperature Data from 124bs.
File Name: rc.tg_.dc_.jd-124bs_stm.csv
Resource Title: Soil Moisture and Temperature Data from jdt1 .
File Name: rc.tg_.dc_.jd-jdt1_stm.csv
Resource Title: Soil Moisture and Temperature Data from jdt2.
File Name: rc.tg_.dc_.jd-jdt2_stm.csv
Resource Title: Soil Moisture and Temperature Data from jdt2b.
File Name: rc.tg_.dc_.jd-jdt2b_stm.csv
Resource Title: Soil Moisture and Temperature Data from jdt3.
File Name: rc.tg_.dc_.jd-jdt3_stm.csv
Resource Title: Soil Moisture and Temperature Data from jdt3b.
File Name: rc.tg_.dc_.jd-jdt3b_stm.csv
Resource Title: Soil Moisture and Temperature Data from jdt4.
File Name: rc.tg_.dc_.jd-jdt4_stm.csv
Resource Title: Soil Moisture and Temperature Data from jdt4b.
File Name: rc.tg_.dc_.jd-jdt4b_stm.csv
Resource Title: Snow depth data from all Johnston Draw Stations.
File Name: rc.tg_.dc_.jd_sc.csv
Resource Title: Soil moisture, temperature and Snow depth - original text file uploads.
File Name: Soil_Moisture_Temperature_and_SnowDepth_Data.zip
Resource Title: README file for Johnston Draw Data Set.
File Name: READMEJohnston_Draw_Dataset_20180206.pdf
Resource Title: Precipitation from weather station 124b.
File Name: precipitation_from_weather_station_124b.csv
Resource Title: File inventory.
File Name: File_Inventory_JDCatchmentV1-1.txt
Menhaden oil was enzymatically modified with caprylic (C8:0) and/or stearic acid (C18:0) to produce structured lipids (SL) with high amount of polyunsaturated fatty acids (PUFA) and melting point of 25-35 degrees centigrade. Linear interpolation was used to determine substrate molar ratios for the reaction. Thermal behavior was determined with DSC and volatile oxidation products by solid phase microextraction (SPME) fiber.
\nThe data files are provided in their original .xlsx format, as well as in .csv. The folders are broken down into the following categories: linear interpolation initial experiments (10g, various molar ratios (1:1,1:3, 1:5), and validation under optimal conditions (both 10g and 500g), and finally large-scale reactions (1kg). There is also a folder (“Data”) containing the initial 10g reactions for the caprylic/stearic acid blends (A,B,C).
\nResource Title: Enzymatic Modification of Menhaden Oil to Incorporate Caprylic and/or Stearic Acid.
File Name: Martini_dataset_NIFA.zip
Resource Description: The .zip file includes the original .xlsx versions and files same files converted to .csv that demonstrating the various reaction models, as well as a README file that describes the dataset and provides a data dictionary and description of file naming structure.
Resource Title: Dataset README file.
File Name: README-menhaden-oil-dataset.txt
Resource Description: Provides a description of the arrangement of folders, contents of the data files, acronyms, codes, abbreviations, parameters/variables, and special software required to use the data.
Arundo donax is a non-native, invasive large-statured grass of riparian systems in the southwestern U.S.A., including the Sacramento and San Joaquin River watersheds of northern California and the Sacramento-San Joaquin Delta. In 2017, the shoot tip-galling wasp Tetramesa romana was released at nine sites, three in each region. Shoots in some release plots were manipulated prior to release by cutting to ground or pruning to 1 m height, while others were left uncut. One year later, exit holes made by emerging adult wasps were found at two of nine sites. Exit hole density per main shoot length was 16-fold higher on regrowth shoots in ground-cut plots than in uncut plots. An additional plot manipulation study at two other sites found that exit hole density per shoot length was 19-fold higher in plots that were double-cut (cut to ground and regrowth pruned) than in single-cut plots. By 2023, T. romana was established at eight sites spanning both river watersheds and their Delta with dispersal up to 6.4 km, based on dissection of shoots, multi-year counts of exit holes and galls, and trapping of adult T. romana with sticky traps. The abundance of T. romana may be limited in northern California by low annual heat unit accumulation. The results show that physical manipulation of host plants improves short-term establishment and demonstrate the importance of using multiple monitoring methods to determine long-term establishment.
", "title": "Data from: Establishment of the wasp Tetramesa romana for biological control of Arundo donax in northern California and the role of release plot manipulation", "distribution": [ { "@type": "dcat:Distribution", "downloadURL": "https://ndownloader.figshare.com/files/45607482", "format": "csv", "mediaType": "text/plain", "title": "Bitume et al 2024 metafile for data.csv" }, { "@type": "dcat:Distribution", "downloadURL": "https://ndownloader.figshare.com/files/45607485", "format": "csv", "mediaType": "application/csv", "title": "Data for Bitume et al 2024 BiolCont 192-105489.csv" }, { "@type": "dcat:Distribution", "downloadURL": "https://ndownloader.figshare.com/files/45607479", "format": "txt", "mediaType": "text/plain", "title": "DataDictionary Bitume et al 2024.txt" } ], "license": "https://creativecommons.org/licenses/by/4.0/", "bureauCode": [ "005:18" ], "modified": "2024-04-18", "publisher": { "@type": "org:Organization", "name": "Agricultural Research Service" }, "accrualPeriodicity": "R/PT1S", "keyword": [ "biological control", "giant reed", "arundo", "Arundo donax", "agent density", "integrated weed management", "mechanical control", "galling wasp", "agent establishment", "Entomology", "Biological Control", "Biological Control-Weeds", "Biological Control-Insects", "Conservation Biological Control", "augmentative biological control" ], "spatial": "{\"type\": \"MultiPoint\", \"coordinates\": [[-122.1, 39.7], [-121.9, 38.1], [-120.1, 36.9]]}" }, { "identifier": "10.15482/USDA.ADC/1523111", "accessLevel": "public", "contactPoint": { "hasEmail": "mailto:john.keele@usda.gov", "fn": "Keele, John" }, "programCode": [ "005:040" ], "description": "Animals were incorporated into pools in different proportions to estimate error and evaluate factors influencing error. Animals were incorporated into 2 types of pools, sub-pools and super pools. Within phenotype, liver abscess or normal, 16 animals were combined into 4 sub-pools, 4 animals per sub-pool in parts of 1:2:3:4. Sub-pools were constructed based on crushed frozen liver tissue mass. Within phenotype, 4 sub-pools were incorporated into 2 super pools in parts of 1:2:3:4 for super pool 1 and 3:4:1:2 for super pool 2. Super pools were made based on DNA quantity. Errors in DNA quantification would create error in forming super pools from sub-pools and variation in cell content or DNA content of liver tissue would result in error in combining sub-pools from animals.
\nAnimal contributions to sub-pools for livers with abscess\nsub-pool 1A was 1:2:3:4 parts of 15A, 36A, 35A, and 23A.\nsub-pool 2A was 1:2:3:4 parts of 42A, 37A, 12A, and 22A.\nsub-pool 3A was 1:2:3:4 parts of 17A, 1A, 49A, and 48A .\nsub-pool 4A was 1:2:3:4 parts of 3A, 20A, 16A, and 13A.\nEach part was 0.1 g of pulverized frozen liver tissue.\nAnimal contributions to livers without abscess\nsub-pool 1N was 1:2:3:4 parts of 46N, 23N, 17N, and 12N.\nsub-pool 2N was 1:2:3:4 parts of 1N, 31N, 6N, and 48N.\nsub-pool 3N was 1:2:3:4 parts of 36N, 43N, 32N, and 13N.\nsub-pool 4N was 1:2:3:4 parts of 34N, 19N, 41N, and 50N.\nSub-pool contributions to super pools for livers with abscess\nsuper pool 1A was:1:2:3:4 parts sub-pool 1A, sub-pool 2A, sub-pool 3A, and sub-pool 4A.\nsuper pool 2A was 3:4:1:2 parts sub-pool 1A, sub-pool 2A, sub-pool 3A, and sub-pool 4A.\nSub-pool contributions to super pools for livers with without abscess\nsuper pool 1N was:1:2:3:4 parts sub-pool 1N, sub-pool 2N, sub-pool 3N, and sub-pool 4N.\nsuper pool 2N was 3:4:1:2 parts sub-pool 1N, sub-pool 2N, sub-pool 3N, and sub-pool 4N.
\nFunded by the USDA Agricultural Research Service, Developing a Systems Biology Approach to Enhance Efficiency and Sustainability of Beef and Lamb Production/ 3040-31000-100-000-D
Resource Title: xy data for individual animals.
File Name: xyIndividuals.csv.gz
Resource Description: X (red) and Y (green) intensity data for 32 animals. There are 64 columns, an X and Y column for each animal
Resource Title: Genotypes, Number of copies of B allele for BovineHD 770K.
File Name: g.csv.gz
Resource Description: Values are 0, 1 and 2 for 32 animals and 777,962 SNP, DNA was extracted from pulverized frozen liver tissue
Resource Title: x and y data for pools.
File Name: xyPools.csv.gz
Resource Description: X (red) and Y (green) intensity for 12 pools. There are 2 columns per pool, first is X followed by Y. First 8 columns are super pools and second 16 are sub-pools.\nExamples\nsuperPool.1A.X is superPool 1 for abscess livers and X intensity\nsub-pool.1A.Y is sub-pools 1 for abscess livers and Y intensity\n
Mediterranean fruit fly males reared for sterile insect technique (SIT) have been shown to have differences in their microbiomes relative to other population sources, which has been postulated to be a factor in the how well flies compete with wild conspecifics. To identify baseline performance metrics on the effects of irradiation on the gut microbiome of mass-reared flies in Hawai’i, a study was performed to assess performance metrics and microbiome (bacterial 16S-rRNA) variation across multiple timepoints. Mediterranean fruit fly pupae were selected from mass-reared trays intended for release, and paired samples were either irradiated or remained as controls and transported to the laboratory for evaluation.
", "title": "Data from: Evaluating impacts of radiation-induced sterilization on the performance and gut microbiome of mass-reared Mediterranean fruit fly (Ceratitis capitata) in Hawai’i.", "distribution": [ { "@type": "dcat:Distribution", "downloadURL": "https://ndownloader.figshare.com/files/47184745", "format": "zip", "mediaType": "application/zip", "title": "ASV_Process.zip" }, { "@type": "dcat:Distribution", "downloadURL": "https://ndownloader.figshare.com/files/47184757", "format": "zip", "mediaType": "application/zip", "title": "Activity.zip" }, { "@type": "dcat:Distribution", "downloadURL": "https://ndownloader.figshare.com/files/47184760", "format": "zip", "mediaType": "application/zip", "title": "Metrics and Survival.zip" }, { "@type": "dcat:Distribution", "downloadURL": "https://ndownloader.figshare.com/files/47216947", "format": "descriptions", "mediaType": "text/plain", "title": "file.descriptions" } ], "license": "https://creativecommons.org/licenses/by/4.0/", "bureauCode": [ "005:18" ], "modified": "2024-06-26", "publisher": { "@type": "org:Organization", "name": "Agricultural Research Service" }, "keyword": [ "16S-rRNA", "bacteria", "Tephritidae", "microbiome", "sterile insect technique", "digestive", "gut" ] }, { "identifier": "10.15482/USDA.ADC/1529103", "accessLevel": "public", "contactPoint": { "hasEmail": "mailto:david.toledo@usda.gov", "fn": "Toledo, David" }, "programCode": [ "005:040" ], "description": "Plant biodiversity data and associated soils, ecological site, and livestock management data that were collected at the USDA-ARS Northern Great Plains Research Laboratory in 2011 and 2013. Data were collected using the modified Whittaker technique. The unique design of the Whitaker method reduces autocorrelation among subplots, which is common in standard transect methods (Goslee, 2006). Grassland scientists worldwide use this standard technique to quantify and monitor plant diversity on, for example, Serengeti grasslands (Anderson et al., 2006), South African serpentine grasslands (Reddy et al., 2009), and rangelands in Turkey (Firinciglu et al., 2007) among many other environments. In addition, Sanderson at the NGPRL and Goslee at ARS University Park have developed a large database on plant species diversity of grazing lands in the U.S. (nearly 300 sites sampled using the Whitaker plot method). The use of the standardized Whitaker plot method allows us to combine data from the northern Great Plains with other databases worldwide for larger-scale meta-analyses. The multiscale technique also enables comparison of vegetation dynamics at multiple scales.
\nResources in this dataset:
\nResource Title: NGPRL modified Whittaker data\nFile Name: NGPRL_ModWhit.csv
\nResource Title: Ancillary data for NGPRL modified Whittaker plots\nFile Name: NGPRL_ModWhit_Ancillary data.csv
\nResource Title: Data dictionary for NGPRL modified Whittaker data\nFile Name: Modified Whittaker dataset dictionary.csv
\nMethods for NGPRL modified Whittaker data\nFile Name: modWhit methods and metadata.docx
\nThis dataset provides information on collection abundances of snails from commercial catfish ponds in the Mississippi Delta Region. Snail trap data were collected from weekly trap (passive) checks and monthly collections (active) from a commercial catfish production facility, Snail species include Planorbella trivolvis, Biomphalaria havanensis, and Physa sp. Data include weekly collections from traps (unknown trapping range) and monthly collections from 1 sq. meter sampling grids.
\nResources in this dataset:
\nResource Title: Monthly box sampling data\nFile Name: boxdat_full2.csv\nResource Description:\npond: individual ponds sampled\nbank: pond bank sampled/location\nptype: FR = fingerling pond, FF = foodfish pond\nsnail: snail taxa\nmonth: month (as date) sampled\nabundance: raw counts from snail traps (truncated at 100 individuals per taxa)\ntemp: water temperature (C)\noxygen: water dissolved oxygen (mg/L)\ntan: total ammonia - nitrogen (mg/L)\nno2: nitrite (mg/L)\nchloride: total water chlorides (mg/L)
\nResource Title: Weekly trap collections\nFile Name: trapdat_full.csv\nResource Description:\nweek: week of sampling (typically occurred on Tuesday of that week)\npond: individual ponds sampled\nptype: FR = fingerling pond; FF = foodfish pond\ntrap: pond bank location of trap (cardinal directions)\nsnail: snail taxa\nabundance: raw counts of snails collected from each trap (truncated at 100 individuals per taxa)\nchloride: total chlorides in the water (mg/L)\ntan: total ammonia - nitrogen (mg/L)\nno2: total ammonia - nitrite (mg/L)\nm_temp: mean water temp (C) across all ponds\nm_oxy: mean dissolved oxygen (mg/L) across all ponds
\nResource Title: Monthly box sampling data.
File Name: boxdat_full2.csv
Resource Description: pond: individual ponds sampled\nbank: pond bank sampled/location\nptype: FR = fingerling pond, FF = foodfish pond\nsnail: snail taxa\nmonth: month (as date) sampled\nabundance: raw counts from snail traps (truncated at 100 individuals per taxa)\ntemp: water temperature (C)\noxygen: water dissolved oxygen (mg/L)\ntan: total ammonia - nitrogen (mg/L)\nno2: nitrite (mg/L)\nchloride: total water chlorides (mg/L)\n
Resource Title: Weekly trap collections.
File Name: trapdat_full.csv
Resource Description: week: week of sampling (typically occurred on Tuesday of that week)\npond: individual ponds sampled\nptype: FR = fingerling pond; FF = foodfish pond\ntrap: pond bank location of trap (cardinal directions)\nsnail: snail taxa\nabundance: raw counts of snails collected from each trap (truncated at 100 individuals per taxa)\nchloride: total chlorides in the water (mg/L)\ntan: total ammonia - nitrogen (mg/L)\nno2: total ammonia - nitrite (mg/L)\nm_temp: mean water temp (C) across all ponds\nm_oxy: mean dissolved oxygen (mg/L) across all ponds
Phosphorus availability often limits primary production in freshwater ecosystems and excessive P inputs promote accelerated eutrophication. Microbial mechanisms may control O2-dependent uptake/release of P in stream sediments and biofilms, but specific organisms responsible for these cycles have not been identified. Polyphosphate Accumulating Organisms (PAOs) are purposely enriched in treatment plants to remove P from wastewater. PAOs release P under anaerobic conditions and take it up under aerobic conditions. It is hypothesized that alternating aerobic/anaerobic conditions promote patterns of P uptake/release similar to those attributed to PAOs in wastewater treatment. Intact, native stream biofilms were collected in the Cascadilla Creek Watershed in Tompkins County, New York, and subjected to laboratory treatments to impose conditions similar to what may occur because of diel oxygenic and respiratory cycles: 1) continuous sparging with air and 2) alternate sparging with air or anaerobic gas (20∶80% by volume CO2∶N2). PO43−, Ca, Mg, total Mn, K, Fe2+, and total S (TS) concentrations in the water were monitored and total P (TP) and polyphosphate (polyP) concentrations in the biofilms at the start and end of the experiment. Microscopy and polymerase chain reaction (PCR) were used to quantify the percentage of cells with stored intracellular polyP and to test for known PAO genes, respectively.
\nThis dataset comprises the data, analysis scripts, and visualization scripts for the paper by Saia et al. entitled 'Evidence for polyphosphate accumulating organism (PAO)-mediated phosphorus cycling in stream biofilms under alternating aerobic/anaerobic conditions. Complete dataset description including information on associated journal article, data, and data analysis R scripts can be found at https://github.com/sheilasaia/paper-p-cycling-in-stream-biofilms/tree/v1.0_for_publication.
Resource Title: Zenodo data package: sheilasaia/paper-p-cycling-in-stream-biofilms: First Public Release.
File Name: Web Page, url: https://doi.org/10.5281/zenodo.242599
This is the first public release of data, analysis scripts, and visualization scripts for the paper by Saia et al. entitled 'Evidence for polyphosphate accumulating organism (PAO)-mediated phosphorus cycling in stream biofilms under alternating aerobic/anaerobic conditions' published in Freshwater Science.
We compared male courtship behavior among parasitoid species in the genus Aphelinus. Male Aphelinus antennate in alternating bouts of waving and simultaneous dipping. Among species, durations of courtship rounds varied, and within these rounds, durations of dipping and waving bouts varied. Furthermore, number of dipping bouts, dips per bout, and positions of male antennae during courtship varied among species. Logistic regression of species on these components of male behavior correctly classified males to species with 95 percent accuracy. Mapping these courtship components onto a molecular phylogeny showed that antennal positions tended to be phylogenetically conserved, whereas antennation durations and numbers of bouts diverged when clades diverged. The overall phylogenetic signal was weak. Comparison of behavioral components between allopatric and sympatric species, controlling for phylogenetic distance, showed little evidence for reinforcement in sympatry.
\nData are presented on parasitoid and host aphid species sampling locations, courtship behavior, and geographical patristic distance.
Resource Title: collection_data.
File Name: collection_data.csv
Resource Description: Parasitoids in nine species of Aphelinus were collected from four aphid species on six plant species in six countries. The parasitoids were shipped or hand-carried as mummified aphids to the containment facility at the USDA-ARS, Beneficial Insect Introductions Research Unit, Newark, Delaware, and maintained under the permits indicated in the dataset. Vouchers for these populations are maintained at -20°C in 100% molecular-grade ethanol at the Beneficial Insect Introduction Research Unit, Newark, Delaware.
Resource Title: courtship_behavior_data.
File Name: courtship_behavior_data.csv
Resource Description: We observed couples for 5 minutes or until courtship started and ended. This meant that observations could extend beyond 5 minutes, if courtship started before 5 minutes but ended later than 5 minutes. Observation arenas were made using two microscope slides with vinyl-foam weather-stripping (5 mm thick) glued to them; on one slide, the weather-stripping had a 10 mm diameter hole bored in it, exposing the slide surface through which observations were made. After observations in which copulation was observed, females were dissected to see whether sperm was transferred. In all dissections, females that copulated carried sperm, thus courtship rounds that led to copulation were considered successful. We recorded behavior using a binocular stereomicroscope (model SMZ 1500, Nikon Instruments, Melville, NY, USA) with a digital camera (model DEI 750D, Optronics, Goleta, CA, USA) connected to a digital video-tape recorder (model HVR-M15AU, SONY, New York, NY, USA) that provided date/time stamps and a DVD recorder (model DMR-EZ28K, Panasonic, Newark, NJ, USA). Video-editing software (Handbrake, version 0.9.9.5530) was used to convert DVD files from VOB to MP4 format. Video-analysis software (Kinovea, version 0.8.15) was used for playback of the observations to determine antennal positions and durations of courtship components. Durations of courtship rounds were measured from the start of male antennation until the end of copulation. The durations of the two types of male antennation (simultaneous dipping and alternate waving) were measured to the nearest tenth of a second. We counted the number of dipping bouts and waving bouts per courtship round, and for dips, we counted the number of dips per dipping bout. Antennal spread at the top and bottom of dips was classified as intraocular, mideye, head or greater than head relative to the width of the female head. Position of male to female antennae at the bottom of dips was classified as above, equal to or below the female antennae. Often the male antennae were close together at the top of the dip and the separation widened as male antennae approached female antennae. The shape of the dip was classified by the change in spread between the top and bottom of the dip as inward (closer at bottom than top), straight (no change), slight (change in one category, e.g. mideye to head width), or large (change in more than one category, e.g. intraocular to greater than head width). Therefore, we measured multiple components of courtship, five of which were categorical and eight of which quantitative, either continuous or discrete.
Resource Title: data_dictionary_Aphelinus_courtship_behavior.
File Name: data_dictionary_Aphelinus_courtship_behavior.csv
Resource Description: Data dictionary for experiments on courtship behavior of nine Aphelinus species.
Resource Title: geographical_patristic_distance_data.
File Name: geographical_patristic_distance_data.csv
Resource Description: Geographical distributions of these species are difficult to determine because of limited sampling and confusion in identification of closely related species. However, we used our collection data and reports from the literature to make our best determination of allopatry versus sympatry for all pairs of species.
Insulin resistance has wide-ranging effects on metabolism but there are knowledge gaps regarding the tissue origins of systemic metabolite patterns, and how patterns are altered by fitness and metabolic health. To address these questions, plasma metabolite patterns were determined every 5 min during exercise (30 min, ~45% of V̇O2peak, ~63 W) and recovery in overnight-fasted sedentary, obese, insulin resistant women under controlled conditions of diet and physical activity. We hypothesized that improved fitness and insulin sensitivity following a ~14 wk training and weight loss intervention would lead to fixed workload plasma metabolomics signatures reflective of metabolic health and muscle metabolism. Pattern analysis over the first 15 min of exercise—regardless of pre- vs. post-intervention status—highlighted anticipated increases in fatty acid tissue uptake and oxidation (e.g., reduced long-chain fatty acids), diminution of non-oxidative fates of glucose (e.g., lowered sorbitol-pathway metabolites and glycerol-3-galactoside [possible glycerolipid synthesis metabolite]), and enhanced tissue amino acid use (e.g., drops in amino acids; modest increase in urea). A novel observation was that exercise significantly increased several xenometabolites (“non-self” molecules, from microbes or foods), including benzoic acid/salicylic acid/salicylaldehyde, hexadecanol/octadecanol/dodecanol, and chlorogenic acid. In addition, many non-annotated metabolites changed with exercise. Although exercise itself strongly impacted the global metabolome, there were surprisingly few intervention-associated differences despite marked improvements in insulin sensitivity, fitness, and adiposity. These results, and previously-reported plasma acylcarnitine profiles, support the principle that most metabolic changes during sub-maximal aerobic exercise are closely tethered to absolute ATP turnover rate (workload), regardless of fitness or metabolic health status.
\nSupporting Materials include graphs of blood patterns of metabolites in adult women during a sub-maximal exercise bout and recovery period, and primary data in spreadsheet format on model performance, exercise and recovery, and correlation statistics for metabolites.
\nJournal information -- Am J Physiol, Endo & Metabolism, Exercise plasma metabolomics and xenometabolomics in obese, sedentary, insulin-resistant women: impact of a fitness and weight loss intervention.
Resource Title: Supporting Materials 1, exercise plasma metabolite excursions, annotated metabolites.
File Name: Supporting Materials 1, exercise metabolite excursions, annotated metabolites, 7-23-19.pdf
Resource Description: Blood plasma concentrations of known, annotated metabolites in adult women during exercise at ~65W for 30 min, then 20 min cool-down
Resource Software Recommended: Adobe Acrobat,url: https://acrobat.adobe.com/us/en/acrobat/pdf-reader.html
Resource Title: Supporting Materials 2, exercise plasma metabolite excursions, non-annotated (unknown identity) metabolites.
File Name: Supporting Materials 2, exercise metabolite excursions, non-annotated (unknown identity) metabolites, 2-7-19.pdf
Resource Description: Blood plasma concentrations of non-annotated (as yet to be identified) metabolites in adult women during exercise at ~65W for 30 min, then 20 min cool-down
Resource Software Recommended: Adobe Acrobat,url: https://acrobat.adobe.com/us/en/acrobat/pdf-reader.html
Resource Title: Supporting Materials 3, Correlation Stats, Pre & Post exercise plasma metabolite patterns in adults, All Timepoints.
File Name: Supporting Materials 3, Correlation Stats, Pre & Post, All Timepoints, 2-16-19 FOR SUBMISSION xls.xls
Resource Description: Correlation data for plasma metabolites using data across 30 min of sub-maximal exercise (~65W), then 20 min cool-down, in adult women
Resource Software Recommended: Microsoft Excel,url: https://products.office.com/en-us/excel
Resource Title: Supporting Materials 4, CDS_SA0002 Analysis Results.
File Name: Supporting Materials 4, CDS_SA0002 Analysis Results, 2-16-19 FOR SUBMISSION xls.xls
Resource Description: Plasma metabolomics data from sub-maximal (~65W) exercise in adult women
Resource Software Recommended: Microsoft Excel,url: https://products.office.com/en-us/excel
The data comprise 2 years of biomass and plant community data from a study on fire and herbivore impacts on vegetation in semi-arid Texas savanna. Data are from 72 10m x 10m plots. We randomly assigned one of three fire treatments (no fire, low-energy fire, and high-energy fire), to each whole plot, resulting in 24 replicates. We then divided each of the seventy-two whole plots into four quadrants and established a subplot in the middle of each quadrant. We randomly assigned one of two herbivory treatments to two subplots within each whole plot, with an herbivore exclusion cage (hereafter exclosure) randomly assigned to two subplots; the remaining two subplots served as controls (herbivore-accessible with no exclosure; hereafter herbivore-accessible). We constructed exclosures from 0.13 x 0.76m 19-gauge steel hardware cloth encircled into a 0.5m diameter cage. We secured them with wires to ensure there were no gaps and securely anchored them to be flush with the soil surface. Similar hardware cloth roofs were constructed and affixed on the top of the exclosures to ensure exclusion of vertebrate herbivores. The herbivore-accessible controls were equivalent diameter subplots without an exclosure.
\nDuring the growing season one year after treatment implementation (April 2019) we selected one exclosure and one herbivore-accessible subplot for above-ground biomass harvesting. We removed exclosures and hand-clipped all vegetation in the plot to soil level, separated it by functional group, placed it in paper bags, and dried it at 60 degrees C for 24hrs prior to weighing. We clipped herbivore-accessible subplots in the same manner using a 0.5m diameter circular wire-frame to mimic the caged area in adjacent subplots. This process was repeated in August 2020 on the two remaining unharvested subplots. Before clipping, for each subplot, we visually assessed the percent cover of each species present following the Daubenmire classification system.
\nResources in this dataset:
\nT-cell epitopes represent sampled environmental- and self-peptides loaded into major histocompatibility complex (MHC) proteins. Bioinformatic tools have been produced to predict these interactions for many species, providing peptides of interest in vaccine development studies.
Prior work by the researchers (DOI: 10.1186/s12859-021-04181-w) assessed the ability of Coxiella burnetii proteins to interact with MHC alleles in human, mouse, and cattle species, the data from which is available on the Open Science Framework repository with accession number RN6QA (DOI: 10.17605/OSF.IO/RN6QA).
Presently, bioinformatic programs NetBoLAIIpan 1.0 and NetMHCpan 4.1 were employed to predict T-cell epitopes within the C. burnetii proteome for the small ruminant species and to expand cattle predictions. The new datasets available herein provide the species, amino acid sequence, position within the protein, GenBank ID, allele name, and the predicted binding strength for each tested peptide.
", "title": "Data from: Expansion of Proteome-wide Coxiella burnetii Comparative T-cell Epitope Prediction to Include Small Ruminant Hosts", "distribution": [ { "@type": "dcat:Distribution", "downloadURL": "https://ndownloader.figshare.com/files/43420953", "format": "txt", "mediaType": "text/plain", "title": "Cattle MHC II Non Binder.txt" }, { "@type": "dcat:Distribution", "downloadURL": "https://ndownloader.figshare.com/files/43421145", "format": "txt", "mediaType": "text/plain", "title": "Cattle MHC II Weak Binder.txt" }, { "@type": "dcat:Distribution", "downloadURL": "https://ndownloader.figshare.com/files/43421097", "format": "txt", "mediaType": "text/plain", "title": "Cattle MHC II Strong Binder.txt" }, { "@type": "dcat:Distribution", "downloadURL": "https://ndownloader.figshare.com/files/43421148", "format": "txt", "mediaType": "text/plain", "title": "Sheep and Goat MHC II Non Binders.txt" }, { "@type": "dcat:Distribution", "downloadURL": "https://ndownloader.figshare.com/files/43421118", "format": "txt", "mediaType": "text/plain", "title": "Sheep and Goat MHC II SB and WB.txt" }, { "@type": "dcat:Distribution", "downloadURL": "https://ndownloader.figshare.com/files/43421151", "format": "txt", "mediaType": "text/plain", "title": "Goat MHCI Non Binder.txt" }, { "@type": "dcat:Distribution", "downloadURL": "https://ndownloader.figshare.com/files/43421214", "format": "txt", "mediaType": "text/plain", "title": "Sheep MHCI Non Binder.txt" }, { "@type": "dcat:Distribution", "downloadURL": "https://ndownloader.figshare.com/files/43421112", "format": "txt", "mediaType": "text/plain", "title": "Sheep and Goat MHC 1 SB AND WB.txt" } ], "license": "https://creativecommons.org/publicdomain/zero/1.0/", "bureauCode": [ "005:18" ], "modified": "2024-01-02", "publisher": { "@type": "org:Organization", "name": "Agricultural Research Service" }, "keyword": [ "Coxiella burnetii", "T-cell epitopes prediction", "bioinformatics", "reverse vaccinology", "subunit vaccine targets", "small ruminants" ] }, { "identifier": "10.15482/USDA.ADC/1527847", "accessLevel": "public", "contactPoint": { "hasEmail": "mailto:nicholas.manoukis@usda.gov", "fn": "Manoukis, Nicholas" }, "programCode": [ "005:040" ], "description": "Jackson traps baited with male lures with or without insecticides are essential components of surveillance and monitoring programs against pest tephritid fruit flies. The ability of a trap to capture a fly that enters, sometimes termed “trap efficiency”, is dependent on many factors including the trap/lure/toxicant combination. We tested the effects of three important components of Jackson traps on efficiency of capture of two important fruit fly species, using the “standard” (i.e., as they are used in the state-wide surveillance program in California) and alternatives: Insecticide (Naled, DDVP or None), type of adhesive on the sticky panel (Seabright Laboratories Stickem Special Regular or Stickem Special HiTack), and use of a single or combination male lure (Methyl eugenol and/or cuelure). Experiments were conducted in large outdoor carousel olfactometers with known numbers of Bactrocera dorsalis and Zeugodacus cucurbitae and by trapping wild populations of the same two species. Lures were aged out to eight weeks to develop a comprehensive dataset on trap efficiency of the various combinations.
Resource Title: Olfactometer data.
File Name: olfactometer-data-rows.csv
Resource Description: Number of flies per trap captured in the olfactometers
Resource Title: Field data.
File Name: field-data-rows.csv
Resource Description: Number of flies caught per trap in the field
Resource Title: Metadata.
File Name: Metadata.txt
Resource Description: Information on columns in each data file
The information in this dataset is from \"Feasibility of Infiltration Galleries for Managed Aquifer Recharge in the Northeast Arkansas Delta\" by Godwin et al., 2020. Included in the dataset are the following raw data:
\nSoil sample chemical analysis data\n-Includes major and minor metals/nutrients, pH, and other chemical properties for samples from selected sites. Data should be used only with\nconsiderations of the sampling and analysis methods described in the publication.
\nResource Title: Table of Well Points .
File Name: WellLogPointsTable.xlsx
Resource Description: This table includes the spatial coordinates, web links, and confining unit thickness data for all of the irrigation wells used in the mapping survey. Well data are from the Arkansas Water Well Construction Commission Database.
Resource Title: Sand-Silt-Clay Soil Sample Data.
File Name: All Samples Sand-Silt-Clay.xlsx
Resource Description: Soil boring sample analysis results from University of Missouri Soil Lab for sand-silt-clay fractionalization.
Resource Title: Select Soil Sample Sand Fractionalization .
File Name: Select Samples Sand Fractionation.xlsx
Resource Description: The results of sand grain-size fractionalization analysis conducted on select samples at the University of Missouri Soil Lab
Resource Title: Soil Sample Sieve Analysis.
File Name: Soil Sample Sieve Analysis DWMRU Lab.xlsx
Resource Description: Results of in-house sieve analysis (USDA Delta Water Management Research Unit) on selected soil boring samples.
Resource Title: Soil Sample Chemical Analyses.
File Name: MissouriSoilTestingLaboratory_Results Sheet.xlsx
Resource Description: Results of various soil chemical analyses conducted at the University of Missouri Soil Lab
Resource Title: Raw Geophysical Data Files.
File Name: Electrical Resistivity Profile Raw Files.zip
Resource Description: Raw geophysical data files\n-Electrical resistivity survey files from the selected reservoir sites collected in partnership with the United States Geological Survey. These are the\nraw files from Inverse-Schlumberger method survey lines at five reservoir sites, which measure differences in soil electrical properties. These\ndifferences correspond to changes in soil texture.
This package includes the data from field experiments to measure the range of attraction of two \"male lures\" on two different pest fruit fly species via Mark-Release-Recapture (MRR). These values will be of importance to those seeking to optimize fruit fly detection networks or other networks of traps. Methyl eugenol is found to be more attractive to Bactrocera dorsalis compared with trimedlure to Ceratitis capitata. Data consists of number released, proportion responsive, quality control assay results, and recaptures in traps set in a grid pattern after the release.
Resources in this dataset:
We evaluated the flight behavior of E. giganteana in response to semiochemicals identified from other closely related Eucosma species, including: (Z)- and (E)-8-dodecenyl acetate, (E)-9-dodecenyl acetate, (Z)-8-dodecenol, (E,E)-8,10-dodecadienyl acetate, and (Z,E)-9,12-tetradecadienyl acetate. The goals of this study were to evaluate whether any of these compounds could improve capture of E. giganteana on clear sticky cards in the field, and whether the most attractive volatiles might affect flight behavior on a computer-automated flight mill assay. We found that there was significant attraction to (E)-8-dodecenyl acetate in two years in the field, which may possibly be a component in the pheromone blend for E. giganteana. On flight mills, E. giganteana flew an average of 23 km in a 24 h period. The presence of attractive stimuli (e.g., (E)-8-dodecenyl acetate) had arresting properties and decreasing flight distance on the mill by 78 to 80%. The longest flight distances were registered in the morning (4:00–12:00) and were 1.8-fold greater than flight distances and durations at night (20:00–4:00). (E)-8-dodecenyl acetate may be useful in behaviorally based monitoring and management strategies for E. giganteana. Overall, our research expands the knowledge on the chemical ecology of adult E. giganteana.
\nDataset includes testing field-captured E. giganteana adults collected from UV light traps deployed at The Land Institute in Salina, KS, and hand-collected at night during the period of peak activity for E. giganteana. Two trials are included: a field baiting assay, and laboratory flight mill assay. In the field baiting assay, each field had three transects spaced at least 10 m apart, each with a full set of semiochemical treatments represented. Each trap within the transect was spaced 10 m apart. Each trap consisted of a 1.27-cm diameter PVC pipe hammered in row with the silflower to a finished height of 1 m, in line with the canopy of Silphium integrifolium. A single 30.4 cm × 30.4 cm clear sticky card (Alpha Scents, Canby, OR, USA) was folded in half and inserted in a 271 cm long sticky card ring holder (Olson Products Inc., Medina, OH, USA). The ring holder was bent at a 90° angle to wedge the card holder upright in position, which was subsequently wedged in the opening at the top of the PVC pipe. A single, capped LDPE 3-mL dropping bottle with one of the semiochemical treatments above was inserted in the top of the PCV pipe opening and affixed in place by tying it to the card holder with garden wire. Every week, the lures were replaced with a freshly prepared treatment and the position of the lure was rotated in the transect every two weeks. Traps were rotated because of the short duration of the flying season and resulted in every treatment occupying every position at least once. Sticky cards were changed on a weekly basis after the first recorded capture of an E. giganteana adult. Traps were deployed 7 June 2019 to 14 August 2019 and 15 June 2020 to 10 August 2020. In total, there were n = 3 replicates of each semiochemical treatment per field site. The number of E. giganteana and Lepidopteran nontargets was counted on each sticky card after freezing cards at −20 °C for at least 24 h.
\nFor the flight mill assay, six adults were run simultaneously on the six flight mills described in the associated article (15-FMASM SDP Unit, Crist Instrument Co., Hagerstown, MD, USA) to test flight capacity. Each trial was started between 15:00 and 18:00 by gently blowing on the insect to initiate flight and run for 24 h in parallel. Assays were conducted at 21.4 ± 0.01 °C temperature and 54.2 ± 0.2% RH and monitored with a datalogger (UX100-011, Hobo, temp/RH logger, Onset, Bourne, MA, USA). The semiochemical treatments in the flight mill assay included (E)-8-dodecenyl acetate, (Z)-9-dodecenyl acetate, and an unbaited control (acetone solvent only). Semiochemicals were freshly prepared in LDPE dropping bottles, as in the field-baiting experiment (as above), and placed in the center among the flight mills on a nonporous glass surface to prevent contamination. There were 12–18 replicates per treatment. At the end of a trial, insects were detached and weighed on a balance. Data were streamed in real time to a computer which automatically record the flight parameters: distance flown, the number of tandem flight bouts over the sampling interval (flights lasting more than 1 s), mean flight bout duration, and mean distance flown per bout. Data were also parsed by time of date to determine maximum time of dispersal. Data were analyzed with R software.
\nSee file list for descriptions of each data file.
Resource Title: Field Baited Sticky Card Assay.
File Name: eucosma_sticky_card_captures_raw_data_2019_2020.csv
Resource Software Recommended: Excel,url: https://www.microsoft.com/en-us/microsoft-365/excel
Resource Title: Flight Mill Assay - 24 h period .
File Name: flight_mill_data_full_day_eucosma.csv
Resource Software Recommended: Excel,url: https://www.microsoft.com/en-us/microsoft-365/excel
Resource Title: Flight Mill Assay - Diurnal Time Course.
File Name: flight_mill_data_period_diurnal_eucosma.csv
Resource Software Recommended: Excel,url: https://www.microsoft.com/en-us/microsoft-365/excel
Resource Title: README file list.
File Name: file_list_Eucosma_semiochemicals.txt
Through discussions with industry stakeholders, the question was raised about whether stocking larger catfish fingerings could reduce losses associated with Henneguya ictaluri, the myxozoan responsible for proliferative gill disease (PGD). To evaluate this, a collaborative study between the USDA-ARS Warmwater Aquaculture Research Unit, University of Georgia, Mississippi State University, and St. George's University (Granada, West Indies) was conducted. Two sizes of channel catfish fingerlings (40 lbs/1000 [small] and 120 lbs/1000 [large]) were stocked into net pens and placed in commercial catfish ponds with varying levels of PGD activity. Following a 7-day pond exposure, mortality was assessed, and all surviving fish used to evaluate gill damage and sub-lethal effects in relation to H. ictaluri loads in the gill tissue and water samples.
Funding for the research comes from USDA-ARS Project 6066-31000-016-000D, and the USDA-ARS-funded Mississippi State University Catfish Health Initiative (Project No. 6066-31320-006-000D).
", "title": "Data from: Fingerling stocking size has no influence on proliferative gill disease severity in farm-raised channel catfish (Ictalurus punctatus)", "distribution": [ { "@type": "dcat:Distribution", "downloadURL": "https://ndownloader.figshare.com/files/45840903", "format": "csv", "mediaType": "application/csv", "title": "pgd_survival_full.csv" }, { "@type": "dcat:Distribution", "downloadURL": "https://ndownloader.figshare.com/files/45840906", "format": "csv", "mediaType": "text/plain", "title": "pgd_filaments.csv" } ], "license": "https://creativecommons.org/licenses/by/4.0/", "bureauCode": [ "005:18" ], "modified": "2024-04-26", "publisher": { "@type": "org:Organization", "name": "Agricultural Research Service" }, "accrualPeriodicity": "irregular", "keyword": [ "fingerlings", "Henneguya ictaluri", "channel catfish", "myxozoan parasites", "aquaculture" ] }, { "identifier": "10113/AA22149", "accessLevel": "public", "contactPoint": { "hasEmail": "mailto:scott.adkins@ars.usda.gov", "fn": "Adkins, Scott" }, "programCode": [ "005:040" ], "description": "Watermelon (Citrullus lanatus) and other cucurbits are important crops grown in Guatemala for local consumption and export. The whitefly (Bemisia tabaci) vector of Cucurbit yellow stunting disorder virus (CYSDV), Melon chlorotic leaf curl virus (MCLCuV), and Squash vein yellowing virus (SqVYV) was observed in fields with numbers increasing during the season. Four samplings of crowns, peduncles, and/or leaves of symptomatic plants were made in March and April 2015. Total RNA was extracted from symptomatic plant tissue and tested by RT-PCR for SqVYV, CYSDV, Papaya ringspot virus (PRSV), and/or begomoviruses. Primers specific for the coat protein gene of SqVYV (1020 bp), CYSDV (707 bp), or PRSV (511 bp), and degenerate begomovirus primers (1159 or 533 bp) amplified products of the expected sizes from 15 of 24, 20 of 24, 4 of 24, or 8 of 8 plants, respectively. SqVYV amplicons from six individual plants from the fourth sampling, SqVYV and CYSDV amplicons from a pool of plants from the third sampling, and degenerate begomovirus amplicons from the second sampling were cloned in the pGEM-T vector. Five clones of each amplicon were sequenced in both directions and representative consensus sequences were deposited in GenBank (Accession Nos. KT007178 to KT007183). Sequence analysis demonstrated that SqVYV coat protein gene sequences from Guatemala shared 99 to 100% nucleotide (nt) identity with each other, and 97 to 98% nt identity with divergent SqVYV isolates previously described from Florida (e.g., WM2005aHi, GenBank Accession No. JF897974) and California (GenBank Accession No. KP218061), but only 90% nt identity with the predominant SqVYV isolate found in Florida (e.g., Sq2003Hi, GenBank Accession No. EU259611) . Tissue blots were prepared from crowns and peduncles from the first, third, and fourth samplings, and tested by tissue blot nucleic acid hybridization assay for SqVYV. Tissue blots indicated SqVYV infection in an additional 48 of 102 watermelon samples, and cylindrical inclusions typical of SqVYV were observed in phloem tissue from the fourth sampling by light microscopy, confirming the identification of SqVYV. This is the first report of SqVYV infecting watermelon in Central America.
Resource Title: First Report of Squash vein yellowing virusin Watermelon in Guatemala.
File Name: Web Page, url: https://apsjournals.apsnet.org/doi/epdf/10.1094/PHP-BR-15-0019
These data are from a study on a new method to quantify flight ability and physical fitness of individual fruit flies which we term ‘Flight Burst Duration’ (FBD). The method consisted of tethering individual insects by the dorsal thorax using a vacuum and measuring the length of time the insect beats its wings while suspended off a surface. Consecutive measurements with Bactrocera dorsalis Hendel (Dipera: Tephritidae) and Zeugodacus cucurbitae Coquillett (Diptera: Tephritidae) in the same day and across days indicated that a single measurement was sufficient, and that FBD was consistent and repeatable. Insects under stress from starvation displayed shorter FBD over time, and we suggest that the measure also relates to the physical condition or survival fitness of the individual. Though somewhat laborious and timeconsuming, we proposed that FBD can be useful for research studies requiring individual-level phenome data and for obtaining estimates quality and dispersive movement for insects.
\nResources in this dataset:
\nResource title: Consecutive Burst Assay data\nFile name: 2017-01_consecutive-data-complete-nal.csv
\nResource title: Longitudinal and Nutritional Deprivation Test Data\nFile name: 2023-08_longitudional-nutritional-data-complete-nal.csv
\nResource title: Metadata\nFile name: README.txt
\nKairomonal and pheromonal stimuli
\nThe pheromone stimuli consisted of a proprietary blend (IL-103, Insects Limited, Westfield, IN, USA) of the sex pheromone for E. kuehniella, including less than 5% concentration by weight of (Z, E)-9,12-tetradecadienyl acetate (e.g., ZETA). The kairomonal stimuli consisted of 20 g of a food cue mixture comprised of cracked wheat, wheat shorts, of wheat germ, and of brewer’s yeast in a 23:7:2:1 ratio. These were the dry components of the E. kuehniella diet.
\nFlight Mill Apparatus
\nFlight mills were assembled after Smith et al. (2012) and Ruiz et al. (2022) (Figure 1). The base assembly consisted of a Delrin rod (95.25 mm length × 38.1 mm diameter) mounted to a 6.35-mm thick equilateral triangular Plexiglass base (each side 13.6 cm long), with screws used as levels. At the top of the rod, a 1.5 cm length (0.72 mm, 22 ga) hypodermic needle was mounted into a hole, and a 5 mm circular magnet was glued to each end of dual 35 mm long metal #1 insect pins at the top of the rod around the axle pin. A unipolar digital Hall effect sensor (OHN3120U, Optek, Inc., Carrollton, TX) was wired to a coupler with one wire for the 5V DC, one ground, and one output signal. This sensor assembly was attached to the top of the Delrin rod with a Plexiglass assembly and thumbscrews. The rotation flight arm assembly consisted of a Teflon bar (2.0 cm length × 1.1 cm diameter) with circular magnets (polarity conserved) glued to the bottom and a hole bored into the bottom to accept the other end of the axle pin that was mounted in the Delrin rod. A hypodermic needle (28 cm length × 0.72 mm diameter) was threaded through a hole in the flight arm assembly, with the ends bent downward at a 95° angle. As a result, the rotation flight arm assembly fit onto the base assembly axle pin, and the circular magnets on the base and bottom of the flight arm assemblies configured to the same polarity kept the arm suspended over the axle, allowing it to spin on the Teflon bearing with very little friction. When the small magnet facing down from the flight arm assembly rotated over the Hall effect sensor, a signal was sent through the output signal wire.
\nThe six flight mills were situated on a 71.1 cm × 91.4 cm piece of plexiglass to minimize vibrations. Each mill was spaced 39 cm apart in tandem (e.g., three in a row) with 25.4 cm between rows. Each mill contained three wires connected to the main connector board (#777101-01, National Instruments, Austin, TX, USA). A DC Power Supply (QW-MS3010D, QW, Tampa, FL) was set to the site and connected to the main wiring block to provide power. A 50-pin ribbon cable (180524-10, National Instruments) ran from the main wiring connector block into a specially made PC port (#77690-01, National Instruments), where a computer with the software Labview 2017 (version 17.0.1f3, National Instruments) automatically recorded the data from the mills. Data intervals for Hall effect sensors were set to 1 ms. Hall sensors were triggered when a magnet from the flight arm passed over, and this was recorded by the software as a voltage change. Schematics, photographs, wiring diagrams, ordering information, and data acquisition programs for this flight mill setup are all available online (Jones et al. 2010)(Flight Mill Studies n.d.).
\nFlight Capacity Experiments
\nSix adults blocked by sex were run simultaneously on the six flight mills described above (15-FMASM SDP Unit, Crist Instrument Co., Hagerstown, MD) to test flight capacity. Freshly eclosed moths were used for the experiments to standardize age, and were likely unmated. A 14-gauge copper wire was stripped into individual threads and cut into 4 cm segments. The copper wire thread was wrapped around an insect pin (#6 insect pin, BioQuip Products, Rancho Dominguez, CA) embedded in modelling clay to form a loop. The loop was pinched with standard metal forceps, the excess wire was ablated on the shorter end with scissors, and the loop was flattened relative to the plane of gravity. The moths were placed singly on a metal mason jar lid suspended on ice and restrained with a 2 oz plastic lid until sessile. Subsequently, the pronotum of E. kuehniella was descaled lightly with an artist’s paintbrush. The copper loop was dipped in instant adhesive (#347908, Evo Stik Multi-Purpose Impact Adhesive, Bostik, Ltd., Leicester, United Kingdom) and affixed onto the pronotum of the adult, ensuring not to impair proper wing functioning in addition to avoiding the eyes and antennae of the adults. The individual was tethered by inserting the point of the copper wire into the end of the hypodermic needle attached to the rotation arm assembly of each flight mill.
\nEach trial was started between 15:00-18:00 by gently blowing by mouth over the back of the insects to initiate flight to provide the opportunity for flight (per the established guidance for tethered flight mill systems: Naranjo 2019) and flight was recorded over initiate the 24 h observation period. Any and all flight bouts were recorded during this time. A flight bout was defined as consecutive rotations of the flight arm of the flight mill by E. kuehniella separated by a pause of 3 s in rotation. Flight mills were housed in a dedicated space in the laboratory under constant conditions (at 21.6 ± 0.01°C, 43 ± 0.2% RH, 14:10 L:D photoperiod). Air flow was gently vented at a mean velocity of 4.57 m per min. Treatments included an unbaited control, kairomone (e.g., food cue), and pheromone (e.g., all as above). Treatment stimuli sources were placed on a platform located directly in the center of the set of flight mills. There was a total of n = 18 reps per treatment combination of stimulus. At the end of a trial, insects were detached from the apparatus and weighed on a balance. Data were streamed in real-time to a computer containing the software, which was used to automatically record the flight parameters, namely distance flown, as well as the number of tandem flight bouts over the sampling interval (flights lasting more than 1 s), and their average length, and average distance flown per bout. To conservatively estimate flight distance, all flight distances consisting of a singleton flight bout were eliminated from the datasets. In addition, to support data quality and avoid the false accumulation of data, revolutions were eliminated if the sum of revolutions on the flight mill divided by the total time spent flying was larger than 3.6 s (the conservatively slowest time E. kuehniella could make a revolution and still be actively flying) and the number of revolutions was greater than 30. Data were also parsed by time of day to determine the time of maximum dispersal. Data were analyzed with R software (v. 2022.02.1 Build 461) (R Core Team 2022). Ggplot2 was used for some of the figures (Wickham et al. 2016).
\nCage Assay
\nTo test flight initiation patterns of E. kuehniella, a cage assay was utilized. Cohorts of 20 adult moths blocked by sex were collected in a plastic bag from colony jars, then briefly anesthetized for no longer than 30 s with N2 gas. Moths were gently placed in a petri dish (100 × 15 mm) lined with polytetrafluoroethylene (PTFE) (MilliporeSigma, Burlington, MA, USA), which was then situated in a randomly chosen corner of a mesh cage (28 × 28 × 28 cm, Bug Dorm, MegaView Science Co. Ltd., Taiwan) and covered with a funnel (height: 12.5 cm; large opening: 15 cm D; small opening: 2.6 cm D). The semiochemical treatments listed above were placed randomly in one of the three remaining corners. Cages were placed in a walk-in environmental chamber under constant conditions (at 25 ℃, 65% RH, 14:10 L:D photoperiod) and given 24 h to respond to the stimuli. The proportion of adults leaving the funnel was measured at the end of the trial period. In total, n = 8 replications were performed with each treatment, translating to 480 total E. kuehniella individuals tested.
\nA compilation of experimental forage data from 108 unique locations across the United States, with harvest dates ranging from 1958 to 2022. This dataset contains a subset of the data compiled in the initial stages of development of the Forage Data Hub. In particular, these are the 37,970 data entries used for the forage system resiliency analysis presented in the primary article.
\nResources in this dataset:
\nResource Title: FDH Data Dictionary\nFile Name: FDH_Data_Dictionary.csv\nResource Description: Data dictionary for the data compiled as a result of the efforts described in Ashworth et al. (2023) - Framework to Develop an Open-Source Forage Data Network to Improve Primary Productivity and Enhance System Resiliency (in review). Includes descriptions for the data fields in the FDH Data data file.
\nResource Title: FDH Data\nFile Name: FDH_Data_03-04-2023.csv\nResource Description: Data compiled as a result of the efforts described in Ashworth et al. (2023) - Framework to Develop an Open-Source Forage Data Network to Improve Primary Productivity and Enhance System Resiliency (in review). Includes a lightly preprocessed version of the data housed in the Forage Data Hub as of March 4th, 2023.
\nA 24-h in vitro culturing method was used to determine whether fructooligosaccharide (FOS) treatment effects on the human gut microbiome has a differential effect by age, using fecal samples from 18 adults in 3 age groups with 6 individuals for each group, young adult (25–35 years of age), adult (36–50 years of age), and older adult (51–70 years of age). Data collected include: amplicon sequencing of the V1-V2 regions of the 16S rRNA gene (available in the NCBI Sequence Read Archive associated with BioProject PRJNA883714: https://www.ncbi.nlm.nih.gov/bioproject/PRJNA883714), total bacterial qPCR, Bifidobacterium genus specific q-PCR, and short chain fatty acid concentrations.
\nResources in this dataset:
\nResource Title: Sample metadata\nFile Name: FOS_sample_attributes.csv
\nResource Title: Short Chain Fatty Acid concentrations\nFile Name: FOS_SCFA_data.csv
\nResource Title: Total bacterial and Bifidobacterium genus qPCR\nFile Name: total_bacteria_and_Bifidobacterium_specific_qPCR.csv
\n[ 2023-07-10 - Supersedes version 1, https://doi.org/10.15482/USDA.ADC/1528679 ]
\nThe Scotch broom gall mite, Aceria genistae, attacks Cytisus scoparius (Scotch broom), an invasive shrub in California, USA. Feeding causes galls (localized tissue distortion) but the effect of A. genistae on overall host vigor and reproduction has not been assessed. We collected data on plant parts between two plants partitioned between two groups, heavily or lightly galled plants, at three northern California sites. Plant parts were measured in the field (plant height, plant width) and others were recorded after harvesting plants (stem, leaf, gall, seed pod, seeds, etc.) and drying them in an oven to a constant weight. Data were natural log transformed. Columns represent (in order): observation number (obs), plant identifier (plantID), Site, treatment (heavy or light galling), Diameter at soil (lnDAS), height, leaf weight (lnLeaf), stem weight (lnStem), fruit weight (lnFruit), gall weight (lnGalls), number of pods (lnpods), seed weight (lnseeds), number of seeds per plant (lnseedsplant), canopy volume (lnVol), canopy diameter at its widest point (lnWidest), canopy area (lnCanopyArea), total biomass of all plant fractions combined (lnTotal), number of stem branches (lnResource).
\nResources in this dataset:
\nThis study produced a comprehensive transcriptome from newly molted adult ticks and will provide a useful resource for studies of tick feeding and host perception and also assist genome annotation refinements.
\nThe goal was to develop a comprehensive transcriptome of adult female Rhipicephalus microplus ticks and discover transcriptome changes that are related to feeding and host-perception prior to feeding. We have sequenced the transcriptomes of unfed newly molted adult female ticks, newly molted adult females that were feeding upon a bovine host for 3 hours following attachment to the host, and newly molted adult females that were placed in a gas-permeable bag attached to a bovine host for 3 hours (attachment to host prevented but host odors available to the ticks). There were 2 biological replicates and transcriptomes assembled from each individual experimental condition. A collective adult female transcriptome was assembled from sequence data pooled from all 3 conditions (using data from all replicates). Differential gene expression was examined using all possible comparisons to detect putative feeding-associated and host perception-associated transcripts.
Resource Title: Gene expression during the early stages of host perception and attachment in adult female Rhipicephalus microplus ticks.
File Name: Web Page, url: https://doi.org/10.1007/s10493-019-00420-1
Sweetpotato (Ipomoea batatas) plays a critical role in food security and is the most important root crop worldwide following potatoes and cassava. In the United States (US), it is valued at over $700 million USD. There are two sweetpotato germplasm collections (Plant Genetic Resources Conservation Unit and US Vegetable Laboratory) maintained by the USDA, ARS for sweetpotato crop improvement. To date, no genome-wide assessment of genetic diversity within these collections has been reported in the published literature. In our study, population structure and genetic diversity of 417 USDA sweetpotato accessions originating from 8 broad geographical regions (Africa, Australia, Caribbean, Central America, Far East, North America, Pacific Islands, and South America) were determined using single nucleotide polymorphisms (SNPs) identified with a genotyping-by-sequencing (GBS) protocol, GBSpoly, optimized for highly heterozygous and polyploid species. Population structure using Bayesian clustering analyses (STRUCTURE) with 32,784 segregating SNPs grouped the accessions into four genetic groups and indicated a high degree of mixed ancestry. A neighbor-joining cladogram and principal components analysis based on a pairwise genetic distance matrix of the accessions supported the population structure analysis. Pairwise FST values between broad geographical regions based on the origin of accessions ranged from 0.017 (Far East – Pacific Islands) to 0.110 (Australia – South America) and supported the clustering of accessions based on genetic distance. The markers developed for use with this collection of accessions provide an important genomic resource for the sweetpotato community, and contribute to our understanding of the genetic diversity present within the US sweetpotato collection and the species.
Resource Title: Supplementary Material.
File Name: Web Page, url: https://www.frontiersin.org/articles/10.3389/fpls.2018.01166/full#supplementary-material
FIGURE S1 | QC Boxplot showing distribution of quality scores of raw reads in a multiplexed library containing 96 Ipomoea batatas accessions. Buffer sequence lie within the first 8 base calls, while variable barcodes (6–9 bp) lie at position 14–17 bp.
\nFIGURE S2 | Proportion raw reads matching both reference subgenomes (6x genotypes) and those specific to each of the subgenomes (4x and 2x genotypes derived Ipomoea trifida and I. triloba, respectively).
\nFIGURE S3 | Boxplot shows relatively uniform read depth across individual samples and genomic loci after de-multiplexing pool samples. Only genotypes with 6 alleles/dose are shown here.
\nFIGURE S4 | Bar plots of Bayesian assignment probabilities for each Ipomoea batatas accession analyzed with segregating 32,784 SNPs using the program STRUCTURE for K = 4. The x-axis indicates accession and the y-axis indicates the assignment probability of that accession to each of the four clusters. Each vertical line represents an individual’s probability of belonging to one of K clusters (represented by different colors) or a combination of if ancestry is mixed. The asterisk (∗) indicates the cultivar Porto Rico, which is a foundational line of the sweetpotato industry in the US. The plus sign (+) indicates that this accession was used as parental material in the mass selection populations developed by Jones et al. (1991). The USDA, ARS, US Vegetable Laboratory (USVL) W-lines and USVL-lines originate from the mass selection populations. Information for all accessions is found in Supplementary Table S1.
\nFIGURE S5 | Linkage disequilibrium estimates (r2) of all genome-wide marker pairs plotted against corresponding interval between marker pairs. Curve (blue line) based on game smoothing method function shows distribution of all data points. Top and middle plot based on genotype data with allelic dosage information, while bottom plot is based on diploidized genotypes.
\nTABLE S1 | Information of Ipomoea batatas accessions analyzed by GBSpoly.
\nTABLE S2 | Pairwise genetic distance matrix between Ipomoea batatas accessions.
\nTABLE S3 | Information for individual SNPs used for data analyses.
\nDATASET S1 | Structure data file for Ipomoea batatas accessions.
Multi-environment trial data of hairy vetch (Vicia villosa Roth.), including 50 environments in the United States and 35 lines screened for traits of interest to cover cropping. Environments are labeled as the unique combination of harvest year (‘19’ for the trials planted in the fall of 2018 and harvested in the spring of 2019, ‘20’ for those planted in the fall 2019 and harvested in the spring of 2020, ‘21’ for the trials planted in the fall of 2020 and harvested in the spring of 2021, and ‘22’ for the trials planted in the fall of 2021 and harvested in the spring of 2022) and the two digit abbreviation of the US state where the trial was located: Lockeford, CA (CA); Americus, GA (GA); Beltsville, MD (MD); St. Paul, MN (MN); Columbia, MO (MO); Caswell, Goldsboro, Kinston, Rocky Mount, or Salisbury, NC (NC); Mandan, ND (ND); Lincoln, NE (NE); Fallon, NV (NV); Varna, NY (NY); Ardmore, OK (OK); Corvallis, OR (OR); Knox City, TX (TX); Prairie du Sac, WI (WI); and Pullman, WA (WA). Environment details including latitude, longitude, soil type, soil taxonomy, planting date, and data collection dates are included in metadata.
\nLines were not consistently tested in all years. Some lines were dropped from low seed supply or poor performance in the trial. Other lines were added as they became available commercially or through breeding programs. Each line was grown in a single 4.57 m row, flanked by one or more rows of triticale (×Triticosecale Wittm. ex A. Camus [Secale × Triticum]). Triticale was used to simulate how growers typically plant hairy vetch in mixture with a winter annual grass. Distance between legume and triticale row varied between 19 and 76 cm, depending on environment (see details in [forthcoming Ag Data Commons ALT database citation]). Plots were planted with 0.66 g of vetch pure live non-hard seed per m, which was increased to 1.1 in 2020-2022 to improve stand uniformity and reduce variability in establishment. Planting depth varied between 1.3 and 3.8 cm. Entries were blocked four times in a randomized complete block design.
\nField data were collected using Field Book (Rife and Poland, 2014). Emergence was rated as a visual percent of plants emerged per plot one and two months after harvest. Emergence two months after harvest was used for analysis, unless snow or other factors prevented the collection of the rating two months after harvest, in which case emergence one month after harvest was used. Vigor was evaluated visually in the fall (one and two months after planting) and spring (once plants started actively growing after winter and at least two weeks prior to harvest) on a scale from ‘1’ to ‘9’, with ‘1’ representing the plot with lowest vigor in the trial, and ‘9’ representing the highest vigor in the trial. Spring stand was rated as a percent of the total plot with live plants after harsh winter conditions were over. Maturity was rated following a modified scale of Kalu and Fick (1981) at every harvest date.
\nBiomass from each plot was harvested one to two times in the spring of 2019, 2020, 2021, and 2022, dried at 55ºC, then weighed. If two harvests took place, six to nine feet of each fifteen-foot plot was cut for each harvest. Biomass harvests were labeled “early” if the cover crop harvest timing happened around the typical planting time of earlier cash crops of a region (e.g. corn (Zea mays L) in the Southeast, conventional corn in the Midwest) and “late” if the harvest timing corresponded to planting time of later cash crops in a region (e.g. cotton in the Southeast, organic corn in the Midwest).
", "title": "Data from: Genetic and Environmental Drivers of Legume Cover Crop Performance: Hairy vetch", "distribution": [ { "@type": "dcat:Distribution", "downloadURL": "https://ndownloader.figshare.com/files/44570417", "format": "csv", "mediaType": "text/plain", "title": "19-22HV_ALT_DATA_ALL_Corrected_RowRange.csv" }, { "@type": "dcat:Distribution", "downloadURL": "https://ndownloader.figshare.com/files/44570420", "format": "csv", "mediaType": "text/plain", "title": "19-22_ALT_Site_Details.csv" } ], "license": "https://www.usa.gov/publicdomain/label/1.0/", "bureauCode": [ "005:18" ], "modified": "2024-05-10", "publisher": { "@type": "org:Organization", "name": "Agricultural Research Service" }, "keyword": [ "vetch", "cover crops", "multi-environment trial" ], "spatial": "{\"type\": \"Polygon\", \"coordinates\": [[[-126.19583129883, 29.802517905764], [-126.19583129883, 49.860562674037], [-74.664459228516, 49.860562674037], [-74.664459228516, 29.802517905764], [-126.19583129883, 29.802517905764]]]}" }, { "identifier": "10.15482/USDA.ADC/25988122.v1", "accessLevel": "public", "contactPoint": { "hasEmail": "mailto:Louis.prom@usda.gov", "fn": "Prom, Louis K" }, "programCode": [ "005:040" ], "description": "A total of 30 isolates of Colletotrichum sublineola, causal agent of sorghum anthracnose were collected from Georgia, North Carolina, Puerto Rico, and Texas. Data for their virulence patterns on 18 sorghum differentials, RTx2536, SC748-5, Martin (BTx398), TAM428, BTx430, Brandes, SC112-14, Theis, BTx378, SC326-6, SC283, BTx623, SC328C, SC414-12E, PI570841, PI570726, PI569979, and IS18760 were collected from greenhouse trials in College Station, Texas by Louis K. Prom, Ezekiel J. S. Ahn, Ramasamy Perumal, Hugo E. Cuevas, William L. Rooney, Thomas S. Isakeit, and Clint W. Magill between 2014 and 2018. As described by Prom et al. 2012 and 2024, plants were assessed for anthracnose infection twice, 30 days post-inoculation and a week later using disease rating scale 1-5, where 1 = no symptoms or chlorotic flecks on leaves; 2 = hypersensitive reaction (reddening or red spots) on inoculated leaves but no acervuli formation; 3 = lesions on inoculated and bottom leaves with acervuli in the center; 4 = necrotic lesions with acervuli observed on inoculated and bottom leaves with infection spreading to middle leaves, and not yet on the flag leaves; and 5 = most leaves dead due to infection with infection on the flag leaf containing abundant acervuli. The symptom types were then categorized into two reaction classes, resistant = rating 1 or 2; and susceptible = rating 3, 4, or 5. As noted in the dataset, R = resistant response and S = susceptible response.
R scripts and associated data used to select the sweetpotato core sets described in:\nSlonecki, T. J., Rutter, W. B., Olukolu, B. A., Yencho, G. C., Jackson, D. M., & Wadl, P. A. (2023). Genetic diversity, population structure, and selection of breeder germplasm subsets from the USDA sweetpotato (Ipomoea batatas) collection. Frontiers in Plant Science, 13. https://doi.org/10.3389/fpls.2022.1022555
\nResources in this dataset:
\nTitle: Sweetpotato_phenotype_classification_scripts\nFile name: SP_phenotype_classification_scripts_7-29-21.R\nDescription: R Scripts used to format, classify, and retain individuals with 'rare' phenotypes into the core collections, generating the reduced 508 accession dataset from which the core sets were selected
\nTitle: Sweetpotato_core_set_selection_scripts\nFile name: Core_set_selection_permutations_8-24-20.R\nDescription: Core set sampling scripts derived from previous R scripts and data generated in \"SP_phenotype_classification_scripts\"
\nTitle: Original Phenotype data\nFile name: Core_Sets_VanRaden_Complete_Passport_Phenotype_July_2021.xlsx\nDescription: Phenotype data downloaded from GRIN sweetpotato collection and used for core set selection
\nTitle: SP_core_selection_Rdata\nFile name: SP_core_selection_data_7-30-21.zip\nDescription: Data sets used in conjunction with Rscripts from Slonecki et. al. 2022
", "title": "Data from: Genetic diversity, population structure, and selection of core germplasm sets from the USDA sweetpotato (Ipomoea batatas) collection", "distribution": [ { "@type": "dcat:Distribution", "downloadURL": "https://ndownloader.figshare.com/files/43373202", "format": "R", "mediaType": "text/plain", "title": "SP_phenotype_classification_scripts_7-29-21.R" }, { "@type": "dcat:Distribution", "downloadURL": "https://ndownloader.figshare.com/files/43373205", "format": "R", "mediaType": "text/plain", "title": "Core_set_selection_permutations_8-24-20.R" }, { "@type": "dcat:Distribution", "downloadURL": "https://ndownloader.figshare.com/files/43373208", "format": "xlsx", "mediaType": "application/vnd.openxmlformats-officedocument.spreadsheetml.sheet", "title": "Core_Sets_VanRaden_Complete_Passport_Phenotype_July_2021.xlsx" }, { "@type": "dcat:Distribution", "downloadURL": "https://ndownloader.figshare.com/files/43373211", "format": "zip", "mediaType": "application/zip", "title": "SP_core_selection_data_7-30-21.zip" } ], "license": "https://www.usa.gov/publicdomain/label/1.0/", "bureauCode": [ "005:18" ], "modified": "2023-11-30", "publisher": { "@type": "org:Organization", "name": "Agricultural Research Service" }, "accrualPeriodicity": "irregular", "keyword": [ "sweet potatoes", "genotype", "phenotype", "core germplasm set", "NP301", "NP303", "data.gov", "ARS" ], "spatial": "{\"type\": \"Point\", \"coordinates\": [-440.07165530697, 32.796163806572]}" }, { "identifier": "10.15482/USDA.ADC/1522387", "accessLevel": "public", "contactPoint": { "hasEmail": "mailto:Renee.Arias@usda.gov", "fn": "Arias, Renee S." }, "programCode": [ "005:040" ], "description": "This collection contains supplementary information for the manuscript “Genetic mapping and QTL analysis for peanut smut resistance”, which reports the genetic map and quantitative trait loci associated with resistance to peanut smut, a disease caused by the fungus Thecaphora frezii. The information includes genotyping data of a 103 recombinant inbred line (RIL) population {susceptible Arachis hypogaea subsp.hypogaea × resistant synthetic amphidiploid [(A. correntina × A. cardenasii) × A. batizocoi]⁴ˣ} and parental lines, generated with the Axiom_Arachis2 SNP array.
\nFor more information about this dataset contact: Renee Arias: Renee.Arias@usda.gov or Alicia Massa: Alicia.Massa@usda.gov
Resource Title: RILs of the mapping population.
File Name: RIL_population.JPG
Resource Title: Data Dictionary.
File Name: readme.txt
Resource Title: Supplementary Data 1: SNP genotypes as called by the Axiom Analysis Suite File name: SD01_RILs_SNPs_whole_Axiom_Arachis2.txt .
File Name: SD01_RILs_SNPs_whole_Axiom_Arachis2.txt.zip
Resource Description: Supplementary Data 1: SNP genotypes as called by the Axiom Analysis Suite\nFile name: SD01_RILs_SNPs_whole_Axiom_Arachis2.txt\nSingle nucleotide polymorphism genotyping of a 103 RIL population and parental lines generated with the Arachis_Axiom2 SNP array.\n
Resource Software Recommended: Axiom_Arachis2,url: https://www.thermofisher.com/us/en/home/life-science/microarray-analysis/microarray-analysis-instruments-software-services/microarray-analysis-software/axiom-analysis-suite.html
Resource Title: Supplementary Data 2: Genotyping calls in VCF format File name: SD02_RILs_SNPs_whole_Axiom_Arachis2.vcf.
File Name: SD02_core_RILs_SNPs_AxiomArachis2.vcf.zip
Resource Description: Supplementary Data 2: Genotyping calls in VCF format\nFile name: SD02_RILs_SNPs_whole_Axiom_Arachis2.vcf\nCore SNP set used to characterize the RIL population and progenitors.
This data is from the manuscript titled: \"Genetic variation among 481 diverse soybean accessions, inferred from genomic re-sequencing\". SNP calls were obtained from resequencing 481 diverse soybean lines comprising 52 wild (Glycine soja) and 429 cultivated (Glycine max). This dataset contains 6 gzipped VCF (Variant Call Format) files with variant calls for all 481 USB accessions, all G. max accessions, G. soja accessions, accessions sequenced at 15x coverage, accessions sequenced at 40x coverage, and 106 accessions re-sequenced from a previous study (Valliyodan et al. 2016). SNPs were called using the Haplotype caller algorithm from the Genome Analysis Toolkit (GATK) version gatk-2.5-2-gf57256b. A total of 7.8 million SNPs were identified between the 481 re-sequenced accessions. SNPs were assigned IDs using the script \"assign_name.awk\" available at https://github.com/soybase/SoySNP-Names. SNP effects were predicted using SnpEff 3.0.
Dataset also available at https://soybase.org/data/v2/Glycine/max/diversity/Wm82.gnm2.div.Valliyodan_Brown_2021/
Funding support provided by the United Soybean Board for the large-scale sequencing of soybean genomes (project #1320-532-5615), Bayer (previously Monsanto and Bayer), and Corteva (previously Dow AgroSciences), with in-kind support for analysis from USDA Agricultural Research Service project 5030-21000-069-00-D.
Resources in this dataset:
Salmonella enterica subsp. enterica bacteria are important foodborne pathogens with major economic impact. Some isolates exhibit increased heat tolerance, a concern for food safety. Analysis of a finished-quality genome sequence of an isolate commonly used in heat resistance studies, S. enterica subsp. enterica serovar Senftenberg 775W (ATCC 43845), demonstrated an interesting observation that this strain contains not just one, but two horizontally acquired thermotolerance locus homologs. These two loci reside on a large 341.3-kbp plasmid that is similar to the well-studied IncHI2 R478 plasmid but lacks any antibiotic resistance genes found on R478 or other IncHI2 plasmids. As this historical Salmonella isolate has been in use since 1941, comparative analysis of the plasmid and of the thermotolerance loci contained on the plasmid will provide insight into the evolution of heat resistance loci as well as acquisition of resistance determinants in IncHI2 plasmids.
Resource Title: Supplementary Material.
File Name: \"inline-supplementary-material-1.pdf\", url: https://msystems.asm.org/content/msys/2/1/e00190-16/DC1/embed/inline-supplementary-material-1.pdf
The map of plasmid pSSE ATCC-43845 is shown, with the thermotolerance locus islands indicated as orange regions. Base modification signals generated by BaseModFunctions.v.2.1.R and Circos are overlaid on the plasmid map. Qmod values are height proportional to the interpulse distance ratio for each of the modified bases on the positive strand (red outmost track) and negative strand (red innermost track). Green hash marks correspond to the CAGAG motifs present on the plasmid.
\nThe map of plasmid pSSE ATCC-43845 is shown, with the thermotolerance locus islands indicated as orange regions. Base modification signals generated by BaseModFunctions v2.1.R and Circos are overlaid on the plasmid map. Qmod values are height proportional to the interpulse distance ratio for each of the modified bases on the positive strand (red outmost track) and negative strand (red innermost track). Blue hash marks correspond to the GATC motifs present on the plasmid.
Protein predictions using Augustus web for the fungi Neonectria coccinea and N. faginata, as well as protein prediction of closely related species N. ditissima, and Corinectria fuckeliana.
Resource Title: Protein prediction dataset for Neonectria faginata isolate A.R. 4307.
File Name: AR4307_augustusRev.fasta
Resource Description: Protein prediction dataset
Resource Title: Protein prediction data set for Neonectria ditissima isolate CBS 226.31.
File Name: CBS22631_augustus.fasta
Resource Description: Protein prediction data set
Resource Title: Protein prediction file for Neonectria coccinea isolate CBS 119158.
File Name: CBS119158_augustus.fasta
Resource Description: Protein prediction file
Resource Title: Protein prediction file of Corinectria fuckeliana isolate CBS 125109.
File Name: CBS125109_augustus.fasta
Resource Description: Protein prediction file
The small hive beetle (Aethina tumida, ATUMI) is an invasive parasite of bee colonies. ATUMI feeds on both fruits and bee nest products, facilitating its spread and increasing its impact on honey bees and other pollinators. The ATUMI genome has been sequenced and annotated, providing the first genomic resources for this species and for the Nitidulidae, a beetle family that is closely related to the extraordinarily species-rich clade of beetles known as the Phytophaga. ATUMI thus provides a contrasting view as a neighbor for one of the most successful known animal groups. A robust genome assembly and a gene set possessing 97.5% of the core proteins known from the holometabolous insects are presented. The ATUMI genome encodes fewer enzymes for plant digestion than the genomes of wood-feeding beetles, but nonetheless shows signs of broad metabolic plasticity. Gustatory receptors are few in number compared to other beetles, especially receptors with known sensitivity (in other beetles) to bitter substances. In contrast, several gene families implicated in detoxification of insecticides and adaptation to diverse dietary resources show increased copy numbers. The presence and diversity of homologs involved in detoxification differs substantially from the bee hosts of ATUMI. Results provide new insights into the genomic basis for local adaption and invasiveness in ATUMI, and a blueprint for control strategies that target this pest without harming their honey bee hosts. A minimal set of gustatory receptors is consistent with the observation that, once a host colony is invaded, food resources are predictable. Unique detoxification pathways and pathway members can help identify which treatments might control this species even in the presence of honey bees, which are notoriously sensitive to pesticides.
Resource Title: Supporting data for the \"Genome of the small hive beetle (Aethina tumida, Coleoptera: Nitidulidae), a worldwide parasite of social bee colonies, provides insights into detoxification and herbivory\".
File Name: Web Page, url: http://gigadb.org/dataset/100511
The small hive beetle (Aethina tumida, ATUMI) is an invasive parasite of bee colonies. ATUMI feeds on both fruits and bee nest products, facilitating its spread and increasing its impact on honey bees and other pollinators. We have sequenced and annotated the ATUMI genome, providing the first genomic resources for this species and for the Nitidulidae, a beetle family that is closely related to the extraordinarily species-rich clade of beetles known as the Phytophaga. ATUMI thus provides a contrasting view as a neighbor for one of the most successful known animal groups. We present a robust genome assembly and a gene set possessing 97.5% of the core proteins known from the holometabolous insects. The ATUMI genome encodes fewer enzymes for plant digestion than the genomes of wood-feeding beetles, but nonetheless shows signs of broad metabolic plasticity. Gustatory receptors are few in number compared to other beetles, especially receptors with known sensitivity (in other beetles) to bitter substances. In contrast, several gene families implicated in detoxification of insecticides and adaptation to diverse dietary resources show increased copy numbers. The presence and diversity of homologs involved in detoxification differs substantially from the bee hosts of ATUMI. Our results provide new insights into the genomic basis for local adaption and invasiveness in ATUMI, and a blueprint for control strategies that target this pest without harming their honey bee hosts. A minimal set of gustatory receptors is consistent with the observation that, once a host colony is invaded, food resources are predictable. Unique detoxification pathways and pathway members can help identify which treatments might control this species even in the presence of honey bees, which are notoriously sensitive to pesticides.
Ascomycete fungi in the genus Clarireedia are responsible for dollar spot, one of the most destructive and costly diseases affecting turfgrasses worldwide. Almost all grasses grown as turf are susceptible to dollar spot, including many high value grass species commonly used for golf courses. This Ag Data Commons dataset provides the genome sequences for seven isolates of Clarireedia fungi that cause dollar spot disease, including sequences of the two most widespread species, C. jacksonii and C. monteithiana. These data are freely available for research purposes.
Resource Title: Clarireedia monteithiana DRR9 EST sequences.
File Name: DRR9_ESTcontigs.fa.txt
Resource Description: Clarireedia monteithiana DRR9 EST sequences
Resource Title: Clarireedia jacksonii MB01 ESTs.
File Name: MB01_ESTcontigs.fa.txt
Resource Description: Clarireedia jacksonii MB01 ESTs
Resource Title: Clarireedia jacksonii MB01 EST sequences, from Orshinky et al. .
File Name: NCBI_Orshinsky_Sclerotinia_homoeocarpaESTsequences.fasta.zip
Resource Description: Clarireedia jacksonii MB01 EST sequences, from: Orshinsky AM, Hu J, Opiyo SO, Reddyvari-Channarayappa V, Mitchell TK, Boehm MJ (2012) RNA-Seq Analysis of the Sclerotinia homoeocarpa – Creeping Bentgrass Pathosystem. PLoS ONE 7(8): e41150. https://doi.org/10.1371/journal.pone.0041150
Resource Title: Genome assembly, Clarireedia sp. CPB17.
File Name: CPB17final.fasta.txt
Resource Title: Genome assembly, Clarireedia monteithiana DRR9.
File Name: DRR9final.fasta.txt
Resource Title: Genome assembly, Clarireedia jacksonii LWC10.
File Name: LWC10final.fasta.txt
Resource Title: Genome assembly, Clarireedia jacksonii MB01.
File Name: MB01final.fasta.txt
Resource Title: Genome assembly, Clarireedia monteithiana RB19.
File Name: RB19final.fasta.txt
Resource Title: Genome assembly, Clarireedia sp. SE16F4.
File Name: SE16F4final.fasta.txt
Resource Title: Genome assembly, Clarireedia jacksonii SH44.
File Name: SH44final.fasta.txt
Resource Title: Predicted proteins, Clarireedia sp. CPB17.
File Name: CPB17.fa.txt
Resource Title: Predicted proteins, Clarireedia monteithiana DRR9.
File Name: DRR9.fa.txt
Resource Title: Predicted proteins, Clarireedia jacksonii LWC10.
File Name: LWC10.fa.txt
Resource Title: Predicted proteins, Clarireedia jacksonii MB01.
File Name: MB01.fa.txt
Resource Title: Predicted proteins Clarireedia sp. SE16F4.
File Name: SE16F4.fa.txt
Resource Title: Predicted proteins, Clarireedia jacksonii SH44.
File Name: SH44.fa.txt
Resource Title: Predicted proteins, Clarireedia jacksonii HRS10.
File Name: HRS10.fa_.txt
The ascomycete fungus Cryphonectria parasitica is the causal agent of chestnut blight disease. This deadly fungal pathogen was introduced into North America from Asia before the turn of the 20th century, quickly spreading throughout the natural range of the American chestnut tree. In the course of a single generation, chestnut blight destroyed billions of American chestnut trees in forests across North America, driving it almost to extinction. The genome assembly for C. parasitica EP155 (v. 2.0, available at https://mycocosm.jgi.doe.gov/Crypa2/Crypa2.info.html) contains 26 main genome scaffolds totaling 43.9 Mb, and was sequenced at the U.S. Department of Energy Joint Genome Institute. The information and documents contained within this Ag Data Commons dataset provide supplementary data about the EP155 genome assembly, including scaffold summaries, genetic maps, mitochondrial DNA, P450s, secondary metabolite clusters, vegetative incompatibility genes, and transposable elements. These data are freely available for research purposes.
Resource Title: Secondary metabolite summary.
File Name: EP155 secondary metabolits.xlsx
Resource Description: Predicted secondary metabolites in the genome assembly of Cryphonectria parasitica EP155.
Resource Title: Cryphonectria parasitica EP155 Genetic Maps.
File Name: Genome Fig. 1_120611.pptx
Resource Description: Alignment of Cryphonectria parasitica EP155 V2.0 genome scaffolds 1 and 2 with the genetic linkage map for cross MJ1 (JA17 × X17-8) (Kubisiak and Milgroom 2005).
Resource Title: Phylogenetic tree of the cytochrome P450 proteins (P450ome) in Cryphonectria parasitica EP155. .
File Name: Figure_P450_EP155.pptx
Resource Title: Family/subfamily-level classification of the cytochrome P450 monooxygenases (P450ome) of Cryphonectria parasitica EP155..
File Name: Crypa2-Supplementary Tables.xlsx
Resource Title: Summary of scaffold sizes in the Cryphonectria parasitica EP155 v.2.0 genome assembly..
File Name: scaffolds.xlsx
Resource Title: Cryphonectria parasitica EP155 unmasked nuclear genome assembly.
File Name: Cryphonectriaparasiticav2.nuclearAssembly.unmasked.txt
Resource Title: Cryphonectria parasitica EP155 gene catalog.
File Name: Cparasiticav2.GeneCatalog20091217.proteins.txt
Resource Title: Cryphonectria parasitica EP155 mitochondial genome assembly.
File Name: EP155mitochondria.fasta.txt
Annotation data of genome assemblies of Streptomyces spp. isolated from agricultural soil.
Resource Title: Annotation data for MCL20-2.
File Name: MCL20-2_prokka.zip
Resource Title: Annotation data for SCL15-4.
File Name: SCL15-4_prokka.zip
Resource Title: Annotation data for SCL15-6.
File Name: SCL15-6_prokka.zip
Resource Title: Annotation data for SJL17-1.
File Name: SJL17-1_prokka.zip
Resource Title: Annotation data for SJL17-4.
File Name: SJL17-4_prokka.zip
Porcine reproductive and respiratory syndrome virus (PRRSV) causes respiratory disease in piglets and reproductive disease in sows. Piglet and fetal serum thyroid hormone (i.e., T3 and T4) levels decrease rapidly in response to PRRSV infection. However, the genetic control of T3 and T4 during infection is not completely understood. Our objective was to estimate genetic parameters and identify quantitative trait loci (QTL) for absolute T3 and/or T4 levels of piglets and fetuses challenged with PRRSV. Sera from 5-week-old pigs (N=1792) at 11 days post inoculation (DPI) with PRRSV were assayed for T3 levels (piglet_T3). Sera from fetuses (N=1267) at 12 or 21 days post maternal inoculation (DPMI) with PRRSV of sows (N=145) in late gestation were assayed for T3 (fetal_T3) and T4 (fetal_T4) levels. Animals were genotyped using 60K Illumina or 650K Affymetrix SNP panels. Heritabilities, phenotypic correlations, and genetic correlations were estimated using ASREML; genome wide association studies were performed for each trait separately using JWAS. All three traits were low to moderately heritable (10 to 16%). Phenotypic and genetic correlations of piglet_T3 levels with weight gain (0-42 DPI) were 0.26±0.03 and 0.67±0.14, respectively. Nine significant QTL were identified for piglet_T3, on Sus scrofa chromosomes (SSC) 3, 4, 5, 6, 7, 14, 15, and 17, and collectively explaining 30% of the genetic variation (GV), with the largest QTL identified on SSC5, explaining 15% of the GV. Three significant QTL were identified for fetal_T3 on SSC1 and SSC4, which collectively explained 10% of the GV. Five significant QTL were identified for fetal_T4 on SSC1, 6, 10, 13, and 15, which collectively explained 14% of the GV. Several putative immune-related candidate genes were identified, including CD247, IRF8, and MAPK8. Thyroid hormone levels following PRRSV infection were heritable and had positive genetic correlations with growth rate. Multiple QTL with moderate effects were identified for T3 and T4 levels during challenge with PRRSV and candidate genes were identified, including several immune-related genes. These results advance our understanding of growth effects of both piglet and fetal response to PRRSV infection, revealing factors associated with genomic control of host resilience.
\nFunded/supported by: US National Pork Board (NPB) (#07-233, #09-208, #10-033, #09-244, and #10-033); swine breeding companies Genus PIC plc, Newsham/Choice Genetics, FAST Genetics, Genetiporc, Genesus, Topigs Norsvin and PigGen Canada, Inc.; PRRS Coordinated Agricultural Project (PRRS-CAP); USDA-NIFA Award #2008-55620-19132; Genome Canada project #2209_F; USDA-NIFA Translational Genomics ( # 2013-68004-20362), USDA sponsored National Research Support Project 8 (NRSP-8) Swine Genome and Bioinformatics research programs; Kansas State University and USDA ARS (1245-32000-098 and 8042-32000-117); USDA ARS (# 8042–32000-102); SCINet project of the USDA ARS (0500-00093-001-00-D); USDA ARS Headquarters Postdoctoral Fellowship; Genome Canada (2014LSARP_8202); Genome Prairie (Project 346143); Genome Alberta.
Resource Title: Genome-wide association study results of piglet and fetal thyroid hormone levels after challenge with porcine reproductive and respiratory syndrome virus challenge.
File Name: QTL-Data_Van_Goor.xlsx
Resource Description: Summary of GWAS results for piglet_T3, fetal_T3, and fetal_T4 with SNP information for each 1-Mb window with more than 1% of the GV. aTriiodothyronine (T3) levels were measured in piglet serum at 11 DPI (piglet_T3), in fetal serum at 12 or 21 DPMI (fetal_T3); thyroxine (T4) levels were measured in fetal serum at 12 or 21 DPMI (fetal_T4)\nbChromosome (Chr) where a significant window was identified based on Sus scrofa 11.1 (Sscrofa11.1) build\ncPosition (Pos) in megabases (Mb) on given chromosome where significant window was identified based on Sscrofa11.1 build\ndSNP name based on Illumina Porcine SNP60 Beadchip version 2 nomenclature\neSNP location based on SSC Sscrofa11.1 build\nfPosterior Probability of Inclusion (PPI): frequency with which the SNP was included in the MCMC iterations (post-burn-in)\ngMinor allele frequency (MAF) of the SNP within the genotyped populations (N = 1792 animals for piglet_T3, N = 1187 animals for both fetal traits)\nhNumber of annotated candidate genes within 400 Kb (200 Kb upstream and 200 Kb downstream) of SNP based on Ensembl Biomart release 107 with the Pig – Duroc (Sscrofa11.1) option accessed on August 30, 2022\n
Resource Software Recommended: Excel,url: https://www.microsoft.com/en-us/microsoft-365/excel
Resource Title: Individual SNPs and window information from JWAS analysis QTL Data .
File Name: Individual-SNPs_QTL-Data_Van_Goor.xlsx
Resource Description: aTrait triiodothyronine (T3) levels were measured in piglet serum at 11 DPI (piglet_T3), in fetal serum at 12 or 21 DPMI (fetal_T3); thyroxine (T4) levels were measured in fetal serum at 12 or 21 DPMI (fetal_T4)\nbwindow consecutive window number for a given trait. The genome was split into 1 Mb non-overlapping windows\ncchr chromosome where a significant window was identified based on Sus scrofa 11.1 (Sscrofa11.1) build\ndwStart window start position in base pairs on given chromosome where the window was identified based on Sscrofa11.1 build\newEnd window end position in base pairs on given chromosome where the window was identified based on Sscrofa11.1 build\nfstart_SNP position of the first SNP in base pairs on given chromosome where the window was identified based on Sscrofa11.1 build\ngend_SNP position of the last SNP in base pairs on given chromosome where the window was identified based on Sscrofa11.1 build\nhnumSNP is the number of SNPs located within the 1 Mb window\niestimateGenVar is the estimated genetic variation of the 1 Mb window for the given trait\njstdGenVar is the estimated standard deviation of genetic variation of the 1 Mb window for the given trait\nkprGenVar is the estimated percentage of the genetic variation of the 1 Mb window for the given trait\nlPPA_t is the Posterior Probability of Acceptance: frequency with which the window was included in the MCMC iterations (post-burn-in)\n
Resource Software Recommended: Excel,url: https://www.microsoft.com/en-us/microsoft-365/excel
A panel of single nucleotide polymorphisms (SNPs) for 363 common bean accessions was generated. A genome-wide association study (GWAS) was applied to detect SNPs significantly associated with resistance to Heterodera glycines (HG) also known as the soybean cyst nematode (SCN) in the core collection of common bean, Phaseolus vulgaris. There were 84,416 SNPs identified in 363 common bean accessions.
Resource Title: SNP Location on Chromosomes.
File Name: SNP locations chr and position.csv
Resource Title: Bean lines and genotypes.
File Name: Bean lines and genotype.csv
Phenotypic Data\nA subset of 264 lines from the National Small Grains Collection global hexaploid winter wheat germplasm collection was evaluated under controlled growth chamber conditions for reaction to the pathogens Parastagonospora nodorum and Pyrenophora tritici-repentis.\nBoth infiltrations and inoculations were performed on plants planted in plastic cones and when seedlings were at the second leaf stage. Plants were infiltrated with the P. nodorum necrotrophic effectors (NEs) SnTox1, SnToxA, SnTox3, SnTox267, and SnTox5; and the P. tritici-repentis NE Ptr ToxB. The scoring system was 0-3, with reaction types of 2 and 3 considered sensitive and 0 to 1 were insensitive.\nPlants were inoculated with the P. nodorum isolates Sn4, Sn2000, AR2-1, SnIr05H71a, and NOR4 and P. tritici-repentis isolates Pti2, 86-124, DW5, and AR CrossB10. After inoculation, plants were placed in a 100 % humidity growth chamber at 21 °C for 24 hours under constant light, then moved to a controlled growth chamber at 21 °C with a 12 h photoperiod. Plants were scored at 7 days post inoculation. For P. nodorum, plants were scored using a 0 to 5 scale, with 0 being highly resistant and 5 being highly susceptible. For P. tritici-repentis, plants were scored using a 1 to 5 scale, with 1 being highly resistance and 5 being highly susceptible.\nThree homogeneous replicates (determined by Bartlett’s chi squared analysis) were used to calculate an average value for each trait. This value was used for the rest of the analysis.
\nGenotypic Data\nDNA of the winter wheat panel was extracted and genotyped using the Illumina iSelect 90k wheat SNP array. Clustering data was analyzed using GenomeStudio 2.0.5 from Illumina, Inc. SNPs were ordered based on their physical position in the Chinese Spring IWGSC RefSeq v2.0. In TASSEL v5.2, SNP markers were filtered with a minor allele frequency greater than 0.01 and missing data less than 50%. For the remaining markers, missing values were imputed using the LD-KNNi method.
\nGenome-wide association analysis data\nAssociation mapping was conducted using the R package GAPIT v.3. The filtered hapmap file was used for the association mapping, along with the average value for each phenotypic trait. The models GLM, MLM, MLMM, FarmCPU, and Blink were run on the averages for each trait.\n**\nResources in this dataset:
\nResource Title: Phenotypic data collected from 264 lines in the NSGC global hexaploid winter wheat collection\nResource Description: The phenotypic file consists of the lines in this panel, their accession numbers, their ACIMPT designation (improvement status), country and continent of origin, and the scores for each phenotypic trait evaluated, in both replicate from and average of all the replicates. SnToxA, Ptr ToxB, SnTox1, SnTox267, SnTox3, and SnTox5 are all purified necrotrophic effectors and were scored on a 0-3 scale. Sn4, Sn2000, AR2-1, SnIr05H71a, and NOR4 are Parastagonospora nodorum isolates and were scored on a 0-5 scale. Pti2, 86-124, DW5, and AR CrossB10 are Pyrenophora tritici-repentis isolates and were scored on a 1-5 scale. An entry of ‘NA’ indicated missing data.
\nResource Title: Necrotrophic effector Ptr ToxB GWAS data output from the winter wheat global panel\nResource Title: Necrotrophic effector SnTox1 GWAS data output from the winter wheat global panel\nResource Title: Necrotrophic effector SnTox3 GWAS data output from the winter wheat global panel\nResource Title: Necrotrophic effector SnTox5 GWAS data output from the winter wheat global panel\nResource Title: Necrotrophic effector SnTox267 GWAS data output from the winter wheat global panel\nResource Title: Necrotrophic effector SnToxA GWAS data output from the winter wheat global panel\nResource Title: P. nodorum isolate AR2-1 GWAS data output from the winter wheat global panel\nResource Title: P. nodorum isolate NOR4 GWAS data output from the winter wheat global panel\nResource Title: P. nodorum isolate Sn4 GWAS data output from the winter wheat global panel\nResource Title: P. nodorum isolate Sn2000 GWAS data output from the winter wheat global panel\nResource Title: P. nodorum isolate SnIr05H71a GWAS data output from the winter wheat global panel\nResource Title: P. tritici-repentis isolate 86-124 GWAS data output from the winter wheat global panel\nResource Title: P. tritici-repentis isolate AR CrossB10 GWAS data output from the winter wheat global panel\nResource Title: P. tritici-repentis isolate DW5 GWAS data output from the winter wheat global panel\nResource Title: P. tritici-repentis isolate Pti2 GWAS data output from the winter wheat global panel
\nResource Description for GWAS data output files: The GWAS output file consists of the SNP (SNP), chromosome assignment (Chromosome), position on that chromosome (Position), p-value (P.value), minor allele frequency (maf), number of observations (nobs), FDR adjusted p-values (FDR_Adjusted_P-values), and marker effect. Markers are sorted in order of significance, with the most significant first. Sheet 1 consists of the GLM output, sheet 2 MLM, sheet 3 MLMM, sheet 4 FarmCPU, and sheet 5 Blink.
\nResource Title: Winter wheat panel_264 lines_90k_refv2\nResource Description: The genotypic hapmap data file consists of the raw SNP data after cluster analysis and includes 79,103 SNPs. The file consists of the rs# (SNP name), alleles, chrom (1 to 21 with 1 being chromosome 1A, 2 1B, 3 1D, so forth until 21 is 7D), pos (chromosome position based on Chinese Spring IWGSC RefSeq v2.0), strand (+ or NA for negative), assembly, center, protLSID, assayLSID, panelLSID, QCcode, and the 264 lines used in this panel with their SNP allele calls. ‘NA’ means no SNP call was detected.
\nResource Title: winterwheatpanel_264 lines_genotype90k_refv2_filtered_KNNimp.hmp\nResource Description: The filtered genotypic hapmap data file consists of the SNP data after cluster analysis, filtering for a minor allele frequency greater than 0.01 and missing data less than 50%, and imputation using the LD-KNNi method. The filtered data consists of and includes 42,022 SNPs. The file consists of the rs# (SNP name), alleles, chrom (1 to 21 with 1 being chromosome 1A, 2 1B, 3 1D, so forth until 21 is 7D), pos (chromosome position based on Chinese Spring IWGSC RefSeq v2.0), strand (+ or NA for negative), assembly, center, protLSID, assayLSID, panelLSID, QCcode, and the 264 lines used in this panel with their SNP allele calls. ‘NA’ means no SNP call was detected.
\nCampylobacter jejuni subsp. jejuni infections are a leading cause of foodborne gastroenteritis and the most prevalent antecedent to Guillain-Barré syndrome (GBS). Penner serotype HS:19 is among several capsular types shown to be markers for GBS. This study describes the genome of C. jejuni subsp. jejuni HS:19 Penner reference strain RM3420.
Resource Title: GenBank Accession No. CP017456 - Campylobacter jejuni subsp. jejuni str. RM3420, complete genome.
File Name: Web Page, url: https://www.ncbi.nlm.nih.gov/nuccore/CP017456
This is a Microsoft Excel spreadsheet containing raw absorbance data collected from PM01 and PM02A plates in an Omnilog system for Lactiplantibacillus pentosus LA0445 and MU045. Independent duplicates were run for each bacterial culture.
\nResources in this dataset:
\nThe following is taken directly from the introduction of the paper. In this study, we used a pure drift FST model [11] which assumes all animals originated from the same ancestral population. This model was applied to taurine and zebu animals to identify loci under selection. These two groups correspond to the main (and most ancestral) separation of domestic cattle, which in most but not all cases corresponds to animals adapted to tropical and temperate environments. The identification of such loci can aid in the identification of genes and genomic variants that are related to environmental adaptation and/or selection derived from human agro-pastoral activities.
Resource Title: Copies of B allele for BovineHD 770k SNP array for multiple cattle breeds spanning broad diversity.
File Name: g.csv.gz
Resource Description: Table contains 777,962 rows, one for each SNP and 528 columns, 1 for each animal. A few animals are duplicated. Most animals have breed identified by a 3 letter code but a few do not. Breed abbreviations follow.\nANG – Angus\nBMA – Beefmaster\nBRM – Brahman\nBSW – Brown Swiss\nCHL – Charolais\nGIR – Gir\nGNS – Guernsey\nHFD – Hereford\nHOL – Holstein\nJER – Jersey\nLMS – Limousin\nNEL – Nelore\nNRC – Norwegian Red Cow\nPMT – Piedmontese\nRGU – Red Angus\nRMG – Romagnola\nSGT – Santa Gertrudis\nSHK – Sheko\n
Ramularia crupinae is a foliar and stem blighting fungal pathogen specific to the invasive rangeland weed common crupina (Crupina vulgaris). This fungal plant pathogen was recently approved by the Animal and Plant Health Inspection Service (APHIS) as the first biological control agent for the management of common crupina in the western United States. The genome assembly for R. crupinae 00-010 (https://mycocosm.jgi.doe.gov/Ramcr1/Ramcr1.info.html) contains 18 contigs totaling 37.9 Mb, and was annotated using the JGI fungal annotation pipeline. The information contained within this Ag Data Commons dataset provides an updated R. crupinae chromosome-level genome assembly. These data are freely available for research purposes.
\nResources in this dataset:
\nGenotypes of significant SNPs in all breed and individual breed analysis with detected Mycoplasma ovipneumoniae DNA copy number and log10 M. ovipneumoniae DNA copy number. SNP is denoted in the column headers with its rs number and the first 7 SNP are from the all breed analysis, the following 9 SNP from the Rambouillet analysis, the following 3 from the Polypay analysis, and the final 9 from the Suffolk analysis.
Resource Title: Data from: Genomic regions associated with Mycoplasma ovipneumoniae presence in nasal secretions of domestic sheep.
File Name: PLoS ONE Data.xlsx
Water buffalo (Bubalus bubalis L.) is an important livestock species worldwide. Like many other livestock species, water buffalo lacks high quality and continuous reference genome assembly, required for fine-scale comparative genomics studies. In this work, we present a dataset, which characterizes genomic differences between water buffalo genome and the extensively studied cattle (Bos taurus Taurus) reference genome. This data set is obtained after alignment of 14 river buffalo whole genome sequencing datasets to the cattle reference. This data set consisted of 13, 444 deletion CNV regions, and 11,050 merged mobile element insertion (MEI) events within the upstream regions of annotated cattle genes. Gene expression data from cattle and buffalo were also presented for genes impacted by these regions.
\nThis study sought to characterize differences in gene content, regulation and structure between taurine cattle and river buffalo (2n=50) (one extant type of water buffalo) using the extensively annotated UMD3.1 cattle reference genome as a basis for comparisons. Using 14 WGS datasets from river buffalo, we identified 13,444 deletion CNV regions (Supplemental Table 1) in river buffalo, but not identified in cattle. We also presented 11,050 merged mobile element insertion (MEI) events (Supplemental Table 2) in river buffalo, out of which, 568 of them are within the upstream regions of annotated cattle genes. Furthermore, our tissue transcriptomics analysis provided expression profiles of genes impacted by MEI (Supplemental Tables 3–6) and CNV (Supplemental Table 7) events identified in this study. This data provides the genomic coordinates of identified CNV-deletions and MEI events. Additionally, normalized read count of impacted genes, along with their adjusted p-values of statistical analysis were presented (Supplemental Tables 3–6).
\nPublic assessment of this dataset will allow for further analyses and functional annotation of genes that are potentially associated with phenotypic difference between cattle and water buffalo. Raw read data of whole genome and transcriptome sequencing were deposited to NCBI Bioprojects.
Resource Title: Genomic structural differences between cattle and River Buffalo identified through comparative genomic and transcriptomic analysis.
File Name: Web Page, url: https://www.sciencedirect.com/science/article/pii/S2352340918305183
Data in Brief presenting a dataset which characterizes genomic differences between water buffalo genome and the extensively studied cattle (Bos taurus Taurus) reference genome. This data set is obtained after alignment of 14 river buffalo whole genome sequencing datasets to the cattle reference. This data set consisted of 13, 444 deletion CNV regions, and 11,050 merged mobile element insertion (MEI) events within the upstream regions of annotated cattle genes. Gene expression data from cattle and buffalo were also presented for genes impacted by these regions.
\nTables are with this article. Raw read data of whole genome and transcriptome sequencing were deposited to NCBI Bioprojects as the following:\nPRJNA350833 (https://www.ncbi.nlm.nih.gov/bioproject/?term=350833)\nPRJNA277147 (https://www.ncbi.nlm.nih.gov/bioproject/?term=277147)\nPRJEB4351 (https://www.ncbi.nlm.nih.gov/bioproject/?term=PRJEB4351)
These data represent V. destructor genomic annotations to be used for evolutionary comparison with other arthropods.
\nThe ectoparasitic mite Varroa destructor has emerged as the primary pest of domestic honey bees (Apis mellifera). \nHere we present an initial survey of the V. destructor genome carried out to advance our understanding of Varroa biology and to identify new avenues for mite control. This sequence survey provides immediate resources for molecular and population-genetic analyses of Varroa-Apis interactions and defines the challenges ahead for a comprehensive Varroa genome project.
\nResource Title: Data Dictionary - BLAST - annotated Varroa contigs.
File Name: Data Dictionary genomic survey ectoparasitic mite varroa.csv
Resource Title: BLAST-annotated Varroa contigs.
File Name: 1471-2164-11-602-s3.csv
Resource Description: Spreadsheet of Varroa destructor genomic contigs with significant similarity to the GenBank nr database by BLAST search. This is Additional File 3 from Cornman, et al. 2010.\n\nWe used BLASTX (for genomic contigs) and BLASTP (for ORFs of 90 residues or more) to identify genic sequences in the assembly. Sequences were initially searched against a database of five arthropod peptide predictions (Drosophila melanogaster, Anopheles gambiae, Pediculus humanus [a representative non-Dipteran insect], Daphnia pulex, and I. scapularis), with a minimum expectation of 10-8, and then secondarily against the eukaryotic Refseq database at the same expectation. In total, 13,031 contigs were identified with BLAST-detected similarity to database sequences.
This collection contains supplementary data for the manuscript \"Genotypic characterization of the U.S. Peanut Core Collection\", which describes genotyping results for the USDA peanut core collection. Each accession was genotyped with the Arachis_Axiom2 SNP array, yielding 14,430 high-quality, informative SNPs across the collection. Additionally, a subset of the core collection was replicated genotyped in replicate, using between two and five seeds per accession to assess heterogeneity within an accession. Supplementary files include: descriptive information about the genotyped accessions, SNP genotype calls in several formats, a phylogenetic tree calculated from the genotype data, Structure analysis, PCA analysis, and comparisons with the diploid progenitors.
\nThis research was co-funded by the National Institute of Food and Agriculture and the National Peanut Board.
Resource Title: Structure membership breakdown.
File Name: SF10_K5_membership.pdf
Resource Description: The proportion of accessions assigned to clusters 1-5 in a Structure analysis (manuscript Figure 3), for K=5 clusters.\n
Resource Title: Structure membership assignments for accessions.
File Name: SF11_K5_cluster_assignment.xlsx
Resource Description: The proportional assignments of each cluster to all accessions (relative to the Structure diagram shown in manuscript Figure 3).\n
Resource Title: Principal components analysis.
File Name: SF12_pca_34.pdf
Resource Description: Principal Component Analysis of 1120 samples based on 2063 unlinked SNP markers. The X-axis represents PC 3 and the Y-axis represents PC 4. Samples are colored and grouped according to: A. clade membership as defined in the phylogenetic and network analyses, B. botanical varieties, C. market type, D. growth Habit, E. pod shape, and F. collection type\n
Resource Title: Pod images for PI 497426.
File Name: SF14_PI497426_pods.jpg
Resource Description: Pods from accession PI 497426 (clade 4), illustrating the distinctive reticulation pattern seen in some accessions in this clade.\n
Resource Title: Data dictionary.
File Name: data_dictionary_KNWV.txt
Resource Description: Description of all files in this Dataset. Changes were made to this file on 4/15/202, to update some file names to indicate new versions.
Resource Title: Main descriptive information about genotyped accessions.
File Name: SF01_peanut_core_v14.xlsx
Resource Description: The main descriptive information about the genotyped accessions, including: information about replicate similarity; phylogenetic clades, geographic origin, and phenotype; and summaries of phenotypic and country information relative to clade assignments. Changes were made to this file on 4/15/2020: Added INDEX worksheet and corrected three peanut variety identifiers: ROL11 --> TamrunOL-11; NCL06 --> TamnutOL-06; NM309N2 --> NM309-2
Resource Title: SNPs as called by the Axiom suite .
File Name: SF02_SNPs_whole_Axiom_Arachis2_txt.gz
Resource Description: The original genotype calls for the Axiom array (for poly-high resolution SNPs). Changes were made to this file on 4/15/2020: Corrected three peanut variety identifiers: ROL11 --> TamrunOL-11; NCL06 --> TamnutOL-06; NM309N2 --> NM309-2
Resource Title: Genotyping calls in VCF format.
File Name: SF03_SNPs_whole_Axiom_Arachis2_vcf.gz
Resource Description: The Axiom array genotype calls, in VCF format. Changes were made to this file on 4/15/2020: Corrected three peanut variety identifiers: ROL11 --> TamrunOL-11; NCL06 --> TamnutOL-06; NM309N2 --> NM309-2
Resource Title: DNA variants for all accessions, including from genome assemblies, in TSV format.
File Name: SF04_SNPs_w_4_genomes_tsv.gz
Resource Description: The predominant DNA variants at each SNP location, for all accessions, including variants inferred from four available genome assemblies: A. duranensis and A. ipaensis together, and A. hypogaea accessions Tifrunner, Shitouqi, and Fuhuasheng. The format is in a simple tab-separated table, with 14431 columns (SNP positions). Changes were made to this file on 4/15/2020: Corrected three peanut variety identifiers: ROL11 --> TamrunOL-11; NCL06 --> TamnutOL-06; NM309N2 --> NM309-2
Resource Title: DNA variants for all accessions, including from genome assemblies, in fasta format.
File Name: SF05_SNPs_w_4_gnm_mrgd_fas.gz
Resource Description: The predominant DNA variants at each SNP location, for all accessions, including variants inferred from four available genome assemblies: A. duranensis and A. ipaensis together, and A. hypogaea accessions Tifrunner, Shitouqi, and Fuhuasheng. In fasta format. Changes were made to this file on 4/15/2020: Corrected three peanut variety identifiers: ROL11 --> TamrunOL-11; NCL06 --> TamnutOL-06; NM309N2 --> NM309-2
Resource Title: Base-calls for selected accessions, relative to A- and B-genome progenitors.
File Name: SF06_chip_and_genome_samples_v05.xlsx
Resource Description: DNA base-calls for 16 selected, diverse accessions, with comparisons to the variants observed in the A. duranensis and A. ipaensis genomes, and inferences regarding the likely progenitor for the DNA, i.e. A-genome (A. duranensis) or B-genome (A. ipaensis). Changes were made to this file on 4/15/2020: Added INDEX worksheet and corrected three peanut variety identifiers: ROL11 --> TamrunOL-11; NCL06 --> TamnutOL-06; NM309N2 --> NM309-2
Resource Title: Reduced fasta alignments, at 98% identity.
File Name: SF07_SNPs_w_4_gnm_mrgd_cen98_fas.gz
Resource Description: Reduced fasta alignments (relative to the complete alignment file, S5). File S7 has the centroid representatives at 98% identity. This files has 518 sequences. Changes were made to this file on 4/15/2020: Corrected three peanut variety identifiers: ROL11 --> TamrunOL-11; NCL06 --> TamnutOL-06; NM309N2 --> NM309-2
Resource Title: Reduced fasta alignments, at 99% identity.
File Name: SF08_SNPs_w_4_gnm_mrgd_cen99_fas.gz
Resource Description: Reduced fasta alignments (relative to the complete alignment file, S5). File S8 has the centroid representatives at 99% identity. This file has 680 sequences. Changes were made to this file on 4/15/2020: Corrected three peanut variety identifiers: ROL11 --> TamrunOL-11; NCL06 --> TamnutOL-06; NM309N2 --> NM309-2
Resource Title: Phylogenetic tree of genotype data.
File Name: SF09_SNPs_w_4_gnm_mrgd_rt3_nh_txt.gz
Resource Description: Phylogenetic tree (Newick format) calculated from the alignent in S5, and corresponding with the phylogenetic tree shown in manuscript Figure 1. Changes were made to this file on 4/15/2020: Corrected three peanut variety identifiers: ROL11 --> TamrunOL-11; NCL06 --> TamnutOL-06; NM309N2 --> NM309-2
Resource Title: Subgenome origins of SNPs relative to the A-genome and B-genome progenitors.
File Name: SF13_chip_and_genome_GFFs.xlsx
Resource Description: Inferred subgenome origins of SNPs relative to the A-genome and B-genome progenitors (A. duranensis and A. ipaensis). This data is in GFF format, derived from S6, and used as the basis for the plots in Figure 7 (showing regions of possible subgenome invasions). Changes were made to this file on 4/15/2020: Added INDEX worksheet and corrected three peanut variety identifiers: ROL11 --> TamrunOL-11; NCL06 --> TamnutOL-06; NM309N2 --> NM309-2
Resource Title: Peruvian Moche-era peanut necklace.
File Name: SF15_Sipan_neclkace_Donnan_Einstein.jpg
Resource Description: Picture of necklace of peanuts, sculpted in gold and silver, from the Moche-era tomb at Sipán (c.AD 250) in coastal Peru. Photograph by Susan Einstein, courtesy of Christopher Donnan. Changes were made to this file on 4/15/2020: Replaced black-and-white derived image with original color image
On 19 June 2014, we conducted a two-tiered search (through that date) on the Web of Science Core Collection, CAB International, MEDLINE, Biological Abstracts, FSTA (Food Science and Technology Abstracts), and Zoological Record databases, using the ISI Web of Science search tool. We located 239,571 unique publications with the search terms: cotton OR Gossypium. A search of these records using the term “cover crop” resulted in 424 publications, composed of refereed articles, conference proceedings, research reports, and bulletins. With examination of these 424 eligible publications, 320 were excluded because they met our exclusion criteria: means for cover crop or no-cover crop treatments were not included, cotton yield or weed growth were not reported, article was a duplicate, article did not contain primary data (review or book), or they were not obtainable using interlibrary loan services (five articles). We did not include intercropping (cover crops grown simultaneously with cotton) studies, nor did we include studies that used weed count as the response variable. For the weed biomass effect size (ES), if an experiment included both weed and weed-free fallow no-cover-crop controls, we used the weed fallow no-cover-crop control in our analysis. If an experiment included herbicides applied over all treatments in season, we excluded the weed biomass ES but included the cotton biomass ES. We identified 104 articles that met our screening criteria (a full citation list and details of primary studies are provided in the supplemental material). Papers spanned 48 yr and were in English and Portuguese languages.
\nTreatment means and number of replications (sample sizes) were collected for each study. For publications reporting means for more than one no-cover-crop (control) treatment in a nonfactorial experiment, we used the no-cover-crop control that most closely approximated the cover crop treatment. If replications were given as a range, we used the smallest value. For studies that did not report number of replications, we used n = 1 unless LSD or SEs were provided, in which case we used n = 2. If data were provided in graphical form, means were extracted using WebPlotDigitizer (Rogatgi, 2011).
\nMultiple treatment combinations from one article were treated as independent studies (also referred to as trials or paired observations in the meta-analysis literature) and represented individual units in the meta-analysis. For example, Ashworth et al. (2018) and Li et al. (2013) examined the effects of two cover crop species over 3 yr, resulting in six studies from that article for lint yield ES. Vasilakoglou et al. (2011) studied control of three weed genera by four varieties of one cover crop species, resulting in 12 studies for the weed control ES. Although, the use of multiple studies from one publication has the disadvantage of increasing the dependence among studies that are assumed to be independent (Gurevitch and Hedges, 1999), the greater number of studies maximizes the meta-analysis’ statistical power (Lajeuness and Forbes, 2003). This approach has been used often in agricultural and plant biology meta-analyses (Mayerhofer et al., 2013; McGrath and Lobell, 2013; Ferraretto and Shaver, 2015). Therefore, we derived 1117 studies from 104 articles. As in prior meta-analyses (Ashworth et al., 2018; Mayerhofer et al., 2013), we used the final time point in the meta-analysis for studies that included data for multiple time points in one season. One exception was weed control, as an article used in this meta-analysis reported means that were recorded at three time points during the season (Norsworthy et al., 2010). Considering that each year of an experiment provides varying growing conditions only weakly correlated with other years (repeated measures across years is not needed in our experience), we considered each year as an independent study in the meta-analysis.
\nResource Title: Meta analysis of cotton yield and weed suppression moderator data .
File Name: Copy of Cotton cover crop meta data 12-15-14 heather victoria oz combined_hdt.xlsx
Resource Description: To systematically evaluate cover crop effects on cotton yield and weed suppression, we conducted a random-effects meta-analysis investigating 10 moderating variables in 104 articles, yielding 1117 independent studies over 48 yr.
Our goals with this dataset were to 1) isolate, culture, and identify two fungal life stages of Aspergillus flavus, 2) characterize the volatile emissions from grain inoculated by each fungal morphotype, and 3) understand how microbially-produced volatile organic compounds (MVOCs) from each fungal morphotype affect foraging, attraction, and preference by S. oryzae. This dataset includes that derived from headspace collection coupled with GC-MS, where we found the sexual life stage of A. flavus had the most unique emissions of MVOCs compared to the other semiochemical treatments. This translated to a higher arrestment with kernels containing grain with the A. flavus sexual life stage, as well as a higher cumulative time spent in those zones by S. oryzae in a video-tracking assay in comparison to the asexual life stage. While fungal cues were important for foraging at close-range, the release-recapture assay indicated that grain volatiles were more important for attraction at longer distances. There was no significant preference between grain and MVOCs in a four-way olfactometer, but methodological limitations in this assay prevent broad interpretation. Overall, this study enhances our understanding of how fungal cues affect the foraging ecology of a primary stored product insect.
\nIn the assays described herein, we analyzed the behavioral response of Sitophilus oryzae to five different blends of semiochemicals found and introduced in wheat (Table 1). Briefly, these included no stimuli (negative control), UV-sanitized grain, clean grain from storage (unmanipulated, positive control), as well as grain from storage inoculated with fungal morphotype 1 (M1, identified as the asexual life stage of Aspergillus flavus) and fungal morphotype 2 (M2, identified as the sexual life stage of A. flavus). Fresh samples of semiochemicals were used for each day of testing for each assay. In order to prevent cross-contamination, 300 g of grain (tempered to 15% grain moisture) was initially sanitized using UV for 20 min. This procedure was done before inoculating grain with either morphotype 1 or 2. The 300 g of grain was kept in a sanitized mason jar (8.5 D × 17 cm H). To inoculate grain with the two different morphologies, we scraped an entire isolation from a petri dish into the 300 g of grain. Each isolation was ~1 week old and completely colonized by the given morphotype. After inoculation, each treatment was placed in an environmental chamber (136VL, Percival Instruments, Perry, IA, USA) set at constant conditions (30°C, 65% RH, and 14:10 L:D). This procedure was the same for both morphologies and was done every 2 weeks to ensure fresh treatments for each experimental assay.
\nSee file list for descriptions of each data file.
Resource Title: Ethovision Movement Assay.
File Name: ponce_lizarraga_ethovision_assay_microbial_volatiles_2020.csv
Resource Software Recommended: Excel,url: https://www.microsoft.com/en-us/microsoft-365/excel
Resource Title: Olfactometer Round 1 Assay - With Fused Air Permeable Glass.
File Name: ponce_lizarraga_first_round_olfactometer_fungal_study_2020.csv
Resource Software Recommended: Excel,url: https://www.microsoft.com/en-us/microsoft-365/excel
Resource Title: Olfactometer Round 2 Assay - With Fused Air Permeable Glass Containing Holes.
File Name: ponce_lizarraga_second_round_olfactometer_fungal_study_2021.csv
Resource Software Recommended: Excel,url: https://www.microsoft.com/en-us/microsoft-365/excel
Resource Title: Small Release-Recapture Assay.
File Name: ponce_lizarraga_small_release_recapture_assay.csv
Resource Software Recommended: Excel,url: https://www.microsoft.com/en-us/microsoft-365/excel
Resource Title: Large Release-Recapture Assay.
File Name: ponce_lizarraga_large_release_recapture_assay.csv
Resource Software Recommended: Excel,url: https://www.microsoft.com/en-us/microsoft-365/excel
Resource Title: Headspace Volatile Collection Assay.
File Name: sandra_headspace_volatiles_2020.csv
Resource Software Recommended: Excel,url: https://www.microsoft.com/en-us/microsoft-365/excel
Resource Title: README file list.
File Name: file_list_stored_grain_Aspergillus_Sitophilus_oryzae.txt
Data collected from analysis of sorghum protein composition, in-vitro protein digestibility, and grain physical traits from sorghum grown under different nitrogen fertilization levels and time of application.
", "title": "Data from: Grain protein and amino acid dynamics in sorghum with in-season split-nitrogen application", "distribution": [ { "@type": "dcat:Distribution", "downloadURL": "https://ndownloader.figshare.com/files/47120467", "format": "csv", "mediaType": "text/plain", "title": "Ostmeyer et al 2024 Data upload.csv" } ], "license": "https://www.usa.gov/publicdomain/label/1.0/", "bureauCode": [ "005:18" ], "modified": "2024-06-20", "publisher": { "@type": "org:Organization", "name": "Agricultural Research Service" }, "keyword": [ "sorghum", "protein", "amino acid", "grain composition" ], "spatial": "{\"type\": \"Point\", \"coordinates\": [-96.599089801312, 39.195700571735]}" }, { "identifier": "10.15482/USDA.ADC/25330684.v1", "accessLevel": "public", "contactPoint": { "hasEmail": "mailto:mark.liebig@usda.gov", "fn": "Liebig, Mark A." }, "programCode": [ "005:040" ], "description": "Integrated crop-livestock (ICL) systems represent a promising approach to sustainably intensify agricultural production. However, the inherent complexity of ICL systems contributes to potential tradeoffs among production, economic, and environmental attributes. Among the many important environmental metrics associated with agricultural production, nitrous oxide (N2O) flux from soil is prominent for its dual role as a strong greenhouse gas and its capacity to deplete ozone in the stratosphere. Unfortunately, there is limited understanding of ICL system effects on N2O flux from soil, especially in North America. Given this context, soil-atmosphere N2O flux was measured from ICL and non-ICL practices over a 3-year period near Mandan, ND USA. Evaluated treatments included grazed and ungrazed cropland and grassland, each replicated four times. Measurements of N2O flux were made using static chamber methodology 93 times over the study period (14 Oct 2016 – 16 Oct 2019). Near-surface soil water content and temperature were measured concurrently with N2O flux when the soil was not frozen. Seasonal measurements of soil bulk density, soil pH, and extractable nitrate-N and ammonium-N were evaluated in all treatments each year. Data may be used to understand N2O flux and soil property dynamics in ICL production systems. Data are generally applicable to cropland under a semiarid Continental climate for the following soil types: Grassna, Linton, Mandan, Temvik, Williams, and Wilton.
", "title": "Data from: Grazing Effects on Nitrous Oxide Flux in an Integrated Crop-Livestock System", "distribution": [ { "@type": "dcat:Distribution", "downloadURL": "https://ndownloader.figshare.com/files/44810308", "format": "xlsx", "mediaType": "application/zip", "title": "ICLN2O_Data Dictionary.xlsx" }, { "@type": "dcat:Distribution", "downloadURL": "https://ndownloader.figshare.com/files/44810311", "format": "xlsx", "mediaType": "application/zip", "title": "ICLN2O_Soil_Data&Metadata.xlsx" }, { "@type": "dcat:Distribution", "downloadURL": "https://ndownloader.figshare.com/files/44810314", "format": "xlsx", "mediaType": "application/zip", "title": "ICLN2O_GHG_Data&Metadata.xlsx" }, { "@type": "dcat:Distribution", "downloadURL": "https://ndownloader.figshare.com/files/44810317", "format": "csv", "mediaType": "application/csv", "title": "ICLN2O_GHG_Data.csv" }, { "@type": "dcat:Distribution", "downloadURL": "https://ndownloader.figshare.com/files/44810320", "format": "csv", "mediaType": "text/plain", "title": "ICLN2O_GHG_Metadata.csv" }, { "@type": "dcat:Distribution", "downloadURL": "https://ndownloader.figshare.com/files/44810323", "format": "csv", "mediaType": "text/plain", "title": "ICLN2O_Soil_Data.csv" }, { "@type": "dcat:Distribution", "downloadURL": "https://ndownloader.figshare.com/files/44810326", "format": "csv", "mediaType": "application/csv", "title": "ICLN2O_Soil_Metadata.csv" } ], "license": "https://creativecommons.org/publicdomain/zero/1.0/", "bureauCode": [ "005:18" ], "modified": "2024-03-07", "publisher": { "@type": "org:Organization", "name": "Agricultural Research Service" }, "accrualPeriodicity": "irregular", "keyword": [ "Greenhouse gases Environmental aspects", "integrated crop-livestock systems", "Northern Great Plains", "Cropland", "Perennial forages", "Grazing cattle", "Semiarid region.", "Long-term experiment" ], "spatial": "{\"type\": \"MultiPoint\", \"coordinates\": [[-100.91277, 46.7732], [-100.90423, 46.76765]]}" }, { "identifier": "10.15482/USDA.ADC/1519425", "accessLevel": "public", "contactPoint": { "hasEmail": "mailto:dlleslie@memphis.edu", "fn": "Leslie, Deborah" }, "programCode": [ "005:040" ], "description": "Groundwater level measurements (depth to groundwater) in a critical groundwater area in northeast Arkansas. Group A well measurements are select United States Geological Survey (USGS) measurements during 1985-2012. Group B well measurements are select USGS and United States Department of Agriculture-Agricultural Research Service Delta Water Management Research Unit well data in northeast Arkansas during 2012-2019. These data could be used to further understand groundwater levels and trends in a critical groundwater area of eastern Arkansas.
\nResource Title: Group A groundwater well coordinates and measurements 1985-2012.
File Name: Group A Well Data.xlsx
Resource Software Recommended: Microsoft Exel,url: www.microsoft.com
Resource Title: Group B groundwater well coordinates and measurements 2012-2019.
File Name: Group B Well Data.xlsx
Resource Software Recommended: Microsoft Excel,url: www.microsoft.com
This Ag Data Commons submission includes the 94 sunflower paired-end sequencing FASTQ files, the corresponding 16S bacterial FASTQ files, and other relevant data to the study described below:
\nHost-microbe interactions are increasingly recognized as important drivers of organismal health, growth, longevity, and community-scale ecological processes. However, less is known about how genetic variation affects hosts' associated microbiomes and downstream phenotypes. We demonstrate that sunflower Helianthus annuus harbors substantial, heritable variation in microbial communities under field conditions. We show that microbial communities co-vary with heritable variation in resistance to root infection caused by the necrotrophic pathogen Sclerotinia sclerotiorum, and that plants grown in autoclaved soil showed almost complete elimination of pathogen resistance. Association mapping suggests at least 59 genetic locations with effects on both microbial relative abundance and Sclerotinia resistance. Although the genetic architecture appears quantitative, we have elucidated previously unexplained genetic variation for resistance to this pathogen. We identify new targets for plant breeding and demonstrate the potential for heritable microbial associations to play important roles in defense in natural and human-altered environments.
\nSee README for details of each table in the spreadsheet and related information.
", "title": "Data from: Heritable differences in abundance of bacterial rhizosphere taxa are correlated with fungal necrotrophic pathogen resistance", "distribution": [ { "@type": "dcat:Distribution", "downloadURL": "https://ndownloader.figshare.com/files/44541335", "format": "docx", "mediaType": "application/zip", "title": "README.docx" }, { "@type": "dcat:Distribution", "downloadURL": "https://ndownloader.figshare.com/files/44541338", "format": "xlsx", "mediaType": "application/vnd.openxmlformats-officedocument.spreadsheetml.sheet", "title": "Pogoda et al Molecular Ecology 2023.xlsx" } ], "license": "https://www.usa.gov/publicdomain/label/1.0/", "bureauCode": [ "005:18" ], "modified": "2024-02-14", "publisher": { "@type": "org:Organization", "name": "Agricultural Research Service" }, "keyword": [ "sunflower", "helianthus annuus", "host-microbe interactions", "genetic variation", "microbial community", "heritable resistance", "nectrotrophic pathogen", "Sclerotinia sclerotiorum", "pathogen resistance", "association mapping", "EARTH SCIENCE > AGRICULTURE > AGRICULTURAL PLANT SCIENCE > PLANT BREEDING AND GENETICS", "plant breeding", "soil microbiome", "16S and ITS amplicon", "quantitative genetics", "Bacteria", "bioinformatics", "community ecology", "NP301", "data.gov", "ARS" ], "spatial": "{\"type\": \"Point\", \"coordinates\": [-99.121611, 47.507595]}" }, { "identifier": "10.15482/USDA.ADC/1528351", "accessLevel": "public", "contactPoint": { "hasEmail": "mailto:natalie.west@usda.gov", "fn": "West, Natalie M." }, "programCode": [ "005:040" ], "description": "Site information and field-collected data from a 1-year 100-site survey of leafy spurge (Euphorbia virgata/esula) populations in the northern U.S. Data include: 1) estimates of leafy spurge density and relative prevalence of ramets versus genets; 2) the abundance and composition of Aphthona species complex biological control agents; 3) presence/absence of two additional biological control agents (Oberea erythrocephala and Hyles euphorbiae).
Resource Title: Data from: High genetic diversity in the landscape suggests frequent seedling recruitment by Euphorbia virgata (leafy spurge) in the northern U.S.A..
File Name: West et al Leafy Spurge clonality data.csv
Resource Description: Dataset containing site-level estimates of leafy spurge abundance, clonality, and associated biological control agent community
Resource Title: Key for Dataset: High genetic diversity in the landscape suggests frequent seedling recruitment by Euphorbia virgata (leafy spurge) in the northern U.S.A..
File Name: Key for West et al Leafy Spurge clonality data.csv
Resource Description: This provides information on the data columns included in the associated dataset.
Honey bees (Apis mellifera) often encounter a variety of stressors in their environment, including poor nutrition and pesticides. These stressors interact and can be exacerbated in large-scale agroecosystems. We investigated how diets varying in macronutrient ratios can affect nurse bee susceptibility to pesticide stressors. Nurse bees were fed sublethal concentrations of clothianidin (CLO), a neonicotinoid insecticide known to have sublethal and lethal effects on honey bees, after newly emerged bees were given diets varying in proteins and lipids, a natural pollen diet, or no diet. Bees given pollen had improved longevity, physiology, enzyme activity, and gene expression related to pesticide detoxification. The artificial diets helped improve bee health and physiology but did little to promote bee detoxification enzymes and genes. There was no effect of the sublethal CLO treatments on its own, but there was an interactive effect between our high CLO treatment and nutrition on bee longevity and vitellogenin expression. Honey bees given pollen upregulated of detoxification genes and had higher enzyme activity related to pesticide metabolism. Our results suggest that macronutrients in artificial diets can help promote bee physiology, but other nutrients in pollen, such as potentially phytochemicals, are more directly linked honey bee tolerance to pesticide stress.
\nThis work was supported by United States Department of Agriculture, Agricultural Research Service, Research Project No. 6066-21000-001-000-D, Ecological Assessment and Mitigation Strategies to Reduce the Risks of Bees to Stressors in Southern Crop Ecosystems.
", "title": "Data from: Honey bee immune response to sublethal concentrations of clothianidin goes beyond the macronutrients found in artificial diets", "distribution": [ { "@type": "dcat:Distribution", "downloadURL": "https://ndownloader.figshare.com/files/47019133", "format": "xlsx", "mediaType": "application/vnd.openxmlformats-officedocument.spreadsheetml.sheet", "title": "CLO-macronutrients abdominal protein and lipids.xlsx" }, { "@type": "dcat:Distribution", "downloadURL": "https://ndownloader.figshare.com/files/47019127", "format": "xlsx", "mediaType": "application/vnd.openxmlformats-officedocument.spreadsheetml.sheet", "title": "CLO-macronutrients enzyme data.xlsx" }, { "@type": "dcat:Distribution", "downloadURL": "https://ndownloader.figshare.com/files/47019130", "format": "xlsx", "mediaType": "application/vnd.openxmlformats-officedocument.spreadsheetml.sheet", "title": "CLO-macronutrients gene expression.xlsx" }, { "@type": "dcat:Distribution", "downloadURL": "https://ndownloader.figshare.com/files/47019136", "format": "xlsx", "mediaType": "application/vnd.openxmlformats-officedocument.spreadsheetml.sheet", "title": "CLO-macronutrients mortality .xlsx" } ], "license": "https://creativecommons.org/licenses/by/4.0/", "bureauCode": [ "005:18" ], "modified": "2024-06-24", "publisher": { "@type": "org:Organization", "name": "Agricultural Research Service" }, "keyword": [ "honey bee", "pesticide", "neonicotinoids", "clothianidin", "nutrition", "proteins", "lipids", "phytochemicals", "immunity" ] }, { "identifier": "10.15482/USDA.ADC/1529551", "accessLevel": "public", "contactPoint": { "hasEmail": "mailto:tatyana.rand@usda.gov", "fn": "Rand, Tatyana" }, "programCode": [ "005:040" ], "description": "Data are from a laboratory experiment conducted to examine the potential effects of honeydew from six different aphid species by crop species combinations on the longevity of Bracon cephi Gahan (Hymenoptera: Braconidae), the most important biological control of the wheat stem sawfly, Cephus cinctus Norton (Hymenoptera: Cephidae), a major pest of wheat in the northern Great Plains of North America. We quantified the number of days parasitoids lived on each honeydew type.
\nAbstract from published manuscript:\nThe absence of sugar resources can be an important factor in limiting the success of parasitoids as biological control agents. Restoring vegetation complexity within agricultural landscapes has thus become a major focus of conservation biological control efforts, with a traditional emphasis on nectar resources. Aphid honeydew is also an important source of sugars that is infrequently considered. We carried out a laboratory experiment to examine the potential effects of honeydew from six different aphid species by crop species combinations on the longevity of Bracon cephi Gahan (Hymenoptera: Braconidae), the most important biological control of the wheat stem sawfly, Cephus cinctus Norton (Hymenoptera: Cephidae), a major pest of wheat in the northern Great Plains of North America. The benefits of honeydew for parasitoid longevity varied significantly among different aphid and crop species, illustrating the complexity of these interactions. However, honeydew produced by four aphid species commonly found in wheat, pea, and canola crops significantly increased the longevity (by two- to threefold) of the parasitoid. The study suggests that honeydew provisioning could be an important mechanism underlying the benefits of crop diversification to support biological control that merits further research.
\nResources in this dataset:
\nResource title: Data Directory\nFile name: Data Directory for Bc x Honeydew.xlsx\nResource description: Column descriptions for WSS BC X Honeydew longevity_ Ag Data Commons
\nResource title: Parasitoid survival by honeydew treatment\nFile name: WSS BC X Honeydew longevity_ Ag Data Commons.xlsx\nResource description: The data are parasitoid survival in days on six different honeydew sugar resources.
\nCulicoides biting midges (Diptera: Ceratopogonidae) are hematophagous flies that transmit several viruses of veterinary concern to livestock. Understanding blood feeding behaviors is integral towards identification of putative vector species and preventing the transmission of these pathogens. PCR-based blood meal analysis was conducted on 440 blood-engorged Culicoides midges collected in northeastern Kansas, with 316 (71.8%) returning non-human vertebrate identifications at the ≥95% identity match level. Broadly, Culicoides sonorensis, Culicoides stellifer, and Culicoides variipennis were found to feed heavily on mammalian hosts, while Culicoides crepuscularis and Culicoides haematopotus fed on avian hosts. The blood meals in all specimens were graded prior to DNA extraction to determine whether blood meal size or digestion status significantly impacted the likelihood of a quality host match. Size had a significant impact on the likelihood of a quality match at grades 3–5, whereas digestion only significantly impacted outcomes at the most extreme grade. These vector–host dynamics have not previously been studied in Culicoides collected in Kansas, which represents a unique tallgrass prairie biome within the United States that is heavily interspersed with livestock operations. Based on these data, the highly abundant species C. crepuscularis and C. haematopotus are unlikely to be major vectors of mammalian viruses.
", "title": "Data from: Host associations of Culicoides biting midges in Northeastern Kansas, USA", "distribution": [ { "@type": "dcat:Distribution", "downloadURL": "https://ndownloader.figshare.com/files/44185232", "format": "csv", "mediaType": "text/plain", "title": "BloodMealData_Complete.csv" }, { "@type": "dcat:Distribution", "downloadURL": "https://ndownloader.figshare.com/files/44185235", "format": "csv", "mediaType": "text/plain", "title": "BloodMealData_Coordinates.csv" } ], "license": "https://creativecommons.org/licenses/by/4.0/", "bureauCode": [ "005:18" ], "modified": "2024-03-05", "publisher": { "@type": "org:Organization", "name": "Agricultural Research Service" }, "accrualPeriodicity": "R/P1M", "keyword": [ "Culicoides", "Blood meal analysis", "Kansas", "Blood meal size", "Blood meal digestion" ] }, { "identifier": "10.15482/USDA.ADC/1522573", "accessLevel": "public", "contactPoint": { "hasEmail": "mailto:Patrick.Moran@usda.gov", "fn": "Moran, Patrick J." }, "programCode": [ "005:040" ], "description": "Data from choice and no-choice tests associated with the paper cited below. Drought leading to water deficit stress is known to reduce performance of galling insects. The shoot tip-galling fly Parafreutreta regalis has been released for biological control of Cape-ivy (Delairea odorata) in California. Lack of moisture during the dry season causes wilting of Cape-ivy shoots, and subsequent reduced host quantity and quality could influence the fly’s ability to multiply and establish. We imposed water deficit stress on potted Cape-ivy plants, then measured the plant’s and insect’s response to water deficit compared to fully-watered plants. Water deficit stress was imposed during female oviposition (short-term), gall development (long-term), or full insect life cycle (long-term). Plants subjected to long-term water deficit showed declines in shoot growth, leaf area, and total biomass. In choice tests, 72% fewer galls were found on water deficit stressed plants, but there was no difference in the numbers of insects per gall. In no-choice tests, long-term water deficit reduced the number and size of galls by up to 51% and 39%, respectively, and puparia inside the galls were up to 35% smaller. Long-term water deficit also increased the time required for the insect to complete its life cycle (egg to adult) by about 10 days, and up to 80% fewer adults emerged, decreasing the fly’s rate of increase by up to five-fold. Our study shows that P. regalis will oviposit and develop successfully on water deficit-stressed plants, but declines in female preference, insect development and abundance could inhibit fly field establishment and/or population growth under climatic drought conditions.
Resource Title: Data from: Host plant water deficit stress impairs reproduction and development of the galling fly (Parafreutreta regalis), a biological control agent of Cape-ivy (Delairea odorata).
File Name: CI Fly Drought Stress Biological Control Data Archive.csv
Resource Description: Tabular data for all choice and no-choice experiments
Resource Software Recommended: MS Excel,url: https://www.microsoft.com/en-us/microsoft-365?ms.url=office365com&rtc=1
Resource Title: Data dictionary text file describing column headings in the csv data file..
File Name: Data Dictionary for Archiving Feb17-2021.txt
Resource Description: Data dictionary text file describing column headings in the csv file
Resource Software Recommended: MS Word,url: https://www.microsoft.com/en-us/microsoft-365?ms.url=office365com&rtc=1
The soybean aphid, Aphis glycines Matsumura (Hemiptera: Aphididae), is native to Asia where it is an occasional pest of soybean, Glycine max (L.). Aphis glycines was found during 2000 in North America and since then has spread throughout much of the area where soybean is grown. In Asia, A. glycines seldom reaches damaging levels; however in North America, it has become the most important insect pest of soybean, decreasing yields and incurring large control costs. Field surveys and exclosure experiments in China showed that natural enemies can limit soybean aphid abundance. A project to find, evaluate, and introduce Asian natural enemies into North America was initiated in 2001, with an emphasis on parasitoids. To ensure that introductions of exotic parasitoids would have minimum impact on non-target species, we tested host specificity of all candidates for introduction. These data sets provide results of no-choice laboratory experiments on host specificity of 13 populations in seven species from three species complexes in the genus Aphelinus (Hymenoptera: Aphelinidae). They also provide results of experiments on the mechanisms of host specificity in three parasitoid species with narrow host ranges.
\nSee the included README file list for more details on methods and citations for these data files.
Resource Title: Data dictionary for data from: Host specificity of Aphelinus species collected from soybean aphid in Asia.
File Name: data_dictionary_host_specificity_of_Aphelinus.csv
Resource Title: Collection information for Aphelinus species from soybean aphid for: Host specificity of Aphelinus species collected from soybean aphid in Asia.
File Name: Aphelinus_soybean_aphid_culture_data.csv
Resource Title: Parasitism of aphid species by Aphelinus species collected from soybean aphid.
File Name: Aphelinus_soybean_aphid_host_use.csv
Resource Title: Parasitism of Aphis species by Aphelinus coreae.
File Name: Aphelinus_coreae_with_Aphis_species.csv
Resource Title: Parasitism of Aphis species by Aphelinus glycinis.
File Name: Aphelinus_glycinis_with_Aphis_species.csv
Resource Title: Parasitism of Aphis species by Aphelinus rhamni.
File Name: Aphelinus_rhamni_with_Aphis_species.csv
Resource Title: Summary behavior of Aphelinus coreae exposed to various aphid species.
File Name: Aphelinus_coreae_behavior_summary.csv
Resource Title: Detailed behavior of female Aphelinus coreae and various aphid species.
File Name: Aphelinus_coreae_behavior_detailed.csv
Resource Title: Summary behavior of female Aphelinus glycinis exposed to various aphid species.
File Name: Aphelinus_glycinis_behavior_summary.csv
Resource Title: Detailed behavior of female Aphelinus glycinis and various aphid species.
File Name: Aphelinus_glycinis_behavior_detailed.csv
Resource Title: Summary behavior of female Aphelinus rhamni exposed to various aphid species.
File Name: Aphelinus_rhamni_behavior_summary.csv
Resource Title: Detailed behavior of female Aphelinus rhamni and aphid species.
File Name: Aphelinus_rhamni_behavior_detailed.csv
Resource Title: README file list for Data from: Host specificity of Aphelinus species collected from soybean aphid in Asia.
File Name: file_list_HostSpecificityAphelinusAsia.txt
Diuraphis noxia, the Russian wheat aphid, has become a major pest of wheat and barley since first being detected in the western USA in 1986. However, it is rarely a pest in Eurasia, its area of origin, and research has shown that natural enemies can limit its abundance there. Among the most important of natural enemies of D. noxia in Eurasia are parasitoids in the genus Aphelinus. These data are results of laboratory experiments on host specificity of ten populations of seven species from two species complexes in the genus Aphelinus. Host specificity was not related to host plant species or the phylogenetic relatedness of the aphids or the parasitoids. While some species had very broad host ranges and others had intermediate host ranges, Aphelinus hordei had a very narrow host range, being restricted primarily to species in the genus Diuraphis, and especially D. noxia. We also report the results of experiments on the mechanisms of this host specificity. Most of the host specificity of A. hordei can be explained by differences in the behavior of females when they encountered different aphid species. Females of A. hordei rarely approach, sting, oviposit or host feed on aphids outside the genus Diuraphis, and they oviposit most frequently in D. noxia. From these results, we conclude that A. hordei is an excellent candidate for introduction into the USA to control D. noxia.
", "title": "Data from: Host specificity of Aphelinus species considered for introduction to control Diuraphis noxia", "distribution": [ { "@type": "dcat:Distribution", "downloadURL": "https://ndownloader.figshare.com/files/44335373", "format": "csv", "mediaType": "text/plain", "title": "Aphelinus_culture_data_grains.csv" }, { "@type": "dcat:Distribution", "downloadURL": "https://ndownloader.figshare.com/files/44335376", "format": "csv", "mediaType": "text/plain", "title": "Aphelinus_grain_aphids_host_use.csv" }, { "@type": "dcat:Distribution", "downloadURL": "https://ndownloader.figshare.com/files/44335379", "format": "csv", "mediaType": "text/plain", "title": "Aphelinus_hordei_host_use_round2.csv" }, { "@type": "dcat:Distribution", "downloadURL": "https://ndownloader.figshare.com/files/44335382", "format": "csv", "mediaType": "text/plain", "title": "Aphelinus_hordei_with_Diuraphis_species.csv" }, { "@type": "dcat:Distribution", "downloadURL": "https://ndownloader.figshare.com/files/44335385", "format": "csv", "mediaType": "text/plain", "title": "Aphelinus_hordei_behavior_summary.csv" }, { "@type": "dcat:Distribution", "downloadURL": "https://ndownloader.figshare.com/files/44335388", "format": "csv", "mediaType": "text/plain", "title": "Aphelinus_hordei_behavior_detailed.csv" }, { "@type": "dcat:Distribution", "downloadURL": "https://ndownloader.figshare.com/files/44335391", "format": "csv", "mediaType": "text/plain", "title": "data_dictionary_host_specificity_of_Aphelinus.csv" }, { "@type": "dcat:Distribution", "downloadURL": "https://ndownloader.figshare.com/files/44335424", "format": "txt", "mediaType": "text/plain", "title": "file_list_HostSpecificityAphelinus.txt" } ], "license": "https://www.usa.gov/publicdomain/label/1.0/", "bureauCode": [ "005:18" ], "modified": "2024-02-08", "publisher": { "@type": "org:Organization", "name": "Agricultural Research Service" }, "accrualPeriodicity": "irregular", "keyword": [ "biological control", "Russian wheat aphid", "Aphelinus hordei", "Aphelinus varipes complex", "Aphelinus asychis complex", "NP304", "data.gov", "ARS" ], "spatial": "{\"type\": \"MultiPolygon\", \"coordinates\": [[[[110.339188, 18.678395], [109.47521, 18.197701], [108.655208, 18.507682], [108.626217, 19.367888], [109.119056, 19.821039], [110.211599, 20.101254], [110.786551, 20.077534], [111.010051, 19.69593], [110.570647, 19.255879], [110.339188, 18.678395]]], [[[127.657407, 49.76027], [129.397818, 49.4406], [130.582293, 48.729687], [130.987282, 47.790132], [132.506672, 47.78897], [133.373596, 48.183442], [135.026311, 48.47823], [134.500814, 47.57844], [134.112362, 47.212467], [133.769644, 46.116927], [133.097127, 45.144066], [131.883454, 45.321162], [131.025212, 44.967953], [131.288555, 44.11152], [131.144688, 42.92999], [130.633866, 42.903015], [130.640016, 42.395009], [129.994267, 42.985387], [129.596669, 42.424982], [128.052215, 41.994285], [128.208433, 41.466772], [127.343783, 41.503152], [126.869083, 41.816569], [126.182045, 41.107336], [125.079942, 40.569824], [124.265625, 39.928493], [122.86757, 39.637788], [122.131388, 39.170452], [121.054554, 38.897471], [121.585995, 39.360854], [121.376757, 39.750261], [122.168595, 40.422443], [121.640359, 40.94639], [120.768629, 40.593388], [119.639602, 39.898056], [119.023464, 39.252333], [118.042749, 39.204274], [117.532702, 38.737636], [118.059699, 38.061476], [118.87815, 37.897325], [118.911636, 37.448464], [119.702802, 37.156389], [120.823457, 37.870428], [121.711259, 37.481123], [122.357937, 37.454484], [122.519995, 36.930614], [121.104164, 36.651329], [120.637009, 36.11144], [119.664562, 35.609791], [119.151208, 34.909859], [120.227525, 34.360332], [120.620369, 33.376723], [121.229014, 32.460319], [121.908146, 31.692174], [121.891919, 30.949352], [121.264257, 30.676267], [121.503519, 30.142915], [122.092114, 29.83252], [121.938428, 29.018022], [121.684439, 28.225513], [121.125661, 28.135673], [120.395473, 27.053207], [119.585497, 25.740781], [118.656871, 24.547391], [117.281606, 23.624501], [115.890735, 22.782873], [114.763827, 22.668074], [114.152547, 22.22376], [113.80678, 22.54834], [113.241078, 22.051367], [111.843592, 21.550494], [110.785466, 21.397144], [110.444039, 20.341033], [109.889861, 20.282457], [109.627655, 21.008227], [109.864488, 21.395051], [108.522813, 21.715212], [108.05018, 21.55238], [107.04342, 21.811899], [106.567273, 22.218205], [106.725403, 22.794268], [105.811247, 22.976892], [105.329209, 23.352063], [104.476858, 22.81915], [103.504515, 22.703757], [102.706992, 22.708795], [102.170436, 22.464753], [101.652018, 22.318199], [101.80312, 21.174367], [101.270026, 21.201652], [101.180005, 21.436573], [101.150033, 21.849984], [100.416538, 21.558839], [99.983489, 21.742937], [99.240899, 22.118314], [99.531992, 22.949039], [98.898749, 23.142722], [98.660262, 24.063286], [97.60472, 23.897405], [97.724609, 25.083637], [98.671838, 25.918703], [98.712094, 26.743536], [98.68269, 27.508812], [98.246231, 27.747221], [97.911988, 28.335945], [97.327114, 28.261583], [96.248833, 28.411031], [96.586591, 28.83098], [96.117679, 29.452802], [95.404802, 29.031717], [94.56599, 29.277438], [93.413348, 28.640629], [92.503119, 27.896876], [91.696657, 27.771742], [91.258854, 28.040614], [90.730514, 28.064954], [90.015829, 28.296439], [89.47581, 28.042759], [88.814248, 27.299316], [88.730326, 28.086865], [88.120441, 27.876542], [86.954517, 27.974262], [85.82332, 28.203576], [85.011638, 28.642774], [84.23458, 28.839894], [83.898993, 29.320226], [83.337115, 29.463732], [82.327513, 30.115268], [81.525804, 30.422717], [81.111256, 30.183481], [79.721367, 30.882715], [78.738894, 31.515906], [78.458446, 32.618164], [79.176129, 32.48378], [79.208892, 32.994395], [78.811086, 33.506198], [78.912269, 34.321936], [77.837451, 35.49401], [76.192848, 35.898403], [75.896897, 36.666806], [75.158028, 37.133031], [74.980002, 37.41999], [74.829986, 37.990007], [74.864816, 38.378846], [74.257514, 38.606507], [73.928852, 38.505815], [73.675379, 39.431237], [73.960013, 39.660008], [73.822244, 39.893973], [74.776862, 40.366425], [75.467828, 40.562072], [76.526368, 40.427946], [76.904484, 41.066486], [78.187197, 41.185316], [78.543661, 41.582243], [80.11943, 42.123941], [80.25999, 42.349999], [80.18015, 42.920068], [80.866206, 43.180362], [79.966106, 44.917517], [81.947071, 45.317027], [82.458926, 45.53965], [83.180484, 47.330031], [85.16429, 47.000956], [85.720484, 47.452969], [85.768233, 48.455751], [86.598776, 48.549182], [87.35997, 49.214981], [87.751264, 49.297198], [88.013832, 48.599463], [88.854298, 48.069082], [90.280826, 47.693549], [90.970809, 46.888146], [90.585768, 45.719716], [90.94554, 45.286073], [92.133891, 45.115076], [93.480734, 44.975472], [94.688929, 44.352332], [95.306875, 44.241331], [95.762455, 43.319449], [96.349396, 42.725635], [97.451757, 42.74889], [99.515817, 42.524691], [100.845866, 42.663804], [101.83304, 42.514873], [103.312278, 41.907468], [104.522282, 41.908347], [104.964994, 41.59741], [106.129316, 42.134328], [107.744773, 42.481516], [109.243596, 42.519446], [110.412103, 42.871234], [111.129682, 43.406834], [111.829588, 43.743118], [111.667737, 44.073176], [111.348377, 44.457442], [111.873306, 45.102079], [112.436062, 45.011646], [113.463907, 44.808893], [114.460332, 45.339817], [115.985096, 45.727235], [116.717868, 46.388202], [117.421701, 46.672733], [118.874326, 46.805412], [119.66327, 46.69268], [119.772824, 47.048059], [118.866574, 47.74706], [118.064143, 48.06673], [117.295507, 47.697709], [116.308953, 47.85341], [115.742837, 47.726545], [115.485282, 48.135383], [116.191802, 49.134598], [116.678801, 49.888531], [117.879244, 49.510983], [119.288461, 50.142883], [119.279366, 50.582908], [120.18205, 51.643566], [120.738191, 51.964115], [120.725789, 52.516226], [120.177089, 52.753886], [121.003085, 53.251401], [122.245748, 53.431726], [123.571507, 53.458804], [125.068211, 53.161045], [125.946349, 52.792799], [126.564399, 51.784255], [126.939157, 51.353894], [127.287456, 50.739797], [127.657407, 49.76027]]], [[[9.560016, 42.152492], [9.229752, 41.380007], [8.775723, 41.583612], [8.544213, 42.256517], [8.746009, 42.628122], [9.390001, 43.009985], [9.560016, 42.152492]]], [[[3.588184, 50.378992], [4.286023, 49.907497], [4.799222, 49.985373], [5.674052, 49.529484], [5.897759, 49.442667], [6.18632, 49.463803], [6.65823, 49.201958], [8.099279, 49.017784], [7.593676, 48.333019], [7.466759, 47.620582], [7.192202, 47.449766], [6.736571, 47.541801], [6.768714, 47.287708], [6.037389, 46.725779], [6.022609, 46.27299], [6.5001, 46.429673], [6.843593, 45.991147], [6.802355, 45.70858], [7.096652, 45.333099], [6.749955, 45.028518], [7.007562, 44.254767], [7.549596, 44.127901], [7.435185, 43.693845], [6.529245, 43.128892], [4.556963, 43.399651], [3.100411, 43.075201], [2.985999, 42.473015], [1.826793, 42.343385], [0.701591, 42.795734], [0.338047, 42.579546], [-1.502771, 43.034014], [-1.901351, 43.422802], [-1.384225, 44.02261], [-1.193798, 46.014918], [-2.225724, 47.064363], [-2.963276, 47.570327], [-4.491555, 47.954954], [-4.59235, 48.68416], [-3.295814, 48.901692], [-1.616511, 48.644421], [-1.933494, 49.776342], [-0.989469, 49.347376], [1.338761, 50.127173], [1.639001, 50.946606], [2.513573, 51.148506], [2.658422, 50.796848], [3.123252, 50.780363], [3.588184, 50.378992]]], [[[35.719918, 32.709192], [35.545665, 32.393992], [35.18393, 32.532511], [34.974641, 31.866582], [35.225892, 31.754341], [34.970507, 31.616778], [34.927408, 31.353435], [35.397561, 31.489086], [35.420918, 31.100066], [34.922603, 29.501326], [34.265433, 31.219361], [34.556372, 31.548824], [34.488107, 31.605539], [34.752587, 32.072926], [34.955417, 32.827376], [35.098457, 33.080539], [35.126053, 33.0909], [35.460709, 33.08904], [35.552797, 33.264275], [35.821101, 33.277426], [35.836397, 32.868123], [35.700798, 32.716014], [35.719918, 32.709192]]], [[[41.554084, 41.535656], [41.703171, 41.962943], [41.45347, 42.645123], [40.875469, 43.013628], [40.321394, 43.128634], [39.955009, 43.434998], [40.076965, 43.553104], [40.922185, 43.382159], [42.394395, 43.220308], [43.756017, 42.740828], [43.9312, 42.554974], [44.537623, 42.711993], [45.470279, 42.502781], [45.77641, 42.092444], [46.404951, 41.860675], [46.145432, 41.722802], [46.637908, 41.181673], [46.501637, 41.064445], [45.962601, 41.123873], [45.217426, 41.411452], [44.97248, 41.248129], [43.582746, 41.092143], [42.619549, 41.583173], [41.554084, 41.535656]]], [[[-107.919731, 41.003906], [-105.728954, 40.998429], [-104.053011, 41.003906], [-102.053927, 41.003906], [-102.053927, 40.001626], [-102.042974, 36.994786], [-103.001438, 37.000263], [-104.337812, 36.994786], [-106.868158, 36.994786], [-107.421329, 37.000263], [-109.042503, 37.000263], [-109.042503, 38.166851], [-109.058934, 38.27639], [-109.053457, 39.125316], [-109.04798, 40.998429], [-107.919731, 41.003906]]]]}" }, { "identifier": "10.1371/journal.pone.0150055", "accessLevel": "public", "contactPoint": { "hasEmail": "mailto:brian@uidaho.edu", "fn": "Dennis, Brian" }, "programCode": [ "005:040" ], "description": "A mathematical model is constructed to quantify the loss of resilience in collapsing honey bee colonies due to the presence of a strong Allee effect. In the model, recruitment and mortality of adult bees have substantial social components, with recruitment enhanced and mortality reduced by additional adult bee numbers. The result is an Allee effect, a net per-individual rate of hive increase that increases as a function of adult bee numbers. The Allee effect creates a critical minimum size in adult bee numbers, below which mortality is greater than recruitment, with ensuing loss of viability of the hive. Under ordinary and favorable environmental circumstances, the critical size is low, and hives remain large, sending off viably-sized swarms (naturally or through beekeeping management) when hive numbers approach an upper stable equilibrium size (carrying capacity). However, both the lower critical size and the upper stable size depend on many parameters related to demographic rates and their enhancement by bee sociality. Any environmental factors that increase mortality, decrease recruitment, or interfere with the social moderation of these rates has the effect of exacerbating the Allee effect by increasing the lower critical size and substantially decreasing the upper stable size. As well, the basin of attraction to the upper stable size, defined by the model potential function, becomes narrower and shallower, indicating the loss of resilience as the hive becomes subjected to increased risk of falling below the critical size. Environmental effects of greater severity can cause the two equilibria to merge and the basin of attraction to the upper stable size to disappear, resulting in collapse of the hive from any initial size. The model suggests that multiple proximate causes, among them pesticides, mites, pathogens, and climate change, working singly or in combinations, could trigger hive collapse. This data supplement provides a text file containing 7 scripts written in the R programming language for reproducing Figures 1–7.
Resource Title: S1 R scripts for figures.
File Name: Web Page, url: https://doi.org/10.1371/journal.pone.0150055.s001
Text file containing 7 scripts written in the R programming language for reproducing Figs 1–7 of this article.
Resource Software Recommended: R programming language,url: https://www.r-project.org/
All source data from the referenced paper (Figures 1b and Table 1). 22 Excel files of data from each experimental block of the reactive oxygen species assay, 1 Excel file of the combined data from the bacterial growth enhancement assay, 1 Excel file of the RT-qPCR data.
\nParasitic plants are the primary biotic constraint in many crop production systems. The most agriculturally devastating parasitic plants, including witchweeds (Striga spp.) and broomrapes (Phelipanche and Orobanche spp.), are in the Orobanchaceae family. Phelipanche aegyptiaca is an obligate holoparasite that lacks the capacity for photosynthesis and therefore relies on host parasitization for acquisition of all nutrients. P. aegyptiaca is a broad host range pathogen with the ability to parasitize diverse dicot hosts through attachment and development of a feeding structure known as a haustorium. The mechanisms P. aegyptiaca and other parasitic plants employ to avoid host plant immunity and form successful haustorial attachments are unknown. Here, we demonstrate that P. aegyptiaca actively suppresses salicylic acid-mediated immunity of the host plant Arabidopsis thaliana. We hypothesized that parasitic plants may deploy immunity-suppressing effector proteins through the haustorial interface to subvert host plant immune responses. We devised a pipeline to select and clone 27 candidate secreted effector proteins in P. aegyptiaca and tested these proteins for the potential to suppress known plant immunity pathways. Five candidate effectors suppressed flg22-elicited production of reactive oxygen species when transiently expressed in Nicotiana benthamiana. We propose that two of these candidate effectors function through interfering with pattern triggered immunity using molecular mimicry.
Resource Title: Data from Identification and functional characterization of immunity-suppressing, candidate effector proteins in the parasitic weed Phelipanche aegyptiaca.
File Name: AllSourceDataPaegEffectorPaper.zip
Resource Description: All source data from the referenced paper.
Phenotypic Data\nTwo durum × cultivated emmer recombinant inbred line (RIL) populations were evaluated for grain yield components under field conditions in North Dakota, USA. The BP025 population was developed by crossing Ben (PI 596557), a North Dakota hard amber durum variety, with PI 41025, a cultivated emmer accession collected near Samara, Russia. The BP025 population consists of 200 RILs developed by single seed-descent and was advanced to the F7:8 generation. The RP883 population was developed by crossing the durum line Rusty (PI 639869) with PI 193883, a cultivated emmer wheat accession collected near Shewa, Ethiopia. The RP883 population consists of 190 RILs developed by single seed-descent and was advanced to the F7:8 generation.\nThe two populations were evaluated under field conditions in a total of three seasons for each and were grown in a randomized complete block design (RCBD) with three replicates per season. Plants were grown in hill plots with each plot consisting of 10-15 seeds and considered an experimental unit. The BP025 population was planted and evaluated in 2017, 2018, and 2019. The RP883 population was evaluated in 2018, 2019, and 2020. The 2017, 2018, and 2019 plots were grown at the North Dakota State University field site near Prosper, ND (47.002°N, 97.115°W), and the 2020 plots were grown at the NDSU agronomy seed farm near Casselton, ND (46.880°N, 97.243°W). The BP025 and RP883 populations and parental lines were evaluated for 11 traits including days to heading (DTH), plant height (PHT), the total number of spikelets per spike (SPS), kernels per spike (KPS), grain weight per spike (GWS), thousand kernel weight (TKW), kernel area (KA), kernel width (KW), kernel length (KL), kernel circularity (KC), and kernel length:width ratio (KLW). DTH was measured as the number of days from planting until 50 % of the spikes emerged completely beyond the flag leaf. PHT was measured in centimeters from the base of the plot to the tip of the tallest spike (excluding awns). Eight heads were used for phenotypic evaluations. SPS was counted as the total number of spikelets per spike. KPS, GWS, TKW, KA, KW, KL, KC, and KLW were obtained using a MARVIN grain analyzer (GAT Sensorik GMBH, Neubrandenburg, Germany). For KPS and GWS, the value obtained by the MARVIN for each sample was divided by the number of spikes in that sample to obtain KPS and GWS for data analysis.\nGenotypic Data\nDNA of the BP025 population was extracted and genotyped using the Illumina iSelect 9k wheat SNP array. The genotypic data file consists of the marker names, the chromosome assignments of the markers, the linkage map position of the markers, and the genotypic calls for each marker within each RIL where “A” represents an allele from PI 41025, “B” represents an allele from Ben, and “-“ indicates missing data. The data was used to assemble the linkage-based genetic maps for the 14 durum wheat chromosomes and further used in statistical analysis to identify chromosome regions harboring genes associated with the various phenotypic traits mentioned in the phenotypic file.\nDNA of the RP883 population was extracted and genotyped using the Illumina iSelect 90k wheat SNP array. The genotypic data file consists of the marker names, the chromosome assignments of the markers, the linkage map position of the markers, and the genotypic calls for each marker within each RIL where “A” represents an allele from Rusty, “B” represents an allele from PI 193883, and “-“ indicates missing data. The data was used to assemble the linkage-based genetic maps for the 14 durum wheat chromosomes and further used in statistical analysis to identify chromosome regions harboring genes associated with the various phenotypic traits mentioned in the phenotypic file.
\nResources in this dataset:
\nResource Title: Genotypic data for the durum x cultivated emmer wheat recombinant inbred population BP025\nFile Name: Genotypic data for the durum x cultivated emmer wheat recombinant inbred population BP025.xlsx\nResource Description: The genotypic data file consists of the marker names, the chromosome assignments of the markers, the linkage map position of the markers, and the genotypic calls for each marker within each RIL where “A” represents an allele from PI 41025, “B” represents an allele from Ben, and “-“ indicates missing data.
\nResource Title: Genotypic data for the durum x cultivated emmer wheat recombinant inbred population RP883\nFile Name: Genotypic data for the durum x cultivated emmer wheat recombinant inbred population RP883.xlsx\nResource Description: The genotypic data file consists of the marker names, the chromosome assignments of the markers, the linkage map position of the markers, and the genotypic calls for each marker within each RIL where “A” represents an allele from Rusty, “B” represents an allele from PI 193883, and “-“ indicates missing data.
\nResource Title: Phenotypic data collected from the durum x cultivated emmer wheat recombinant inbred populations BP025 and RP883\nFile Name: Phenotypic data collected from the durum x cultivated emmer wheat recombinant inbred populations BP025 and RP883.xlsx\nResource Description: In the data file, column headings indicate the trait evaluated, the year, and replicate or average of all three replicates. For example, “SPS2017rep1” indicates rep 1 of the spikelets per spike trait collected in the 2017 trial. Sheet 1 consists of the BP025 population data, and sheet 2 consists of the RP883 population data. An entry of ‘NA’ indicates missing data.
\nPhentoypic data: The durum × cultivated emmer recombinant inbred line (RIL) population (referred to as DP527) was evaluated for grain yield components under greenhouse and field conditions in North Dakota, USA. The DP527 population was developed by crossing Divide (PI 642021), a North Dakota hard amber durum variety, with PI 272527, a cultivated emmer accession collected near Pest, Hungary. The DP527 population consisted of 219 RILs developed using the single-seed descent method to the F7 generation and bulked to produce F7:8 RILs. The DP527 population was evaluated under field conditions in a total of three seasons and were grown in a randomized complete block design (RCBD) with three replicates each season. Plants were grown in hill plots, with each plot consisting of 10-15 seeds and considered an experimental unit. The 2017 and 2019 plots were grown at the North Dakota State University (NDSU) field site near Prosper, ND (47.002°N, 97.115°W). The 2020 plots were grown at the NDSU agronomy seed farm near Casselton, ND (46.880°N, 97.243°W). The DP527 population and parental lines were phenotyped for 11 traits including days to heading (DTH), plant height (PHT), total number of spikelets per spike (SPS), kernels per spike (KPS), grain weight per spike (GWS), thousand kernel weight (TKW), kernel area (KA), kernel width (KW), kernel length (KL), kernel circularity (KC), and kernel length:width ratio (KLW). DTH was measured as the number of days from planting until 50% of the spikes emerged completely beyond the flag leaf. PHT was measured from the base of the hill plot to the tip of the highest spike (excluding awns) in the plot in centimeters. Eight heads from each replicate were used for phenotypic evaluations. SPS was counted as the total number of spikelets divided by the number of heads in the sample. KPS, GWS, TKW, KA, KW, KL, KC, and KLW data were obtained using a MARVIN grain analyzer (GAT Sensorik GMBH, Neubrandenburg, Germany). KPS and GWS data from the MARVIN was divided by the number of heads in the sample to obtain an average per wheat head. For the 2019 environment, planting occurred in late May, and by early September about one third of the lines were not mature. Therefore, only DTH, PHT, and SPS were evaluated in the 2019 field season. The DP527 population and parents were evaluated under greenhouse conditions in two greenhouse seasons (2018 and 2019) with two replicates per season. Plants were grown in 15 cm diameter pots in a greenhouse with 16-h photoperiod and a temperature of 21 °C. All plants were grown in a completely randomized design (CRD) with one plant per pot, which was one experimental unit. DTH was measured as the number of days from planting until the emergence of the first spike beyond the flag leaf, and PHT was measured from the base of the plant to the tip of the highest spike in centimeters. Plants were hand harvested and four heads per plant were used for the rest of the phenotypic evaluations, which were measured as described for field environments. In the data file, column headings indicate the trait evaluated, the year, field vs greenhouse, and replicate or average of all three replicates. For example, “SPS2017Frep1” indicates rep 1 of the spikelets per spike trait collected in the 2017 field trial. Sheet 1 consists of the field data, and sheet 2 is the greenhouse data. An entry of ‘NA’ indicates missing data.
\nGenotypic data: DNA of the DP527 population was extracted and genotyped using the Illumina iSelect 90k wheat SNP array. The genotypic data file consists of the chromosome assignments of the markers, the marker names, the linkage map positions of the markers, and the genotypic calls for each marker within each RIL where “1” represents an allele from Divide, “2” represents an allele from PI 272527, and “3” indicates missing data. This data was used to assemble the linkage-based genetic maps for the 14 durum wheat chromosomes and further used in statistical analyses to identify chromosome regions harboring genes associated with the various phenotypic traits mentioned in the phenotypic data file.
\nResources in this dataset:
\nResource Title: Genotypic data for the durum x emmer wheat recombinant inbred population DP527 File Name: DP527 genotypic data.xlsx Resource Description: The genotypic data file consists of the chromosome assignments of the markers, the marker names, the linkage map positions of the markers, and the genotypic calls for each marker within each RIL where “1” represents an allele from Divide, “2” represents an allele from PI 272527, and “3” indicates missing data.
\nResource Title: Phenotypic data collected from the durum x emmer wheat recombinant inbred population DP527 File Name: DP527 phenotypic data.xlsx Resource Description: In the data file, column headings indicate the trait evaluated, the year, field vs greenhouse, and replicate or average of all three replicates. For example, “SPS2017Frep1” indicates rep 1 of the spikelets per spike trait collected in the 2017 field trial. Sheet 1 consists of the field data, and sheet 2 is the greenhouse data. An entry of ‘NA’ indicates missing data.
", "title": "Data from: Identification of stable QTL controlling multiple yield components in a durum × cultivated emmer wheat population under field and greenhouse conditions", "distribution": [ { "@type": "dcat:Distribution", "downloadURL": "https://ndownloader.figshare.com/files/44540516", "format": "xlsx", "mediaType": "application/vnd.openxmlformats-officedocument.spreadsheetml.sheet", "title": "DP527 genotypic data.xlsx" }, { "@type": "dcat:Distribution", "downloadURL": "https://ndownloader.figshare.com/files/44540519", "format": "xlsx", "mediaType": "application/vnd.openxmlformats-officedocument.spreadsheetml.sheet", "title": "DP527 phenotypic data.xlsx" } ], "license": "https://www.usa.gov/publicdomain/label/1.0/", "bureauCode": [ "005:18" ], "modified": "2024-02-20", "publisher": { "@type": "org:Organization", "name": "Agricultural Research Service" }, "accrualPeriodicity": "irregular", "keyword": [ "emmer wheat", "Triticum turgidum subsp. durum", "crop yield", "QTLs", "NP301", "data.gov", "ARS" ], "spatial": "{\"type\": \"MultiPoint\", \"coordinates\": [[-97.24338054657, 46.882126582066], [-97.114949226816, 47.004253009558], [-96.807689667621, 46.893041514963]]}" }, { "identifier": "10.15482/USDA.ADC/1402049", "accessLevel": "public", "contactPoint": { "hasEmail": "mailto:Lindsey.Milbrath@ars.usda.gov", "fn": "Milbrath, Lindsey" }, "programCode": [ "005:040" ], "description": "This dataset includes data on 25 transitions of a matrix demographic model of the invasive species Vincetoxicum nigrum (L.) Moench (black swallow-wort or black dog-strangling vine) and Vincetoxicum rossicum (Kleopow) Barb. (pale swallow-wort or dog-strangling vine) (Apocynaceae, subfamily Asclepiadoideae), two invasive perennial vines in the northeastern U.S.A. and southeastern Canada. The matrix model was developed for projecting population growth rates as a result of changes to lower-level vital rates from biological control although the model is generalizable to any control tactic. Transitions occurred among the five life stages of seeds, seedlings, vegetative juveniles (defined as being in at least their second season of growth), small flowering plants (having 1–2 stems), and large flowering plants (having 3 or more stems). Transition values were calculated using deterministic equations and data from 20 lower-level vital rates collected from 2009-2012 from two open field and two forest understory populations of V. rossicum (43°51’N, 76°17’W; 42°48'N, 76°40'W) and two open field populations of V. nigrum (41°46’N, 73°44’W; 41°18’N, 73°58’W) in New York State. Sites varied in plant densities, soil depth, and light levels (forest populations). Detailed descriptions of vital rate data collection may be found in: Milbrath et al. 2017. Northeastern Naturalist 24(1):37-53. Five replicate sets of transition data obtained from five separate spatial regions of a particular infestation were produced for each of the six populations.
\nNote: Added new excel file of vital rate data on 12/7/2018.
\nResource Title: Matrix model transition data for Vincetoxicum species.
File Name: Matrix_model_transition_data.csv
Resource Description: This data set includes data on 25 transitions of a matrix demographic model of two invasive Vincetoxicum species from six field and forest populations in New York State.
Resource Title: Variable definitions.
File Name: Matrix_model_metadata.csv
Resource Description: Definitions of variables including equations for each transition and definitions of the lower-level vital rates in the equations
Resource Title: Vital Rate definitions.
File Name: Vital_Rate.csv
Resource Description: Vital Rate definitions of lower-level vital rates used in transition equations - to be substituted into the Data Dictionary for full definition of each transition equation.
Resource Title: Data Dictionary.
File Name: Matrix_Model_transition_data_DD.csv
Resource Description: See Vital Rate resource for definitions of lower-level vital rates used in transition equations where noted.
Resource Title: Matrix model vital rate data for Vincetoxicum species.
File Name: Matrix_model_vital rate_data.csv
Resource Description: This data set includes data on 20 lower-level vital rates used in the calculation of transitions of a matrix demographic model of two invasive Vincetoxicum species in New York State as well as definitions of the vital rates.\n\n(File added on 12/7/2018)
Resource Software Recommended: Microsoft Excel,url: https://office.microsoft.com/excel/
Pollen data from the manuscript titled: Identity and diversity of pollens collected by two managed bee species while in blueberry fields for pollination, published in Environmental Entomology. Pollen was collected from honey bee (Apis mellifera) and bumble bee (Bombus impatiens) forager returning to the colony, while in commercial highbush blueberry fields in SW Michigan for crop pollination. Pollen was identified visually using morphological features.
\nFunding also provided by Project GREEEN award GR18-038. Project GREEEN, Michigan’s plant agriculture initiative housed at Michigan State University, is a cooperative effort by plant-based commodity groups and businesses in cooperation with Michigan State University AgBioResearch, Michigan State University Extension and the Michigan Department of Agriculture and Rural Development to advance Michigan’s economy through plant-based agriculture.
", "title": "Data from: Identity and diversity of pollens collected by two managed bee species while in blueberry fields for pollination", "distribution": [ { "@type": "dcat:Distribution", "downloadURL": "https://ndownloader.figshare.com/files/44540828", "format": "xlsx", "mediaType": "application/vnd.openxmlformats-officedocument.spreadsheetml.sheet", "title": "Grahametal_PollenDataforSupp.xlsx" } ], "license": "https://www.usa.gov/publicdomain/label/1.0/", "bureauCode": [ "005:18" ], "modified": "2024-02-15", "publisher": { "@type": "org:Organization", "name": "Agricultural Research Service" }, "keyword": [ "pollen", "pollination", "bumble bees", "honey bees", "blueberry", "NP305", "data.gov", "ARS" ], "spatial": "{\"type\": \"Polygon\", \"coordinates\": [[[-86.698608398438, 41.723027452615], [-86.698608398438, 43.198043267189], [-85.424194335938, 43.198043267189], [-85.424194335938, 41.723027452615], [-86.698608398438, 41.723027452615]]]}" }, { "identifier": "10.15482/USDA.ADC/1528408", "accessLevel": "public", "contactPoint": { "hasEmail": "mailto:william.morrison@usda.gov", "fn": "Morrison, William" }, "programCode": [ "005:040" ], "description": "The aim of the current study was to track the movement of phosphine-resistant and -susceptible adults of the red flour beetle, Tribolium castaneum (Herbst) (Coleoptera: Tenebrionidae), which is a major pest of stored products, after brief exposures to phosphine. Exposures were followed for extended intervals to assess the recovery patterns, and how those patterns are related to known resistance to phosphine. A video-tracking procedure coupled with Ethovision software was used to assess movement after exposure.
\nTwo strains of T. castaneum were used, one susceptible and one resistant to phosphine. The susceptible T. castaneum strain had been maintained in continuous culture without any known exposure to phosphine for >30 years at the USDA-ARS Center for Grain and Animal Health Research (CGAHR), in Manhattan, KS, USA. The phosphine-resistant strain of T. castaneum was collected from wheat in Palmital, Brazil during 1988 (BRZ-5). The rearing media consisted of 95% organic, unbleached, wheat flour plus 5% brewer's yeast. Tribolium castaneum were reared under laboratory conditions of 27.5°C, and 65% relative humidity (R.H.), 14:10 L:D. Adults, of mixed sex and <1 month old, were used in the exposure bioassays.
\nThe protocol that was used in our bioassays to generate phosphine was the Phosphine Tolerance Test (Detia Degesch GmbH, Laudenbach, Germany) with some modifications, as performed by Agrafioti et al. 2021. In particular, the phosphine was generated within a plastic canister (5 L capacity) by adding 50 mL of water to two kit magnesium phosphide pellets. The concentration of phosphine gas inside the plastic canister was determined by using several dosimeter Draeger glass tubes (Draeger 25A, 0–10 000 ppm, Draeger Safety AG & Co., USA). Ten adults of each strain were placed in a plastic syringe of 100 mL with separate syringes used for each species and strain. Then, a specific gas quantity was removed from the canister with the syringe and blended with fresh air to produce a 100-mL volume with a concentration of either 1000 or 3000 ppm and compared to phosphine-free controls (0 ppm). The insects inside the syringe were held at the concentrations above for a 5 min exposure, while additional syringes containing only fresh air and insects were used as negative controls.
\nTo understand the propensity for movement after a 5 min phosphine exposure, a video-tracking procedure was used. After exposure of phosphine-resistant or phosphine-susceptible T. castaneum for 5 min, adult movement was evaluated immediately after exposure or 24 h later under the same environmental chamber conditions as the colonies (see Source Insects), but held without supplemental food. Movement was recorded for 3 h immediately after phosphine exposure but binned into 30 min intervals (e.g., 0–30, 30–60, 60–120, 120–150, and 150–180 min) in order to evaluate how movement varied over the measured time period. Movement was also recorded 24 h after exposure for periods of 1 h (binned by 30 min intervals). Movement measures of adults was tracked in six replicate Petri dishes (90 × 15 mm D:H) with a piece of filter paper (85 mm D, Grade 1, GE Healthcare, Buckinghamshire, United Kingdom) lining the bottom using a network camera (GigE, Basler AG, Ahrenburg, Germany) affixed 80 cm above the dishes. The Petri dishes were backlit using a LED light box (42 × 30 cm W:L, LPB3, Litup, Shenzhen, China) to increase contrast and affixed in place with white foam board with holes specifically cut to size for the petri dishes. Video was streamed to a nearby computer and processed in Ethovision (v. 14.0.1322, Noldus Inc., Leesburg, VA). The software was used to calculate the total distance moved (cm) and the mean instantaneous velocity (cm/s) for each adult. Each adult was considered a replicate and was never used more than once. Only adults classified as alive (normal movement speed and activity), or affected (sluggish movements or on back with legs twitching) were used in this assay. In total, 21–41 replicates were performed per treatment combination immediately after exposure, while 15–30 replicates were performed 24 h after exposure to phosphine. A total of 1525 adults were tested.
\nThere are two time periods (immediately after exposure and 24 h later), and two response variables (total distance moved in cm and mean instantaneous velocity in cm/s). There were three fixed explanatory variables: concentration of phosphine (0, 1000, or 3000 ppm), susceptibility (phosphine-susceptible or phosphine-resistant strain), and time interval (maximally 0–30, 30–60, 60–120, 120–150, and 150–180 min).
\nEthovision Assay\nmorrison_ethal_ethovision_assay_fumigation_agdatacommons.csv
\nTo understand the propensity for movement after a 5 min phosphine exposure, a video-tracking procedure was used. After exposure of phosphine-resistant or phosphine-susceptible T. castaneum for 5 min, adult movement was evaluated immediately after exposure or 24 h later under the same environmental chamber conditions as the colonies (see Source Insects), but held without supplemental food. Movement was recorded for 3 h immediately after phosphine exposure, but binned into 30 min intervals (e.g., 0–30, 30–60, 60–120, 120–150, and 150–180 min) in order to evaluate how movement varied over the measured time period. Movement was also recorded 24 h after exposure for periods of 1 h (binned by 30 min intervals). Movement measures of adults was tracked in six replicate Petri dishes (90 × 15 mm D:H) with a piece of filter paper (85 mm D, Grade 1, GE Healthcare, Buckinghamshire, United Kingdom) lining the bottom using a network camera (GigE, Basler AG, Ahrenburg, Germany) affixed 80 cm above the dishes. The Petri dishes were backlit using a LED light box (42 × 30 cm W:L, LPB3, Litup, Shenzhen, China) to increase contrast and affixed in place with white foam board with holes specifically cut to size for the Petri dishes. Video was streamed to a nearby computer and processed in Ethovision (v. 14.0.1322, Noldus Inc., Leesburg, VA). The software was used to calculate the total distance moved (cm) and the mean instantaneous velocity (cm/s) for each adult. Each adult was considered a replicate and was never used more than once. Only adults classified as alive (normal movement speed and activity), or affected (sluggish movements or on back with legs twitching) were used in this assay. In total, 21–41 replicates were performed per treatment combination immediately after exposure, while 15–30 replicates were performed 24 h after exposure to phosphine. A total of 1525 adults were tested.
Resource Title: Ethovision Assay.
File Name: morrison_etal_ethovision_assay_fumigation_agdatacommons.csv
Resource Software Recommended: Excel,url: https://www.microsoft.com/en-us/microsoft-365/excel
The SHIME® (Simulator of the Human Intestinal Microbial Ecology) was used for in vitro cultivation of the human gut microbiota (3 donors) prior to and following the addition of ivermectin to the system. These additions were performed on bioreactors which had stabilized on a background of media supplemented with either soluble or insoluble fiber or no addition controls. Data collected include 16S rRNA gene amplicon sequencing and short chain fatty acid (SCFA) concentrations.
", "title": "Data from: Impact of Ivermectin on the Gut Microbial Ecosystem", "distribution": [ { "@type": "dcat:Distribution", "downloadURL": "https://ndownloader.figshare.com/files/46439653", "format": "csv", "mediaType": "text/plain", "title": "sample_metadata.csv" }, { "@type": "dcat:Distribution", "downloadURL": "https://ndownloader.figshare.com/files/46440406", "format": "csv", "mediaType": "application/csv", "title": "SCFA_data.csv" } ], "license": "https://creativecommons.org/licenses/by/4.0/", "bureauCode": [ "005:18" ], "modified": "2024-06-25", "publisher": { "@type": "org:Organization", "name": "Agricultural Research Service" }, "keyword": [ "16S rRNA sequencing", "ARS", "NP306", "gut microbiome", "SHIME", "Short Chain Fatty Acids (SCFAs)", "soluble fiber", "insoluble fiber", "ivermectin" ] }, { "identifier": "10.15482/USDA.ADC/24969123.v1", "accessLevel": "public", "contactPoint": { "hasEmail": "mailto:charles.mason@usda.gov", "fn": "Mason, Charles" }, "programCode": [ "005:040" ], "description": "We conducted a fly rearing experiment to characterize diet-induced changes in the microbiome of female Bactrocera dorsalis. In order to explicitly investigate the impacts of larval diet on the microbiome, including potential stable bacterial constituents of B. dorsalis, we performed 16S rRNA sequencing on the gut tissues of teneral female flies reared from 4 different host fruits (guava, mango, papaya, and rose-apple) infested using a single cohort of wild B. dorsalis that emerged from tropical almond (mother flies). We provide processed data and R code for our analysis.
Raw data (.fastq files) for analysis are located at NCBI SRA under accession number PRJNA1061202
", "title": "Data from: Impact of larval food source on the stability of the Bactrocera dorsalis microbiome", "distribution": [ { "@type": "dcat:Distribution", "downloadURL": "https://ndownloader.figshare.com/files/43971576", "format": "zip", "mediaType": "application/zip", "title": "Control Processing and Check.zip" }, { "@type": "dcat:Distribution", "downloadURL": "https://ndownloader.figshare.com/files/43971600", "format": "zip", "mediaType": "application/zip", "title": "Processing and Main Output.zip" }, { "@type": "dcat:Distribution", "downloadURL": "https://ndownloader.figshare.com/files/43971603", "format": "csv", "mediaType": "text/plain", "title": "VkMetaData.csv" }, { "@type": "dcat:Distribution", "downloadURL": "https://ndownloader.figshare.com/files/43971606", "format": "csv", "mediaType": "text/plain", "title": "Vkrarefy.csv" }, { "@type": "dcat:Distribution", "downloadURL": "https://ndownloader.figshare.com/files/43971609", "format": "tsv", "mediaType": "text/plain", "title": "OccAbunCore.tsv" }, { "@type": "dcat:Distribution", "downloadURL": "https://ndownloader.figshare.com/files/43971615", "format": "R", "mediaType": "text/plain", "title": "SloanNeutralModeling_VK.R" }, { "@type": "dcat:Distribution", "downloadURL": "https://ndownloader.figshare.com/files/43971684", "format": "R", "mediaType": "text/plain", "title": "NMDSandADONIScode.R" }, { "@type": "dcat:Distribution", "downloadURL": "https://ndownloader.figshare.com/files/43971690", "format": "R", "mediaType": "text/plain", "title": "RelativeAbundancePlots_VK.R" }, { "@type": "dcat:Distribution", "downloadURL": "https://ndownloader.figshare.com/files/43971687", "format": "R", "mediaType": "text/plain", "title": "AlphaDiversity_VK.R" }, { "@type": "dcat:Distribution", "downloadURL": "https://ndownloader.figshare.com/files/43971681", "format": "R", "mediaType": "text/plain", "title": "IndividualOTUKWtest_VK.R" } ], "license": "https://creativecommons.org/licenses/by/4.0/", "bureauCode": [ "005:18" ], "modified": "2024-03-01", "publisher": { "@type": "org:Organization", "name": "Agricultural Research Service" }, "keyword": [ "microbiome", "insect", "gut", "reproduction", "16S amplicon analysis code" ] }, { "identifier": "10.15482/USDA.ADC/1528344", "accessLevel": "public", "contactPoint": { "hasEmail": "mailto:Matthew.R.Beck@usda.gov", "fn": "Beck, Matthew" }, "programCode": [ "005:040" ], "description": "This dataset was used in the generation of the manuscript titled: Implied climate warming contributions of enteric methane emissions are dependent on the estimate source and accounting methodology (DOI: 10.15232/aas.2022-02344). The objectives of this manuscript were to (1) demonstrate the differences in enteric methane emission estimates between 2 reporting entities (FAO and EPA) and to (2) demonstrate how the implied contribution to climate warming caused by enteric methane is dependent on accounting methodologies. The accounting methodologies explored were the conventional global warming potential (GWP) based on a 100-year time horizon (GWP100) or the newer GWP. The GWP methodology was developed because GWP100 fails to capture the short atmospheric lifespan of CH4, which is only 12-years (EPA, 2021a). The equations to calculate GWP100 (Equation 1; IPCC, 2013) and GWP* (Equation 2; Smith et al., 2021) are:
\nCH4, Mt CO2 equivalence = 28 × CH4(t) [Equation 1];\nCH4, Mt CO2-we = (4.53 × CH4(t) – 4.25 × CH4(t–20)) × 28 [Equation 2].
\nWhere CH4(t) is the CH4 emitted in million metric tons (Mt) at year t and CH4(t-20) is the amount of CH4 emitted in Mt 20-years prior.\nData was obtained from publicly available sources — the USDA-NASS biannual reports on cow and calf inventory in January and June (USDA-NASS, 2022), the EPA website (EPA, 2021b), and FAO from the FAOSTAT website (FAO, 2022). The data provided herein is an excel spreadsheet (.xlsx format) and contains 5 different sheets. Sheet titled \"Descriptions\" describe what each column names contain for the data-containing sheets.
\nReferences:\nEPA (US Environmental Protection Agency). 2021a. Inventory of US Greenhouse Gas Emissions and Sinks 1990–2019. US Environmental Protection Agency.
\nEPA (US Environmental Protection Agency). 2021b. Inventory of US Greenhouse Gas Emissions and Sinks: 1990–2019. Accessed May 18, 2022. https://www.epa.gov/ghgemissions/inventory-us-greenhouse-gas-emissions-and-sinks-1990-2019.
\nFAO (Food and Agriculture Organization). 2022. FAOSTAT Emissions Totals. Accessed: May 18, 2022. https://www.fao.org/faostat/en/#data/GT.
\nIPCC (Intergovernmental Panel on Climate Change). 2013. Climate Change 2013: The Physical Science Basis. Contribution of Working Group I to the Fifth Assessment Report of the Intergovernmental Panel on Climate Change. T. F. Stocker, D. Qin, G. K. Plattner, M. Tignor, S. K. Allen, J. Boschung, A. Nauels, Y. Xia, V. Bex, and P. M. Midgley, ed. Cambridge University Press.
\nNASS (National Agricultural Statistics Service). 2022. Cattle NASS. Accessed May 18, 2022. https://usda.library.cornell.edu/concern/publications/h702q636h?locale=en.
\nSmith, M. A., M. Cain, and M. R. Allen. 2021. Further improvement of warming-equivalent emissions calculation. npj Clim. Atmos. Sci. 4:1–3. https://doi.org/10.1038/s41612-021-00169-8.
\nResource Title: Data from: Implied climate warming contributions of enteric methane emissions are dependent on the estimate source and accounting methodology.
File Name: Enteric_CH4_emission_estimates_scenarios.xlsx
Data files for manuscript titled \"Importance of color for artificial clay caterpillars as sentinel prey in maize, soybean, and prairie\".
\nMetadata is contained within excel file that describes all variables for each tab.
\nAbstract from paper:\nThe use of artificial clay caterpillars to measure predation pressure under real field conditions is one method that has garnered recent support for quantifying ecosystem services that beneficial insects provide. Here, we focus on color and ask whether it is an important variable that should be considered in studies using clay caterpillars as sentinel prey. We deployed a total of 1920 brown, cream, green, gray, terracotta, and white clay caterpillars onto maize, soybean, and prairie plants to test if lighter colored caterpillars will be attacked and retrieved more than caterpillars with darker colors. As hypothesized, color was a significant predictor with green and terracotta caterpillars performing best, whereas brown and gray caterpillars performed the worst. Interestingly, clay caterpillars were also attacked proportionally to the number of insects in the surrounding habitat. Combined, we suggest artificial clay caterpillars could be useful for rapid ecosystem function assessments, but only when their color is considered.
Resource Title: Data for \"Importance of color for artificial clay caterpillars as sentinel prey in maize, soybean, and prairie\".
File Name: Sentinal Prey - Final Data File.xlsx
Resource Description: Excel file with 3 tabs: Metadata, predation and abundance, and predation and color.
Soybean aphid (Aphis glycines Matsumura; SA) is a major invasive pest of soybean [Glycine max (L.) Merr.] in northern production regions of North America. Although insecticides are currently the main method for controlling this pest, SA-resistant cultivars are being developed to sustainably manage SA in the future. The viability of SA-resistant cultivars may depend on identifying a diverse set of resistance genes from screening various germplasm sources, including wild soybean (Glycine soja Siebold and Zucc.), the progenitor of cultivated soybean. Data consisted of infestation ratings generated for a total of 337 distinct plant introduction lines of wild soybean that were exposed to avirulent SA biotype 1 for 14 d in 25 separate tests. Individual plants of the test lines were given a common rating by two researchers, based on a rating scale that progressed from 1=0 to 50, 2=51 to 100, 3=101 to 150, 4=151 to 200, 5=201 to 250, and 6 with >250 SA per test plant. Public dissemination of this dataset will allow for further analyses and evaluation of resistance among the test lines.
Resource Title: Infestation ratings for individual plants of various wild soybean lines.
File Name: Web Page, url: https://ars.els-cdn.com/content/image/1-s2.0-S2352340917304432-mmc2.xlsx
MS Excel spreadsheet showing infestation ratings for individual plants of 337 distinct plant introduction (PI) wild soybean lines following 14 d of exposure to SA.
Resource Software Recommended: Microsoft Excel,url: https://office.microsoft.com/excel/
Grasshoppers are integral parts of rangeland ecosystems but also have the potential to reach population densities high enough (outbreaks) to cause serious economic damage from forage loss and affect adjacent crops. The objective of this study was to investigate the efficacy of treating grasshopper population hotspots with a liquid insecticide using a remotely piloted aerial application system (RPAAS), as opposed to fixed-wing aircraft, which is the most common method currently in use. A liquid insecticide, Sevin XLR PLUS (containing carbaryl), was applied on replicated 4.05-hectare (10-acre) plots with an RPAAS on a ranch in New Mexico. Our results demonstrated that Sevin XLR PLUS significantly suppressed grasshopper populations over a 14-day period (normalized population reduction was 79.11 ± 8.35% SEM) and quite rapidly (mostly by day 3) compared to untreated controls. These results are comparable to those achieved with fixed-wing aircraft. The RPAAS covered the whole test area in a single flight in approximately 5 min, making these population hotspot treatment applications relatively rapid, potentially more cost-effective, and more targeted in comparison to fixed-wing aircraft. Before adoption as an application method option, further research is recommended on using an RPAAS to cover larger areas in combination with using diflubenzuron-based insecticides, which are often preferred.
", "title": "Data from: Insecticidal Management of Rangeland Grasshoppers Using Remotely Piloted Aerial Application System", "distribution": [ { "@type": "dcat:Distribution", "downloadURL": "https://ndownloader.figshare.com/files/44540531", "format": "xlsx", "mediaType": "application/vnd.openxmlformats-officedocument.spreadsheetml.sheet", "title": "Meteorological_Data.xlsx" }, { "@type": "dcat:Distribution", "downloadURL": "https://ndownloader.figshare.com/files/44540534", "format": "pdf", "mediaType": "application/pdf", "title": "Droplet Scan Test Results.pdf" } ], "license": "https://www.usa.gov/publicdomain/label/1.0/", "bureauCode": [ "005:18" ], "modified": "2024-02-20", "publisher": { "@type": "org:Organization", "name": "Agricultural Research Service" }, "keyword": [ "Rangeland Grasshoppers", "Mormon Crickets", "UAV", "UAS", "RPAS", "RPAAS", "Sevin XLR PLUS", "NP305", "data.gov", "ARS" ], "spatial": "{\"type\": \"Polygon\", \"coordinates\": [[[-109.05761741102, 31.45873412907], [-109.05761741102, 37.024849061546], [-102.72949241102, 37.024849061546], [-102.72949241102, 31.45873412907], [-109.05761741102, 31.45873412907]]]}" }, { "identifier": "10.15482/USDA.ADC/1528716", "accessLevel": "public", "contactPoint": { "hasEmail": "mailto:harry.schomberg@usda.gov", "fn": "Schomberg, Harry" }, "programCode": [ "005:040" ], "description": "Cover crop (CC) growth and biomass production in the Mid-Atlantic region can be limited following double crop soybean due slow establishment related cool fall temperatures. Interseeding CC in summer before soybean canopy closure can improve establishment and spring biomass production. This practice can also increase the diversity of available CC species, reduce weed pressure and reduce nutrient losses. This study evaluates the effects of interseeded CC on soil temperature, soil water balances, evapotranspiration, infiltration, and yield and water use efficiency of corn (Zea mays L.) phase, following soybean (Glycine max L.) The study was conducted at the USDA Beltsville Agricultural Research Center, Beltsville, MD from 2017 through 2020. The cropping systems under study were primarily sequences of corn-soybean-wheat (Triticum aestivum L.)-double crop soybean all planted with no-tillage management. No cover crops (NC) were grown prior to corn in Systems 3 and 4. In System 5, a cover crop (CC) mixture of rye (Secale cereale L.)-hairy vetch (Vicia villosa Roth)-crimson clover (Trifolium incarnatum L.) was interseeded into DCS prior to soybean canopy closure. In System 6, red clover (rc, Trifolium pratense L.) was interseeded into wheat in March and rye was planted into rc after wheat harvest in July.
\nResources in this dataset:
\nResource Title: CCSP 2023 AGWAT Metadata\nFile Name: CCSP 2023 AGWAT Metadata.docx\nDescription: Meta information describing data collection procedures, estimation of ET and infiltration, and methods used to replace sensor data having errors.
\nResource Title: CCSP Experiment Setup Info Tables 1 Through 4\nFile Name: CCSP Experiment Setup Info Tables 1 Through 4.xlsx\nDescription: File contains data from Tables 1 through 4 of the manuscript and a schematic of the crop rotation; Table 1 describes the four cropping systems; Table 2 provides corn planting and harvest dates, cumulative growing degree days (CumGDD oC), rainfall, and period of soil water measurement for the growing season; Table 3 describes the soil water sensors and soil depths measured; and Table 4 gives 10 year average monthly air temperature and rainfall (2011 to 2020). Cover crop varieties are included in an additional worksheet. [Note: file updated to include cover crop varieties worksheet on 07/21/2023]
\nResource Title: CCSP Corn Yield Cover Crop Biomass\nFile Name: CCSP Corn Yield Cover Crop Biomass.xlsx\nDescription: Cover crop biomass (kg/ha) and corn yields (kg/ha) for 2017 through 2020 are provided at the replication and cropping system treatment level. Details about biomass sampling and corn harvest are contained in the manuscript.
\nResource Title: CCSP ET Calc Input Output Data And Meta Info\nFile Name: CCSP ET Calc Input Output Data And Meta Info.xlsx\nDescription: Weather data used to estimate daily evapotranspiration using ETCalc, an online calculator (Danielescu, 2021 and 2022) [ https://etcalc.hydrotools.tech/pageMain.php]. The input and output data are provided in separate tabs of the excel file. The first tab provides additional meta information.
\nResource Title: CCSP Weather 2017-2020 Rain And Air Temp For GDD\nFile Name: CCSP Weather 2017-2020 Rain And Air Temp For GDD.xlsx\nDescription: Daily data collected from a nearby weather station used to calculate 10-year average rainfall and temperature and used to calculate growing degree days in each growing season. Growing degree day calculations are presented in tabs for each year.
\nResource Title: CCSP Soil Temperature And Soil Water By Depth\nFile Name: Volumetric soil water content (m3/m3) (VWC) and soil temperature data collected at 4 depths in each plot. VWC was converted to mm water per depth and summed for the soil profile (0 to 862 mm). Measurements were averaged to daily values. Soil water storage and soil temperature data are given for each replication, cropping system treatment, and horizon depth in separate tabs for each year.
\nResource Title: CCSP ET Calc Input Output Data And Meta Info.
File Name: CCSP ET Calc Input Output Data and Meta Info.xlsx
Resource Description: Weather data used as inputs to ETCalc, an online evapotranspiration calculator (Danielescu, 2021 and 2022). The online calculator is at https://etcalc.hydrotools.tech/pageMain.php. Daily potential evapotranspiration (PET) was estimated based on the Penman Montieth method. The input and output data along with meta data to run the calculator are provided in separate tabs of the excel file. The first tab provides additional meta information.
Resource Title: CCSP Corn Yield Cover Crop Biomass.
File Name: CCSP Corn Yield Cover Crop Biomass.xlsx
Resource Description: Cover crop biomass (kg/ha) prior to corn planting and corn yields (kg/ha) data for 2017 through 2020 are provided at the replication and treatment level. Cover crop biomass sampling details are in the manuscript. Corn yields were collected via a yield monitor on the crop combine. Yields were adjusted to standard moisture content of 15.5 percent.
Resource Title: CCSP Soil Temperature And Soil Water By Depth.
File Name: CCSP Soil Temperature And Soil Water By Depth.xlsx
Resource Description: Volumetric soil water content (m3/m3) (VWC) and soil temperature data collected at 4 depths in each plot. VWC was converted to mm water per depth and summed for the soil profile (0 to 862 mm). Measurements were averaged to daily values. Soil water storage and soil temperature data are given for each replication, cropping system treatment, and horizon depth in separate tabs for each year. \n
Resource Title: CCSP Weather 2017-2020 Rain And Air Temp For GDD.
File Name: CCSP Weather 2017-2020 Rain And Air Temp For GDD.xlsx
Resource Description: Daily data collected from a nearby weather station used to calculate 10-year average rainfall and temperature and used to calculate growing degree days in each growing season. Growing degree day calculations are presented in tabs for each year.
\nResource Title: CCSP 2023 AGWAT Metadata.
File Name: CCSP 2023 AGWAT Metadata.docx
Resource Description: Word document of meta information describing data collection procedures, method of estimating ET and infiltration, and description of error handling for the soil water sensor data.
Resource Title: CCSP Experiment Setup Info Tables 1 Through 4.
File Name: CCSP Experiment Setup Info Tables 1 Through 4.xlsx
Resource Description: File contains data from Tables 1 through 4 of the manuscript and a schematic of the crop rotation; Table 1 describes the four cropping systems; Table 2 provides corn planting and harvest dates, cumulative growing degree days (CumGDD oC), rainfall, and period of soil water measurement for the growing season; Table 3 describes the soil water sensors and soil depths measured; and Table 4 gives 10 year average monthly air temperature and rainfall (2011 to 2020). Cover crop varieties are included in an additional worksheet. [Note: file updated to include cover crop varieties worksheet on 07/21/2023]
The dataset includes clinical data from an experimental swine and ferret challenge and transmission study with 3 strains of swine H1 influenza A virus. Data are presented in two spreadsheets, one for pigs and one for ferrets.
Resource Title: Interspecies transmission from pigs to ferrets of antigenically distinct swine H1 influenza A viruses with loss in reactivity to human vaccine virus antisera as measures of relative zoonotic risk.
File Name: Kimble swine and ferret data.xlsx
This dataset includes data on the chemical, physical and biological traits of weed seeds of 11 arable weed species in relation to the persistence of these seeds in the soil seedbank within a common-garden burial study. We performed a common garden weed seed burial study at the University of Illinois Crop Sciences Research and Education Center in Savoy, IL (40.048757 N, -88.237206 E), from October 2007 through October 2012. The experiment was arranged in a split-plot design with four replications of the sub-plot variable species nested within main plot variable burial duration (1 to 5 years). Eleven annual weed species were included, spanning a broad range of seed sizes, dormancy types and seedbank persistence: Abutilon theophrasti Medik (velvetleaf), Ambrosia trifida L. (giant ragweed), Amaranthus tuberculatus [Moq]. Sauer (common waterhemp), Bassia scoparia [L.] A. J. Scott (kochia), Chenopodium album L. (common lambsquarters), Ipomoea hederacea Jacq. (ivyleaf morningglory), Panicum miliaceum L. (wild proso millet), Polygonum pensylvanicum L. (Pennsylvania smartweed), Setaria faberi Herrm. (giant foxtail), Setaria pumila [Poir] Roem. (yellow foxtail) and Thlaspi arvense L. (field pennycress).
\nWeed seeds were collected in 2007 from the experimental site and adjoining fields by gently shaking mature inflorescences over a bucket and bulking seeds from multiple plants to form a composite sample for each species. Light seed were removed by processing with a seed cleaner, after which seeds were stored in air tight containers at 4C until burial. Immediately prior to burial, seed viability was assayed with tetrazolium. Burial units consisted of 100 seeds of a given species placed in the bottom of a 2.5 cm deep square tray, 10 cm on a side, made of 0.5 mm stainless steel wire mesh. Tray bottoms were permeable to water, but prevented seeds from escaping. Trays were filled 2 cm deep with soil from a nearby grass sward that had not been cropped for over 30 years, to avoid contamination with weed seeds (verified by elutriating samples of this soil). Within each experimental unit, we excavated a 2 cm deep rectangle 30 cm wide by 40 cm long, and placed trays for each of the 11 species side by side into this depression so that their soil surface was flush with the surrounding soil, leaving a 0.5 cm wire mesh lip exposed in each tray. Each experimental unit was covered by wire mesh with 1 cm square openings to permit access to invertebrate granivores. The study plot was fenced to exclude large vertebrates.
\nSeedling emergence was recorded weekly from March through October every year. Seed trays for a given burial duration treatment were removed in October of the assigned year and seeds recovered via elutriation (Wiles et al. 1996). Recovered seeds were incubated under oscillating temperature conditions (15 C/dark for 10 hr, 25 C/light for 14 hr) for 2 weeks and germination recorded. Ungerminated seeds assessed as viable through tetrazolium testing were considered dormant.
\nSEED TRAITS\nWe measured chemical and physical seed traits on freshly collected seeds following the methods outlined in Tiansawat et al. (2014), using multiple measures of each trait class to provide functional redundancy and allow them to be treated as latent or manifest variables during multivariate analyses. For the chemical defense trait class we measured ortho-dihydroxyphenol (o-DHP) concentration, abundance and diversity of phenolic compounds quantified with high performance liquid chromatography, impact of seed homogenate on brine shrimp survival, and seed removal by invertebrate granivores. Physical traits measured included seed coat thickness, seed mass, and seed coat rupture force. Pairwise interspecific phylogenetic distances were quantified using the phydist subroutine of Phylocom 4.2 (www.phylodiversity.net). Also included is a list of references from the associated literature review.
\nResource Title: Weed seed defense traits.
File Name: Davis et al 2016_Seed Persistence.xlsx
Resource Description: This data set contains information on weed seed chemical, biological and physical traits in relation to weed seed persistence in the soil seedbank, as measured through a common garden burial study in Urbana, IL, from 2007 through 2012.
Resource Title: Data Dictionary.
File Name: DataDictionary.csv
Resource Description: Describes variables and units for each worksheet: Seed Persistence; Mean Seed Persistence vs. Traits; Literature Review of Dormancy vs. Persistance.
Using the SHIME (an in vitro simulator of the human gut microbiome) we studied changes in the gut metabolome that occurred in response to the administration of the Laticaseibacillus rhamnosus strain GG (LGG). Using fecal inoculum from three healthy human donors, reactors were established representing three colonic regions and both the luminal and mucosal microbiome in those regions. Samples were collected before, during, and after inoculation of the reactors with LGG.
\nThis dataset includes untargeted metabolomics data. Shallow shotgun metagenomic sequencing data can be found in the NCBI Sequence Read Archive associated with BioProject PRJNA893635 : https://www.ncbi.nlm.nih.gov/bioproject/PRJNA893635.
\nResources in this dataset:
\nResource Title: Batch normalized metabolite peak area data\nFile Name: metabolites_individual_samples_batch_norm_non_imputed.csv
\nResource Title: Sample metadata\nFile Name: LGG2_metadata.csv
\n[Note: This version supersedes version 1: https://doi.org/10.15482/USDA.ADC/1520889\nChanges in version 2:
\nDatasets were renamed and renumbered in accordance to article revisions, and some changes made (see below for details):
\nDescription
\nThis collection contains supplementary data for the manuscript \"Legacy genetics of Arachis cardenasii in the peanut crop shows profound benefits of international seed exchange,\" which describes the impact of alleles from a wild relative of peanut, Arachis cardenasii, through analysis of those alleles across cultivars and breeding lines across many countries. The initial challenging cross, between tetraploid cultivated peanut (Arachis hypogaea) and the diploid species A. cardenasii, was carried out in the late 1960s. Subsequent work produce a tetraploid line that contained introgressed regions from A. cardenasii. Those chromosomal regions, several containing important resistance genes, were used in numerous breeding lines. The genetic legacy from A. cardenasii is documented in the files in this collection. The information includes genotyping data across peanut cultivars and breeding lines, generated through both genotyping arrays (\"SNP chips\") and whole-genome sequencing. Information in this collection also includes data related to impact of A. cardenasii on disease- and pest resistance in modern peanut varieties.
Resource Title: Data dictionary.
File Name: data_dictionary.txt
Resource Title: Dataset S1: Axiom Arachis genotyping of 707 polymorphisms in 256 wild Arachis accessions.
File Name: DataSetS1-CardAlleles-iii.xlsx
Resource Description: Dataset S1: Axiom Arachis genotyping of 707 polymorphisms in 256 wild Arachis accessions representing almost all botanical collections of the 31 described diploid species in the botanical section Arachis (including all 19 accessions of A. cardenasii), and 383 A. hypogaea of pure pedigree from the US mini Core collection.
Resource Title: Dataset S2: Introgressions in breeding lines and cultivars.
File Name: DataSetS2-WGSIntrogression.tar.gz
Resource Description: Genotype data (VCF format tsv files, compressed), for six breeding lines and cultivars: Bailey2, GPBD4, IAC322, ICGV86855, Sutherland, VG9514; and 12 control peanuts of pure pedigree. Alleles were determined using Whole Genome Sequencing. The file Acard-diag_bases.txt (tsv, compressed) lists the full set of 2,337,866 A. cardenasii GKP 10017 diagnostic bases (SNPs) relative to pure pedigree A. hypogaea. Positions are relative to the genome of A. cardenasii GKP 10017.
Resource Title: Dataset S3: Worldwide genotypes with A. cardenasii GKP 10017 introgressions.
File Name: DataSetS3-WorldwideGenotypes-ii.xlsx
Resource Description: Single nucleotide polymorphism genotyping of 118 DNA samples from peanut lines and cultivars from twelve countries from around the world. Most have introgressed chromosome segments from the wild species accession Arachis cardenasii GKP 10017, a few are pure pedigree cultivated peanuts for controls.
Resource Title: Dataset S4: Lineages and field data for lines containing Arachis cardenasii GKP 10017 genetic material..
File Name: DataSetS4-LineagesFieldData-iv.xlsx
Resource Description: Catalog of accessions and lines containing A. cardenasii genetic material, including pedigrees, agronomic traits, selection timelines, selected field data, and references.
Resource Title: Dataset S5: Genetic fingerprint data.
File Name: DataSetS5-Fingerprints.tar.gz
Resource Description: Genetic fingerprint (marker) data for 45 accessions. Archive contains 10 spreadsheets with whole genome sequence counts for A and B genome alleles.
Resource Title: Dataset S6: Analysis of introgression regions in progeny of cultivars Middleton and Sutherland.
File Name: DataSetS6-Austp183.xlsx
Resource Description: Excel file contains data of 270 Recombinant Inbred Lines developed from a cross of Arachis hypogaea cv. Middleton by cv. Sutherland - Sutherland having A. cardenasii introgressions that provide foliar disease resistance. Middleton having the preferred agronomic profile.
The Male Annihilation Technique (also termed the Male Attraction Technique; “MAT”) is often used to eradicate pestiferous tephritid fruit flies, such as Bactrocera dorsalis (Hendel). MAT involves the application of male-specific attractants combined with an insecticide in spots or stations across an area to reduce the male population to such a low level that suppression or eradication is achieved. Currently, implementations of MAT in California and Florida targeting B. dorsalis utilize the male attractant methyl eugenol (ME) accompanied with a toxicant, such as spinosad, mixed into a waxy, inert emulsion STATIC ME (termed here “SPLAT-MAT-ME”). While highly effective against ME-responding species, such applications are expensive owing largely to the high cost of the carrier matrix and labor for application. Until recently the accepted protocol called for the application of approximately 230 SPLAT-MAT-ME spots per km2; however, findings from Hawaii suggest a lower density may actually be more effective. The present study adopted the methods of that earlier work and estimated kill rates of released B. dorsalis under varying spot densities in areas of California and Florida that have had recent incursions of this invasive species. Specifically, we directly compared trap captures of sterilized marked B. dorsalis males released in different plots under three experimental SPLAT-MAT-ME densities (50, 110, and 230 per km2) in Huntington Beach, CA; Anaheim, CA; and Sarasota-Bradenton, FL. The plots with a density of 110 sites per km2 had a significantly higher recapture proportion than plots with 50 or 230 sites per km2. This result suggests that large amounts of male attractant may reduce the ability of males to locate the source of the odor, thus lowering kill rates and the effectiveness of eradication efforts. Eradication programs would directly benefit from reduced costs and improved eradication effectiveness by reducing the application density of SPLAT-MAT-ME.
\nResources in this dataset:
\nResource Title: Longitudes and latitudes of experimental plots and release transects\nFile Name: 2023-09_plots-transects-geodata.csv\nResource Description: Areas where release recapture experiments were conducted.
\nResource Title: Longitudes and latitudes of traps used in experiments (LPDs)\nFile Name: 2023-10_traps-locations.xlsx
\nResource Title: Number of flies caught in each trap at each check\nFile Name: 2023-10_trap-catch.xlsx
\nResource Title: Locations of traps, release transects, plots\nFile Name: 2023-10_MAT-CA-FL.kml
\nResource Title: Numbers of flies left in containers after release\nFile Name: 2023-10_remaining-in-release-containers.xlsx
\nResource Title: Quality Control data for each cohort used in releases\nFile Name: 2023-10_quality-control.xlsx
\nResource Title: Metadata\nFile Name: metadata.txt
\nExperimental Insects.
The field colonies of T. castaneum, R. dominica and the rice weevil, Sitophilus oryzae (Coleoptera: Curculionidae), were used on this study. For all species, four to eight-week-old adults were used. Cultures of strains of T. castaneum (collected from eastern KS), R. dominica (from Pottawatomie County, KS), and S. oryzae (from eastern KS) have been maintained in the laboratory since 2012, 2019, and 2012 respectively at the USDA Center for Grain Animal Health Research in Manhattan, KS. Tribolium castaneum was reared on a mixture of 95% unbleached, organic flour and 5% brewer’s yeast, while R. dominica and S. oryzae were reared on tempered organic whole wheat. The colonies were maintained at 25–27.5°C, 65% RH, and 14:10 or 16:8 (L:D) h photoperiod.
Treatments
In each grain bin, a total of 60, 7.57-L (2 gal.) capacity buckets (hereafter, miniature silos or silos) were each filled with 500 g of clean wheat (20% cracked grain, containing 10.8% grain moisture) and assigned to the floor of a grain bin. Each of the miniature silos had holes drilled every ~7 cm around the circumference of the base and a 12.7 × 12.7 cm square cut out of the lid. The entire outer surface of the miniature silos was roughened up with sandpaper to provide an easy climbing substrate for insects. Twenty miniature silos employed Carifend® insecticide-incorporated netting (0.34% alpha-cypermethrin at 163.2 mg/m2 active ingredient (a.i.), 40 deniers, 100 holes/cm2; BASF, Ludwigshafen, Germany) covering the holes and gaps attached inside with a hot glue gun, while twenty of the miniature silos used control netting (physical identical with Carifend® net without insecticide; Casa Collection, Mesh White, 1721-9668; Jo-Ann’s, Hudson, OH, USA), and the final twenty miniature silos lacked netting completely.
A total of three different 110-MT grain bins were used in Manhattan, KS. Each grain bin was divided into quarters and in each, we randomly placed 15 miniature silos with 5 silos of each treatment represented in each quadrant. On a monthly basis from June–September 2022 and the experiment was completely replicated from June–October 2023, while unmanaged stored product insect populations were supplemented by additional releases of insects. In each quarter of the grain bin, a release point for insects was randomly chosen, and 25 each of T. castaneum, R. dominica, and S. oryzae were released on a monthly basis. Thus, a total of 300 T. castaneum, R. dominica, and S. oryzae were released each month in each grain bin. Dataloggers (UX100-011A Hobo Temp/RH logger, Onset, Bourne, MA, USA) were also placed in inside the grain of a miniature silos in each quadrant of the grain bin and were set up to record the temperature and RH every 10 min from June–September. Dataloggers were placed on the top of grain inside miniature silos (hereafter, inside grain). Two additional data loggers were also placed on the north- and south-facing walls of the grain bins at a height of 150 cm (hereafter, inside bin).
Sampling Procedure
Monthly samples of 100 g of grain were taken from July–October in 2022 and 2023 and coincided with additional releases of insects as described above. During each monthly sample, 100 g were taken from four miniature silos belonging to each treatment (e.g., BASF Carifend® LLIN, positive control, and negative control), which were scooped in plastic containers (5 × 11 cm D: H) to a pre-measured fill line demarcating 100 g. Samples were added to pre-labeled Ziplock bags and immediately brought back to the laboratory. Samples were sieved using two sieves (#10 sieve, 2.0 × 2.0 mm mesh, W.S. Tyler, Mentor, OH; and #20 sieve, 0.841 × 0.841 mm mesh; W.S. Tyler, Cleveland, OH) and the types of insect species dispersing into the grain, the number of individuals belonging to each species, and their life stages were recorded. The health condition of each adult was classified as alive, affected, or dead (according to Morrison et al. 2018). Grain was held in individual containers (5 × 11 cm D: H) for an additional 6 wk at 27.5 °C, 65% RH, and 16:8 L:D in an environmental chamber (Percival, Perry, IA, USA) to determine progeny production. Grain quality measures were also assessed at initial collection, including the number of insect-damaged kernels (IDK), weight of damaged and undamaged grain, and mold rating (using the procedure developed in Van Winkle et al. 2022).
Prior to the study, half of the miniature silos in a bin were randomly assigned to a possible phosphine fumigation management treatment if above the threshold, whereas half remained unfumigated regardless of insect pressure. For the fumigation management treatment, fumigation was triggered when the number of IDK and/or the number of insects found in the equivalent of 100 g was at the Federal Grain Inspection Service (FGIS) specified tolerances of two live insects, or conservatively 16 IDKs, which is half the tolerance for when a lot is considered “sample grade” or unfit for human consumption by USDA .
Phosphine Fumigation Process
Once insect infestation levels triggered a fumigation event, the affected miniature silos were moved to a dedicated 110-MT fumigation-only grain bin. The fumigation treatments were performed in 55-gallon (~208 L) barrels which were filled with 9 miniature silos (at maximum) containing sample wheat. Miniature silos were carefully and individually hand-swaddled with a clear plastic bag to ensure no loss of grain in transit between experimental location and fumigation bin. Aluminum phosphide pellets (Deitia Degesch AG, Laudenbach, Germany) were used. For each barrel, two pellets (0.6g per pellet) were placed onto a disposable plate holding a damp paper towel. A plate was set inside each barrel and the barrels were covered with lids that contained rubber gaskets and a clamping ring which was used to hold the lid tightly to the top of the barrel. The lids had several ports which were used for gas sampling, input-air, and exhaust-air during ventilation. The phosphine concentration inside each sealed barrel reached ~1000–1200 ppm after 8 hours and was maintained for ~ 4 days. The average concentration * time (CT) product values were > 100,000 ppm*hr, which is considered a very strong fumigation and able to kill phosphine resistant species (Brabec et al, 2021). The phosphine concentration and temperature were monitored in each barrel with wifi phosphine sensors (Centaur Analytics, Ventura, CA). The wifi sensors collected data every 1-3 hours over the 4-day fumigation period. A control sensor was included that was located directly adjacent to the barrels to ensure there was no leakage. In addition, phosphine concentration measurements were taken ~daily with a hand-held meter (X-am 5000 multi-gas detector, Dräger, Lübeck, Germany). The Drager hand-held meter was used as a calibration reference for the wifi phosphine sensors. After the 4-day fumigation treatment, each barrel was carefully vented by flushing with the fresh air for ~20 min to purge the phosphine gas from each barrel and directed out through a small chimney pipe. Then, the lid could safely be removed and the experimental buckets unloaded.
Insect Drop Test
A testing arena was constructed using a 34.6 × 21 × 12.4 cm (L×W×H) plastic container (Sterilite®, Sterilite Corporation, Townsend, MA) with a 9 cm hole drilled in the center of the container. The hole was covered on the bottom of the container with Carifend® LLIN. The netting was affixed to the bottom of container using adhesive caulking (DAP Kwik Seal, DAP Products Inc., Baltimore, MD) and a plastic funnel was attached below the netting. The top 3-5 cm of the container was coated with Floun® (polytetrafluoroethylene, Sigma-Aldrich Co., St. Louis, MO) and the top of the lid was fitted with 3 cm hole coved with a fine mesh screen to prevent insect escape and allow for airflow. The container was placed above a 0.57 L jar filled with 12-13 cm of insect diet. The entire apparatus was placed inside a 7.57 L bucket as a secondary container.
Insects used in this study were obtained from pesticide susceptible lab strains maintained at the USDA Center for Grain Animal Health Research in Manhattan, KS. For all species, 2-3-week-old adults and larvae were used. Adults of 10 stored product species were used. Larval species used were T. castaneum, T. confusum, T. inclusum, T. variabile, and O. surinamensis.
Fifty adults or larvae of each species were placed inside one of three testing containers for ~24 h at ambient laboratory temperatures. After 24 h, the number of insects that passed through the netting and found in the diet below the container were recorded. Insects that were partially through the netting or clinging on the underside of the net, were considered as passed through. Each drop test was repeated twice on separate dayd and with separate insect colonies for a total of six independent replicates.
", "title": "Data from: Leveraging insecticide-treated netting to improve fumigation efficacy for the protection of bulk storage of commodities", "distribution": [ { "@type": "dcat:Distribution", "downloadURL": "https://ndownloader.figshare.com/files/44803783", "format": "csv", "mediaType": "application/csv", "title": "2022_progeny_data.csv" }, { "@type": "dcat:Distribution", "downloadURL": "https://ndownloader.figshare.com/files/44803801", "format": "csv", "mediaType": "text/plain", "title": "2022_weather_data_gbs_jjas.csv" }, { "@type": "dcat:Distribution", "downloadURL": "https://ndownloader.figshare.com/files/44803786", "format": "csv", "mediaType": "text/plain", "title": "2023_progeny_data.csv" }, { "@type": "dcat:Distribution", "downloadURL": "https://ndownloader.figshare.com/files/44803798", "format": "csv", "mediaType": "application/csv", "title": "2023_weather_data_gbs_jjas.csv" }, { "@type": "dcat:Distribution", "downloadURL": "https://ndownloader.figshare.com/files/44803789", "format": "csv", "mediaType": "application/csv", "title": "grainbinstudy_dispersal_2023.csv" }, { "@type": "dcat:Distribution", "downloadURL": "https://ndownloader.figshare.com/files/44803792", "format": "csv", "mediaType": "text/plain", "title": "grainbinstudy_progeny_2023.csv" }, { "@type": "dcat:Distribution", "downloadURL": "https://ndownloader.figshare.com/files/44803795", "format": "csv", "mediaType": "application/csv", "title": "grainbinstudy2022_2.csv" }, { "@type": "dcat:Distribution", "downloadURL": "https://ndownloader.figshare.com/files/44803816", "format": "xlsx", "mediaType": "application/vnd.openxmlformats-officedocument.spreadsheetml.sheet", "title": "data for AgData Commons.xlsx" }, { "@type": "dcat:Distribution", "downloadURL": "https://ndownloader.figshare.com/files/44803831", "format": "csv", "mediaType": "text/plain", "title": "aug_2022_gbs_ranabhat_new.csv" }, { "@type": "dcat:Distribution", "downloadURL": "https://ndownloader.figshare.com/files/44803843", "format": "csv", "mediaType": "text/plain", "title": "aug_2023_gbs_ranabhat_new.csv" }, { "@type": "dcat:Distribution", "downloadURL": "https://ndownloader.figshare.com/files/44803834", "format": "csv", "mediaType": "text/plain", "title": "jul_2022_gbs_ranabhat_new.csv" }, { "@type": "dcat:Distribution", "downloadURL": "https://ndownloader.figshare.com/files/44803846", "format": "csv", "mediaType": "text/plain", "title": "jul_2023_gbs_ranabhat_new.csv" }, { "@type": "dcat:Distribution", "downloadURL": "https://ndownloader.figshare.com/files/44803837", "format": "csv", "mediaType": "text/plain", "title": "sep_2022_gbs_ranabhat_new.csv" }, { "@type": "dcat:Distribution", "downloadURL": "https://ndownloader.figshare.com/files/44803849", "format": "csv", "mediaType": "text/plain", "title": "sep_2023_gbs_ranabhat_new.csv" }, { "@type": "dcat:Distribution", "downloadURL": "https://ndownloader.figshare.com/files/44803840", "format": "xlsx", "mediaType": "application/vnd.openxmlformats-officedocument.spreadsheetml.sheet", "title": "sep_2023_gbs_ranabhat_new.xlsx" } ], "license": "https://creativecommons.org/licenses/by/4.0/", "bureauCode": [ "005:18" ], "modified": "2024-03-06", "publisher": { "@type": "org:Organization", "name": "Agricultural Research Service" }, "accrualPeriodicity": "R/P1M", "keyword": [ "Stored products pests", "stored product protection", "wheat", "Integrated Pest Management (IPM)", "fumigation", "phosphine", "insecticide netting", "long-lasting insecticide-incorporated netting", "llin", "behavior", "progeny", "weather data", "dispersal", "bulk storage", "red flour beetle", "lesser grain borer", "rice weevil", "adults", "immatures", "USDA-ARS", "center for grain and animal health research", "manhattan", "kansas", "KS", "field experment" ] }, { "identifier": "10.15482/USDA.ADC/1416159", "accessLevel": "public", "contactPoint": { "hasEmail": "mailto:james.campbell@usda.gov", "fn": "Campbell, James" }, "programCode": [ "005:040" ], "description": "Egg and progeny counts for Trogoderma variabile and Trogoderma inclusum adults with delays in mating. These data were generated to examine the effect of mating delay on life history and reproductive capacity as a cue to the use of mating disruption tactics such as pheromone lures. Survivorship was calculated as the last day egg counts were recorded for an individual. Blocks were adults that were all mated on the same day. Reps are an individual female. Control beetles are coded with either an \"f\" or an \"m\" for female and male and were never mated. Male control data was examined for similarity to female control data but was not used in further analysis and comparison. The experiment was all done at 30C, 65% relative humidity and a 16 light/8 dark photoperiod. Adults were transferred every 2 days to new vials and eggs were then counted and save for progeny counts. Trogoderma variabile populations were laboratory colonies for over 20 years. T. inclusum populations were collected in Kansas in August of 2012. We did not transform these data.
Resource Title: Progeny and egg counts for Trogoderma inclusum.
File Name: inclusum_mating_full_long.csv
Resource Description: Data for Trogoderma inclusum. Egg and progeny counts. Column headers: femaleage = day at which first mating occurred; species= T. inclusum; block=groups that were all mated on the same day; rep=an individual female; count=either eggs or progeny; Day = number of eggs of progeny counted on that given day. Adults were moved to new vials every two days, so egg and progeny counts are on a 2 day basis. Survivorship can be calculated as the last day that egg counts were taken. Day_ columns are the days post-mating.
Resource Title: Progeny and egg counts for Trogoderma variabile.
File Name: variabile_mating_full_long.csv
Resource Description: Data for Trogoderma variabile. Egg and progeny counts. Column headers: femaleage = day at which first mating occurred; species= T. inclusum; block=groups that were all mated on the same day; rep=an individual female; count=either eggs or progeny; Day = number of eggs of progeny counted on that given day. Adults were moved to new vials every two days, so egg and progeny counts are on a 2 day basis. Survivorship can be calculated as the last day that egg counts were taken. Day_ columns are the days post-mating.
Resource Title: Data Dictionary.
File Name: Data_Dictionary-Life_history_changes_Trogoderma.csv
Artificial blood feeding is a common practice for the study and maintenance of blood-feeding arthropod colonies. Commercially purchased blood is often treated to prevent clot-formation using either mechanical or chemical means. For many hematophagous insects, the effect that different anticoagulation methods may have on life history metrics is unclear. In the current study, Culex tarsalis Coquillett and Culicoides sonorensis Wirth & Jones were fed blood treated with either mechanical (defibrination) or chemical (K2 EDTA) anticoagulation methods. Several blood feeding and life history metrics were evaluated between treatment groups including proportion blood feeding, fecundity, fertility, and mortality. No significant differences were found for any of the measured life history metrics for either species. For experiments measuring aspects of these blood feeding and life history traits, blood treated using either defibrination or K2 EDTA anticoagulants should not impact experimental outcomes. These studies were conducted using laboratory reared colony populations of Culex tarsalis and Culicoides sonorensis. The effect of these anticoagulation methods on life history metrics of field collected populations could be different.
", "title": "Data from: Life history metrics for Culex tarsalis (Diptera: Culicidae) and Culicoides sonorensis (Diptera: Ceratopogonidae) are not impacted by artificial feeding on defibrinated versus EDTA-treated blood", "distribution": [ { "@type": "dcat:Distribution", "downloadURL": "https://ndownloader.figshare.com/files/44152634", "format": "csv", "mediaType": "text/plain", "title": "AnticoagulantData_Mortality.csv" }, { "@type": "dcat:Distribution", "downloadURL": "https://ndownloader.figshare.com/files/44152715", "format": "csv", "mediaType": "text/plain", "title": "AnticoagulantData_Fertility-Fecundity-Proportion.csv" }, { "@type": "dcat:Distribution", "downloadURL": "https://ndownloader.figshare.com/files/44152730", "format": "csv", "mediaType": "text/plain", "title": "AnticoagulantData_Metadata.csv" } ], "license": "https://www.usa.gov/publicdomain/label/1.0/", "bureauCode": [ "005:18" ], "modified": "2024-02-01", "publisher": { "@type": "org:Organization", "name": "Agricultural Research Service" }, "keyword": [ "Culicoides", "Culex", "Anticoagulants", "Blood feeding", "data.gov", "ARS" ] }, { "identifier": "10.1093/ee/nvz027", "accessLevel": "public", "contactPoint": { "hasEmail": "mailto:dacotah.melicher@ars.usda.gov", "fn": "Melicher, Dacotah" }, "programCode": [ "005:040" ], "description": "Pollination services provided by the honey bee, Apis mellifera (Hymenoptera: Apidae, Linnaeus, 1758) have broad economic impacts and are necessary for production of a diversity of important crops. Hives may be transported multiple times per year to provide pollination. To test how temperature may contribute to transportation stress, temperature sensors were placed in hives in different locations and orientations on the trailer during shipping. Colony size prior to shipping significantly contributed to loss of population immediately after shipping which contributed to colony failure with smaller colonies more likely to fail and fail faster. Colony size also affects thermoregulation and temperature stress. Internal hive temperature varies significantly based on location and orientation. While colonies near the front and rear of the trailer and those oriented toward the center aisle had significantly different average internal temperatures, colony size best predicts loss of thermoregulation. Additionally, we profiled gene expression at departure, on arrival, and after a recovery period to identify transcriptional responses to transportation. Functional and enrichment analysis identified increased methylation and decreased ribosomal and protein-folding activity. Pheromone and odorant-binding transcripts were up-regulated after transportation. After recovery, transcripts associated with defense response, immune activity, and heat shock decreased, while production of antibiotic peptides increased. We conclude that hives experience considerable temperature stress possibly caused by turbulent airflow in exposed locations. Transportation stress should be considered an important component of annual colony losses which can be mitigated with improved management strategies.
\nSupplementary Tables S1–S8 are presented. Sequence reads associated with the mRNA sequencing analysis are archived at NCBI under BioProject PRJNA495845.
Resource Title: Website pointer to Supplementary Data.
File Name: Web Page, url: https://academic.oup.com/ee/article/48/3/691/5423020?login=true#supplementary-data
The GCEW herbicide data were collected from 1991-2010, and are documented at plot, field, and watershed scales.
\nAtrazine concentrations in Goodwater Creek Experimental Watershed (GCEW) were shown to be among the highest of any watershed in the United States based on comparisons using the national Watershed Regressions for Pesticides (WARP) model and by direct comparison with the 112 watersheds used in the development of WARP. This 20-yr-long effort was augmented with a spatially broad effort within the Central Mississippi River Basin encompassing 12 related claypan watersheds in the Salt River Basin, two cave streams on the fringe of the Central Claypan Areas in the Bonne Femme watershed, and 95 streams in northern Missouri and southern Iowa. The research effort on herbicide transport has highlighted the importance of restrictive soil layers with smectitic mineralogy to the risk of transport vulnerability. Near-surface soil features, such as claypans and argillic horizons, result in greater herbicide transport than soils with high saturated hydraulic conductivities and low smectitic clay content.
\nThe data set contains concentration, load, and daily discharge data for Devils Icebox Cave and Hunters Cave from 1999 to 2002. The data are available in Microsoft Excel 2010 format. Sheet 1 (Cave Streams Metadata) contains supporting information regarding the length of record, site locations, parameters measured, parameter units, method detection limits, describes the meaning of zero and blank cells, and briefly describes unit area load computations. Sheet 2 (Devils Icebox Concentration Data) contains concentration data from all samples collected from 1999 to 2002 at the Devils Icebox site for 12 analytes and two computed nutrient parameters. Sheet 3 (Devils Icebox SS Conc Data) contains 15-minute suspended sediment (SS) concentrations estimated from turbidity sensor data for the Devils Icebox site. Sheet 4 (Devils Icebox Load & Discharge Data) contains daily data for discharge, load, and unit area loads for the Devils Icebox site. Sheet 5 (Hunters Cave Concentration Data) contains concentration data from all samples collected from 1999 to 2002 at the Hunters Cave site for 12 analytes and two computed nutrient parameters. Sheet 6 (Hunters Cave SS Conc Data) contains 15-minute SS concentrations estimated from turbidity sensor data for the Hunters Cave site. Sheet 7 (Hunters Cave Load & Discharge Data) contains daily data for discharge, load, and unit area loads for the Hunters Cave site.
\n[Note: To support automated data access and processing, each worksheet has been extracted as a separate, machine-readable CSV file; see Data Dictionary for descriptions of variables and their concentration units.]
\nResource Title: README - Metadata.
File Name: LTAR_GCEW_herbicidewater_qual.xlsx
Resource Description: Defines Water Quality and Sediment Load/Discharge parameters, abbreviations, time-frames, and units as rendered in the Excel file. For additional information including site information, method detection limits, and methods citations, see Metadata tab. For Definitions used in machine-readable CSV files, see Data Dictionary.
Resource Title: Excel data spreadsheet.
File Name: c3.jeq2013.12.0516.ds1_.xlsx
Resource Description: Multi-page data spreadsheet containing data as well as metadata from this study.\n\nA direct download of the data spreadsheet can be found here: https://dl.sciencesocieties.org/publications/datasets/jeq/C3.JEQ2013.12.0516.ds1/download
Resource Title: Devils Icebox Concentration Data.
File Name: DevilsIceboxConcData.csv
Resource Description: Concentrations of herbicides, metabolites, and nutrients (extracted from the Excel tab into machine-readable CSV data).
Resource Title: Devils Icebox Load and Discharge Data.
File Name: DevilsIceboxLoad&Discharge.csv
Resource Description: Discharge and Unit Area Loads for herbicides, metabolites, and suspended sediments (extracted from Excel tab as machine-readable CSV data)
Resource Title: Devils Icebox Suspended Sediment Concentration Data.
File Name: DevilsIceboxSSConcData.csv
Resource Description: Suspended Sediment Concentration Data (extracted from Excel tab as machine-readable CSV data)
Resource Title: Hunters Cave Load and Discharge Data.
File Name: HuntersCaveLoad&Discharge.csv
Resource Description: Discharge and Unit Area Loads for herbicides, metabolites, and suspended sediments (extracted from Excel tab as machine-readable CSV data)
Resource Title: Hunters Cave Suspended Sediment Concentration Data.
File Name: HuntersCaveSSConc.csv
Resource Description: Suspended Sediment Concentration Data (extracted from Excel tab as machine-readable CSV data)
Resource Title: Data Dictionary for machine-readable CSV files.
File Name: LTAR_GCEW_herbicidewater_qual.csv
Resource Description: Defines Water Quality and Sediment Load/Discharge parameters, abbreviations, time-frames, and units as implemented in the extracted machine-readable CSV files.
Resource Title: Hunters Cave Concentration Data.
File Name: HuntersCaveConcData.csv
Resource Description: Concentrations of herbicides, metabolites, and nutrients (extracted from the Excel tab into machine-readable CSV data)
Reproductive output and behavioral data from stored-product pest insects exposed to long-lasting insecticide treated netting. Includes offspring output and survival for Trogoderma variabile (treated as larvae) and Tribolium castaneum (treated as adults).
Resource Title: Reproductive Output for female T. castaneum exposed to LLIN.
File Name: Female_Exposed_Reproductive_Output_RFB.csv
Resource Description: Exposure = Treated (LLIN) or untreated netting; AgeClass = Day post-pairing (mating); Rep = Replicate; BlockA - Block F = Individual mating pairs, started on different weeks, value is the total adult progeny produced. Females were exposed at 7 days post-pupal emergence and then immediately paired with a virgin male.
Resource Title: Reproductive Output for female T. variabile exposed to LLIN.
File Name: Female_Exposed_Reproductive_Output_WB.csv
Resource Description: Exposure = Control or Treated (LLIN); Block = started on different weeks; Rep = Replicate within a block; Day = day individual pairs were transferred to new vials; Progeny_Total = total adult progeny produced from the mating pairs. T. variabile larvae were exposed to LLIN for 5-mins. Post-pupal emergence, females were paired with a non-treated virgin male.
Resource Title: Behavioral interactions of T. castaneum females exposed to LLIN.
File Name: interactions_long_female_exposed.csv
Resource Description: Rep = replicate; Beetle = specific beetle observed, beetles were assayed in a petri dish separated into 4 quarters, the quarters did not interact with one another; Treatment = Control or Treated (LLIN); Interation_Initiated_By = which individual (or both) initiated the interaction (females were painted on their thorax); Duration = duration of interaction; Duration_seconds = duration of interaction in seconds; Copulation = A is attempted (male attempts to mount female), N = No, Y= Yes (male mounts female). Females were exposed for 5-min to LLIN for treated assays. Assay was recorded for 1 hour.
Resource Title: Behavioral interactions of T. castaneum males exposed to LLIN.
File Name: interactions_long_male_exposed.csv
Resource Description: Rep = replicate; Beetle = specific beetle observed, beetles were assayed in a petri dish separated into 4 quarters, the quarters did not interact with one another; Treatment = Control or Treated (LLIN); Interation_Initiated_By = which individual (or both) initiated the interaction (females were painted on their thorax); Duration = duration of interaction; Duration_seconds = duration of interaction in seconds; Copulation = A is attempted (male attempts to mount female), N = No, Y= Yes (male mounts female). Males were exposed for 5-min to LLIN for treated assays. Assay was recorded for 1 hour.
Resource Title: Reproductive Output of female T. variabile paired to males exposed to LLIN.
File Name: Male_Exposure_Reproductive_Output_WB.csv
Resource Description: Exposure = Control or Treated (LLIN); Block = Started on different weeks; Rep = replicate within a block; week = week that mating pairs were in a vial; Total Progeny = the total adult progeny produced by a single mating pair. Larvae were exposed to LLIN and paired as adults 1-3 days post-pupal emergence with an unexposed virgin female.
Resource Title: Reproductive Output of female T. castaneum paired to males exposed to LLIN.
File Name: Male_Exposure_Reproductive_Output_RFB.csv
Resource Description: Exposure = Control or Treated (LLIN); Block = Started on different weeks; Rep = replicate within a block; week = week that mating pairs were in a vial; Total Progeny = the total adult progeny produced by a single mating pair. Males were exposed at 7 days old and immediately paired with an unexposed virgin female.
Resource Title: Survivorship of males exposed to LLIN.
File Name: Male_Exposure_Survivorship_RFB_WB.csv
Resource Description: Week = week that mating pair was in a given vial; percent_alive = percent of males alive at each week, of total replicates and blocks assayed; exposure = control or treatment (LLIN); Species = RFB (Tribolium castaneum) and WB (Trogoderma variabile). Male T. castaneum were exposed to LLIN as adults at 7 days old and immediately paired with a virgin female; male T. variabile were exposed to LLIN as larvae and then paired 1-3 days after adult emergence with a virgin female.
Resource Title: Survivorship of females exposed to LLIN.
File Name: survivorship_RFB_WB_stacked.csv
Resource Description: Exposure = Treatment (LLIN) or control; block = started on different weeks; rep = replicate within a block; Longevity = day that the female died; Species = RFB (Tribolium castaneum) and WB (Trogoderma variabile). Female T. castaneum were exposed as adults at 7 days old and immediately paired with a virgin male; female T. variabile were exposed as larvae and paired at 1-3 days emergence as adults to a virgin male.
Resource Title: Time for T. castaneum to fall through netting.
File Name: suspended_netting_data_RFB.csv
Resource Description: Arena = individual suspended netting arena; Block = assayed on different days; Time = Time (seconds) for adult beetle to fall through netting; Beetle = individual beetle assayed within an arena; Treatment = Control (untreated) and Treated (LLIN). Mixed sex adult beetles (< 30 days old) were assayed with 5 beetles within an arena. Three arenas were observed at the same time.
Resource Title: Time for T. variabile to fall through netting.
File Name: suspended_netting_data_WB.csv
Resource Description: Arena = individual suspended netting arena; Block = assayed on different days; Time = Time (seconds) for adult beetle to fall through netting; Beetle = individual beetle assayed within an arena; Treatment = Control (untreated) and Treated (LLIN). Mixed sex mid-stage larvae were assayed with 5 larvae within an arena. Three arenas were observed at the same time.
Attraction Assessment - assessment of different lure sources, including pheromones and kairomones for red flour beetle and lesser grain borer in the wind tunnel and release-recapture experiment under controlled settings. Abbreviations: WGO - wheat germ oil; Tab - Insects Limited SPB tablet bait; NC - negative control (no stimulus); DDGS - dried distiller's grains with soluables. There were a total of n = 12 replicate releases for the release-recapture and n = 30 replicate individuals for the wind tunnel per treatment.
\nDose Dependency Data - evaluation of whether dose-dependency in attraction exists for red flour beetle and lesser grain borer in the wind tunnel and in a release-recapture experiment for the Insects Limited SPB lure. Abbreviations: SPB1 - a single Insects Limited SPB tablet bait; SPB2 - two Insects Limited SPB tablet baits; SPB3 - three Insects Limited SPB tablet baits; Ctrl - negative control (no stimulus); DDGS - dried distiller's grains with soluables. There were a total of n = 24 replicate releases for the release-recapture and n = 30 replicate individuals for the wind tunnel per treatment.
\nSpillage Trap Collections - datasheet for the number and lowest taxonomic unit of insects collected in interception traps with different kill mechanisms and stimuli at three food facilities in Arkansas and Kansas during 2018 and 2019. There were a total of 27 taxa tracked, and captures totaled to near 4,000. Abbreviations: C, control netting only (no stimulus); L, insecticide-netting only (no stimulus); LS, insecticide-netting with a single SPB Insects Limited tab lure; CS, control netting with a single SPB Insects Limited tab lure. State abbreviations: AR - Arkansas, KS - Kansas. There were three transects per site, each with every treatment above represented, thus a total of n = 8-9 replicate deployments in AR and n = 12 deployments in KS.
\nSpillage Trap Progeny- datasheet for progeny production in interception traps after six weeks under constant conditions with different kill mechanisms and stimuli at three food facilities in Arkansas and Kansas during 2018 and 2019. Abbreviations: C, control netting only (no stimulus); L, insecticide-netting only (no stimulus); LS, insecticide-netting with a single SPB Insects Limited tab lure; CS, control netting with a single SPB Insects Limited tab lure. State abbreviations: AR - Arkansas, KS - Kansas. There were three transects per site, each with every treatment above represented, thus a total of n = 8-9 replicate deployments in AR and n = 12 deployments in KS.
\nTrial 1 Recapture - To understand whether the method by which LLIN was deployed affected subsequent commodity infestation and progeny production, pilot-scale warehouses (5.85 × 2.81 m) in Manhattan, KS were used. At the far end of the warehouse against the back wall, a commodity consisting of a mixture of 210 mL organic, whole wheat kernels and 210 mL of organic, unbleached flour was placed. A total of 100 individuals each of T. castaneum, R. dominica, and T. variabile were released at the opposite end of the warehouse (approx. 5.25 m away). There were n = 12 replicate releases per treatment from 26 April 2019 to 16 August 2019, comprising a total of 3,600 released insects. There were four LLIN deployment methods that were tested (Figure 2). In the “hanging” treatment, LLIN (2.72 × 2.41 m) was affixed to the warehouse ceiling and allowed to hang down to the floor, completely bisecting the room. In the “cover” deployment method, LLIN was directly laid over the commodity. In the “pipe” deployment method, a PVC pipe (91 cm length, 5.1 cm I.D.) was bisected halfway with LLIN. These were compared with a \"control\" that used the same PVC pipe design, but without netting. Insects were given 72 h to disperse across the warehouse to the commodity. After this period, insects were collected by pre-designated zones in the warehouse. The zones were noted respective to the location of the commodity, and included \"in commodity\" (inside the commodity), \"partial dispersal\" (0.5 m radius to 4.5 m away), and \"no dispersal\" (4.5 m–5.6 m away, e.g. the release zone). The insects were retrieved, and then brought back to the lab where their health condition was assessed as alive, affected, or dead. Abbreviations: RFB - red flour beetle; LGB - lesser grain borer; WHB - warehouse beetle.
\nTrial 1 Progeny Production - as above but, the commodity was held for 6 weeks after deployment under constant environmental chamber conditions to evaluate progeny production. The species and health conditions of the progeny were recorded.Abbreviations: RFB - red flour beetle; LGB - lesser grain borer; WHB - warehouse beetle.
\nTrial 2 Recapture - To understand whether management tactic affected subsequent commodity infestation and progeny production, pilot-scale warehouses (5.85 × 2.81 m) in Manhattan, KS were used. There were four treatments in total applied to warehouses for this experiment: LLIN alone (L), AK-based interception trap alone (AK), both together (LAK), or neither (e.g. \"control\" that had no netting or interception trap). The zones were similar to the descriptions above, but a Zone 7 was introduced which described insects captured inside the interception traps (e.g. \"trap\"). At the far end of the warehouse against the back wall, a commodity consisting of a mixture of 210 mL organic, whole wheat kernels and 210 mL of organic, unbleached flour was placed. A total of 100 individuals each of T. castaneum, R. dominica, and T. variabile were released at the opposite end of the warehouse (approx. 5.25 m away). There were n = 12 replicate releases per treatment from 23 August 2019 to 8 November 2019, comprising a total of 3,600 released insects. Insects were given 72 h to disperse across the warehouse to the commodity. After this period, insects were collected by pre-designated zones in the warehouse. The zones were noted respective to the location of the commodity, and included \"in commodity\" (inside the commodity), \"partial dispersal\" (0.5 m radius to 4.5 m away), and \"no dispersal\" (4.5 m–5.6 m away, e.g. the release zone). The insects were retrieved, and then brought back to the lab where their health condition was assessed as alive, affected, or dead. Abbreviations: RFB - red flour beetle; LGB - lesser grain borer; WHB - warehouse beetle.
\nTrial 2 Progeny Production - as above but, the commodity was held for 6 weeks after deployment under constant environmental chamber conditions to evaluate progeny production. The species and health conditions of the progeny were recorded. Abbreviations: RFB - red flour beetle; LGB - lesser grain borer; WHB - warehouse beetle.
\nThis work was funded, in part, by a United States Department of Agriculture, National Institute of Food and Agriculture, Crop Protection and Pest Management Grant #2017-70006-27262.
\nSee included file list for more information about each individual data file.
Resource Title: Attraction Assessment.
File Name: Attraction Assessment.xlsx
Resource Software Recommended: Microsoft Excel,url: https://www.microsoft.com/en-us/microsoft-365/excel
Resource Title: Dose Dependency Data.
File Name: Dose Dependency Data.xlsx
Resource Software Recommended: Microsoft Excel,url: https://www.microsoft.com/en-us/microsoft-365/excel
Resource Title: Spillage Trap Collections.
File Name: Spillage Trap Collections.xlsx
Resource Software Recommended: Microsoft Excel,url: https://www.microsoft.com/en-us/microsoft-365/excel
Resource Title: Spillage Trap Progeny.
File Name: Spillage Trap Progeny.xlsx
Resource Software Recommended: Microsoft Excel,url: https://www.microsoft.com/en-us/microsoft-365/excel
Resource Title: Trial 1 Progeny Production.
File Name: Trial 1 Progeny Production.xlsx
Resource Software Recommended: Microsoft Excel,url: https://www.microsoft.com/en-us/microsoft-365/excel
Resource Title: Trial 1 Recapture.
File Name: Trial 1 Recapture.xlsx
Resource Software Recommended: Microsoft Excel,url: https://www.microsoft.com/en-us/microsoft-365/excel
Resource Title: Trial 2 Progeny Production.
File Name: Trial 2 Progeny Production.xlsx
Resource Software Recommended: Microsoft Excel,url: https://www.microsoft.com/en-us/microsoft-365/excel
Resource Title: Trial 2 Recapture.
File Name: Trial 2 Recapture.xlsx
Resource Software Recommended: Microsoft Excel,url: https://www.microsoft.com/en-us/microsoft-365/excel
Resource Title: README file list.
File Name: file_list_stored_product_beetles.txt
All of the annotated raw data from the submitted paper \"Low-dose foliar and tuber treatments of the auxin analog 2,4-D reduces potato common scab and powdery scab for multiple potato cultivars and can improve potato root development.\" Datasets included are common scab disease scores from 2017 and 2018 field sites in ME and PA, soil profile data from 2018 PA and ME field sites, bag weight data from 2018 PA and ME field trials, common scab disease scores from seed tuber treatment trial in Tasmania, powdery scab disease score data from 2017 and 2018 Tasmania trials, tuber necrosis data from seed-tuber treatment trials, total tuber yield from the 2017 and 2018 Tasmania field trials, root growth from the 2017 Tasmania trial.
Resource Title: Compressed data from: Low-dose foliar and tuber treatments of the auxin analog 2,4-D reduces potato common scab and powdery scab for multiple potato cultivars and can improve potato root development .
File Name: 2-4DandScabRawDataCombined.zip
Resource Description: All data from the referenced submitted paper as individual csv files.
Data reported in research published in Crop Science, “Mapping the quantitative field resistance to stripe rust in a hard winter wheat population ‘Overley’ × ‘Overland.’” Authors are Wardah Mustahsan, Mary J. Guttieri, Robert L. Bowden, Kimberley Garland-Campbell, Katherine Jordan, Guihua Bai, Guorong Zhang from USDA Agricultural Research Service and Kansas State University. This study was conducted to identify quantitative trait loci (QTL) associated with field resistance to stripe rust, also known as yellow rust (YR), in hard winter wheat. Stripe rust infection type and severity were rated in recombinant inbred lines (RILs, n=204) derived from a cross between hard red winter wheat cultivars ‘Overley’ and ‘Overland’ in replicated field trials in the Great Plains and Pacific Northwest. RILs (n=184) were genotyped with reduced representation sequencing to produce SNP markers from alignment to the ‘Chinese Spring’ reference sequence, IWGSC v2.1, and from alignment to the reference sequence for ‘Jagger’, which is a parent of Overley. Genetic linkage maps were developed independently from each set of SNP markers. QTL analysis identified genomic regions on chromosome arms 2AS, 2BS, 2BL, and 2DL that were associated with stripe rust resistance using multi-environment best linear unbiased predictors for stripe rust infection type and severity. Results for the two linkage maps were very similar. PCR-based SNP marker assays associated with the QTL regions were developed to efficiently identify these genomic regions in breeding populations.
Field response to YR was evaluated in seven trials: Rossville, KS (2018 and 2019), Hays, KS (2019), Pullman, WA (2019 and 2020) and Central Ferry, WA (2019 and 2020). An augmented experimental design was used at Rossville, KS with highly replicated checks and two full replications of RILs (n=187 in 2018; n=204 in 2019). The field experiment at Hays was arranged in a partially replicated augmented design with one or two replications of each RIL (n=194). The parental checks (Overley and Overland) were represented in three blocks for each of the two field replications at Hays, and RILs were distributed among blocks; not all RILs were present in each replication. RILs were arranged in an augmented design with two replications at Pullman (n=204 RILs) and Central Ferry (n=155 RILs in 2019; n=204 in 2020). At Pullman and Central Ferry.
The trials at Rossville, KS were inoculated using an inoculum consisting of equal parts of four isolates that were all virulent to Yr9. Two isolates were collected in Kansas in 2010 and had virulence to Yr17 but not QYr.tamu-2B. The other two isolates were from Kansas in 2012 and had virulence to QYr.tamu-2B, but not Yr17. Susceptible spreader rows (KS89180B, carrying Yr9) were inoculated several times during the tillering stage in the evenings with an ultra-low volume sprayer using a suspension of 2 mL of fresh urediniospores in 1 L of Soltrol 170 isoparaffin oil. Trials at Pullman, WA and Central Ferry, WA were evaluated under natural inoculum supplemented by a mixture of isolates collected in the previous field season. The trial at Hays, KS was evaluated under natural infection.
Data collection at Rossville, KS began once the susceptible check (KS89180B) had an infection severity coverage of ~10% and continued until senescence. In Rossville, disease ratings (IT and SEV) were collected on 16, 22, and 28th of May 2019. Most ratings in Rossville were taken some time after heading from Zadoks stages 55 to 70. In Pullman, disease ratings were collected on July 1 and 12. In Central Ferry, disease ratings were taken on 12th and 18th of June 2019. The second rating date was used for subsequent statistical analysis. In Hays, disease ratings were taken on June 1, 2019, when the plants were in early booting or heading stages (Zadoks 31-41). Stripe rust evaluations were measured using two disease rating scales: IT (0-9; from no infection to highly susceptible, Line and Qayoum, 1992) and SEV based on visual estimation of the percent flag leaf area affected by the pathogen including associated chlorosis and necrosis (0-100%).
DNA was extracted from seedlings, and genotyping-by-sequencing was conducted as described previously (Guttieri, 2020) on a subset of 189 lines (187 RILS and 2 parents) of which 23 RILs were F6-derived and 164 RILs were F9-derived. Single nucleotide polymorphisms (SNPs) were identified in parallel using reference-based calling in the TASSEL pipeline (Bradbury et al., 2007) using both the IWGSC v2.1 reference genome (Zhu et al., 2021) and the Jagger reference sequence (Wheat Genomes Project (http://www.10wheatgenomes.com/10-wheat-genomes-project-and-the-wheat-initiative/). The TASSEL pipeline was executed with the following parameters: minimum read count = 1, minimum quality score = 0, minimum locus coverage = 0.19, and minimum minor allele frequency = 0.005, minimum heterozygous proportion = 0, and removal of minor SNP states. The resulting SNP datasets from each reference sequence were filtered in TASSEL by taxa (RILs) and sites (SNPs). The RILs were filtered to include those RILs for which at least 20% sites were present. The sites were filtered to include sites for which > 60% of RILs were called, minor allele frequency (MAF) > 0.25, maximum allele frequency < 0.75, maximum heterozygous proportion = 0.25, and removal of minor SNP states. The ABH plugin in TASSEL was applied to this reduced dataset to identify parental genotypes.
Resources in this dataset:
The dataset includes information on soil properties collected from two conventionally managed fields under corn-soybean rotation in October 2005 and October 2016, respectively. The fields are located in Story County, Central Iowa. 42 sampling locations per field and year were sampled within a 50 m × 50 m grid, and 1 to 2 samples per location were collected using a hydraulic soil sampler (d= 38.2 mm) from the 0 - 120 cm soil layer. The samples were analyzed to determine carbon and nitrogen concentration, and soil pH in five soil layers (0-15, 15-30, 30-60, 60-90, and 90-120 cm). Presented is the raw data per location (mean of duplicates) with which carbon and nitrogen content can be calculated with either the equivalent soil mass method or by using bulk density.
\nFor more information about this dataset contact:\nTom Sauer: tom.sauer@usda.gov\nChristian Dold: c.dold@fz-juelich.de
Resource Title: Data Dictionary.
File Name: data-dictionary_CD.csv
Resource Description: Defines variables and their units for the data table, also provided as a separate sheet within xlsx file.
Resource Title: Soil Properties.
File Name: Soil Chemical Analysis.xlsx
This is a dataset consisting of donor-specific collections of 78 metagenomes (13 / donor) and 143 metagenome-assembled genomes (MAGs) representing the gut microbiomes of six healthy adult human donors. Raw sequencing data and MAG sequence data will be available in NCBI under BioProject accession PRJNA961974 (https://www.ncbi.nlm.nih.gov/bioproject/PRJNA961974). Spreadsheets attached to this dataset include individual accession numbers and sequencing depth for the raw data; and assembly and NCBI accession numbers, binning information, quality metrics, and taxonomic assignments for the MAGs.
Resources in this dataset:
Amplicon sequencing utilizing next-generation platforms has significantly transformed how research is conducted, specifically microbial ecology. However, primer and sequencing platform biases can confound or change the way scientists interpret these data. The Pacific Biosciences RSII instrument may also preferentially load smaller fragments, which may also be a function of PCR product exhaustion during sequencing. To further examine theses biases, data is provided from 16S rRNA rumen community analyses. Specifically, data from the relative phylum-level abundances for the ruminal bacterial community are provided to determine between-sample variability. Direct sequencing of metagenomic DNA was conducted to circumvent primer-associated biases in 16S rRNA reads and rarefaction curves were generated to demonstrate adequate coverage of each amplicon. PCR products were also subjected to reduced amplification and pooling to reduce the likelihood of PCR product exhaustion during sequencing on the Pacific Biosciences platform. The taxonomic profiles for the relative phylum-level and genus-level abundance of rumen microbiota as a function of PCR pooling for sequencing on the Pacific Biosciences RSII platform were provided.
\nData is within this article and raw ruminal MiSeq sequence data is available from the NCBI Sequence Read Archive (SRA Accession SRP047292). Additional descriptive information is associated with NCBI BioProject PRJNA261425. http://www.ncbi.nlm.nih.gov/bioproject/PRJNA261425/
Resource Title: NCBI Sequence Read Archive (SRA Accession SRP047292).
File Name: Web Page, url: https://www.ncbi.nlm.nih.gov/sra/SRX704260
1 ILLUMINA (Illumina MiSeq) run: 978,195 spots, 532.9M bases, 311.6Mb downloads.
Body weight response to periods of feed restriction and realimentation is critical and relevant to the agricultural industry. The purpose of this study was to evaluate differentially expressed genes identified in subcutaneous adipose tissue collected from cows divergent in body weight (BW) gain after feed restriction and realimentation. We compared adipose samples from cows with greater gain based on average daily gain (ADG) during realimentation with samples from cows with lesser gain. Specifically, there were four comparisons including two comparing the high and low gain animals across each feeding period (feed restriction and realimentation) and two that compared differences in feed restriction and realimentation across high or low gain classifications. Using microarray analysis, we provide a set of differentially expressed genes identified between the high and low gain at both periods of nutrient restriction and realimentation. These data identify multiple differentially expressed genes between these two phenotypes across both nutritional environments.
Resource Title: NCBI Gene Expression Omnibus (GEO) Accession GSE94746 Display .
File Name: Web Page, url: https://www.ncbi.nlm.nih.gov/geo/query/acc.cgi?acc=GSE94746
Evaluation of the naturally occurring transcriptome variation among beef cows with divergent gain.
To determine whether colony populations of Lasioderma serricorne (cigarette beetle, CB) and Sitophilus oryzae (rice weevil, RW) vectored microbes, and to identify possible interactions with dispersal time, a vectoring assay was performed for each species. For the vectoring assay, the impact of dispersal (0, 24, or 72 h) and foraging time (3 or 5 d) on vectoring ability were tested. Briefly, adult L. serricorne or S. oryzae were singly removed from colony containers with sterilized forceps and then placed immediately in the center of Petri dish containing agar for the 0 h dispersal period. Alternatively, some insects were given a 24 or 72 h dispersal period in an autoclaved 4 L-capacity glass container and stored at constant conditions of 25°C, 60% RH, and 14:10 L:D photoperiod prior to being added to the PDA. Petri dishes were maintained at 30°C, 60% RH, and 14:10 L:D photoperiod for either 3 or 5 days, then photographed for microbial growth. Transfer of L. serricorne or S. oryzae adults from dispersal containers to agar at the conclusion of the dispersal period was performed inside the biosafety cabinet to prevent contamination of dishes.
\nPictures of the agar dishes and corresponding microbial growth were taken using a DSLR camera (EOS 7D Mark II, Canon, Tokyo, Japan) mounted to 3D imaging StackShot (CogniSys, Inc., Traverse City, MI, USA) equipped with a dual flash (MT-26EX-RT, Canon, Tokyo, Japan). Light was diffused using a partially cut frosted plastic jar (15.2 × 7.6 cm D:H) making a total of n = 60 replicates per treatment combination (of dispersal time, insect species, and foraging time in patch). The pictures taken were processed using ImageJ 1.53a (Wayne Rasband, National Institutes of Health, USA) to quantify the microbial growth in the agar dishes. The images had their backgrounds subtracted, then were processed using the \"find edges\" tool. Finally, they were converted to binary and either dilated or eroded to conform to the original image parameters. A circle encompassing the Petri dish was created and the mean grayscale, standard deviation of the grayscale value, and count of pixels was measured as a surrogate for microbial growth on the dishes. This allowed a quantitative measure of microbial growth by creating an average in a given image. The mean grayscale value could range from 0 (full white), indicating no microbial growth, to 255 (full black), indicating full microbial growth on the entire dish. Finally, visually, microbial morphospecies (alpha) richness was assigned to each image given the number of unique morphospecies on the plate as a proxy for community complexity.
\nTreatments included those from microbially-enriched environments where Aspergillus flavus had been inoculated on wheat or flour (AF). To prepare the AF, 600 g of grain was added to a stainless-steel pot filled with water and placed on a hot plate at 500°C. Once boiling for 15 min, the water was drained and the grain was evenly spread out on sterile wipes (38.1 × 42.5 cm, 3 ply, Tech wipes, Skilcraft, NIB, Alexandria, VA) and allowed to dry inside a laminar fume hood (ca. 3 h). Afterwards, grain was evenly divided (~300 g) and placed in two separate autoclaved mason jars (950-mL capacity). A single hole was pierced through each lid and lined with a cotton ball. The jars were then sealed with aluminum foil and were autoclaved (533LS, Getinge, Rochester, NY, USA) for 30 min. To inoculate with A. flavus, a 3-inch strip of agar containing a pure culture of A. flavus grown on agar for 7 d at 30°C, 60% RH, and 14:10 L:D photoperiod was placed into each jar containing the grain. AF was then maintained at room temperature for roughly 10 d or until the A. flavus evenly covered as much the grain as possible. Batches of inoculated grain were used within 10–15 d of preparation. Grain was never used more than once for each replicate of every trial in each assay experiment to prevent cross contamination. A total of 75 insects were added to 300 g of AF in a 950-ml mason jar and allowed to forage for 2 weeks prior to use in the vectoring experiment. The same dispersal periods (0, 24, 72 h) and time in patch (3 and 5 d) described above were used for this experiment. The mean grayscale value and microbial morphospecies richness was recorded for each image. There were a total of n = 30 replicates per treatment combination.
\nAnother treatment included field-collected individuals. To obtain sufficient numbers of adults, insects were caught at four different field sites around the area of greater Manhattan, KS including: 1) a site with a pre-harvest wheat field bordered by woodlands (39°14'26.2\"N, 96°34'59.1\"W), 2) local apartment complex consisting of end consumers (39°11'43.6\"N, 96°36'07.4\"W), 3) Kansas State University Agronomy Farm with storage silos (39°12'23.7\"N, 96°35'43.2\"W), and 4) a private residence adjacent to a working cattle farm (39°12'23.7\"N, 96°35'43.2\"W). In each location, a total of three 4-funnel Lindgren traps (Bioquip, Rancho Dominguez, CA, USA) were deployed at least 10 m apart at about 1 m height on rebar or hung from a tree along the perimeter of the location site, and were baited with a multi-species lure containing both L. serricorne sex pheromone and Sitophilus spp. pheromone (PTL bullet lure, #IL-108, and Sitophilus spp. bullet lure, #IL-703, Insects Limited, Westfield, IN, USA). In addition, three ground traps were deployed that consisted of commercially-available pitfall traps (Dome®, Storgard, Trécé, Adair, OK, USA) with two connectable pieces (Doud and Phillips 2020; Doud et al. 2021), containing a central well where a Sitophilus spp. lure was added along with a 5 g of whole maize as a kairomone bait. Pheromone lures were changed every 60 d. No kill mechanism was added because adults needed to be alive. Traps were checked on a daily basis for capture of new adults and brought immediately back into the laboratory in separate unused, sterilized containers for addition to agar dishes. Stored product insects were identified using taxonomic keys in USDA (1996). Dispersal period at 0 h and time in patch (3 and 5 d) as described above were used for this experiment.
\nResources in this dataset:
\nThis dataset is associated with the forthcoming publication entitled, \"Microbial volatile organic compounds mediate attraction by a primary but not secondary stored product insect pest in wheat\", and includes data on grain damage from near infrared spectroscopy, behavioral data from wind tunnel and release-recapture experiments, as well as volatile characterization of headspace from moldy grain. For all files, incubation intervals 9, 18, and 27 d represent how long grain was incubated after being tempered to a grain moisture of 12, 15, or 19% or left untempered (ctrl; 10.8% grain moisture). TSO = Trece storgard oil; empty = negative control (no stimulus), LGB = lesser grain borer (Rhzyopertha dominica), and RFB = red flour beetle (Tribolium castaneum).
\nNote: The resource 'GC/MS Grain MVOC Headspace Data' was added 2021-08-04 with the deletion of some compounds as unlikely natural compounds and potential contaminants. This is the dataset that undergirds the non-metric multidimensional scaling analysis.
\nSee the included file list for more information about methods and results of each file in this dataset.
Resource Title: GC-MS/Headspace Data.
File Name: tvw_final_gc_ms_data.csv
Resource Software Recommended: Microsoft Excel,url: https://www.microsoft.com/en-us/microsoft-365/excel
Resource Title: Microbial damage on wheat evaluated with near-infrared spectroscopy.
File Name: tvw_nearinfrared_sorting_damaged_grain_fungal_exp.csv
Resource Software Recommended: Microsoft Excel,url: https://www.microsoft.com/en-us/microsoft-365/excel
Resource Title: Release-Recapture Datasets with LGB & RFB.
File Name: tvw_rr_lgb_rfb_microbial_cues.csv
Resource Software Recommended: Microsoft Excel,url: https://www.microsoft.com/en-us/microsoft-365/excel
Resource Title: Wind tunnel response by RGB & LGB.
File Name: tvw_wt_lgb_rfb_data_microbial_cues.csv
Resource Software Recommended: Microsoft Excel,url: https://www.microsoft.com/en-us/microsoft-365/excel
Resource Title: GC/MS Grain MVOC Headspace Data.
File Name: taylor_headspace_final_data_peer_reviewed_ag_commons.csv
Resource Software Recommended: Microsoft Excel,url: https://www.microsoft.com/en-us/microsoft-365/excel
Resource Title: README file list.
File Name: file_list_MVOCwheat.txt
This repository contains the code and data to reproduce the figures and analyses in the paper \"Microbiota of maize kernels as influenced by Aspergillus flavus infection in susceptible and resistant inbreds\" by Moore et al. The paper investigates how biocontrol application affects the diversity and composition of the bacterial and fungal communities associated with maize kernels, using 16S and ITS amplicon sequencing. Also available at https://github.com/kcamnairb/biocontrol_microbiome_analysis
", "title": "Data from: Microbiota of maize kernels as influenced by Aspergillus flavus infection in susceptible and resistant inbreds", "distribution": [ { "@type": "dcat:Distribution", "downloadURL": "https://ndownloader.figshare.com/files/43757124", "format": "gz", "mediaType": "application/x-gzip", "title": "biocontrol_microbiome_analysis-biocontrol_microbiome.tar.gz" } ], "license": "https://www.usa.gov/publicdomain/label/1.0/", "bureauCode": [ "005:18" ], "modified": "2023-12-19", "publisher": { "@type": "org:Organization", "name": "Agricultural Research Service" }, "keyword": [ "Reproducible code", "16S and ITS amplicon", "microbiome analysis", "NP108", "data.gov", "ARS" ], "spatial": "{\"type\": \"Point\", \"coordinates\": [-91.169061, 30.361644]}" }, { "identifier": "10.15482/USDA.ADC/1527734", "accessLevel": "public", "contactPoint": { "hasEmail": "mailto:jessica.thomson@usda.gov", "fn": "Thomson, Jessica" }, "programCode": [ "005:040" ], "description": "The dataset contains information collected from 38 individuals residing in Mississippi, USA, who completed an online survey designed for small farmers in Mississippi and who fit the USDA definition of small farm (yearly gross cash farm income <$250,000). The survey was created using Snap Surveys Desktop software. Information includes farm products grown or raised, harvest months, produce amounts, farm certifications, internet use, selling practices, experience selling to K-12 schools, challenges selling to K-12 schools, and interest in farm to school (F2S) activities. Farmer demographic characteristics collected include gender, age, ethnicity/race, marital status, and education level. The data was collected from October 2021 to January 2022 using an online mobile and secure survey management system called Snap Online. The data were collected to obtain updated demographic and farm characteristics from small farmers in Mississippi and to determine their current abilities, experiences, and desires to engage in F2S activities. The dataset can be used to learn about small farmers in Mississippi but results should not be generalized to all small farmers in Mississippi or elsewhere in the USA.
Resource Title: Mississippi Farm to School Small Farmer Data Dictionary.
File Name: MS F2S Farmer Data Dictionary Public.csv
Resource Description: The file contains information for variables contained in the associated dataset including names, brief descriptions, types, lengths, and values.
Resource Software Recommended: Microsoft Excel,url: https://www.microsoft.com/en-us/microsoft-365/excel
Resource Title: Mississippi Farm to School Small Farmer Dataset.
File Name: MS F2S Farmer Data Public.csv
Resource Description: The dataset contains information collected from 38 small farmers in Mississippi regarding their experience with and interest in farm to school. It also contains demographic characteristics of the farmers and products grown or raised on their farms.
Resource Software Recommended: Microsoft Excel ,url: https://www.microsoft.com/en-us/microsoft-365/excel
Data collected by Sabita Ranabhat from early Sep 2020 - Jun 2021. It consists of two experiments: one evaluating mobility of Tribolium castaneum and Rhyzopertha dominica after exposure to differently formulated controlled release materials for 0-60 min, and a second experiment looking at median lethal time after exposure to cheesecloth treated with permethrin, deltamethrin, indoxacarb, and dinotefuran between 0-168 h. Tested strains include phosphine-resistant and phosphine-susceptible populations.
Resource Title: Mobility experiment data .
File Name: ranabhat_mobility_data_ag_data_commons.csv
Resource Description: Treatments\nTwo different controlled release materials (CRMs) were used, including insecticide netting and insecticide-incorporated packaging. In total, there were six treatments, including: packaging (Vestergaard SA., Lausanne, Switzerland) with either 0.1% (w/w AI) indoxacarb, 0.1% permethrin, or 0.2% dinotefuran, or no AI but identical physical properties, and long-lasting insecticide-incorporated polyethylene netting (2 × 2 mm mesh, Vestergaard SA., Lausanne, Switzerland) with 0.4% deltamethrin, or control netting without insecticide but otherwise identical in physical properties. These were used with the movement assay.\nMixed-sex adult beetles were exposed to the CRMs mentioned above. Cohorts of 5–20 adults were exposed for 0.5, 2, or 60-min interval on CRMs affixed to a 24 × 24 cm2 petri dish in the laboratory. After exposure, effects of the insecticides on adults were assessed either immediately or after held for 24 or 168 h in petri dishes under the same environmental chamber conditions as the colonies but without supplemental food, and then assayed using the video-tracking system described below. The movement of adults was tracked in six individual petri dishes (100 × 15 mm D: H) with a piece of filter paper (85 mm D, Grade 1, GE Healthcare, Buckinghamshire, United Kingdom) lining the bottom for 1 h using a network camera (GigE, Basler AG, Ahrenburg, Germany) affixed 80 cm above the dishes. The petri dishes were backlit using a LED light box (42 × 30 cm W:L, LPB3, Litup, Shenzhen, China) to increase contrast and affixed in place with white foam board.\nVideo was streamed to a computer and processed in Ethovision (v.14.0, Noldus Inc., Leesburg, VA). The program automatically calculated the total distance moved (cm) and the mean instantaneous velocity (cm/s) over the 1-h period for each adult. An input filter was created that specific distance was only accumulated if it was less than the length of two beetles (~8 mm) per 0.03 s to avoid cursor bounce. Each adult was considered a replicate and was never used more than once. Only adults classified as alive or affected (as defined in Morrison et al. 2018) were used in the assay. Briefly, alive adults were defined as moving with normal speed and activity and able to right themselves if flipped, while affected adults exhibited sluggish or drunken movements, could not right themselves if flipped, and some or all of their limbs exhibited twitching. Dead adults were completely immobile. In total, 15 replicates were performed per treatment combination, translating to 97,200 min of video for a total of 1,620 adults tested for each species.
\nResource Software Recommended: Excel,url: https://www.microsoft.com/en-us/microsoft-365/excel
Resource Title: Lethality data on cheesecloth experiment - Tribolium castaneum .
File Name: ranabhat_lethality_cheesecloth_exp_tc_ag_data_commons.csv
Resource Description: In order to evaluate whether the CRMs be more effective at higher concentrations of each AI, we used cheesecloth (100 % cotton, Loins Services, Inc. Charlotte, NC) as a common CRM surrogate material sprayed with technical grade AIs dissolved with acetone. We prepared solutions (containing 1% of each AI above) with each technical grade insecticide in acetone (Table 1) and sprayed 2 ml of each insecticide solution uniformly on glass petri dishes (5 cm diameter) containing a 4.8 cm diameter piece cheesecloth by using an artist’s airbrush sprayer (Badger 100 series, Badger Corporation, Franklin Park, IL, US) which is commonly used in stored product insect research (e.g. Arthur and Morrison 2020; Morrison et al. 2021). A 1% concentration of AI was used to approximate the far higher concentration of AI in commercially available incorporated long-lasting materials compared to the concentration typically used in direct spray applications. The insecticide-treated cheesecloth was allowed to dry at room temperature overnight (~18 h) inside a fume hood to avoid affecting the behavior of insects.\nCohorts of 20 mixed-sex (~1:1 M: F sex ratio) adult beetles were exposed continuously up to 96 h or 1 weeks in the laboratory on cheesecloth (e.g., as an absorptive CRM surrogate material) at constant conditions (27.5° ± 0.1 C, 65% RH, 14:10 L:D) in an environmental chamber. Exposure times were added iteratively at the same 1% concentration to yield a sufficient number of points to calculate median lethal time (LT50) up to 1 week (Supplemental Table 1). At each time point, the condition of insects was checked, and rated as alive, affected, or dead condition for each of the different treatments. Dead insects were completely immobile, even after prodding, and were removed from the tested arenas, but retained in analyses. There were 4 replicate cohorts for each treatment combination of insecticide, exposure, phosphine susceptibility, and species.\n
Resource Software Recommended: Excel,url: https://www.microsoft.com/en-us/microsoft-365/excel
Resource Title: Lethality data on cheesecloth experiment - Rhyzopertha dominica.
File Name: ranabhat_lethality_cheesecloth_exp_rd_ag_data_commons.csv
Resource Description: In order to evaluate whether the CRMs be more effective at higher concentrations of each AI, we used cheesecloth (100 % cotton, Loins Services, Inc. Charlotte, NC) as a common CRM surrogate material sprayed with technical grade AIs dissolved with acetone. We prepared solutions (containing 1% of each AI above) with each technical grade insecticide in acetone (Table 1) and sprayed 2 ml of each insecticide solution uniformly on glass petri dishes (5 cm diameter) containing a 4.8 cm diameter piece cheesecloth by using an artist’s airbrush sprayer (Badger 100 series, Badger Corporation, Franklin Park, IL, US) which is commonly used in stored product insect research (e.g. Arthur and Morrison 2020; Morrison et al. 2021). A 1% concentration of AI was used to approximate the far higher concentration of AI in commercially available incorporated long-lasting materials compared to the concentration typically used in direct spray applications. The insecticide-treated cheesecloth was allowed to dry at room temperature overnight (~18 h) inside a fume hood to avoid affecting the behavior of insects.
\nCohorts of 20 mixed-sex (~1:1 M: F sex ratio) adult beetles were exposed continuously up to 96 h or 1 weeks in the laboratory on cheesecloth (e.g., as an absorptive CRM surrogate material) at constant conditions (27.5° ± 0.1 C, 65% RH, 14:10 L:D) in an environmental chamber. Exposure times were added iteratively at the same 1% concentration to yield a sufficient number of points to calculate median lethal time (LT50) up to 1 week (Supplemental Table 1). At each time point, the condition of insects was checked, and rated as alive, affected, or dead condition according to the definitions in (Morrison et al. 2018) for each of the different treatments. Dead insects were completely immobile, even after prodding, and were removed from the tested arenas, but retained in analyses. There were 4 replicate cohorts for each treatment combination of insecticide, exposure, phosphine susceptibility, and species.
Resource Software Recommended: Excel,url: https://www.microsoft.com/en-us/microsoft-365/excel
This dataset contains the spatiotemporal data used to train the spatiotemporal deep neural networks described in \"Modeling the Spread of a Livestock Disease With Semi-Supervised Spatiotemporal Deep Neural Networks\". The dataset consists of two sets of NumPy arrays. The first set: X_grid.npy and Y_grid.npy were used to train the convolutional LSTM, while the second set: X_graph.npy, Y_graph.npy, and edge_index.npy were used to train the graph convolutional LSTM. The data consists of spatiotemporally varying environmental and anthropogenic variables along with case reports of vesicular stomatitis.
Resource Title: NumPy Arrays of Spatiotemporal Features and VS Cases.
File Name: vs_data.zip
Resource Description: This is a ZIP archive containing five NumPy arrays of spatiotemporal features and geotagged VS cases.
Resource Software Recommended: NumPy,url: https://numpy.org/
In vitro study of the effects on the human gut microbiota of lemon pectins with two different molecular weights and having varying degrees of esterification. Data collected following incubations include: amplicon sequencing of the V1-V2 regions of the 16S rRNA gene (found in the NCBI Sequence Read Archive associated with BioProject PRJNA903836: https://www.ncbi.nlm.nih.gov/bioproject/PRJNA903836), RT-qPCR of Bifidobaterium sp. 16S rRNA genes, and short-chain fatty acid concentrations.
\nResources in this dataset:
\nResource Title: Short Chain Fatty Acid concentrations\nFile Name: pectin_SCFA_data.csv
\nResource Title: Pectin_total_bacterial_qPCR_data\nFile Name: pectin_total_bacterial_qPCR_data.csv
\nResource Title: Pectin_bifidobacterium_genus_qPCR_data\nFile Name: pectin_bifidobacterium_genus_qPCR_data.csv
\nResource Title: Sample metadata
\nFile Name: pectin_sample_attributes.csv
\nThe generic placement of the strawberry leaf blight fungus, formerly known as Phomopsis obscurans has always been subject to uncertainty. These datasets provide the phylogenetic evidence based on four DNA markers (28S rDNA/LSU, ITS, TEF1 and RPB2) that support the establishment of a monotypic new fungal genus Paraphomopsis. Datasets include the single gene sequence alignments for the LSU, ITS, TEF1 and RPB2 markers, and the complete combined phylogenetic dataset and phylogenetic tree files for each single gene and combined analysis. The updated multi-gene datasets and trees for the Diaporthales provide the evidence to distinguish the leaf blight pathogen (Paraphomopsis obscurans) from the taxa associated with leaf blotch (Gnomoniopsis fragariae) and petiole blight and root rot (Paragnomonia fragariae).
Resource Title: Combined LSU_ITS_RPB_TEF1 DNA sequence alignment_Diaporthales.
File Name: 1_Combined_LSU_ITS_RPB_TEF1_DNA sequence alignment_Diaporthales.txt
Resource Title: Combined LSU_ITS_RPB_TEF1 ML tree Diaporthales.
File Name: 2_Combined tree_LSU_ITS_RPB_TEF1_ML tree_Diaporthales.txt
Resource Title: ITS_DNA sequence alignment Diaporthales.
File Name: 3_ITS_DNA sequence alignment_Diaporthales.txt
Resource Title: ITS single gene ML tree Diaporthales.
File Name: 4_ITS_single gene ML tree_Diaporthales.txt
Resource Title: LSU_DNA sequence alignment Diaporthales.
File Name: 5_LSU_DNA sequence alignment_Diaporthales.txt
Resource Title: LSU_single gene ML tree Diaporthales.
File Name: 6_LSU_single gene ML tree_Diaporthales.txt
Resource Title: RPB2_DNA sequence alignment Diaporthales.
File Name: 7_RPB2_DNA sequence alignment_Diaporthales.txt
Resource Title: RPB2_single gene ML tree Diaporthales.
File Name: 8_RPB2_single gene ML tree_Diaporthales.txt
Resource Title: TEF1_DNA sequence alignment Diaporthales.
File Name: 9_TEF1_DNA sequence alignment_Diaporthales.txt
Resource Title: TEF1_single gene ML tree Diaporthales.
File Name: 10_TEF1_single gene ML tree_Diaporthales.txt
Tabular data from the manuscript \"Monitoring standing herbaceous biomass and thresholds in semiarid rangelands from harmonized Landsat 8 and Sentinel-2 imagery to support within-season adaptive management\" published in the journal Remote Sensing of Environment. Data are plot-scale values of (1) ground-sampled herbaceous standing biomass estimated using visual obstruction (VO) methods, (2) ground sampled percent cover by vegetation type using the line-point intercept (LPI) method, (3) percent midgrass derived from hyperspectral aerial imagery (1 m) collected by the NEON AOP (see Gaffney et al. 2021 cited within the manuscript), and (4) satellite-derived indices and bands. Only seasonal data used to develop the standing biomass model is included. The bounding box coordinates of each plot are also included.
Resource Title: Tabular ground and satellite-derived data.
File Name: Kearney_Biomass_from_HLS_data.csv
Resource Description: Seasonal plot-scale tabular ground and satellite-derived data along with four fields (minx, miny, etc.) for the bounding box of the plots (EPSG:32613 - UTM 13N, WGS 84). Data includes (1) ground-sampled biomass estimate using visual obstruction (VO) poles, (2) ground sampled vegetation cover estimated using the line-point intercept (LPI) method, (3) percent mid-grass estimated from a plant community map derived from hyperspectral aerial imagery (1 m) acquired by the NEON AOP, (4) satellite-derived indices and bands interpolated daily from the Harmonized Landsat-Sentinel (HLS) dataset (30 m). See Metadata_column_headers.csv for descriptions of the fields (columns) in this dataset.
Resource Title: Metadata: Description of column headers for tabular dataset.
File Name: Kearney_Biomass_from_HLS_data_metadata.csv
Resource Description: Descriptions of each field (column) in the tabular dataset.
Field-based, partial life table data for immature stages of silverleaf whitefly, Bemisia argentifolii, on 6 host plants including alfalfa, broccoli, spring and fall cantaloupe, cotton, ornamental lantana, and several species of annual weeds in Maricopa, Marana and Yuma Arizona, USA. Data were collected on a total of 73 individual cohorts (each replicated 4 times) from November 2000 to April 2003 at all three study sites. For each cohort, data were generated on approximately 400 individual insects (200 eggs and 200 first instar nymphs). Data provide the marginal, cause-specific mortality for eggs, and 1st, 2nd, 3rd, and 4th instar nymphs collectively and stage-specific marginal mortality for each stage over all causes. Mortality was characterized as caused by inviability (eggs only), dislodgement, predation, parasitism (nymphs only), desiccation, and unknown. Detailed methods can be found in Naranjo and Ellsworth 2005 (Entomologia Experimentalis et Applicata 116(2): 93-108; https://doi.org/10.1111/j.1570-7458.2005.00297.x ; and Naranjo and Ellsworth 2017 (Journal of Visualized Experiments, 129; https://doi.org/10.3791/56150). The method takes advantage of the sessile nature of immature stages of this insect. Briefly, an observer follows individual eggs or settled first instar nymphs from natural populations on the underside of host plant leaves in the field with a hand lens and determines causes of death for each individual over time. Weather data was monitored using the University of Arizona AzMet system. Note that these life table data do not include adult mortality or reproduction. The life table data were used to generate survivorship curves for each cohort on each host plant based on a physiological time scale of accumulated degree-days above 10C from the initiation of each cohort.
Resource Title: Mortality causes over all immature life stages.
File Name: MortalityCause.xlsx
Resource Description: Data of mortality causes over all immature life stages.
Resource Title: Mortality of each immature life stage over all causes.
File Name: MortalityStage.xlsx
Resource Description: Data for mortality of each immature life stage over all causes.
Resource Title: Data for pest survivorship curves on each host plant.
File Name: SurvivalCurves.xlsx
Resource Description: Data to generate survivorship curves for pest on each host plant.
This dataset consists of four sets of flower images, from three different species: apple, peach, and pear, and accompanying ground truth images. The images were acquired under a range of imaging conditions. These datasets support work in an accompanying paper that demonstrates a flower identification algorithm that is robust to uncontrolled environments and applicable to different flower species. While this data is primarily provided to support that paper, other researchers interested in flower detection may also use the dataset to develop new algorithms. Flower detection is a problem of interest in orchard crops because it is related to management of fruit load.
\nFunding provided through ARS Integrated Orchard Management and Automation for Deciduous Tree Fruit Crops.
Resource Title: AppleA images.
File Name: AppleA.zip
Resource Description: 147 images of an apple tree in bloom acquired with a Canon EOS 60D.
Resource Title: Training image names from Apple A dataset.
File Name: train.txt
Resource Description: This is a list of filenames used in training; see related paper for details.
Resource Title: AppleA labels.
File Name: AppleA_Labels.zip
Resource Description: Binary images for the Apple A set, where white represents flower pixels and black, non-flower pixels.
\nJune 25, 2018: 5 files added: 275.png, 316.png, 328.png, 336.png, 369.png.
Resource Title: Validation image names from Apple A dataset.
File Name: val.txt
Resource Description: This is a list of filenames used in testing; see related paper for details.
\nJune 25, 2018: 5 filenames added.
\nIMG_0275.JPG\nIMG_0316.JPG\nIMG_0328.JPG\nIMG_0336.JPG\nIMG_0369.JPG
Resource Title: AppleB images.
File Name: AppleB.zip
Resource Description: 15 images of an apple tree in bloom acquired with a GoPro HERO 5.
\nJune 25, 2018: 3 files added.\n23.bmp\n28.bmp\n42.bmp
Resource Title: AppleB labels.
File Name: AppleB_Labels.zip
Resource Description: Binary images for the Apple B set, where white represents flower pixels and black, non-flower pixels.
\nJune 25, 2018: 3 files added.\n23.bmp\n28.bmp\n42.bmp
Resource Title: Peach.
File Name: Peach.zip
Resource Description: 20 images of an peach tree in bloom acquired with a GoPro HERO 5.
\nJune 25, 2018: 4 files added.\n14.bmp\n34.bmp\n40.bmp\n41.bmp
Resource Title: Peach labels.
File Name: PeachLabels.zip
Resource Description: Binary images for the Peach set, where white represents flower pixels and black, non-flower pixels.
\nJune 25, 2018: 4 files added.\n14.bmp\n34.bmp\n40.bmp\n41.bmp
Resource Title: Pear.
File Name: Pear.zip
Resource Description: 15 images of a free-standing pear tree in bloom, acquired with a GoPro HERO5.
\nJune 25, 2018: 3 files added.\n1_25.bmp\n1_62.bmp\n2_28.bmp
Resource Title: Pear labels.
File Name: PearLabels.zip
Resource Description: Binary images for the pear set, where white represents flower pixels and black, non-flower pixels.
\nJune 25, 2018: 3 files added.\n1_25.bmp\n1_62.bmp\n2_28.bmp
Resource Title: Apple A Labeled images from training set .
File Name: AppleALabels_Train.zip
Resource Description: Binary images for the Apple A set, where white represents flower pixels and black, non-flower pixels. These images form the training set.\nResource added August 20, 2018. User noted that this resource was missing.
Huanglongbing (HLB) is one of the most destructive citrus diseases in the world. The disease is associated with the presence of a fastidious, phloem-limited α- proteobacterium, 'Candidatus Liberibacter asiaticus', 'Ca. Liberibacter africanus' or 'Ca. Liberibacter americanus'. HLB-associated Liberibacters have spread to North America and South America in recent years. While the causal agents of HLB have been putatively identified, information regarding the worldwide population structure and epidemiological relationships for 'Ca. L. asiaticus' is limited. The availability of the 'Ca. L. asiaticus' genome sequence has facilitated development of molecular markers from this bacterium. The objectives of this study were to develop microsatellite markers and conduct genetic analyses of 'Ca. L. asiaticus' from a worldwide collection. Two hundred eighty seven isolates from USA (Florida), Brazil, China, India, Cambodia, Vietnam, Taiwan, Thailand, and Japan were analyzed.
\nA panel of seven polymorphic microsatellite markers was developed for 'Ca. L. asiaticus'. Microsatellite analyses across the samples showed that the genetic diversity of 'Ca. L. asiaticus' is higher in Asia than Americas. UPGMA and STRUCTURE analyses identified three major genetic groups worldwide. Isolates from India were genetically distinct. East-southeast Asian and Brazilian isolates were generally included in the same group; a few members of this group were found in Florida, but the majority of the isolates from Florida were clustered separately. eBURST analysis predicted three founder haplotypes, which may have given rise to three groups worldwide.
\nResults identified three major genetic groups of 'Ca. L. asiaticus' worldwide. Isolates from Brazil showed similar genetic makeup with east-southeast Asian dominant group, suggesting the possibility of a common origin. However, most of the isolates recovered from Florida were clustered in a separate group. While the sources of the dominant 'Ca. L. asiaticus' in Florida were not clearly understood, the less-pervasive groups may have been introduced directly from Asia or via Brazil. Notably, the recent outbreak of HLB in Florida probably occurred through multiple introductions. Microsatellite markers developed in this study provide adequate discriminatory power for the identification and differentiation of closely-related isolates, as well as for genetic studies of 'Ca. L. asiaticus'.
\nThe supporting data provides sample and haplotype information for all isolates used in this study: Huanglongbing_Las-SSR-Genotype; Huanglongbing_GT-Populationwise; and Huanglongbing_Cln-Corrected-Dat.
Resource Title: Data Dictionary.
File Name: Huanglongbing_DataDictionary.csv
Resource Description: Defines variables and data types for CSV tables.
Resource Title: Las-SSR Genotype.
File Name: Huanglongbing_Las-SSR-Genotype.csv
Resource Description: Candidatus Liberibacter asiaticus Simple sequence repeats (SSRs)
Resource Title: GT-Populationwise.
File Name: Huanglongbing_GT-Populationwise.csv
Resource Description: Gene targeting (GT) population information for isolates.
Resource Title: Cln-Corrected-Data.
File Name: Huanglongbing_Cln-Corrected-Data.csv
Resource Description: A clone-corrected (removing repeated genotypes within a population) data set built and used for the analysis of genetic diversity, linkage disequilibrium and genetic structure.
Surface albedo determines radiative forcing and is a key parameter for driving Earth’s climate. Better characterization of surface albedo for individual land cover types can reduce the uncertainty in estimating changes to Earth’s radiation balance due to land cover change. The dataset includes albedo look-up maps (LUMs) using a multiscale hierarchical approach based on moderate resolution imaging spectroradiometer (MODIS) bidirectional reflectance distribution function (BRDF)/albedo products and Landsat imagery. Ten years (2001 to 2011) of MODIS BRDF/albedo products were used to generate global albedo climatology. Albedo LUMs of land cover classes defined by the International Geosphere-Biosphere Programme (IGBP) at multiple spatial resolutions were generated. The albedo LUMs included monthly statistics of white-sky (diffuse) and black-sky (direct) albedo for each IGBP class for visible, near-infrared, and shortwave broadband under both snow-free and snow-covered conditions. The LUMs provide high temporal and spatial resolution global albedo statistics without gaps for investigating albedo variations under different land cover scenarios and could be used for land surface modeling.
Resource Title: Multiscale climatological albedo look-up maps (LUMS).
File Name: Web Page, url: https://app.globus.org/file-manager?origin_id=e5391440-1d5e-11ec-a0a0-6b21ca6daf73&origin_path=/node35339/
The albedo look-up maps (LUMs) were built on moderate resolution imaging spectroradiometer (MODIS) bidirectional reflectance distribution function (BRDF)/albedo products and Landsat imagery. Ten years (2001 to 2011) of MODIS BRDF/albedo products were used to generate global albedo climatology.\nAlbedo LUMs of land cover classes defined by the International Geosphere-Biosphere Programme (IGBP) at multiple spatial resolutions were generated. The albedo LUMs included monthly statistics of white-sky (diffuse) and black-sky (direct) albedo for each IGBP class for visible, near-infrared, and shortwave broadband under both snow-free and snow-covered conditions.
\nThe zipped file includes:\nreadme.docx\nsnow_covered_hierarchical.v3.tar\nsnow_covered_LUM.v3.tar\nsnow_free_hierarchical.v3.tar\nsnow_free_LUM.v3.tar
\nThe .zip file can be accessed/retrieved with valid SCINet account at this location: /KEEP/ADCdatastorage/NAL/published/node35339/
\nSee the SCINet File Transfer guide for more information on moving large files: https://scinet.usda.gov/guides/data/datatransfer
\nGlobus users:\nThe files can also be accessed through Globus by following this data link. The user will need to log in to Globus in order to retrieve this data. User accounts are free of charge with several options for signing on. Instructions for creating an account are on the login page.
Data and supplemental figures for manuscript titled \"Net release and uptake of xenometabolites across intestinal, hepatic, muscle, and renal tissue beds in healthy conscious pigs.\" We used a catheterized conscious pig model to estimate inter-organ flux of xenometabolites, derivatives, and bile acids using LC/MS. Female pigs (n=12; 2-3 months old; 25.6 ± 2.2 kg) had surgically-implanted catheters across portal-drained viscera (PDV), splanchnic area (SPL), liver, kidney, and hindquarter muscle. Overnight fasted arterial and venous plasma was collected simultaneously in a conscious state and stored at -80°C. Thawed samples were analyzed by liquid chromatography-mass spectrometry. Plasma flow was determined with para-aminohippuric acid dilution technology and used to calculate net organ balance for each metabolite. This repository contains the LC/MS data and supplemental figures for the submitted manuscript.
Resource Title: Organ Net Balance Data for Mercer et al..
File Name: Mercer et al LCMS XM Organ Flux Data.xlsx
Resource Description: Calculated net balances for LC/MS data from Mercer et al.
Resource Title: LC/MS data for Mercer et al..
File Name: Mercer et al LCMS XM raw data.xlsx
Resource Description: LC/MS peak area data for xenometabolites in Mercer et al.
Resource Title: Mercer et al Supplemental Figure 2.
File Name: Mercer et al Fig S2.pdf
Resource Description: Supplemental Figure 2 for Mercer et al manuscript: Absolute differences of xenometabolites from catheter ports in conscious overnight-fasted female pigs (n=12). Sampling sites included arterial, venous, renal, portal, and hepatic placed catheters.
Resource Title: Mercer et al Supplemental Figure 1.
File Name: Mercer et al Fig S1.pdf
Resource Description: Supplemental Figure 1 for Mercer et al manuscript: Supplemental Figure 1: Inter-organ flux of all xenometablites in conscious overnight-fasted female pigs (n=12). A negative flux reflects net uptake (flux < 0; indicated by bottom arrow) by the organ, whereas a positive flux reflects a net release (flux > 0; indicated by top arrow) by the organ. Plasma flow measurements were determined with the para-aminohippuric acid dilution method, and were used along with metabolite concentrations to calculate flux (see Methods). R at top of arrow indicates ‘Release’, while U indicates ‘Uptake’.
Resource Title: Supplemental Table 1 for Mercer et al..
File Name: Mercer et al Table S1.xlsx
Resource Description: Mercer et al Supplemental Table 1: Raw differences of identified xenometabolites from port samples in conscious adult female pigs (n=10-12).
Data files for manuscript titled \"New Record of the Pavement Ant, Tetramorium immigrans (Hymenoptera: Formicidae), in South Dakota with Notes on its Thermal Tolerance and Geographic Distribution\".
Excel file with 7 tabs: Metadata; CTmin, CTmax, Knock-down, Chill coma, Specimen data, Observation data
Data description: Raw data for county observations/museum collections and thermal traits of Tetramorium immigrans. The data for observations/museum collections were collated from >100 years of publicly available information on the Global Biodiversity Information Facility (GBIF) and the Symbiota Collections of Arthropods Network (SCAN). Presence/absence values from these digital repositories were assigned to current county or county equivalent federal information processing system (FIPS) codes to create an updated distributional map. Thermal trait data that included critical thermal maximum and minimum, knock-down resistance, and chill coma recovery were empirically determined from specimens collected in Brookings, SD in 2022 and 2023. Methods for each assay are listed in the main text.
Abstract from paper: The pavement ant, Tetramorium immigrans Santschi, is an abundant and widespread species across large portions of the United States. Yet despite its current distribution in Northeastern, Midwestern, Pacific, and Western states, there is a surprising lack of records from the Great Plains. Here we present an updated county list of T. immigrans from museum collections and research grade observations (459 counties; ~15% of US counties), highlighting the first records from one Great Plains state—South Dakota. Observations on community science platforms since 2006 have undoubtedly increased the awareness of T. immigrans (+329 counties; ~72% of all county records), however we posit that such platforms may also highlight the dispersal limitations of this species into the less urban, colder Northern Great Plains states of Montana, Nebraska, North Dakota, South Dakota, and Wyoming (~5% of 291 counties). As such, we offer novel information on T. immigrans’ thermal biology including measurements of critical thermal limits, knock-down resistance, and chill coma recovery. While T. immigrans can likely tolerate the warm summer temperatures found in South Dakota due to its heat tolerance hovering around 46 °C, its lower ability to tolerate cold winter conditions may be a possible mechanism for its limited dispersal.
", "title": "Data from: New Record of the Pavement Ant, Tetramorium immigrans (Hymenoptera: Formicidae), in South Dakota with notes on its thermal tolerance and geographic distribution", "distribution": [ { "@type": "dcat:Distribution", "downloadURL": "https://ndownloader.figshare.com/files/45631584", "format": "xlsx", "mediaType": "application/vnd.openxmlformats-officedocument.spreadsheetml.sheet", "title": "Tetramorium immigrans MASTER data file.xlsx" } ], "license": "https://creativecommons.org/licenses/by/4.0/", "bureauCode": [ "005:18" ], "modified": "2024-04-18", "publisher": { "@type": "org:Organization", "name": "Agricultural Research Service" }, "keyword": [ "ants", "community science", "distribution record", "introduced species", "museum collections", "thermal biology" ] }, { "identifier": "10.15482/USDA.ADC/1522681", "accessLevel": "public", "contactPoint": { "hasEmail": "mailto:jian.duan@usda.gov", "fn": "Duan, Jian J." }, "programCode": [ "005:040" ], "description": "The data set is collected to evaluate if two parasitoids (Spathius galinae and Tetrastichus planipennisi), introduced for biocontrol of the invasive emerald ash borer (EAB), Agrilus planipennis, into North America have established niche-partitioning, co-existing populations following their sequential or simultaneous field releases to 12 hard-wood forests located in Midwest and Northeast regions of the United States. Ash trees of various sizes (large, pole-size and saplings) were debarked meter by meter in early spring of 2019 (Michigan sites) or fall of 2019 (Northeast states: Connecticut, Massachusetts and New York). Detailed data collection procedures can be found in the associated publication in Biological Control.
Resource Title: Niche partitioning and coexistence of parasitoids of the same feeding guild introduced for biological control of an invasive forest pest - Michigan data.
File Name: Michigan 2019-EAB Parasitoid Niche Partition-Raw.csv
Resource Description: Michigan Dataset
Resource Software Recommended: JMP,url: https://www.JMP.com
Resource Title: Niche partitioning and coexistence of parasitoids of the same feeding guild introduced for biological control of an invasive forest pest - Northeast states data.
File Name: NE Dataset 2019-EAB Parasitoid Niche Partition-Raw.csv
Resource Description: Northeast States Data set
Resource Title: Niche partitioning and coexistence of parasitoids of the same feeding guild introduced for biological control of an invasive forest pest - Data Dictionary.
File Name: Data Dictionary for Parasitoid niche partitioning study from Biological Control.docx
Resource Description: Data dictionary
Due to our increasing understanding of the role the surrounding landscape plays in ecological processes, a detailed characterization of land cover, including both agricultural and natural habitats, is ever more important for both researchers and conservation practitioners. Unfortunately, in the United States, different types of land cover data are split across thematic datasets that emphasize agricultural or natural vegetation, but not both. To address this data gap and reduce duplicative efforts in geospatial processing, we merged two major datasets, the LANDFIRE National Vegetation Classification (NVC) and USDA-NASS Cropland Data Layer (CDL), to produce integrated ‘Spatial Products for Agriculture and Nature’ (SPAN). Our workflow leveraged strengths of the NVC and the CDL to produce detailed rasters comprising both agricultural and natural land-cover classes. We generated SPAN for each year from 2012-2021 for the conterminous United States, quantified agreement between input layers and accuracy of our merged product, and published the complete workflow necessary to update SPAN. In our validation analyses, we found that approximately 5.5% of NVC agricultural pixels conflicted with the CDL, but we resolved a majority of these conflicts based on surrounding agricultural land, leaving only 0.6% of agricultural pixels unresolved in the final version of SPAN.
\nSpatial data
\nResources in this dataset:
\nResource Title: SPAN land cover in the conterminous United States: 2012-2021 - SCINet\nFile Name: KammererNationalRasters.zip\nResource Description: GeoTIFF rasters showing location of pixels that are mismatched between 2016 NVC and specific year of CDL (2012-2021). Spatial Products for Agriculture and Nature ('SPAN') land cover in the conterminous United States from 2012-2021. This raster dataset is available in GeoTIFF format and was created by joining agricultural classes from the USDA-NASS Cropland Data Layer (CDL) to national vegetation from the LANDFIRE National Vegetation Classification v2.0 ('Remap'). Pixels of national vegetation are the same in all rasters provided here and represent land cover in 2016. Agricultural pixels were taken from the CDL in the specified year, so depict agricultural land from 2012-2021.
\nResource Title: Rasters of pixels mismatched between CDL and NVC: 2012-2021 - SCINet\nFile Name: MismatchedNational.zip\nResource Description: GeoTIFF rasters showing location of pixels that are mismatched between 2016 NVC and specific year of CDL (2012-2021). This dataset includes pixels that were classified as agriculture in the NVC but, in the CDL, were not agriculture (or were a conflicting agricultural class). For more details, we refer users to the linked publication describing our geospatial processing and validation workflow.
Resource Title: SPAN land cover in the conterminous United States, & Rasters of pixels mismatched between CDL and NVC: 2012-2021 - SCINet.
File Name: Web Page, url: https://app.globus.org/file-manager?destination_id=e5391440-1d5e-11ec-a0a0-6b21ca6daf73&destination_path=/node455886/
Spatial Products for Agriculture and Nature ('SPAN') land cover in the conterminous United States from 2012-2021. This raster dataset is available in GeoTIFF format and was created by joining agricultural classes from the USDA-NASS Cropland Data Layer (CDL) to national vegetation from the LANDFIRE National Vegetation Classification v2.0 ('Remap'). Pixels of national vegetation are the same in all rasters provided here and represent land cover in 2016. Agricultural pixels were taken from the CDL in the specified year, so depict agricultural land from 2012-2021.
\nGeoTIFF rasters showing location of pixels that are mismatched between 2016 NVC and specific year of CDL (2012-2021). This dataset includes pixels that were classified as agriculture in the NVC but, in the CDL, were not agriculture (or were a conflicting agricultural class). For more details, we refer users to the linked publication describing our geospatial processing and validation workflow.
\nSCINet users:\nThe files can be accessed/retrieved with valid SCINet account at this location: /KEEP/ADCdatastorage/NAL/published/node455886/\nSee the SCINet File Transfer guide for more information on moving large files: https://scinet.usda.gov/guides/data/datatransfer
\nGlobus users:\nThe files can also be accessed through Globus by following this data link.The user will need to log in to Globus in order to retrieve this data. User accounts are free of charge with several options for signing on. Instructions for creating an account are on the login page.
\nDue to our increasing understanding of the role the surrounding landscape plays in ecological processes, a detailed characterization of land cover, including both agricultural and natural habitats, is ever more important for both researchers and conservation practitioners. Unfortunately, in the United States, different types of land cover data are split across thematic datasets that emphasize agricultural or natural vegetation, but not both. To address this data gap and reduce duplicative efforts in geospatial processing, we merged two major datasets, the LANDFIRE National Vegetation Classification (NVC) and USDA-NASS Cropland Data Layer (CDL), to produce an integrated land cover map. Our workflow leveraged strengths of the NVC and the CDL to produce detailed rasters comprising both agricultural and natural land-cover classes. We generated these maps for each year from 2012-2021 for the conterminous United States, quantified agreement between input layers and accuracy of our merged product, and published the complete workflow necessary to update these data. In our validation analyses, we found that approximately 5.5% of NVC agricultural pixels conflicted with the CDL, but we resolved a majority of these conflicts based on surrounding agricultural land, leaving only 0.6% of agricultural pixels unresolved in our merged product.
\nSpatial data
\nTechnical validation data
\nResource Title: Attribute table for merged rasters.
File Name: CombinedRasterAttributeTable_CDLNVC.csv
Resource Description: Raster attribute table for merged raster product. Class names and recommended color map were taken from USDA-NASS Cropland Data Layer and LANDFIRE National Vegetation Classification. Class values are also identical to source data, except classes from the CDL are now negative values to avoid overlapping NVC values.
Resource Title: Number and proportion of mismatched pixels.
File Name: pixel_mismatch_byyear_bycounty.csv
Resource Description: Number and proportion of pixels that were mismatched between the Cropland Data Layer and National Vegetation Classification, per year from 2012-2021, per county in the conterminous United States.
Resource Title: Number and proportion of unresolved pixels.
File Name: unresolved_conflict_byyear_bycounty.csv
Resource Description: Number and proportion of unresolved pixels in the final merged rasters, per year from 2012-2021, per county in the conterminous United States. Unresolved pixels are a result of mismatched pixels that we could not resolve based on surrounding agricultural land (no agriculture with 90m radius).
Resource Title: Producer's and User's accuracy values and coverage of reference data.
File Name: accuracy_datacoverage_byyear_bycounty.csv
Resource Description: Producer's and User's accuracy values and coverage of reference data, per year from 2012-2021, per county in the conterminous United States. We defined coverage of reference data as the proportional area of land cover classes that were included in the reference data published by USDA-NASS and LANDFIRE for the Cropland Data Layer and National Vegetation Classification, respectively. CDL and NVC classes with reference data also had published accuracy statistics.
Resource Title: Data Dictionary.
File Name: Data_Dictionary_RasterMerge.csv
Here we explore the incidence and abundance of currently known honey bee pathogens in colonies suffering from Colony Collapse Disorder (CCD), otherwise weak colonies, and strong colonies from across the United States. This data set was generated in order to use deep RNA sequencing to further characterize microbial diversity in CCD and non-CCD hives. We identified novel strains of the recently described Lake Sinai viruses (LSV) and found evidence of a shift in gut bacterial composition that may be a biomarker of CCD. The results are discussed with respect to host-parasite interactions and other environmental stressors of honey bees.
\nRNA was pooled by combining equal aliquots from each CCD or non-CCD colony described above. Five µg of RNA from the “CCD−” pool was used to generate cDNA using a cocktail of random heptamer primers. cDNA was size-selected from agarose and end-polished with End Repair Enzyme (Illumina) following manufacturer protocols. A 3′ polyadenine tract was then added with Klenow fragment (Invitrogen) and the products purified with a Qiaquick DNA purification column (Qiagen). Illumina adapters were ligated to cDNA with T4 DNA ligase and the products were amplified under the following thermocycler conditions: an initial denaturing step at 98°C for 30 seconds, followed by 14 cycles at 98°C for 30 seconds, 65°C for 30 seconds, and 72°C for 30 seconds. Final products of 100–300 bp were size-selected from agarose and sequenced on an Illumina Genome Analyzer by the Institute for Genome Sciences, University of Maryland, Baltimore.
\nEquivalently prepared cDNA from the “CCD+” pool was sequenced using a paired-end strategy with a 350-bp fragment size. A paired-end approach facilitates the assembly of longer contigs, and therefore may provide more diagnostic sequences for annotation, but at a cost of reduced read length (67 bp). Both sequencing runs were quality-trimmed by retaining only the longest contiguous sequence of each read with a minimum (Phred-equivalent) quality score of 15, excepting at most one ambiguous base. Reads less than 50 bp after this trimming step were discarded. A small number of reads were removed because they matched Illumina primer sequence in the Univec database (www.ncbi.nlm.nih.gov/VecScreen/UniVec.html).
\nReads were assembled into contigs using the Velvet assembly package [24]. CCD− reads were assembled into contigs using multiple iterations of Velvet with successive hash lengths of 21, 31, 41, 51, or 61. Contigs of less than 100 bp or with less than 3X coverage were discarded. This assembly strategy was chosen to accommodate the broad spectrum of RNA sources in the sample (viruses, a diverse bacterial community, and eukaryotic pathogens as well as the host genome) that are likely to have different optimal hash lengths for assembly. CCD+ reads were assembled in a similar fashion without read-pair information; in addition, a single paired-end assembly was performed with Velvet using a hash length of 21 and an expected fragment length of 350. Contigs from all intermediate assemblies were then merged using the BlastClust component of Basic Local Alignment Search Tool (BLAST) at 98% identity and 90% nonreciprocal overlap. Because there was substantial redundancy of contigs remaining after this step, we input the contigs to CAP3 [25] for more aggressive assembly, requiring a 60-bp overlap with 92% identity. Raw reads are available as accessions SRX028143 and SRX028145 of the National Center for Biotechnology Information (NCBI) Sequence Read Archive, however, the resulting contigs were not submitted because of an NCBI policy against hosting assemblies from mixed sources.
\nHighlight photo credit:
Image D2368-2 - Honey bee landing on a watermelon flower: Copyright free, public domain photo by Stephen Ausmus
Resource Title: cDNA contigs resulting from assembly of Illumina sequence reads for Pathogen Webs in Collapsing Honey Bee Colonies.
File Name: Web Page, url: http://journals.plos.org/plosone/article/asset?unique&id=info:doi/10.1371/journal.pone.0043562.s003
This is File S2 of the supplemental data with Cornman, R. S., Tarpy, D. R., Chen, Y., Jeffreys, L., Lopez, D., Pettis, J. S., … Evans, J. D. (2012). Pathogen webs in collapsing honey bee colonies. PloS One, 7(8), e43562. doi:10.1371/journal.pone.0043562 http://handle.nal.usda.gov/10113/60548
\nThis is USDA-ARS data from the publication: \"Performance of a cotton gin machine that removes plastic contamination from seed cotton.\" The study was conducted during the Fall of 2020 with continued data analysis thru September 2021. Plastic contamination is the most pressing issue for the U.S. cotton industry today. Due to this problem, U.S. cotton has lost the 7 cents per pound premium it brought on international cotton markets. Plastic contaminants are often introduced prior to ginning, but cotton gin machinery can tear and shred the plastics so that they become more difficult to remove. A cotton gin machine developed and used to combat the plastic contamination problem in Chinese cotton was tested to compare its performance at removing typical plastics found in U.S. cotton to that of conventional cotton gin seed cotton cleaners.
", "title": "Data from: Performance of a cotton gin machine that removes plastic contamination from seed cotton", "distribution": [ { "@type": "dcat:Distribution", "downloadURL": "https://ndownloader.figshare.com/files/44541251", "format": "csv", "mediaType": "application/csv", "title": "PlasticExtraction_0.csv" }, { "@type": "dcat:Distribution", "downloadURL": "https://ndownloader.figshare.com/files/44541254", "format": "txt", "mediaType": "text/plain", "title": "Column Descriptions.txt" } ], "license": "https://www.usa.gov/publicdomain/label/1.0/", "bureauCode": [ "005:18" ], "modified": "2024-02-15", "publisher": { "@type": "org:Organization", "name": "Agricultural Research Service" }, "keyword": [ "cotton gin", "cotton fiber", "contamination", "plastic", "machinery", "extraction", "NP306", "data.gov", "ARS" ], "spatial": "{\"type\": \"Polygon\", \"coordinates\": [[[-124.453125, 42.170528528061], [-115.13671875, 35.396886504016], [-114.43359375, 36.957573768787], [-108.6328125, 37.447606324817], [-103.18359375, 36.816980842337], [-101.865234375, 40.119040222689], [-95.888671875, 40.051796406417], [-93.8671875, 36.887309668681], [-75.5859375, 36.746587336189], [-82.880859375, 30.608367857219], [-79.6728515625, 25.447614873538], [-81.6064453125, 24.850926880672], [-83.8037109375, 29.844813048036], [-87.6708984375, 30.679849251319], [-90.263671875, 29.997165057921], [-90.263671875, 29.348065127939], [-93.8232421875, 30.22525502693], [-97.4267578125, 25.883318831597], [-102.3046875, 29.501171015369], [-103.0517578125, 29.002735664126], [-104.58984375, 29.806688644587], [-108.017578125, 31.436865467418], [-113.02734375, 32.034855873239], [-115.13671875, 32.628966456079], [-117.35595703125, 32.585874299227], [-122.607421875, 37.02777309665], [-124.62890625, 40.920776739866], [-124.453125, 42.170528528061]]]}" }, { "identifier": "10.15482/USDA.ADC/1529138", "accessLevel": "public", "contactPoint": { "hasEmail": "mailto:adrienne.narrowe@usda.gov", "fn": "Narrowe, Adrienne" }, "programCode": [ "005:040" ], "description": "Using the SHIME (an in vitro simulator of the human gut microbiome) we tracked the fate of the probiotic Lacticaseibacillus rhamnosus GG (LGG) over time and across colonic regions. Using fecal inoculum from three healthy human donors, reactors were established representing three colonic regions and both the luminal and mucosal microbiome in those regions. Community composition before, during, and after inoculation of the reactors with LGG as well as short chain fatty acid concentrations representing microbiome metabolic outputs. This dataset includes short-chain fatty acid concentrations and qPCR-based cell concentrations. Raw 16S rRNA amplicon sequencing of the V1-V2 regions can be found in the NCBI Sequence Read Archive associated with BioProject PRJNA893635: https://www.ncbi.nlm.nih.gov/bioproject/PRJNA893635.
\nResources in this dataset:
\nResource Title: Short Chain Fatty Acid concentrations\nFile Name: LGG_SCFA_data.csv
\nResource Title: LGG qPCR concentrations\nFile Name: LGG_qPCR_data.csv
\nResource Title: Sample metadata\nFile Name: LGG_16S_metadata.csv
\nHigh-throughput sequencing (HTS) of reduced representation genomic libraries has ushered in an era of genotyping-by-sequencing (GBS), where genome-wide genotype data can be obtained for nearly any species. However, there remains a need for imputation-free GBS methods for genotyping large samples taken from heterogeneous populations of heterozygous individuals. This requires that a number of issues encountered with GBS be considered, including the sequencing of nonoverlapping sets of loci across multiple GBS libraries, a common missing data problem that results in low call rates for markers per individual, and a tendency for applicability only in inbred line samples with sufficient linkage disequilibrium for accurate imputation. We addressed these issues while developing and validating a new, comprehensive platform for GBS. This study supports the notion that GBS can be tailored to particular aims, and using Zea mays our results indicate that large samples of unknown pedigree can be genotyped to obtain complete and accurate GBS data. Optimizing size selection to sequence a high proportion of shared loci among individuals in different libraries and using simple in silico filters, a GBS procedure was established that produces high call rates per marker (>85%) with accuracy exceeding 99.4%. Furthermore, by capitalizing on the sequence-read structure of GBS data (stacks of reads), a new tool for resolving local haplotypes and scoring phased genotypes was developed, a feature that is not available in many GBS pipelines. Using local haplotypes reduces the marker dimensionality of the genotype matrix while increasing the informativeness of the data. Phased GBS in maize also revealed the existence of reproducibly inaccurate (apparent accuracy) genotypes that were due to divergent copy number variants (CNVs) unobservable in the underlying single nucleotide polymorphism (SNP) data.
Resource Title: Supplementary Data.
File Name: Web Page, url: https://academic.oup.com/g3journal/article/7/7/2161/6053605#supplementary-data
For this study, 737 sweetpotato accessions were obtained from the USDA, Agricultural Research Service, PGRCU (Plant Genetic Resources Conservation Unit), Griffin, GA. Each PI was grown in the field in replicated plots at the U. S. Vegetable Laboratory, Charleston, SC. The mature leaves of each PI were evaluated for morphological characters.
Resource Title: Sweetpotato Leaf Descriptor - Raw Data.
File Name: Sweetpotato-Leaf-Descriptor-Raw Data.xlsx
Resource Title: Sweetpotato Leaf Descriptors - Summary Table.
File Name: Sweetpotato-Leaf-Descriptor-Summary Table.xlsx
Resource Title: Sweetpotato Leaf Petiole Length - Raw Data.
File Name: Sweetpotato-Leaf Petiole Length-Raw Data.xlsx
Resource Title: Sweetpotato Leaf Petiole Length - Summary Table.
File Name: Sweetpotato-Leaf Petiole Length-Summary.xlsx
Resource Title: Sweetpotato Vine Length, Canopy Coverage - Raw Data.
File Name: Sweetpotato-Vine Length, Canopy Rating -Raw Data.xlsx
Resource Title: Sweetpotato Vine Length, Canopy Coverage - Summary Table.
File Name: Sweetpotato-Vine Length, Canopy Rating - Summary.xlsx
Resource Title: Sweetpotato Vine Length, Canopy Coverage - Raw Data .
File Name: Sweetpotato-Vine Length, Canopy Rating -Raw Data.csv
Resource Title: Sweetpotato Vine Length, Canopy Coverage - Summary Table.
File Name: Sweetpotato-Vine Length, Canopy Rating - Summary.csv
Resource Title: Sweetpotato Leaf Petiole Length - Summary Table.
File Name: Sweetpotato-Leaf Petiole Length-Summary.csv
Resource Title: Sweetpotato Leaf Petiole Length - Raw Data.
File Name: Sweetpotato-Leaf Petiole Length-Raw Data.csv
Resource Title: Sweetpotato Leaf Descriptors - Summary Table.
File Name: Sweetpotato-Leaf-Descriptor-Summary Table.csv
Resource Title: Sweetpotato Leaf Descriptor - Raw Data.
File Name: Sweetpotato-Leaf-Descriptor-Raw Data.csv
Resource Title: Data Dictionary.
File Name: Data Dictionary - Phenotypic Variation in Leaf Morphology of the USDA-ARS Sweetpotato Germplasm Collection.csv
Phenotypic evaluation of 37 crimson clover (Trifolium incarnatum L.) accessions from the US National Plant Germplasm System. Focus of the trial was on traits important for cover crop performance, including fall emergence, winter survival, flowering time, biomass, nitrogen (N) content in aboveground biomass, and proportion of plant N from biological nitrogen fixation (BNF). Experiments were conducted at the Beltsville Agricultural Research Center (Maryland, USA) across three growing seasons (2012-2013, 2013-2014, 2014-2015).
\nThe field design was a randomized complete block design (RCBD) with four replications in each year, except for five accessions planted in 2015, which only had three replications due to limited seed availability. Each plot was a single row 0.6 m in length and 1.5 m between plots. Between 37 and 45 seeds were planted per plot, depending on seed availability in each year.
\nFall emergence was evaluated in late October of each year by counting the total number of plants in each plot. Winter survival was determined by counting total number of plants per plot in late April divided by the total number of plants counted in the fall.
\nFlowering time was evaluated by recording percent flowering on a per-plot basis on a scale from 0% (no flower buds present) to 100% (all flowers dried up entire length of head). Flowering evaluations took place periodically between late April and early June. In 2013, evaluation took place on six dates: 23 Apr., 9 May, 15 May, 24 May, 30 May, and 4 June. In 2014, evaluation took place on five dates: 28 Apr., 6 May, 13 May, 19 May, and 27 May. In 2015, evaluation took place on eight dates: 25 Apr., 29 Apr., 4 May, 7 May, 11 May, 14 May, 18 May, and 21 May. Frequency of evaluations and total duration of evaluation period varied from year-to-year primarily due to the effects of year-to-year weather variation on the rate of growth and development.
\nOnce an accession was rated at 50% or greater for flowering, biomass was collected. All plants in the plot were pulled up with roots attached. Plants were counted and the roots were clipped. All plants within a plot were placed in the same brown paper bag and dried. Dry weight was recorded and plants were ground for laboratory evaluation of nitrogen content, proportion of nitrogen from BNF, and metagenomic analysis.
\nThe crimson clover biomass samples were separated into shoots and roots. Shoots were oven dried (60 °C) for approximately 72 h, weighed, and ground to pass a 1.0-mm screen. Tissue C and N concentrations and 15N natural abundance were determined for the shoot material of each accession using a Thermo Delta V Isotope Ratio Mass Spectrometer (Thermo Scientific, Waltham, MA) and Carlo Erba NC2500 Elemental Analyzer (Carlo Erba, Milan, Italy). Isotopic abundance data were expressed as δ15N in parts per thousand (‰), representing the abundance of plant tissue 15N relative to that of atmospheric N2.
Resource Title: Biomass Data.
File Name: biomass.csv
Resource Description: Year: Year of biomass harvest\nRep: Replicate\nPI: Accession number in National Plant Germplasm System (NPGS) database\nbm_per_plant: Dry biomass per plant (g)
Resource Title: N Content.
File Name: n_content.csv
Resource Description: Year: Year of biomass harvest\nRep: Replicate\nPI: Accession number in National Plant Germplasm System (NPGS) database\npctN: Percent N content in above-ground biomass\npctfromBNF: Percent of plant N from biological nitrogen fixation (BNF)
Resource Title: Emergence and Survival.
File Name: survival_emergence.csv
Resource Description: Year: Year of biomass harvest\nRep: Replicate\nPI: Accession number in National Plant Germplasm System (NPGS) database\nsurvival: Spring survival as a proportion of fall-emerged plants\nemergence: Fall emergence as a proportion of seeds planted
Resource Title: Time to Flowering.
File Name: time_to_flowering.csv
Resource Description: Year: Year of biomass harvest\nRep: Replicate\nPI: Accession number in National Plant Germplasm System (NPGS) database\ngddto25: Growing degree days (GDD) to 25% flowering, calculated using a base temperature of 0C
Resource Title: CCAT analysis code.
File Name: CCAT code.txt
Resource Description: R code for analysis of dataset
Resource Software Recommended: R version 3.6.1,url: https://www.r-project.org/
Note: This version supersedes version 1: https://doi.org/10.15482/USDA.ADC/1523127
\nChanges to data in version 2: Values of latitude and longitude were reversed in version 1 and have been corrected. Columns containing latitude and longitude in decimal degrees have been added. A sentence describing the sampling has been edited in the metadata tab.
\nDescription:\nAs part of a study identifying relationships between environmental variables and insect distributions within a bioenergy crop, giant miscanthus (Miscanthus x giganteus) samples were collected in October 2016 at 33 locations within a field in southeast Georgia, USA. At each location, one plant sample was collected every meter along a 5-m transect, resulting in 5 replicates per sampling location. The plant samples were separated into leaves and stems, air-dried, weighed, and ground. This dataset describes the chemical composition of giant miscanthus leaves and stems including the total carbon (TC) and nitrogen (TN) content, total macro- and micronutrients (aluminum, arsenic, boron, calcium, cadmium, cobalt, chromium, copper, iron, potassium, magnesium, manganese, molybdenum, sodium, nickel, phosphorus, lead, sulfur, selenium, silicon, titanium, vanadium, and zinc), and the characterization of the water extractable organic matter (WEOM). The TC and TN content was determined directly on ground plant samples using a Vario EL III combustion C-N analyzer. For the quantitation of the total macro- and micronutrient content, the plant material was first digested in trace metal grade nitric acid in a microwave digestion system. The digestate was then analyzed using Inductively Coupled Plasma with Optical Emission Spectroscopy (ICP-OES) on a ThermoFisher Scientific iCAP 7400 Duo. For the characterization of the leaf and stem WEOM, the plant material was extracted in water and the extract was filtered and analyzed using UV-Visible and Fluorescence Excitation Emission Matrix (EEM) spectroscopy on a Horiba Scientific Aqualog spectrofluorometer. The optical data obtained from the EEM scans were used to calculate several indices representative of WEOM quality including the absorbance at 254nm, the absorbance ratios at 254 to 365nm and 280 to 465nm, the slope ratio, the fluorescence index, the humification index, the biological index, and the freshness index. The fluorescence intensity of 5 common fluorescence peaks (peaks A, C, M, B, and T) is also reported. This dataset includes an analytically diverse set of measurements that describe the chemical composition of giant miscanthus leaf and stem tissues. This dataset will be useful for those wishing to identify relationships between the chemical composition of giant miscanthus and pest distributions within a bioenergy crop field.
Resource Title: Data from: Plant tissue characteristics of Miscanthus x giganteus.
File Name: OF_Miscanthus_allplant_data_r.xlsx
Resource Description: As part of a study identifying relationships between environmental variables and insect distributions within a bioenergy crop, giant miscanthus (Miscanthus x giganteus) samples were collected in October 2016 at 33 locations within a field in southeast Georgia, USA. At each location, one plant sample was collected every 3-4 meters along a 15-m transect, resulting in 5 replicates per sampling location. The plant samples were separated into leaves and stems, air-dried, and ground. The chemical composition of the ground material was assessed by measuring total carbon and nitrogen, total macro- and micronutrients (aluminum, arsenic, boron, calcium, cadmium, cobalt, chromium, copper, iron, potassium, magnesium, manganese, molybdenum, sodium, nickel, phosphorus, lead, sulfur, selenium, silicon, titanium, vanadium, and zinc) using Inductively Coupled Plasma with Optical Emission Spectroscopy (ICP-OES), and optical characteristics of the water extractable organic matter using UV-Visible and Fluorescence Excitation Emission Matrix (EEM) spectroscopy. This dataset will be useful to identify relationships between the chemical composition of giant miscanthus tissues and pest distributions within a bioenergy crop field.\n
Resource Title: Data from: Plant tissue characteristics of Miscanthus x giganteus.
File Name: OF_Miscanthus_allplant_data_r.xml
Resource Title: Metadata for \"Data from: Plant tissue characteristics of Miscanthus x giganteus\".
File Name: OF_Miscanthus_allplant_r_metadata.pdf
Resource Title: Metadata for \"Data from: Plant tissue characteristics of Miscanthus x giganteus\".
File Name: OF_Miscanthus_allplant_r_metadata.txt
Data usage: This data represents the collection of physiological and biometric data of above- and below-ground plant traits in four species of Solanum melongena of Philippine origin (PHL 4841, PHL 2778, PHL 2789, and Mara). Half of the plants were subjected to significant water deficit, and half again of those deficit plants were allowed to recover after subsequent watering. This data is suitable to serve as a benchmark for trait values in S. melongena, as well as in studies of trait responses to terminal drought and episodic drought in agricultural settings. Traits in this dataset include Leaf Water Potential, total leaf area (cm2), Leaf Canopy temp, Fv/Fm, Photosynthesis, Stomatal Conductance, Transpiration Rate, Water Use Efficiency, Green Leaf Dry Weight, Senesced Leaf Dry Weight, Stem Dry Weight, Total Shoot Dry Weight, Leaf Area Ratio, Specific Leaf Area, Specific Leaf Weight, Basal Fine Root Mass, Total Fine Root Mass, Coarse Roots Mass, Total Root Mass, Root:Shoot Ratio, Total Fine Root length (cm), Total Fine Root Surface Area (m2), Total Fine Root Volume (m3), Specific fine root length (m/g), Root tissue density (g/m3), Fine root length:Leaf area Ratio (cm/çm2), and root mass fraction.
\nMethods and materials:\nA greenhouse experiment was set up to identify physiological traits associated with drought tolerance in eggplant. Solanum melongena genotypes PHL 4841, PHL 2778 and PHL 2789 were chosen based on drought performance in previous field and greenhouse trials (58) of 100 germplasm accessions from the National Plant Genetic Resources Laboratory in the Institute of Plant Breeding, University of the Philippines at Los Baños, Laguna, Philippines. S. melongena ‘Mara’, a released variety from the Institute of Plant Breeding, UP Los Baños was included as a reference variety. Seeds were sown into seedling trays containing fritted clay (Turface Greens Grade, Profile Products, Buffalo Grove, IL, USA) at the end of February in a greenhouse in Fort Collins, CO. After 17-21 days seedlings were transplanted into 7.57 L plastic pots containing 10 kg fritted clay and watered to holding capacity via a drip irrigation before treatments were established. Pots were positioned on two greenhouse benches in a randomized complete block design of two factors: water availability (drought vs. well-watered control) and genotype (four genotypes). There were 5 replicates of each block (40 plants). This basic block design was doubled, and plants were harvested at 2 time points (post-drought and post-recovery) for a total of 80 plants.\nPlants were maintained under a combination of natural sunlight and supplemental LED illumination on a 14:10 hour day:night cycle, corresponding to average temperatures of 22 and 29˚C. Plants were fertigated using Grow More water soluble fertilizer (Grow More, Inc., Gardena, CA) amended with additional N in the form of urea and additional K in the form of KH2PO4 to achieve 79.5-22.5-5 ppm N:P:K daily for the first month after transplantation and transitioned to 60-30-120 ppm N:P:K for the remainder of the experiment.\nDrought treatments began at 5 weeks after transplanting and lasted for 2 weeks for all blocks (80 plants). “Drought” plants received 30% of evapotranspiration (ET) of “control” plants daily for the first week, and 10% daily in the second week. “Control” plants were given 100% of ET daily. ET was calculated by weighing control pots daily at 1400 hr to measure evaporative and transpiration water loss relative to 100% holding capacity. After the conclusion of the drought treatment, all remaining plants were re-watered to pot holding capacity.
\nPhysiological measurements\nRandomized measurements of drought and control plants were carried out from the 11th through the 15th and final day of the drought treatment on 50% of the experimental plant population. On each day, the third fully expanded leaf of each plant was measured for chlorophyll fluorescence (Fv/Fm) from 07:30 until 08:30 using a portable OS5P fluorometer (Opti-Sciences Inc., NH, USA). Each leaf was dark acclimated with leaf clips for 20 minutes prior to measurement. From 09:00 to 12:00 hrs, the same leaves were measured for photosynthetic rate, stomatal conductance, and transpiration using the Li-COR 6400XT infrared gas analyzer with attached leaf measurement chamber (LiCOR Inc., Lincoln, Nebraska). Conditions in the leaf measurement chamber were the following: PAR (photosynthetically active radiation) of 1800 µmol m-2s-1, leaf temperature of 25˚C, and CO2 concentration of 400 µmol mol-1. Instantaneous water use efficiency (WUEi) was calculated as the ratio of photosynthesis (An) to stomatal conductance (gs).\nLeaf water potential (ΨL) was determined with use of a Scholander pressure chamber (Soil Moisture Equipment Corp., Santa Barbara, CA, USA). The same leaf used for gas exchange measurements was cut from each plant and immediately placed in a plastic bag in a cooler until ΨL could be measured (up to 1 hour).\nAfter one week under full watering, “recovered” and control plants were again measured as above for chlorophyll fluorescence and leaf water potential.
\nPlant growth measurements\nFollowing physiological measurements, the aboveground portions of drought and control plants were cut and partitioned into leaves and stem. Total leaf area was measured for each plant using a Li-3100C leaf area meter (LiCOR Inc., USA). Partitioned shoot tissue was then oven dried at 60˚C for 48 hours and weighed.\nThe belowground biomass of each plant was washed free of fritted clay and partitioned into fine and coarse roots. A representative sample of fine roots was obtained for each sample and stored in 30% ethyl alcohol for root scanning. Preserved fine roots were scanned in water in 2-D transparency mode with a desktop scanner (EpsonV750, Epson America Inc., USA) and analyzed using WinRHIZOTM software (Regent Instruments Inc., Canada). Remaining fine and coarse roots were dried and weighed as above. Leaf area ratio (total leaf area per total plant dry mass, m2 g-1; LAR) and specific leaf area (leaf area per leaf dry mass, m2 g-1; SLA), and leaf mass area (leaf dry mass per leaf area, g m-2; LMA) were calculated using the leaf data for each plant. Specific root length of fine roots (root length per dry mass, m g-1; SRLFineRts) and total root mass fraction (RMF, total root mass per total plant weight) were calculated using the fine root length and root biomass data from each plant (31,59)\nAt the end of the recovery phase, all plants were also destructively sampled for measurement of leaf area and above- and below-ground biomass partitioning as above.
Resource Title: Data from: \"Plant strategies for maximizing growth during drought and drought recovery in Solanum melongena L. (eggplant)\".
File Name: full_dataset.csv
A new species of downy mildew (Oomycota, Peronosporales) is reported. This dataset contains alignments of DNA sequences (cox2 and LSU) markers, alignment of cox2 marker to be used in species identification and resulting phylogenetic trees.
\nResources in this dataset:
\nResource Title: Alignment Cox2 dataset\nFile Name: Cox2_EchDM_final_alignment.fasta\nResource Description: Alignment of Cox2 DNA sequences.
\nResource Title: Alignment LSU dataset\nFile Name: LSU_EchDM_final_alignment.fasta\nResource Description: Alignment of LSU DNA sequences.
\nResource Title: Alignment Cox2 dataset Barcoding\nFile Name: Cox2_EchDM_Genetic_differences_alignment.fasta\nResource Description: Alignment of cox2 marker to be used in species identification and resulting phylogenetic trees.
\nBuffel grass (Cenchrus ciliaris L. syn. Pennisetum ciliare (L.) Link) is an economically important warm-season perennial used primarily as a forage and range grass in many of the drier regions throughout the subtropics and tropics. Because buffel grass has excellent drought tolerance combined with desirable forage traits, it is an important forage and range grass in parts of Africa, including South Africa. It was introduced into many of the arid subtropical regions of the world, primarily Australia, North America, and South America, and today the species is grown on more than 50 million ha worldwide. Knowledge of the ploidy, meiotic behavior, and fertility of the plants used in hybridization programs became important because success depended upon using meiotically stable parental lines with compatible chromosome numbers. Little is known about the chromosome number of the buffel grass accessions in the USDA National Plant Germplasm System (NPGS) because the species has small chromosomes, that makes them difficult to count using traditional cytological methods. The DNA content of 568 accessions of buffel grass in the USDA National Plant Germplasm System was determined through flow cytometry to predict their ploidy levels. Based on DNA content, 308 accessions were determined as tetraploids with 36 chromosomes, 139 as pentaploids with 45 chromosomes, 20 as hexaploids with 54 chromosomes, two as septaploids with 63 chromosomes, and 99 as aneuploids. Chromosome counts of selected plants confirmed ploidy levels from DNA findings. Chromosome number of euploid plants could be predicted from the DNA data.
\nThe findings from this investigation reveal that the accessions in the buffel grass collection consist of a wide range of cytotypes, including polyploids and aneuploids with varying chromosome numbers. This demonstrates the amount of chromosomal diversity that occurs within the species and this collection. Grass breeders who use the buffel grass germplasm in the NPGS in their breeding programs should ensure that they know the chromosome number of the material requested. The predicted ploidy levels in Supplementary Table 1 will provide that information to the breeders.
Resource Title: Supplementary Table 1. DNA content and ploidy levels of buffel grass accessions in the USDA National Plant Germplasm System (csv).
File Name: Supp-Table-1-buffel-ploidy.csv
Resource Description: Grass breeders who use the buffel grass germplasm in the NPGS in their breeding programs should ensure that they know the chromosome number of the material requested. The predicted ploidy levels in Supplementary Table 1 will provide that information to the breeders.
Resource Title: Data Dictionary.
File Name: Supp-Table-1-buffel-ploidy-DataDictionary.csv
Resource Description: Defines variables for buffel grass accession ploidy/country of origin table.
Datasets archived here consist of all data analyzed in Duan et al. 2015 from Journal of Applied Ecology. Specifically, these data were collected from annual sampling of emerald ash borer (Agrilus planipennis) immature stages and associated parasitoids on infested ash trees (Fraxinus) in Southern Michigan, where three introduced biological control agents had been released between 2007 - 2010. Detailed data collection procedures can be found in Duan et al. 2012, 2013, and 2015.
Resource Title: Duan J Data on EAB larval density-bird predation and unknown factor from Journal of Applied Ecology.
File Name: Duan J Data on EAB larval density-bird predation and unknown factor from Journal of Applied Ecology.xlsx
Resource Description: This data set is used to calculate mean EAB density (per m2 of ash phloem area), bird predation rate and mortality rate caused by unknown factors and analyzed with JMP (10.2) scripts for mixed effect linear models in Duan et al. 2015 (Journal of Applied Ecology).
Resource Title: DUAN J Data on Parasitism L1-L2 Excluded from Journal of Applied Ecology.
File Name: DUAN J Data on Parasitism L1-L2 Excluded from Journal of Applied Ecology.xlsx
Resource Description: This data set is used to construct life tables and calculation of net population growth rate of emerald ash borer for each site. The net population growth rates were then analyzed with JMP (10.2) scripts for mixed effect linear models in Duan et al. 2015 (Journal of Applied Ecology).
Resource Title: DUAN J Data on EAB Life Tables Calculation from Journal of Applied Ecology.
File Name: DUAN J Data on EAB Life Tables Calculation from Journal of Applied Ecology.xlsx
Resource Description: This data set is used to calculate parasitism rate of EAB larvae for each tree and then analyzed with JMP (10.2) scripts for mixed effect linear models on in Duan et al. 2015 (Journal of Applied Ecology).
Resource Title: READ ME for Emerald Ash Borer Biocontrol Study from Journal of Applied Ecology.
File Name: READ_ME_for_Emerald_Ash_Borer_Biocontrol_Study_from_Journal_of_Applied_Ecology.docx
Resource Description: Additional information and definitions for the variables/content in the three Emerald Ash Borer Biocontrol Study tables:
\nResource Title: Data Dictionary for Emerald Ash Borer Biocontrol Study from Journal of Applied Ecology.
File Name: AshBorerAnd Parasitoids_DataDictionary.csv
Resource Description: CSV data dictionary for the variables/content in the three Emerald Ash Borer Biocontrol Study tables:
\nFore more information see the related READ ME file.\n
Insects\nTwo different populations of Prostephanus truncatus were used in the bioassays, one originated from the invaded range in Ghana, and the other from the native range in Mexico. Both populations were maintained in the Laboratory of Entomology and Agricultural Zoology (LEAZ), at the Department of Agriculture, Crop Production and Rural Environment, University of Thessaly, Greece, on whole maize kernels, at 26°C and 55% relative humidity (RH) and continuous darkness.\nEuropean Maize Hybrids\nThree different maize hybrids (“PICO”, “HAMILTON”, and “AGN 672”) were obtained from American Genetics SA, Sindos, Greece. All hybrids were cultivated at Serres, in northern Greece according to the local farming practices. The hybrid “PICO” has a great production potential and it is adapted to multiple soil types and can produce high-weight grain. The hybrid “HAMILTON” is a dual-purpose hybrid, that has excellent early vigor and it is tolerant to fungi, and the hybrid “AGN 672” has excellent early vigor and it is also tolerant to fungi.\nPopulation Growth on Different Maize Hybrids\nThree different maize hybrids (PICO, Hamilton, and AGN 672) were used for experimentation. These hybrids were untreated and uninfested, and kept at ambient conditions until the beginning of the experiments. Before proceeding with the bioassays, grain moisture content (M.C.) was assessed, using a moisture meter (mini-GAC plus, Dickey-John Europe S.A.S., Colombes, France). Standardized plastic vials as in prior work (Quellhorst et al. 2023; Lampiri et al. 2022) were used here (3 cm in diameter, 8 cm in height). Vials were then filled with 20 g of one of the three maize hybrids with lids added after. The commodity was weighed with a Precisa XB3200D compact balance (Alpha Analytical Instruments, Gerakas, Greece). The upper rings of the vials were treated with Fluon (Northern Products Inc., Woonsocket, USA) to prevent insects from moving away from the grain and/or escaping. The top of each vial also had small holes punched to allow ventilation. Each vial then received 10 P. truncatus adults of mixed sex and age from one of two different strains. Two different populations of P. truncatus were used as mentioned above. The vials were placed inside incubators set at 30°C and 65% R.H. in continuous darkness. The vials were removed from the incubators after 45 d and adult progeny production was recorded. We also recorded the weight of frass, the number of insect-damaged kernels (IDK), and the total weight of the kernels within each vial. For each combination, i.e. hybrid × strain, there were n = 9 replicates.
", "title": "Data from: Population growth of native and invasive strains of the larger grain borer, Prostephanus truncatus on three maize hybrids", "distribution": [ { "@type": "dcat:Distribution", "downloadURL": "https://ndownloader.figshare.com/files/44540825", "format": "xlsx", "mediaType": "application/vnd.openxmlformats-officedocument.spreadsheetml.sheet", "title": "quellhorst_etal_maize_hybrid_exp_agdata_commons.xlsx" } ], "license": "https://www.usa.gov/publicdomain/label/1.0/", "bureauCode": [ "005:18" ], "modified": "2024-05-28", "publisher": { "@type": "org:Organization", "name": "Agricultural Research Service" }, "keyword": [ "Maize", "larger grain borer", "prostephanus truncatus", "Invasive species", "stored product pests", "stored grain", "cgahr", "CGAHR Lab colony", "Greece", "Europe", "ghana", "hybrids", "Host-plant resistance", "progeny trial", "population growth", "Mexico", "NP304", "data.gov", "ARS" ], "spatial": "{\"type\": \"Point\", \"coordinates\": [22.938787937164, 39.364048927656]}" }, { "identifier": "10.15482/USDA.ADC/1527775", "accessLevel": "public", "contactPoint": { "hasEmail": "mailto:crystal.loving@usda.gov", "fn": "Loving, Crystal" }, "programCode": [ "005:040" ], "description": "Files pertaining to data analyses performed and presented in the preprint, 'Porcine intestinal innate lymphoid cells and lymphocyte spatial context revealed through single-cell RNA sequencing' by Wiarda et al. 2022 are provided in this dataset. Single cell suspensions enriched for lymphocytes were obtained from ileum of two seven-week-old pigs and subjected to single-cell RNA sequencing (scRNA-seq). Peripheral blood mononuclear cells (PBMCs) were collected and processed for scRNA-seq in parallel. scRNA-seq was performed to provide transcriptomic profiles of lymphocytes in porcine ileum, with 31,983 cells annotated into 26 cell types. Deeper interrogation of data revealed previously undescribed cells in porcine intestine, including SELLhi γδ T cells, group 1 and group 3 innate lymphoid cells (ILCs), and four subsets of B cells. Single-cell transcriptomes in ileum were compared to those in porcine blood, and subsets of activated lymphocytes were detected in ileum but not periphery. Comparison to scRNA-seq human and murine ileum data revealed a general consensus of ileal lymphocytes across species. Lymphocyte spatial context in porcine ileum was conferred through differential tissue dissection prior to scRNA-seq. Antibody-secreting cells, B cells, follicular CD4 αβ T cells, and cycling T/ILCs were enriched in ileum with Peyer’s patches, while non-cycling γδ T, CD8 αβ T, and group 1 ILCs were enriched in ileum without Peyer’s patches. Data files included herein are .h5seurat files of the various cell subsets included in analyses of the manuscript. Files may be used to reconstruct different analyses and perform further data query. Scripts for original data analyses are found at https://github.com/USDA-FSEPRU/scRNAseq_Porcine_Ileum_PBMC. Raw data are available at GEO accession GSE196388. Data are available for online query at https://singlecell.broadinstitute.org/single_cell/study/SCP1921/intestinal-single-cell-atlas-reveals-novel-lymphocytes-in-pigs-with-similarities-to-human-cells.
Resource Title: Ileum_AllCells.
File Name: Ileum_AllCells.tar
Resource Description: .h5seurat object of all the cells derived from ileum samples. Untar into .h5seurat file before use.
Resource Title: GutBlood_IntegratedILCs.
File Name: GutBlood_IntegratedILCs.tar
Resource Description: .h5seurat object of ILCs derived from both ileum and PBMC samples. Untar into .h5seurat file before use.
Resource Title: Ileum_Bonly.
File Name: Ileum_Bonly.tar
Resource Description: .h5seurat object of B cells and antibody-secreting cells derived from ileum samples. Untar into .h5seurat file before use.
Resource Title: Ileum_CD4Tonly.
File Name: Ileum_CD4Tonly.tar
Resource Description: .h5seurat object of non-naive CD4 ab T cells derived from ileum samples. Untar into .h5seurat file before use.
Resource Title: Ileum_gdCD8Tonly.
File Name: Ileum_gdCD8Tonly.tar
Resource Description: .h5seurat object of gd and CD8 ab T cells derived from ileum samples. Untar into .h5seurat file before use.
Resource Title: Ileum_ILConly.
File Name: Ileum_ILConly.tar
Resource Description: .h5seurat object of innate lymphoid cells (ILCs) derived from ileum samples. Untar into .h5seurat file before use.
Resource Title: Ileum_MyeloidOnly.
File Name: Ileum_MyeloidOnly.tar
Resource Description: .h5seurat object of myeloid lineage leukocytes derived from ileum samples. Untar into .h5seurat file before use.
Resource Title: Ileum_NonImmuneOnly.
File Name: Ileum_NonImmuneOnly.tar
Resource Description: .h5seurat object of non-immune cells derived from ileum samples. Untar into .h5seurat file before use.
Resource Title: Ileum_TILConly.
File Name: Ileum_TILConly.tar
Resource Description: .h5seurat object of all T cells and innate lymphoid cells (ILCs) derived from ileum samples. Untar into .h5seurat file before use.
Resource Title: PBMC_AllCells.
File Name: PBMC_AllCells.tar
Resource Description: .h5seurat object of all cells derived from PBMC samples. Untar into .h5seurat file before use.
Data are from three experimental trials examining pre-existing water stress on Xylella fastidiosa infections and possible associated shifts in host chemistry, including free sugar, amino acid, and phenolic compound measurements. Trials A and B were utilized in the manuscript, whereas Trial C was data from an experiment whereby the water stress treatment was not significant enough to affect plant physiology or bacterial progression (but included for completeness). Predawn water potentials and photosynthesis were provided for trial B to show methodology worked (and for trial C to show the failure to reach water stress).
\nResource Title: Pre-infection water stress effects on Xylella fastidiosa progression and grapevine chemistry.
File Name: Preinfection Water Stress Effects on Xf Data.xlsx
Resource Description: Data represent affects of water stress on Xylella titers and Pierce's disease progression, as well as changes in grapevine stem amino acid, sugar, or phenolic compounds. Data were from three trials. Two of these were deemed from successful experiments with water stress obtained (Trials A and B), but the last trial (Trial C) did not appear to have induced water stress, based on pre-dawn water potentials. Data were summarized in a manuscript submitted for publication.
This is digital research data corresponding to the manuscript, Reinhart, K.O., Vermeire, L.T. Precipitation Manipulation Experiments May Be Confounded by Water Source. J Soil Sci Plant Nutr (2023). https://doi.org/10.1007/s42729-023-01298-0
\nFiles for a 3x2x2 factorial field experiment and water quality data used to create Table 1. Data for the experiment were used for the statistical analysis and generation of summary statistics for Figure 2.
\nPurpose: This study aims to investigate the consequences of performing precipitation manipulation experiments with mineralized water in place of rainwater (i.e. demineralized water). Limited attention has been paid to the effects of water mineralization on plant and soil properties, even when the experiments are in a rainfed context.
\nMethods: We conducted a 6-yr experiment with a gradient in spring rainfall (70, 100, and 130% of ambient). We tested effects of rainfall treatments on plant biomass and six soil properties and interpreted the confounding effects of dissolved solids in irrigation water.
\nResults: Rainfall treatments affected all response variables. Sulfate was the most common dissolved solid in irrigation water and was 41 times more abundant in irrigated (i.e. 130% of ambient) than other plots. Soils of irrigated plots also had elevated iron (16.5 µg × 10 cm-2 × 60-d vs 8.9) and pH (7.0 vs 6.8). The rainfall gradient also had a nonlinear (hump-shaped) effect on plant available phosphorus (P). Plant and microbial biomasses are often limited by and positively associated with available P, suggesting the predicted positive linear relationship between plant biomass and P was confounded by additions of mineralized water. In other words, the unexpected nonlinear relationship was likely driven by components of mineralized irrigation water (i.e. calcium, iron) and/or shifts in soil pH that immobilized P.
\nConclusions: Our results suggest robust precipitation manipulation experiments should either capture rainwater when possible (or use demineralized water) or consider the confounding effects of mineralized water on plant and soil properties.
\nResources in this dataset:
\nResource Title: Readme file- Data dictionary File Name: README.txt Resource Description: File contains data dictionary to accompany data files for a research study.
\nResource Title: 3x2x2 factorial dataset.csv File Name: 3x2x2 factorial dataset.csv Resource Description: Dataset is for a 3x2x2 factorial field experiment (factors: rainfall variability, mowing seasons, mowing intensity) conducted in northern mixed-grass prairie vegetation in eastern Montana, USA. Data include activity of 5 plant available nutrients, soil pH, and plant biomass metrics. Data from 2018.
\nResource Title: water quality dataset.csv File Name: water quality dataset.csv Resource Description: Water properties (pH and common dissolved solids) of samples from Yellowstone River collected near Miles City, Montana. Data extracted from Rinella MJ, Muscha JM, Reinhart KO, Petersen MK (2021) Water quality for livestock in northern Great Plains rangelands. Rangeland Ecol. Manage. 75: 29-34.
", "title": "Data from: Precipitation manipulation experiments may be confounded by water source", "distribution": [ { "@type": "dcat:Distribution", "downloadURL": "https://ndownloader.figshare.com/files/44540570", "format": "csv", "mediaType": "application/csv", "title": "3x2x2 factorial dataset.csv" }, { "@type": "dcat:Distribution", "downloadURL": "https://ndownloader.figshare.com/files/44540573", "format": "csv", "mediaType": "text/plain", "title": "water quality dataset.csv" }, { "@type": "dcat:Distribution", "downloadURL": "https://ndownloader.figshare.com/files/44540576", "format": "txt", "mediaType": "text/plain", "title": "README_11.txt" } ], "license": "https://www.usa.gov/publicdomain/label/1.0/", "bureauCode": [ "005:18" ], "modified": "2024-02-20", "publisher": { "@type": "org:Organization", "name": "Agricultural Research Service" }, "accrualPeriodicity": "irregular", "keyword": [ "NP215", "water quality", "drought manipulation", "drought experiment", "precipitation manipulation", "soil phosphorus", "data.gov", "ARS" ], "spatial": "{\"type\": \"Point\", \"coordinates\": [-105.96641666667, 46.4068889]}" }, { "identifier": "10.15482/USDA.ADC/25371154.v1", "accessLevel": "public", "contactPoint": { "hasEmail": "mailto:alison.gerken@usda.gov", "fn": "Gerken, Alison R." }, "programCode": [ "005:040" ], "description": "The larger grain borer (Prostephanus truncatus [Horn] [Coleoptera: Bostrichidae]) is a wood-boring insect native to Central America but has adapted to stored maize and cassava. It was accidentally introduced to Tanzania and became a pest across central Africa. Unlike many grain pests, P. truncatus populations can establish and move within forested habitats. Consequently, novel infestations can occur without human influence. The objectives of our study were to (1) develop an updated current suitability projection for P. truncatus (2) assess its potential future distribution under different climate change scenarios, and (3) identify climate variables that best inform the model. We used WALLACE and MaxEnt to predict potential global distribution by incorporating bioclimatic variables and occurrence records. Future models were projected to 2050 and 2070 with Representative Concentration Pathways (RCP) 2.6 (low warming) and 8.5 (high warming). Distribution was most limited by high precipitation and cold temperatures. Globally, highly suitable areas (>75%) primarily occurred along coastal and equatorial regions with novel areas in northern South America, India, southeastern Asia, Indonesia, and the Philippines, totaling 7% under current conditions. Highly suitable areas at RCP 2.6 and 8.5 are estimated to increase to 12 and 15%, respectively, by 2050 and increase to 19% in 2070 under RCP 8.5. Centroids of highly suitable areas show the distribution centers move more inshore and away from the equator. Notably, the result is a range expansion, not shift. These results can be used to decrease biosecurity risks through more spatially explicit and timely surveillance programs for targeting the exclusion of this pest.
", "title": "Data from: Predicted range expansion of the larger grain borer, Prostephanus truncatus (Coleoptera: Bostrichidae), under projected climate change scenarios", "distribution": [ { "@type": "dcat:Distribution", "downloadURL": "https://ndownloader.figshare.com/files/44939320", "format": "R", "mediaType": "text/plain", "title": "Harman et al._LAGB dist_RCode.R" }, { "@type": "dcat:Distribution", "downloadURL": "https://ndownloader.figshare.com/files/44939323", "format": "docx", "mediaType": "application/zip", "title": "R code from Wallace.docx" }, { "@type": "dcat:Distribution", "downloadURL": "https://ndownloader.figshare.com/files/44939317", "format": "xlsx", "mediaType": "application/zip", "title": "Harman et al 2024 LAGB Distribution Data.xlsx" } ], "license": "https://creativecommons.org/licenses/by/4.0/", "bureauCode": [ "005:18" ], "modified": "2024-03-12", "publisher": { "@type": "org:Organization", "name": "Agricultural Research Service" }, "accrualPeriodicity": "irregular", "keyword": [ "species distribution modeling technique Maxent", "grain pest species", "stored product insect", "movement", "ecological niche model (ENM)", "invasive species", "risk prediction modeling" ] }, { "identifier": "10.15482/USDA.ADC/25219727.v1", "accessLevel": "public", "contactPoint": { "hasEmail": "mailto:robert.srygley@usda.gov", "fn": "Srygley, Robert B." }, "programCode": [ "005:040" ], "description": "Mormon cricket eggs can remain diapausing in soil for multiple years without forming an embryo. I investigated whether embryonic development was dependent on the number of annual cycles since the egg was laid, duration of the summer period (forcing), or duration of the winter period (chilling). This was a lab experiment conducted at the ARS Northern Plains Agricultural Laboratory in Sidney Montana on two populations: Arizona (AZ, 36.5018 N, 112.1405 W, 2592 m above sea level) and Wyoming (WY, 44.4644 N, 107.4592 W, 2653 m a.s.l). The timing of Mormon cricket egg development was measured for each sibling group (designated mating pairs in the header row) within a population. Hence eggs within sibling groups are considered independent observations, and each sibling group was ultimately analyzed separately. Each sibling group was split into three treatments: 2cycle, 3cycle, and 4cycle (designated 2, 3, and 4 in the data), named for the number of seasonal cycles completed within a 60 week period. Two-cycle is best described as 15 weeks of winter, 3 weeks of spring, 10 weeks of summer, and 2 weeks of autumn; three-cycle is 6 weeks of winter, 2 weeks of spring, 10 weeks of summer, and 2 weeks of autumn; and four-cycle is 6 weeks of winter, 2 weeks of spring, and 5 weeks of summer, and 2 weeks of autumn. For 2cycle and 3cycle, eggs were screened for development in the final two weeks of each cycle (the autumn period), and the developed eggs were separated from the undeveloped eggs. Half-developed eggs (or ‘middies’) were also separated from the undeveloped eggs to follow the completion of their development separately. Initially, eggs in 4cycle were also screened in each ‘autumn’ period, but the embryos were unable to complete development in a single screening. Therefore, we were able to screen 4cycle every other autumn period. For each egg in the sibling group, we tracked the timing of the fate of each egg: either fully developed (and thus ready to enter winter and hatch the following spring), discard (due to being flat, black, or invaded by fungus), broken, mia (or missing in action when accidentally lost), or right censored (for the few eggs in a sibling group that still remained undeveloped at the end of the experiment). Any middies that were found hatched were assumed to have completed development in the prior summer. For some mating pairs, we also collected a few eggs and fixed them, which killed the eggs, but cleared the chorion so that we could review their developmental stages (fate=fixed). The treatments were applied for approximately 10 calendar years starting in 2013 when the eggs were collected and ending in 2023. The timing of the fate of each egg was calculated in three ways: 1) the number of warm periods that the egg had experienced (designated ‘wp’ in the header row), the number of weeks of chill time that the egg had experienced prior to its fate (designated ‘winter chill’), and the number of weeks of warm period that the egg had experienced when its fate was determined (designated ‘summer weeks’ although it also includes the 2 weeks of autumn).
", "title": "Data from: Prolonged Diapause in Mormon Crickets: Embryonic Responses to Three Measures of Time", "distribution": [ { "@type": "dcat:Distribution", "downloadURL": "https://ndownloader.figshare.com/files/44546504", "format": "txt", "mediaType": "application/csv", "title": "AZrtCensor.txt" }, { "@type": "dcat:Distribution", "downloadURL": "https://ndownloader.figshare.com/files/44546501", "format": "rtf", "mediaType": "text/rtf", "title": "ReadMe.rtf" }, { "@type": "dcat:Distribution", "downloadURL": "https://ndownloader.figshare.com/files/44546498", "format": "txt", "mediaType": "text/plain", "title": "WYrtCensor.txt" } ], "license": "https://www.usa.gov/publicdomain/label/1.0/", "bureauCode": [ "005:18" ], "modified": "2024-04-11", "publisher": { "@type": "org:Organization", "name": "Agricultural Research Service" }, "accrualPeriodicity": "irregular", "keyword": [ "diapause", "environmental cue", "katydids", "multiannual lifecycle", "phenology" ], "spatial": "{\"type\": \"MultiPoint\", \"coordinates\": [[-112.1405, 36.5018], [-107.4592, 44.4644]]}" }, { "identifier": "10.1186/s12870-016-0942-x", "accessLevel": "public", "contactPoint": { "hasEmail": "mailto:hong.lin@ars.usda.gov", "fn": "Lin, Hong" }, "programCode": [ "005:040" ], "description": "Background\nCitrus Huanglongbing (HLB), which is linked to the bacterial Candidatus pathogen 'Ca. Liberibacter asiaticus' (Las), is the most devastating disease of citrus plants, and longer-term control measures via breeding or genetic engineering have been unwieldy because all cultivated citrus species are susceptible to the disease. However, the degree of susceptibility varies among citrus species, which has prompted efforts to identify potential Las resistance/tolerance-related genes in citrus plants for application in breeding or genetic engineering programs. Plant exposure to one form of stress has been shown to serendipitously induce innate resistance to other forms of stress and a recent study showed that continuous heat treatment (40 to 42 °C) reduced Las titer and HLB-associated symptoms in citrus seedlings. The goal of the present study was to apply comparative proteomics analysis via 2-DE and mass spectrometry to elucidate the molecular processes associated with heat-induced mitigation of HLB in citrus plants. Healthy or Las-infected citrus grapefruit plants were exposed to room temperature or to continuous heat treatment of 40 °C for 6 days.
\nResults\nAn exhaustive total protein extraction process facilitated the identification of 107 differentially-expressed proteins in response to Las and/or heat treatment, which included a strong up-regulation of chaperones including small (23.6, 18.5 and 17.9 kDa) heat shock proteins, a HSP70-like protein and a ribulose-1,5-bisphosphate carboxylase oxygenase (RuBisCO)-binding 60 kDa chaperonin, particularly in response to heat treatment. Other proteins that were generally down-regulated due to Las infection but up-regulated in response to heat treatment include RuBisCO activase, chlorophyll a/b binding protein, glucosidase II beta subunit-like protein, a putative lipoxygenase protein, a ferritin-like protein, and a glutathione S-transferase.
\nConclusions\nThe differentially-expressed proteins identified in this study highlights a premier characterization of the molecular mechanisms potentially involved in the reversal of Las-induced pathogenicity processes in citrus plants and are hence proposed targets for application towards the development of cisgenic Las-resistant/tolerant citrus plants.
Resource Title: Appendix 1. Mascot match results and peptide sequences of the 130 differentially-expressed spots - Download Excel.
File Name: 12870_2016_942_MOESM1_ESM.xlsx, url: https://static-content.springer.com/esm/art:10.1186/s12870-016-0942-x/MediaObjects/12870_2016_942_MOESM1_ESM.xlsx
The bacterial 16S tag-encoded FLX-titanium amplicon pyrosequencing (bTEFAP) method was used to carry out the classification analysis of bacterial flora in adult female and male horn flies and horn fly eggs.
\nThe bTEFAP method identified 16S rDNA sequences in our samples which allowed the identification of various prokaryotic taxa associated with the life stage examined. This is the first comprehensive report of bacterial flora associated with the horn fly using a culture-independent method. Several rumen, environmental, symbiotic and pathogenic bacteria associated with the horn fly were identified and quantified. This is the first report of the presence of Wolbachia in horn flies of USA origin and is the first report of the presence of Rikenella in an obligatory blood feeding insect.
\nAdult horn flies were collected on a single date from pastured cattle at the Louisiana State University Agricultural Center, St. Gabriel Research Station using aerial nets. Within 1 h after collection the flies were transferred to large sterile Erlenmeyer flasks and maintained in total darkness for 1.5 h and 30°C to allow flies to oviposit on the flask bottom [73]. Adult flies were released from the flasks into a cage and eggs were collected by rinsing with distilled water onto a filter paper. Both the eggs and adult flies were frozen at −80°C. To preserve nucleic acid integrity, adults were sexed on dry ice prior to freezing. Each sample used for DNA extraction and pyrosequencing consisted of 5 adult males, 5 adult females or 50 eggs pooled together and homogenized. Three replicates of adult male, adult female and eggs were analyzed.
\nThe horn fly, Haematobia irritans, is one of the most economically important pests of cattle. Insecticides have been a major element of horn fly management programs. Growing concerns with insecticide resistance, insecticide residues on farm products, and non-availability of new generation insecticides, are serious issues for the livestock industry. Alternative horn fly control methods offer the promise to decrease the use of insecticides and reduce the amount of insecticide residues on livestock products and give an impetus to the organic livestock farming segment. The horn fly, an obligatory blood feeder, requires the help of microflora to supply additional nutrients and metabolize the blood meal. Recent advancements in DNA sequencing methodologies enable researchers to examine the microflora diversity independent of culture methods.
Resource Title: Supporting Information: Table S1 (CSV).
File Name: journal.pone_.0044390.s001.csv
Resource Description: The file contains bacterial species load in the adult female horn flies, the adult male horn flies and horn fly eggs. Bacterial load was determined by dividing the 16S rDNA numbers representing the tally for each species by the total tally detected in each life stage. We report the average from the three replicates in the text.
\nResource Title: Horn Fly Microbiome - Data Dictionary.
File Name: HornFlyMicrobiome_DataDictionary.csv
Resource Description: Machine-readable CSV format data dictionary defining data elements for Supplemental Table S1, Bacterial flora in adult female and male horn flies and horn fly eggs.
Resource Title: Supporting Information: Table S1.
File Name: pone.0044390.s001.xls
Resource Description: The file contains bacterial species load in the adult female horn flies, the adult male horn flies and horn fly eggs. Bacterial load was determined by dividing the 16S rDNA numbers representing the tally for each species by the total tally detected in each life stage. We report the average from the three replicates in the text.
\nhttp://dx.doi.org/10.1371/journal.pone.0044390.s001
\n(XLS)
\nDirect data download: http://journals.plos.org/plosone/article/asset?unique&id=info:doi/10.1371/journal.pone.0044390.s001
Resource Title: Supporting Information: Figure S1.
File Name: pone.0044390.s002.jpg
Resource Description: Rarefaction curves plotted at 0.03 divergence level for all nine samples of horn fly. The rarefaction curves imply a depth of coverage of approximately 10000 sequences/sample for the female and egg samples. The male horn fly samples were only sampled to about one third of the depths of either the female or egg samples.
\nhttp://dx.doi.org/10.1371/journal.pone.0044390.s002
\n(JPG)
\nDownload image directly at http://journals.plos.org/plosone/article/asset?unique&id=info:doi/10.1371/journal.pone.0044390.s002
[ NOTE – 2022/05/06: this dataset is superseded by an updated version https://doi.org/10.15482/USDA.ADC/1526433 ]\nThe dataset contains 15-minute mean weather data from the USDA-ARS Conservation and Production Laboratory (CPRL), Soil and Water Management Research Unit (SWMRU) research weather station, Bushland, Texas (Lat. 35.186714°, Long. -102.094189°, elevation 1170 m above MSL) for all days in 2016. The data are from sensors deployed at standard heights over grass that is irrigated and mowed during the growing season to reference evapotranspiration standards. Sensors are duplicated at each height, and data from a duplicate sensor may be used to fill gaps in data from the primary sensor using appropriate regression relationships. Gap filling may also be accomplished using sensors deployed at one of the four large weighing lysimeters immediately west of the weather station. The primary paper describes details of the sensors used and methods of testing, calibration and use. The weather data include air temperature (C) and relative humidity (%), wind speed (m/s), solar irradiance (W m-2) and precipitation. Because the large (3 m by 3 m surface area) weighing lysimeters are better rain gages than are tipping bucket gages, the 15-minute precipitation data are derived for each lysimeter from changes in lysimeter mass. The land slope is <1% and flat. The mean annual precipitation is ~470 mm, the 20-year pan evaporation record indicates ~2,600 mm Class A pan evaporation per year, and winds are typically from the South and Southwest. The climate is semi-arid with ~70% (350 mm) of the annual precipitation occurring from May to September, during which period the pan evaporation averages ~1520 mm.
Resource Title: 2016 USDA-ARS Bushland Texas 15-minute research weather data.
File Name: 15-min_SWMRU_CPRL_weather_data_2016.xlsx
Resource Description: These 15-minute data are for every day of year in 2016 from the research weather station of the USDA-ARS Soil and Water Management Research Unit (SWMRU) at the Conservation and Production Research Laboratory, Bushland, Texas USA. Data were quality assured and controlled using procedures described by Evett et al. (2018). Data from duplicate sensors at the research weather station and at nearby (<800 m distance) weather stations were used for data comparisons and gap filling using appropriate regression relationships.
Resource Software Recommended: Microsoft Excel 2010 or later,url: https://products.office.com/en-us/excel
Resource Title: Data Dictionary - 2016 USDA-ARS Bushland Texas 15-minute research weather data.
File Name: Data Dictionary - 2016 USDA-ARS Bushland Texas.csv
Understanding species abundances and distributions, especially at local to landscape scales, is critical for land managers and conservationists to prioritize management decisions and informs the effort and expense that may be required. The metrics of range size and local abundance reflect aspects of the biology and ecology of a given species, and together with its per capita (or per unit area) effects on other members of the community comprise a well-accepted theoretical paradigm describing invasive species. Although these metrics are readily calculated from vegetation monitoring data, they have not generally (and effect in particular) been applied to native species. We describe how metrics defining invasions may be more broadly applied to both native and invasive species in vegetation management, supporting their relevance to local scales of species conservation and management. We then use a sample monitoring dataset to compare range size, local abundance and effect as well as summary calculations of landscape penetration (range size × local abundance) and impact (landscape penetration × effect) for native and invasive species in the mixed-grass plant community of western North Dakota, USA. This paper uses these summary statistics to quantify the impact for 13 of 56 commonly encountered species, with statistical support for effects of 6 of the 13 species. Our results agree with knowledge of invasion severity and natural history of native species in the region. We contend that when managers are using invasion metrics in monitoring, extending them to common native species is biologically and ecologically informative, with little additional investment.
Resource Title: Supporting Data (xlsx).
File Name: Espeland-Sylvain-BiodivConserv-2019-raw-data.xlsx
Resource Description: Occurrence data per quadrangle, site, and transect. Species Codes and habitat identifiers are defined in a separate sheet.
Resource Title: Data Dictionary.
File Name: Espeland-Sylvain-BiodivConserv-2019-data-dictionary.csv
Resource Description: Details Species and Habitat codes for abundance data collected.
Resource Title: Supporting Data (csv).
File Name: Espeland-Sylvain-BiodivConserv-2019-raw-data.csv
Resource Description: Occurrence data per quadrangle, site, and transect.
Resource Title: Supplementary Table S1.1.
File Name: 10531_2019_1701_MOESM1_ESM.docx
Resource Description: Scientific name, common name, life history group, family, status (N= native, I= introduced), percent of plots present, and average cover when present of 56 vascular plant species recorded in 1196 undisturbed plots in federally-managed grasslands of western North Dakota. Life history groups: C3 = cool season perennial grass, C4 = warm season perennial grass, SE = sedge, SH = shrub, PF= perennial forb, BF = biennial forb, APF = annual, biennial, or perennial forb.
This study produced reference quality genomes of two cattle ticks Rhipicephalus microplus and Rhipicephalus annulatus, which can be used to identify drug targets with acaricidal activity and refine anti-tick vaccine approaches.
Resource Title: Raw pacific biosciences and illumina sequencing reads and assembled genome data for the cattle ticks Rhipicephalus microplus and Rhipicephalus annulatus.
File Name: Web Page, url: https://doi.org/10.1016/j.dib.2021.106852
Files referenced in the article may be found in the related content section of this record.
This dataset contains files reconstructing single-cell data presented in 'Reference transcriptomics of porcine peripheral immune cells created through bulk and single-cell RNA sequencing' by Herrera-Uribe & Wiarda et al. 2021. Samples of peripheral blood mononuclear cells (PBMCs) were collected from seven pigs and processed for single-cell RNA sequencing (scRNA-seq) in order to provide a reference annotation of porcine immune cell transcriptomics at enhanced, single-cell resolution. Analysis of single-cell data allowed identification of 36 cell clusters that were further classified into 13 cell types, including monocytes, dendritic cells, B cells, antibody-secreting cells, numerous populations of T cells, NK cells, and erythrocytes. Files may be used to reconstruct the data as presented in the manuscript, allowing for individual query by other users. Scripts for original data analysis are available at https://github.com/USDA-FSEPRU/PorcinePBMCs_bulkRNAseq_scRNAseq. Raw data are available at https://www.ebi.ac.uk/ena/browser/view/PRJEB43826.
\nFunding for this dataset was also provided by NRSP8: National Animal Genome Research Program (https://www.nimss.org/projects/view/mrp/outline/18464).
Resource Title: Herrera-Uribe & Wiarda et al. PBMCs - All Cells 10X Format.
File Name: PBMC7_AllCells.zip
Resource Description: Zipped folder containing PBMC counts matrix, gene names, and cell IDs. Files are as follows:
\n*The ‘raw’ count matrix is actually gene counts obtained following ambient RNA removal. During ambient RNA removal, we specified to calculate non-integer count estimations, so most gene counts are actually non-integer values in this matrix but should still be treated as raw/unnormalized data that requires further normalization/transformation.
\nData can be read into R using the function Read10X().
Resource Title: Herrera-Uribe & Wiarda et al. PBMCs - All Cells Metadata.
File Name: PBMC7_AllCells_meta.csv
Resource Description: .csv file containing metadata for cells included in the final dataset. Metadata columns include:
\nResource Title: Herrera-Uribe & Wiarda et al. PBMCs - All Cells PCA Coordinates.
File Name: PBMC7_AllCells_PCAcoord.csv
Resource Description: .csv file containing first 100 PCA coordinates for cells.
Resource Title: Herrera-Uribe & Wiarda et al. PBMCs - All Cells t-SNE Coordinates.
File Name: PBMC7_AllCells_tSNEcoord.csv
Resource Description: .csv file containing t-SNE coordinates for all cells.
Resource Title: Herrera-Uribe & Wiarda et al. PBMCs - All Cells UMAP Coordinates.
File Name: PBMC7_AllCells_UMAPcoord.csv
Resource Description: .csv file containing UMAP coordinates for all cells.
Resource Title: Herrera-Uribe & Wiarda et al. PBMCs - CD4 T Cells t-SNE Coordinates.
File Name: PBMC7_CD4only_tSNEcoord.csv
Resource Description: .csv file containing t-SNE coordinates for only CD4 T cells (clusters 0, 3, 4, 28). A dataset of only CD4 T cells can be re-created from the PBMC7_AllCells.h5Seurat, and t-SNE coordinates used in publication can be re-assigned using this .csv file.
Resource Title: Herrera-Uribe & Wiarda et al. PBMCs - CD4 T Cells UMAP Coordinates.
File Name: PBMC7_CD4only_UMAPcoord.csv
Resource Description: .csv file containing UMAP coordinates for only CD4 T cells (clusters 0, 3, 4, 28). A dataset of only CD4 T cells can be re-created from the PBMC7_AllCells.h5Seurat, and UMAP coordinates used in publication can be re-assigned using this .csv file.
Resource Title: Herrera-Uribe & Wiarda et al. PBMCs - Gamma Delta T Cells UMAP Coordinates.
File Name: PBMC7_GDonly_UMAPcoord.csv
Resource Description: .csv file containing UMAP coordinates for only gamma delta T cells (clusters 6, 21, 24, 31). A dataset of only gamma delta T cells can be re-created from the PBMC7_AllCells.h5Seurat, and UMAP coordinates used in publication can be re-assigned using this .csv file.
Resource Title: Herrera-Uribe & Wiarda et al. PBMCs - Gamma Delta T Cells t-SNE Coordinates.
File Name: PBMC7_GDonly_tSNEcoord.csv
Resource Description: .csv file containing t-SNE coordinates for only gamma delta T cells (clusters 6, 21, 24, 31). A dataset of only gamma delta T cells can be re-created from the PBMC7_AllCells.h5Seurat, and t-SNE coordinates used in publication can be re-assigned using this .csv file.
Resource Title: Herrera-Uribe & Wiarda et al. PBMCs - Gene Annotation Information.
File Name: UnfilteredGeneInfo.txt
Resource Description: .txt file containing gene nomenclature information used to assign gene names in the dataset. 'Name' column corresponds to the name assigned to a feature in the dataset.
Resource Title: Herrera-Uribe & Wiarda et al. PBMCs - All Cells H5Seurat.
File Name: PBMC7.tar
Resource Description: .h5Seurat object of all cells in PBMC dataset. File needs to be untarred, then read into R using function LoadH5Seurat().
This dataset was generated from soybean (Glycine max) field trials conducted at the West Tennessee Research and Education Center in Jackson, TN and at the Research and Education Center at Milan in Milan, TN as well as from molecular marker screening conducted at the West Tennessee Research and Education Center in Jackson, TN.
\nTable 3 includes measured data for height, yield, and seed size, and rating data for lodging and seed quality for JTN-5110, 5601T, and select other released germplasm lines and cultivars tested in replicated breeder yield trials in Jackson and Milan, TN from 2010-2016, excluding 2014. This data may be useful in measuring yield gain in future releases of soybean germplasm or cultivars with broad resistance to soybean cyst nematode (SCN; Heterodera glycines). This data should not be used to measure yield gain for elite high-yielding cultivars that do not have broad cyst nematode resistance.
\nTable 5 includes rating data for JTN-5110 and soybeans with established SCN resistance from simple sequence repeat (SSR) markers: Satt309 and Sat_168, associated with rhg1 on chromosome 18; Sat_162, associated with Rhg4 on chromosome 8; and Satt574, associated with cqSCN-005 on chromosome 17. This data may be useful in understanding the role of these molecular regions in SCN resistance for JTN-5110 and parent line Anand. This data should not be used to draw broad conclusions about cyst nematode resistance, in general.
\nTable 7 includes rating data for JTN-5110 and check cultivars from frogeye leafspot (caused by Cercospora sojina) field disease screenings conducted in Milan, TN from 2010-2012. This data may be useful in measuring changes in frogeye leafspot incidence and severity in West Tennessee. This data should not be used to draw broad conclusions or represent different geographic areas.
Resource Title: Data dictionary.
File Name: data dictionary.csv
Resource Description: A data dictionary defining the fields in Tables 3, 5, and 7
Resource Software Recommended: Microsoft Excel,url: https://www.microsoft.com/en-us/microsoft-365/excel
Resource Title: Table 3 - JTN-5110 compared to 5601T.
File Name: Table 3 - JTN-5110 compared to 5601T.csv
Resource Description: Breeder yield trial data from Jackson and Milan, TN from 2010-2016, excluding 2014
Resource Software Recommended: Microsoft Excel,url: https://www.microsoft.com/en-us/microsoft-365/excel
Resource Title: Table 5 - compiled marker data.
File Name: Table 5 - compiled marker data.csv
Resource Description: Genetic marker data for SSR markers associated with soybean cyst nematode resistance. Screening conducted in Jackson, TN from 2005-2020.
Resource Software Recommended: Microsoft Excel,url: https://www.microsoft.com/en-us/microsoft-365/excel
Resource Title: Table 7 - frogeye leafspot evaluation.
File Name: Table 7 - frogeye leafspot evaluation.csv
Resource Description: Data from frogeye leafspot field screening conducted in Milan, TN from 2010-2012.
Resource Software Recommended: Microsoft Excel,url: https://www.microsoft.com/en-us/microsoft-365/excel
We monitored populations of the stem weevil, Mecinus janthiniformis, the invasive alien weed Dalmatian toadflax (Linaria dalmatica) and other vegetation to document the impact of using M. janthiniformis as a biological control agent of L. dalmatica. Weevils were released in 2008 and again in 2014 after a wild fire. The results document increases and spread of weevil populations, decrease in Dalmatian toadflax and changes in cover of some vegetation classes.
Resource Title: Consolidated data dictionary.
File Name: consolidated_HV_meta.csv
Resource Description: Description of variables in Condensed_HV data file
Resource Software Recommended: Microsoft Excel,url: http://www.microsoft.com
Resource Title: Consolidated data.
File Name: consolidated_HV.csv
Resource Description: Condensed data for each site by year for plant size, weevil density, vegetation cover and meteorological data, 2008-2019.
Resource Software Recommended: Microsoft Excel,url: http://www.microsoft.com
Resource Title: Cover_2008 data dictionary.
File Name: cover_2008_HV_meta.csv
Resource Description: description of variables in the file cover_2008_HV
Resource Software Recommended: Microsoft Excel,url: http://www.microsoft.com
Resource Title: vegetation cover 2008.
File Name: cover_2008_HV.csv
Resource Description: vegetation cover 2008-2011
Resource Software Recommended: Microsoft Excel,url: http://www.microsoft.com
Resource Title: vegetation cover 2013 data dictionary.
File Name: cover_2013_HV_meta.csv
Resource Description: description of variables in the file cover_2013_HV, which contains vegetation cover 2013-2019
Resource Title: vegetation cover 2013.
File Name: cover_2013_HV.csv
Resource Description: vegetation cover 2013-2019
Resource Software Recommended: Microsoft Excel,url: http://www.microsoft.com
Resource Title: dissections 2009 data dictionary.
File Name: dissections_2009_HV_meta.csv
Resource Description: Description of variables in the file dissections_2009_HV, containing dissections of toadflax stems 2009-2011
Resource Software Recommended: Microsoft Excel,url: http://www.microsoft.com
Resource Title: dissections 2009-2011.
File Name: dissections_2009_HV.csv
Resource Description: Data from dissection of toadflax stems 2009-2011
Resource Software Recommended: Microsoft Excel,url: http://www.microsoft.com
Resource Title: dissections 2012 data dictionary.
File Name: dissections_2012_HV_meta.csv
Resource Description: description of variables in the file dissections_2012_HV, containing data from dissections of toadflax stems 2012-2019
Resource Title: dissections 2012-2019.
File Name: dissections_2012_HV.csv
Resource Description: data from dissection of toadflax stems 2012-2019
Resource Software Recommended: Microsoft Excel,url: http://www.microsoft.com
Resource Title: stem_counts data dictionary.
File Name: stem_counts_HV_meta.csv
Resource Description: description of variables in the file stem_counts_HV, which contains data on number of toadflax stems in 25 x 50 cm quadrats, 2008-2013
Resource Software Recommended: Microsoft Excel,url: http://www.microsoft.com
Resource Title: stem_counts.
File Name: stem_counts_HV.csv
Resource Description: Number of toadflax stems in 25 x 50 cm quadrats, 2008-2013
Resource Software Recommended: Microsoft Excel,url: http://www.microsoft.com
Resource Title: stem_height data dictionary.
File Name: stem_height_HV_meta.csv
Resource Description: description of variables in the file stem_height_HV.csv, which contains data on height of live Linaria dalmatica stems, 2008-2019
Resource Software Recommended: Microsoft Excel,url: http://www.microsoft.com
Resource Title: stem_height.
File Name: stem_height_HV.csv
Resource Description: height of live stems of Linaria dalmatica, 2008-2019
Resource Software Recommended: Microsoft Excel,url: http://www.microsoft.com
Risks of post-introduction evolution in insects introduced to control invasive pests have been discussed for some time, but little is known about responses to selection or genetic architectures of host adaptation and thus about the likelihood or rapidity of evolutionary shifts. We report here results on the response to selection and genetic architecture of parasitism of a sub-optimal, low-preference host species by an aphid parasitoid, Aphelinus rhamni, a candidate for introduction against the soybean aphid, Aphis glycines. The parasitoid was collected in Beijing, China, from the soybean aphid on a Rhamnus species. In the laboratory at the USDA-ARS, Newark, Delaware, we selected A. rhamni for increased parasitism of Rhopalsiphum padi by rearing the parasitoid on this aphid for three generations. We measured parasitism of R. padi at generations two and three, and at generation three, crossed and backcrossed parasitoids from the populations reared on R. padi with those from populations reared on Aphis glycines and compared parasitism of both R. padi and Aphis glycines among F1 and backcross females. Aphelinus rhamni responded rapidly to selection for parasitism of R. padi. Selection for R. padi parasitism reduced parasitism of Aphis glycines, the original host of A. rhamni. However, parasitism of R. padi did not increase from generation two to generation three of selection, suggesting reduced variance available for selection, which was indeed found. We tested the associations between 184 single nucleotide polymorphisms (SNP) and increased parasitism of R. padi and found 28 SNP loci, some of which were associated with increased and others with decreased parasitism of R. padi. We assembled and annotated the A. rhamni genome, mapped all SNP loci to contigs, and tested whether genes on contigs with SNP loci associated with parasitism were enriched for candidate genes or gene functions. We identified 80 genes on these contigs that mapped to 1.2 Mb of the 483 Mb genome of A. rhamni but found little enrichment of candidate genes or gene functions.
Resource Title: data_dictionary_selection_response_Aphelinus_rhamni.
File Name: data_dictionary_selection_response_Aphelinus_rhamni.csv
Resource Description: data dictionary for phenotype files
Resource Title: Selection_response_Aphelinus_rhamni_generation_2.
File Name: Selection_response_Aphelinus_rhamni_generation_2_2011.csv
Resource Description: Phenotypic data for parasitism of Rhopalosiphum padi by Aphelinus rhamni after two generations of selection on this aphid.
Resource Title: Selection_response_Aphelinus_rhamni_generation_3.
File Name: Selection_response_Aphelinus_rhamni_generation_3_2011.csv
Resource Description: Phenotypic data for parasitism of Rhopalosiphum padi by Aphelinus rhamni after three generations of selection on this aphid.
Resource Title: Selection_response_Aphelinus_rhamni_F1.
File Name: Selection_response_Aphelinus_rhamni_F1_2011.csv
Resource Description: Phenotypic data for parasitism of Rhopalosiphum padi by Aphelinus rhamni F1 females from cross between control females and females from three generations of selection on this aphid.
Resource Title: Selection_response_Aphelinus_rhamni_BC.
File Name: Selection_response_Aphelinus_rhamni_BC_2011.csv
Resource Description: Phenotypic data for parasitism of Rhopalosiphum padi by backcross females of Aphelinus rhamni from crosses between control males and F1 females that were hybrids of control females and males from populations that had been selected on this aphid for three generations.
Description: This dataset consists of field data (arthropods, nematodes and NDVI) collected over the course of 6 field excursions in 2015 and 2016 near TyTy, GA, in a field used for growing Miscanthus x giganteus. It also includes interpolated values of soil measurements collected in 2015 and meteorological data collected on an adjacent farm. Point-in-time measurements include all meteorological, NDVI, arthropod and nematode measurements and their derivatives. Fixed values were measurements that were held constant across all sampling dates, including location, terrain and soils measurements and their derivatives.
\nDawn Olson and Jason Schmidt collected and processed arthropod count data. Jason Schmidt collected and processed spider count data and computed spider diversity. Richard Davis collected and processed nematode count data. Alisa Coffin collected and processed NDVI data and positional locations. Tim Strickland collected and processed soils data and Alisa Coffin interpolated soils values using kriging to derive values at arthropod sample locations. David Bosch collected and processed meteorological data. Lynne Seymour provided statistical expertise in deriving any estimated values (phloem feeders, parasitoids, spiders, and natural enemies). Alisa Coffin derived terrain data (elevation, slope, aspect, and distances) from publicly available datasets, transformed values (SI, WI, etc), carried out the geographically weighted regression analysis and calculated C:SE values, harmonized the full dataset, and compiled it using Esri's ArcGIS Pro 2.5. Methods for most data are published in the accompanying paper and associated supplements.
\nQuestions about dataset development and management should be directed to Alisa Coffin (alisa.coffin@usda.gov). This work was accomplished as a joint USDA and University of Georgia project funded by a cooperative agreement (#6048-13000-026-21S). This research was a contribution from the Long-Term Agroecosystem Research (LTAR) network. LTAR is supported by the United States Department of Agriculture.
\nAt request of the author, the data resources are under embargo. The embargo will expire on Fri, Jan 01, 2021.
\nResource Title: Spreadsheet of data.
File Name: GibbsMisFarm_Arthrop_Env_DepVar_201516_final.xlsx
Resource Description: This workbook contains all of the data used in this analysis. The first worksheet contains data dictionary information.
Resource Software Recommended: Microsoft Excel, Office 365,url: https://www.microsoft.com/en-us/microsoft-365/excel
Resource Title: GeoJSON.
File Name: MiscanthusXGiganteusGeoJSON.json
Southern green stink bug [Nezara viridula (L.)] adults and other pentatomid pests can transmit pathogens (e.g., the bacterium Pantoea agglomerans) that cause disease in cotton (Gossypium hirsutum L.) and other high-value cash crops worldwide. First instars of N. viridula were recently shown to ingest P. agglomerans strain Sc1R with rifampicin-resistance, and to retain the pathogen to the 2nd instar. The objective of this study was to determine the acquisition of P. agglomerans Sc1R by early instars of N. viridula and determine persistence of P. agglomerans Sc1R across subsequent stadia. In three trials, early instars (1st and 2nd) were exposed to P. agglomerans Sc1R and subsequently maintained to adulthood; cohorts were sampled at 3rd and 5th instars, as well as adults. In every trial, P. agglomerans Sc1R was detected in all stadia, including adults, but significantly higher frequencies of infection than expected were observed at the initial stage of infection (either 1st or 2nd instar). Higher densities of P. agglomerans Sc1R were detected in 1st and 2nd instars, and lower densities were observed in subsequent stadia. Densities of innate bacterial flora were generally lower when the initial stage of exposure was at 1st instar than when the initial stage of exposure was at the 2nd instar. Overall, half of the adults possessed P. agglomerans Sc1R. These findings demonstrated that N. viridula nymphs can acquire P. agglomerans Sc1R and retain the pathogen to adulthood. Potential avenues of research to further elucidate the implications of nymphs harboring pathogens to adulthood are discussed.
Resource Title: Raw data for interstadial retention of Pantoea agglomerans Sc1R by southern green stink bug stadia.
File Name: Interstadial pathogen retention_final data.csv
Resource Description: Raw data for Retention of Sc1R across interstadial molts of the southern green stink bug, 2019; CFU, colony-forming units; CFUs_count, number of colony-forming units; LBA, Luria Bertani agar; LBA_Rif, Luria Bertani agar amended with rifampicin; Sc1R, Pantoea agglomerans Sc1R
Resource Title: Summary tables of LSMeans and back-transformed means for densities of Pantoea agglomerans and general bacteria across southern green stink bug stadia.
File Name: Log-LSMeans and back_transformed means for Pantoea agglomerans Sc1R densities in southern green stink bug stadia.csv
Resource Description: Summary tables of densities of P. agglomerans Sc1R and general bacteria across stadia of the southern green stink bug.
Life Table Data: Field-based, partial life table data for immature stages of Bemisia tabaci on cotton in Maricopa, Arizona, USA. Data were generated on approximately 200 individual insects per cohort with 2-5 cohorts per year for a total of 44 cohorts between 1997 and 2010. Data provide the marginal, stage-specific rates of mortality for eggs, and 1st, 2nd, 3rd, and 4th instar nymphs. Mortality is characterized as caused by inviability (eggs only), dislodgement, predation, parasitism and unknown. Detailed methods can be found in Naranjo and Ellsworth 2005 (Entomologia Experimentalis et Applicata 116(2): 93-108). The method takes advantage of the sessile nature of immature stages of this insect. Briefly, an observer follows individual eggs or settled first instar nymphs from natural populations on the underside of cotton leaves in the field with a hand lens and determines causes of death for each individual over time. Approximately 200 individual eggs and nymphs are observed for each cohort. Separately, densities of eggs and nymphs are monitored with standard methods (Naranjo and Flint 1994, Environmental Entomology 23: 254-266; Naranjo and Flint 1995, Environmental Entomology 24: 261-270) on a weekly basis.
\nMatrix Model Data: Life table data were used to provide parameters for population matrix models. Matrix models contain information about stage-specific rates for development, survival and reproduction. The model can be used to estimate overall population growth rate and can also be analyzed to determine which life stages contribute the most to changes in growth rates.
Resource Title: Matrix model data from Naranjo, S.E. (2017) Retrospective analysis of a classical biological control program. Journal of Applied Ecology.
File Name: MatrixModelData.xlsx
Resource Description: Life table data were used to provide parameters for population matrix models. Matrix models contain information about stage-specific rates for development, survival and reproduction. The model can be used to estimate overall population growth rate and can also be analyzed to determine which life stages contribute the most to changes in growth rates.
Resource Title: Data Dictionary: Life table data.
File Name: DataDictionary_LifeTableData.csv
Resource Title: Life table data from Naranjo, S.E. (2017) Retrospective analysis of a classical biological control program. Journal of Applied Ecology.
File Name: LifeTableData.xlsx
Resource Description: Field-based, partial life table data for immature stages of Bemisia tabaci on cotton in Maricopa, Arizona, USA. Data were generated on approximately 200 individual insects per cohort with 2-5 cohorts per years for a total of 44 cohorts between 1997 and 2010. Data provide the marginal, stage-specific rates of mortality for eggs, and 1st, 2nd, 3rd, and 4th instar nymphs. Mortality is characterized as caused by inviability (eggs only), dislodgement, predation, parasitism and unknown. Detailed methods can be found in Naranjo and Ellsworth 2005 (Entomologia, Experimentalis et Applicata 116: 93-108). The method takes advantage of the sessile nature of immature stages of this insect. Briefly, an observer follows individual eggs or settled first instar nymphs from natural populations on the underside of cotton leaves in the field with a hand lens and determines causes of death for each individual over time. Approximately 200 individual eggs and nymphs are observed for each cohort. Separately, densities of eggs and nymphs are monitored with standard methods (Naranjo and Flint 1994, Environmental Entomology 23: 254-266; Naranjo and Flint 1995, Environmental Entomology 24: 261-270) on a weekly basis.
Resource Title: Life table data from Naranjo, S.E. (2017) Retrospective analysis of a classical biological control program. Journal of Applied Ecology.
File Name: LifeTableData.csv
Resource Description: CSV version of the data. Field-based, partial life table data for immature stages of Bemisia tabaci on cotton in Maricopa, Arizona, USA. Data were generated on approximately 200 individual insects per cohort with 2-5 cohorts per years for a total of 44 cohorts between 1997 and 2010. Data provide the marginal, stage-specific rates of mortality for eggs, and 1st, 2nd, 3rd, and 4th instar nymphs. Mortality is characterized as caused by inviability (eggs only), dislodgement, predation, parasitism and unknown. Detailed methods can be found in Naranjo and Ellsworth 2005 (Entomologia, Experimentalis et Applicata 116: 93-108). The method takes advantage of the sessile nature of immature stages of this insect. Briefly, an observer follows individual eggs or settled first instar nymphs from natural populations on the underside of cotton leaves in the field with a hand lens and determines causes of death for each individual over time. Approximately 200 individual eggs and nymphs are observed for each cohort. Separately, densities of eggs and nymphs are monitored with standard methods (Naranjo and Flint 1994, Environmental Entomology 23: 254-266; Naranjo and Flint 1995, Environmental Entomology 24: 261-270) on a weekly basis.
Influenza A virus in swine hemagglutinin (HA) gene sequence data for 9 virus strains.
Resource Title: H1N1pdm09 HA gene sequences.
File Name: USDA-commons-2023-01-03.fasta
Resource Description: 9 hemagglutinin (HA) gene sequences of influenza A virus collected from swine.
Historic data from the Water Resources and Erosion (WRE) watersheds at Grazinglands Research Laboratory (GRL), USDA-ARS, El Reno, OK. The WRE watersheds are eight 1.6 ha experimental watersheds established and instrumented in 1976 to measure precipitation and surface runoff quantity and quality. Data was collected from 1977 through 1999 and includes precipitation, runoff, sediment loads, water quality (N, P, suspended sediments), and land management data. These datasets are valuable resources to improve modeling in relation to land use and management changes, climate variability, and other environmental factors and may be useful in developing strategies to mitigate environmental impacts of agricultural systems.
Resource Title: WRE Daily Water Quality Data.
File Name: WRE daily water quality.csv
Resource Description: Daily runoff and sediment load values from the WRE experimental watersheds.
Resource Title: WRE Water Quality Event Data.
File Name: WRE event water quality_import.csv
Resource Description: Event data for WRE watersheds including: sediment, rainfall, runoff, nitrogen species, phosphorus species, chlorine, sulfate, pH, conductivity, sodium, potassium, calcium, and magnesium.
Resource Title: WRE Grazing.
File Name: WRE Grazing.csv
Resource Description: Grazing data for WRE watersheds. Dates on, off, cattle variety and number, and crop.
Resource Title: WRE Tillage.
File Name: WRE Tillage.csv
Resource Description: Tillage data for the WRE watersheds. Includes date, tillage implement, min and max depths, and additional comments.
Resource Title: WRE Harvest.
File Name: Harvest.csv
Resource Description: Harvest data for the WRE watersheds including date, crop, harvest type, yield, units, and additional comments.
Resource Title: WRE Management Activities.
File Name: WRE Misc Management Import.csv
Resource Description: Other management activities known for the WRE watersheds with date and comments where given.
Resource Title: WRE Planting.
File Name: WRE Planting.csv
Resource Description: Planting data for the WRE watersheds including date, crop, variety, seed rate, unit, spacing, and comments.
Resource Title: WRE Pesticides.
File Name: WRE Pesticides_import.csv
Resource Description: Pesticide use data for the WRE watersheds including date, application rate, units, application method, and comment.
Resource Title: WRE Fertilizer.
File Name: WRE Fertilizer.csv
Resource Description: Fertilizer application data for the WRE watersheds including date, crop, fertilizer used, rate, units, application method, and comments.
Supplementary raw data, R scripts, and results underpinning analyses of geometric morphometric and linear data derived from scale insects; includes source code for all analyses, raw data for ostiole, leg, and body shape analyses, and alpha tables for body size analysis and ostioles analyses. Abbreviations are defined in the R script file. See README for list of resources.
", "title": "Data from: Scale Insect (Hemiptera: Coccomorpha) Morphology is Transformed Under Trophobiosis", "distribution": [ { "@type": "dcat:Distribution", "downloadURL": "https://ndownloader.figshare.com/files/44541173", "format": "txt", "mediaType": "text/plain", "title": "PCA_MANOVA_stats.txt" }, { "@type": "dcat:Distribution", "downloadURL": "https://ndownloader.figshare.com/files/44541179", "format": "csv", "mediaType": "text/plain", "title": "Raw Data Linear Leg and Body Measurements.csv" }, { "@type": "dcat:Distribution", "downloadURL": "https://ndownloader.figshare.com/files/44541182", "format": "csv", "mediaType": "application/csv", "title": "PosteriorOstiolesdata.csv" }, { "@type": "dcat:Distribution", "downloadURL": "https://ndownloader.figshare.com/files/44541185", "format": "csv", "mediaType": "text/plain", "title": "AnteriorOstiolesdata.csv" }, { "@type": "dcat:Distribution", "downloadURL": "https://ndownloader.figshare.com/files/44541188", "format": "R", "mediaType": "text/plain", "title": "mealygeomorphscript.R" }, { "@type": "dcat:Distribution", "downloadURL": "https://ndownloader.figshare.com/files/44541191", "format": "csv", "mediaType": "text/plain", "title": "shapelabels_all.csv" }, { "@type": "dcat:Distribution", "downloadURL": "https://ndownloader.figshare.com/files/44541194", "format": "csv", "mediaType": "application/csv", "title": "shapelabels2_noxeno.csv" }, { "@type": "dcat:Distribution", "downloadURL": "https://ndownloader.figshare.com/files/44541197", "format": "csv", "mediaType": "text/plain", "title": "shapelabels3_rhizo.csv" }, { "@type": "dcat:Distribution", "downloadURL": "https://ndownloader.figshare.com/files/44541200", "format": "txt", "mediaType": "text/plain", "title": "shape_all.tps_.txt" }, { "@type": "dcat:Distribution", "downloadURL": "https://ndownloader.figshare.com/files/44541203", "format": "txt", "mediaType": "text/plain", "title": "shape2_noxeno.tps_.txt" }, { "@type": "dcat:Distribution", "downloadURL": "https://ndownloader.figshare.com/files/44541209", "format": "txt", "mediaType": "text/plain", "title": "shape3_rhizo.tps_.txt" }, { "@type": "dcat:Distribution", "downloadURL": "https://ndownloader.figshare.com/files/44541212", "format": "csv", "mediaType": "text/plain", "title": "labels.csv" }, { "@type": "dcat:Distribution", "downloadURL": "https://ndownloader.figshare.com/files/44541215", "format": "txt", "mediaType": "text/plain", "title": "README_13.txt" }, { "@type": "dcat:Distribution", "downloadURL": "https://ndownloader.figshare.com/files/44541218", "format": "zip", "mediaType": "application/zip", "title": "randtps_all.zip" } ], "license": "https://www.usa.gov/publicdomain/label/1.0/", "bureauCode": [ "005:18" ], "modified": "2024-02-15", "publisher": { "@type": "org:Organization", "name": "Agricultural Research Service" }, "keyword": [ "Acropyga", "Coccoidea", "Coccomorpha", "morphometrics", "mutualism", "root mealybug", "NP304", "data.gov", "ARS" ], "spatial": "{\"type\": \"Polygon\", \"coordinates\": [[[-129.03433799744, 47.683130004374], [163.74701499939, 49.398741858396], [160.1985168457, -45.551323170928], [-125.91825485229, -16.83321464151], [-129.03433799744, 47.683130004374]]]}" }, { "identifier": "10.15482/USDA.ADC/24851667.v1", "accessLevel": "public", "contactPoint": { "hasEmail": "mailto:Daniel.Wren@usda.gov", "fn": "Wren, Daniel" }, "programCode": [ "005:040" ], "description": "This is the dataset that was used to make the figures for the publication entitled \"Sediment transport and bed topography for realistic unsteady flow hydrographs of varying length in a laboratory flume.\"
The citation for the publication is: Wren, D. G., Kuhnle, R. A., McAlpin, T. O., Langendoen, E. L. Sediment transport and bed topography for realistic unsteady flow hydrographs of varying length in a laboratory flume. Journal of Hydraulic Engineering. 10.1061/JHEND8/HYENG-13769
How the dataset was generated: Experiments were conducted at the USDA-ARS National Sedimentation Laboratory in a 30-meters long x 1.22-meters wide x 0.61-meter-deep flume channel with a frequency-controlled pump motor and adjustable slope. The sand for the bed was purchased from a local source and had a median particle size of 0.43 mm. The bed load transport rate was measured by a Sedflux system that operated at 1 Hz (Hertz, cycles per second) using two drums suspended from load cells over 1.2 meters wide by 0.57 meters long sediment trap that was 28.5 meters from the channel origin. The mass of sand accumulated in the drums was recorded continuously, and the drums were dumped after the mass of sediment reached 30 kilograms. After leaving the drums, the sand particles were circulated through a 0.152-meter diameter pipeline and re-entered the flume at the upstream end. Material that bypassed the trap entered the main return pipe and was sampled from the center of the return pipe just downstream of the pump impellor using a 10.6-millimeter diameter sampling nozzle. Flow velocity into the nozzle was matched to the mean return line flow velocity to avoid biasing the concentration measurements. Discharge in the sampling line was checked by measuring the mass of water accumulated over time. Sediment-laden water was passed through a 0.062 mm sieve that retained sand particles and allowed the water to return to the flume channel. The mean sediment concentration from the physical samples was used to calculate the load that bypassed the Sedflux system. Bed surface elevations were measured acoustically at a rate of 10 Hertz using 32 transducers with an acoustic frequency of 5-million cycles per second, fired sequentially. The transducers were spaced at 3.7-centimeter intervals in a PVC bar with a blunt face and narrow trailing edge to minimize flow separation and drag. The transducers were held at a constant distance from the bottom of the flume and were always in contact with the water surface. The range data measured in the experiments was subtracted from the measured distance to the flume bottom to result in bed elevations. The working section of the flume, which took 3.85 minutes to scan, extended from 7.7 meters to 22.7 meters from the origin at the flume headbox. Position data recorded along with the acoustic range data was used to assign streamwise positions relative to the flume origin.
Why the dataset was generated: Relative to the research into sediment transport in unsteady flows for gravel and gravel/sand mixtures, less research has focused on sand-bedded channels and the evolution of sand bedforms in response to changing flows. Even less research has combined sand load with detailed topographic measurements to arrive at a comprehensive picture of the adjustment processes for topography and transport rate caused by unsteady flow conditions. Additional research is needed to provide the data necessary for investigating relationships between unsteady flow rates, sediment transport, and bed topography. The dataset expands on previous research into sediment transport and bed topography in unsteady flows by having detailed, real-time measurements of bed topography over the width of a 15-m section of a laboratory flume, continuous measurements of sediment transport rate throughout the experiments, and continuous measurements of water-surface slope at 10 points along the test section. These measurements allowed for interactions between changing flow rates, bed topography, water surface slope, and sediment transport to be evaluated before, during, and after the flow hydrographs. The results include detailed analysis of data collected during non-symmetric flow hydrographs of 1-, 2-, 3-, 4-, 5-, and 6-hour duration over a sand bed in a laboratory flume at the USDA-ARS National Sedimentation Laboratory.
Data resources: Each file contains the data used to generate the figure corresponding to the figure number in the filename for the publication (to be updated with accepted and published): Wren, D. G., Kuhnle, R. A., McAlpin, T. O., Langendoen, E. L. Sediment transport and bed topography for realistic unsteady flow hydrographs of varying length in a laboratory flume. Journal of Hydraulic Engineering. DOI:10.1061/JHEND8/HYENG-13769.
CSV variable output from Figure_1.csv CSV variable output from Figure_2.csv CSV variable output from Figure_3.csv CSV variable output from Figure_4.csv CSV variable output from Figure_5.csv CSV variable output from Figure_6.csv CSV variable output from Figure_7.csv CSV variable output from Figure_8.csv CSV variable output from Figure_9.csv CSV variable output from Figure_10.csv CSV variable output from Figure_11.csv CSV variable output from Figure_12.csv CSV variable output from Figure_13.csv CSV variable output from Figure_14.csv
", "title": "Data from: Sediment transport and bed topography for realistic unsteady flow hydrographs of varying length in a laboratory flume", "distribution": [ { "@type": "dcat:Distribution", "downloadURL": "https://ndownloader.figshare.com/files/43726101", "format": "csv", "mediaType": "text/plain", "title": "CSV variable output from Figure_1.csv" }, { "@type": "dcat:Distribution", "downloadURL": "https://ndownloader.figshare.com/files/43726104", "format": "csv", "mediaType": "text/plain", "title": "CSV variable output from Figure_3.csv" }, { "@type": "dcat:Distribution", "downloadURL": "https://ndownloader.figshare.com/files/44408306", "format": "csv", "mediaType": "text/plain", "title": "CSV data output from Figure 4.csv" }, { "@type": "dcat:Distribution", "downloadURL": "https://ndownloader.figshare.com/files/44408183", "format": "csv", "mediaType": "text/plain", "title": "CSV data output from Figure 5.csv" }, { "@type": "dcat:Distribution", "downloadURL": "https://ndownloader.figshare.com/files/44408189", "format": "csv", "mediaType": "text/plain", "title": "CSV data output from Figure 6.csv" }, { "@type": "dcat:Distribution", "downloadURL": "https://ndownloader.figshare.com/files/44408192", "format": "csv", "mediaType": "text/plain", "title": "CSV data output from Figure 7.csv" }, { "@type": "dcat:Distribution", "downloadURL": "https://ndownloader.figshare.com/files/44408225", "format": "csv", "mediaType": "text/plain", "title": "CSV data output from Figure 8.csv" }, { "@type": "dcat:Distribution", "downloadURL": "https://ndownloader.figshare.com/files/44408297", "format": "csv", "mediaType": "text/plain", "title": "CSV data output from Figure 9.csv" }, { "@type": "dcat:Distribution", "downloadURL": "https://ndownloader.figshare.com/files/44408303", "format": "csv", "mediaType": "text/plain", "title": "CSV data output from Figure 10.csv" }, { "@type": "dcat:Distribution", "downloadURL": "https://ndownloader.figshare.com/files/44408276", "format": "csv", "mediaType": "text/plain", "title": "CSV data output from Figure 11.csv" }, { "@type": "dcat:Distribution", "downloadURL": "https://ndownloader.figshare.com/files/44408273", "format": "csv", "mediaType": "text/plain", "title": "CSV data output from Figure 12.csv" }, { "@type": "dcat:Distribution", "downloadURL": "https://ndownloader.figshare.com/files/44408249", "format": "csv", "mediaType": "text/plain", "title": "CSV data output from Figure 13.csv" }, { "@type": "dcat:Distribution", "downloadURL": "https://ndownloader.figshare.com/files/44408261", "format": "csv", "mediaType": "text/plain", "title": "CSV data output from Figure 14.csv" }, { "@type": "dcat:Distribution", "downloadURL": "https://ndownloader.figshare.com/files/44408258", "format": "csv", "mediaType": "text/plain", "title": "CSV data output from Figure 15.csv" }, { "@type": "dcat:Distribution", "downloadURL": "https://ndownloader.figshare.com/files/44408255", "format": "csv", "mediaType": "text/plain", "title": "CSV data output from Figure 16.csv" } ], "license": "https://www.usa.gov/publicdomain/label/1.0/", "bureauCode": [ "005:18" ], "modified": "2024-04-29", "publisher": { "@type": "org:Organization", "name": "Agricultural Research Service" }, "keyword": [ "sediment transport", "unsteady flows", "non equilibrium sediment transport", "bedforms" ], "spatial": "{\"type\": \"Point\", \"coordinates\": [-89.535870552063, 34.379439746018]}" }, { "identifier": "10.15482/USDA.ADC/1528999", "accessLevel": "public", "contactPoint": { "hasEmail": "mailto:robert.srygley@usda.gov", "fn": "Srygley, Robert" }, "programCode": [ "005:040" ], "description": "Data from a diet choice experiment on Mormon crickets Anabrus simplex (Orthoptera: Tettigoniidae) reared in the laboratory. Three groups were tested for immune response to inoculation with Beauveria bassiana fungus, an insect pathogen. One group had phenoloxidase (PO), prophenoloxidase (proPO), and total hemolymph protein assayed four times to create a time series from one day before to six days following treatment. A second group had PO, proPO and total protein assayed once on day four following treatment for comparison with those that were wounded multiple times, and a third group was assayed once on day one following treatment for comparison with those assayed on day four.
\nResources in this dataset:
\nResource Title: Contains descriptions of the data analyzed for Selective Protein Starvation by Mormon crickets Following Fungal Attack\nFile Name: Readme.rtf\nResource Description: Three related data sets are included with this text file.
\nResource Title: Protein and Carbohydrate Intake for Inoculated Mormon crickets and Controls\nFile Name: InducedImmunityIdaho4dayIntakes.csv\nResource Description: Dry mass consumption of P diet was averaged for days 1-3 or days 4-8, and multiplied by 0.42 to yield average daily protein consumption for the two time periods (in mg). The same was done to yield carbohydrate consumption. (c=control, i=inoculated, m=male, f=female)
\nResource Title: Phenoloxidase, proPhenoloxidase and total hemolymph protein for Mormon crickets relative to the day of fungal treatment (day 0)\nFile Name: inducedImmunPOprotein.csv\nResource Description: After eclosing to adults, male and female Mormon crickets were evenly separated into three experimental sets. Four inoculated females and four males (fdi and mdi, respectively) and four control females and four males (fdc and mdc, respectively) had hemolymph drawn on the day prior to the fungal treatments for baseline assays and then hemolymph drawn repeatedly every other day following treatment. In order to determine whether the injury to draw hemolymph affected the immunity titer, a second set of four inoculated females and four males (fai and mai, respectively) and four control females and four males (fac and mac, respectively) were given the fungal treatments as above and hemolymph was drawn once on day 4. A third set of four inoculated females and four males (fpi and mpi, respectively) and four control females and four males (fpc and mpc, respectively) were treated and hemolymph was drawn once on the day following treatment (day 1).
\nResource Title: Body mass and survivorship of Mormon crickets following fungal inoculation\nFile Name: InducedImmunityIdahoMassSurvivorship.csv\nResource Description: The twelve inoculated females (fdi, fai, fpi) and 12 males (mdi, mai, mpi) and 12 control females (fdc, fac, fpc) and 12 males (mdc, mac, mpc) were checked daily for mortality. Cadavers were placed in 100% humidity and checked for Beauveria sporulation (white spores) on the exoskeleton and membranes after 4 days. Mass on the day that the insect molted to adult, the day of inoculation, each day that hemolymph was drawn, and on the day the insect died were recorded.
\nSelenium accumulation in vegetation has resulted in toxicity in livestock grazing on phosphate mine soils in Southeastern Idaho. Plant and soil samples were collected from sites located near phosphate mines. Soil physicochemical properties, Se speciation, and Se distribution from a sequential extraction procedure (SEP) were examined in relation to bioavailability in the Se-hyperaccumulator, western aster (Symphyotrichum ascendens Lindl.). Selenium-hyperaccumulators are plants that can absorb over 1000 mg Se kg−1 DM (Dry Matter). Chemical analyses revealed that western aster contained Se exceeding 6000 mg kg−1 DM. Soil speciation results indicated that selenite (SeO32−) was dominant with lower levels of selenate (SeO42−) present. This was expanded using an SEP that accounted for six fractions. Regression analyses indicated a strong relationship for western aster Se and the water-soluble and phosphate-extractable SEP fractions combined (R2 = 0.85). Once carbonate, amorphous Fe-oxide, organic, and residual Se fractions were factored into the analysis, the relationship decreased. A strong relationship between selenate and the water-soluble Se fraction was also observed (R2 = 0.83). Soluble and phosphate-extractable Se were determined to be \"bioavailable fractions\" for western aster. Thus, simple water extractions can be used for quick assessment of Se bioavailability and provide a means to identify potentially hazardous areas locations.
Resource Title: Supplementary Tables - Download docx.
File Name: 11104_2017_3299_MOESM1_ESM.docx, url: https://static-content.springer.com/esm/art:10.1007/s11104-017-3299-5/MediaObjects/11104_2017_3299_MOESM1_ESM.docx
Table 1. Selenite and selenate soil speciation with standard deviations for 10 soils in duplicate.\nTable 2. Sequential extraction procedure fractionation for 6 extractions with duplicate standard deviations for 78 soils.
The giant reed, Arundo donax, is a perennial grass species that has become an invasive plant in many countries. Expansive stands of A. donax have significant negative impacts on available water resources and efforts are underway to identify biological control agents against this species. The giant reed grows under adverse environmental conditions, displaying insensitivity to drought stress, flooding, heavy metals, salinity and herbaceous competition, thus hampering control programs. To establish a foundational molecular dataset, we used an llumina Hi-Seq protocol to sequence the transcriptome of actively growing shoots from an invasive genotype collected along the Rio Grande River, bordering Texas and Mexico. We report the assembly of 27,491 high confidence transcripts (≥200 bp) with at least 70% coverage of known genes in other Poaceae species. Of these 13,080 (47.58%), 6165 (22.43%) and 8246 (30.0%) transcripts have sequence similarity to known, domain-containing and conserved hypothetical proteins, respectively. We also report 75,590 low confidence transcripts supported by both trans-ABBySS and Velvet-Oases de novo assembly pipelines. Within the low confidence subset of transcripts we identified partial hits to known (19,021; 25.16%), domain-containing (7093; 9.38%) and conserved hypothetical (16,647; 22.02%) proteins. Additionally 32,829 (43.43%) transcripts encode putative hypothetical proteins unique to A. donax. Functional annotation resulted in 5,550 and 6,070 transcripts with assigned Gene Ontology and KEGG pathway information, respectively. The most abundant KEGG pathways are spliceosome, ribosome, ubiquitin mediated proteolysis, plant–pathogen interaction, RNA degradation and oxidative phosphorylation metabolic pathway. Furthermore, we also found 12, 9, and 4 transcripts annotated as stress-related, heat stress, and water stress proteins, respectively. It is envisaged that these resources will promote and facilitate studies of the abiotic stress capabilities of this exotic plant species, which facilitates its invasive capacity. Supplemental Excel data files with the article detail functional annotation of Arundo donax high confidence and low confidence genes. Data are also available at https://www.ncbi.nlm.nih.gov/nuccore/GBRH01000000 . The assembled and annotated A. donax USA genotype Rio Grande RNA transcriptome has been deposited at DDBJ/EMBL/GenBank under the project accession PRJNA256910.
\nResource Title: Shoot transcriptome of the giant reed, Arundo donax.
File Name: Web Page, url: https://www.sciencedirect.com/science/article/pii/S2352340914000377
*Data in Brief* article reporting the assembly of 27,491 high confidence transcripts (≥200 bp) for the giant reed, *Arundo donax* with at least 70% coverage of known genes in other Poaceae species.
Jasmonic acid is a natural plant hormone that induces native defense responses in plants. Sugarbeet (Beta vulgaris L.) root unigenes that were differentially expressed 2 and 60 days after a postharvest jasmonic acid treatment are presented. Data include changes in unigene expression relative to water-treated controls, unigene annotations against nonredundant (Nr), Swiss-Prot, Clusters of Orthologous Groups (COG), and Kyoto Encyclopedia of Genes and Genomes (KEGG) protein databases, and unigene annotations with Gene Ontology (GO) terms. Putative defense unigenes are compiled and annotated against the sugarbeet genome. Differential gene expression data were generated by RNA sequencing. Interpretation of the data is available in the research article, \"Jasmonic acid causes short- and long-term alterations to the transcriptome and the expression of defense genes in sugarbeet roots\" (K.K. Fugate, et al., Plant Gene 9:50-63)
Resource Title: Short- and long-term changes in sugarbeet (Beta vulgaris L.) gene expression due to postharvest jasmonic acid treatment - Data.
File Name: Web Page, url: https://www.sciencedirect.com/science/article/pii/S2352340917300276
Data in Brief: Data on sugarbeet root unigenes that were differentially expressed due to a postharvest jasmonic acid (JA) treatment are presented. Data identify unigenes that were differentially expressed 2 and 60 d after JA treatment. Data include the logarithm of the fold change in expression due to JA treatment, relevant statistics related to changes in expression, unigene annotations generated by BLASTx search against nonredundant (Nr), Swiss-Prot, Clusters of Orthologous Groups (COG), and Kyoto Encyclopedia of Genes and Genomes (KEGG) protein databases, and Gene Ontology (GO) annotations (Tables 1 and 2). In addition, differentially expressed genes with putative defense functions were identified, compiled, and further annotated by comparison to the sugarbeet genome.
Cover crops can enhance desirable agricultural outcomes such as improved nutrient-use efficiency, soil tilth, reduced pests, and increased yield and yield stability. Documentation of soil property responses to cover crops in semiarid cropping systems, however, is limited. A study was conducted to evaluate soil responses to late-summer seeded cover crops in a no-tillage cropping system under semiarid conditions. The study was conducted over three years on the Area IV Soil Conservation Districts Cooperative Research Farm near Mandan, ND, USA. Cover crops were seeded into dry pea residue in mid- to late August in 19-cm rows. Cover crop metrics included aboveground biomass, while soil metrics included soil water content, soil nitrate-N, near-surface soil properties, and soil coverage by residue. Cover crop biomass was measured immediately before a killing frost. Soil water content was measured before cover crop seeding, immediately after a killing frost, and the following spring using a neutron soil moisture meter. Soil nitrate-N was measured before cover crop seeding and the following spring using 1:10 soil-KCl extracts and the cadmium reduction method. The cover crop growing period ranged from 56 to 70 d. Data may be used to understand soil responses to late-summer seeded cover crops under rainfed conditions in a semiarid continental climate. Applicable USDA soil types include Grassna, Linton, Mandan, Temvik, Williams, and Wilton.
", "title": "Data from: Short-term soil responses to late-seeded cover crops in a semi-arid environment", "distribution": [ { "@type": "dcat:Distribution", "downloadURL": "https://ndownloader.figshare.com/files/46309552", "format": "xlsx", "mediaType": "application/vnd.openxmlformats-officedocument.spreadsheetml.sheet", "title": "LSSCoverCrops_Data Dictionary.xlsx" }, { "@type": "dcat:Distribution", "downloadURL": "https://ndownloader.figshare.com/files/46309555", "format": "xlsx", "mediaType": "application/vnd.openxmlformats-officedocument.spreadsheetml.sheet", "title": "LSSCoverCrops_AbovegroundBiomass.xlsx" }, { "@type": "dcat:Distribution", "downloadURL": "https://ndownloader.figshare.com/files/46309558", "format": "xlsx", "mediaType": "application/vnd.openxmlformats-officedocument.spreadsheetml.sheet", "title": "LSSCoverCrops_ProfileSoilWater.xlsx" }, { "@type": "dcat:Distribution", "downloadURL": "https://ndownloader.figshare.com/files/46309561", "format": "xlsx", "mediaType": "application/vnd.openxmlformats-officedocument.spreadsheetml.sheet", "title": "LSSCoverCrops_ProfileSoilN.xlsx" }, { "@type": "dcat:Distribution", "downloadURL": "https://ndownloader.figshare.com/files/46309564", "format": "xlsx", "mediaType": "application/vnd.openxmlformats-officedocument.spreadsheetml.sheet", "title": "LSSCoverCrops_NearSurfaceSoilProperties.xlsx" }, { "@type": "dcat:Distribution", "downloadURL": "https://ndownloader.figshare.com/files/46309567", "format": "xlsx", "mediaType": "application/vnd.openxmlformats-officedocument.spreadsheetml.sheet", "title": "LSSCoverCrops_ResidueCover.xlsx" }, { "@type": "dcat:Distribution", "downloadURL": "https://ndownloader.figshare.com/files/46309573", "format": "csv", "mediaType": "application/csv", "title": "LSSCoverCrops_AbovegroundBiomass_Data.csv" }, { "@type": "dcat:Distribution", "downloadURL": "https://ndownloader.figshare.com/files/46309576", "format": "csv", "mediaType": "application/csv", "title": "LSSCoverCrops_AbovegroundBiomass_Metadata.csv" }, { "@type": "dcat:Distribution", "downloadURL": "https://ndownloader.figshare.com/files/46309579", "format": "csv", "mediaType": "text/plain", "title": "LSSCoverCrops_NearSurfaceSoilProperties_Data.csv" }, { "@type": "dcat:Distribution", "downloadURL": "https://ndownloader.figshare.com/files/46309582", "format": "csv", "mediaType": "application/csv", "title": "LSSCoverCrops_NearSurfaceSoilProperties_Metadata.csv" }, { "@type": "dcat:Distribution", "downloadURL": "https://ndownloader.figshare.com/files/46309585", "format": "csv", "mediaType": "text/plain", "title": "LSSCoverCrops_ProfileSoilN_Data.csv" }, { "@type": "dcat:Distribution", "downloadURL": "https://ndownloader.figshare.com/files/46309588", "format": "csv", "mediaType": "application/csv", "title": "LSSCoverCrops_ProfileSoilN_Metadata.csv" }, { "@type": "dcat:Distribution", "downloadURL": "https://ndownloader.figshare.com/files/46309591", "format": "csv", "mediaType": "text/plain", "title": "LSSCoverCrops_ProfileSoilWater_Data.csv" }, { "@type": "dcat:Distribution", "downloadURL": "https://ndownloader.figshare.com/files/46309594", "format": "csv", "mediaType": "text/plain", "title": "LSSCoverCrops_ProfileSoilWater_Metadata.csv" }, { "@type": "dcat:Distribution", "downloadURL": "https://ndownloader.figshare.com/files/46309597", "format": "csv", "mediaType": "text/plain", "title": "LSSCoverCrops_ResidueCover_Data.csv" }, { "@type": "dcat:Distribution", "downloadURL": "https://ndownloader.figshare.com/files/46309600", "format": "csv", "mediaType": "application/csv", "title": "LSSCoverCrops_ResidueCover_Metadata.csv" } ], "license": "https://creativecommons.org/publicdomain/zero/1.0/", "bureauCode": [ "005:18" ], "modified": "2024-05-31", "publisher": { "@type": "org:Organization", "name": "Agricultural Research Service" }, "accrualPeriodicity": "irregular", "keyword": [ "Cover Crops", "Soil nitrate N", "Aboveground biomass", "Soil water", "Particulate organic matter carbon", "Microbial biomass carbon", "Dryland cropping systems", "Northern Great Plains" ], "spatial": "{\"type\": \"MultiPoint\", \"coordinates\": [[-100.9352, 46.7801], [-100.9453, 46.7762], [-100.9256, 46.7576]]}" }, { "identifier": "10.2135/cropsci2016.08.0708", "accessLevel": "public", "contactPoint": { "hasEmail": "mailto:bob.graybosch@ars.usda.gov", "fn": "Graybosch, Robert A." }, "programCode": [ "005:040" ], "description": "USDA-ARS coordinated regional wheat (Triticum aestivum L.) breeding trials examine agronomic performance and adaptation over a wider geographic range than single breeding programs can achieve. The trials provide an evaluation of experimental breeding lines in alternate test sites that are environmentally similar or dissimilar to the program of origin. Data from USDA-ARS Hard Winter Wheat Regional Nurseries grown in 1987 to 2014 were used to identify similarities among Great Plains test sites. Mean correlations of entry grain yields across locations and years were used in principal factor analyses to cluster them into production zones. The procedures used were identical to those of a previously published analysis using test data from 1959 to 1989. Five factors explained 67% of the variance in the correlation matrix among Southern Regional Performance Nursery (SRPN) locations. The analysis divided the SRPN into four major Great Plains production zones, designated Southeast, Northwest, Southwest and Northeast. The remaining minor production zone consisted of only two central South Dakota locations, both outside the typical target area and selection site of SRPN entries. In the Northern Regional Performance Nursery (NRPN), five production zones were established, with location separation predominantly resulting from east–west differences in performance. The SRPN and NRPN wheat production zones closely follow previously described ecological zones of adaptation of native Great Plains plant species. Wheat breeding programs and growers may continue to use the production zones established via the USDA-ARS coordinated winter wheat regional nurseries to target and select germplasm for crossing and for production.
Resource Title: Table S1: Mean grain yields (kg ha-1) of entries and harvested locations in production zones identified in the Southern Regional Performance Nursery, 1987-2014..
File Name: \"1447-supplement1.pdf\", url: https://dl.sciencesocieties.org/publications/cs/supplements/57/1447-supplement1.pdf
Cotton root rot is a century-old cotton disease that now can be effectively controlled with Topguard Terra fungicide. Because this disease tends to occur in the same general areas within fields in recurring years, site-specific application of the fungicide only to infested areas can be as effective as and considerably more economical than uniform application. The overall objective of this research was to demonstrate how site-specific fungicide application could be implemented based on historical remote sensing imagery and using variable-rate technology. Procedures were developed for creating binary prescription maps from historical airborne and high-resolution satellite imagery. Two different variable-rate liquid control systems were adapted to two existing cotton planters, respectively, for site-specific fungicide application at planting. One system was used for site-specific application on multiple fields in 2015 and 2016 near Edroy, Texas, and the other system was used on multiple fields in both years near San Angelo, Texas. Airborne multispectral imagery taken during the two growing seasons was used to monitor the performance of the site-specific treatments. Results based on prescription maps derived from historical airborne and satellite imagery of two fields in 2015 and one field in 2016 are reported in this article. Two years of field experiments showed that the prescription maps and the variable-rate systems performed well and that site-specific fungicide treatments effectively controlled cotton root rot. Reduction in fungicide use was 41%, 43%, and 63% for the three fields, respectively. The methodologies and results of this research will provide cotton growers, crop consultants, and agricultural dealers with practical guidelines for implementing site-specific fungicide application using historical imagery and variable-rate technology for effective management of cotton root rot.
\nResources in this dataset:
\nResource Title: A ground picture of cotton root rot\nFile Name: IMG_0124.JPG\nResource Description: A cotton root rot-infested area in a cotton field near Edroy, TX.
\nResource Title: An aerial image of a cotton field\nFile Name: Color-infrared image of a field.jpg\nResource Description: Aerial color-infrared (CIR) image of a cotton field infested with cotton root rot.
\nResource Title: As-applied fungicide application data\nFile Name: Jim Ermis-Farm 1-Field 11 Fungicide Application.csv\nResource Description: As-applied fungicide application rates for variable rate application of Topguard to a cotton field infested with cotton rot
\nData presented are on carbon (C) and nitrogen (N) inputs, and changes in soil C and N in eight systems during the first eight years of a tillage-intensive organic vegetable systems study that was focused on romaine lettuce and broccoli production in Salinas Valley on the central coast region of California. The eight systems differed in organic matter inputs from cover crops and urban yard-waste compost. The cover crops included cereal rye, a legume-rye mixture, and a mustard mixture planted at two seeding rates (standard rate 1x versus high rate 3x). There were three legume-rye 3x systems that differed in compost inputs (0 versus 7.6 Mg ha−1 vegetable crop−1) and cover cropping frequency (every winter versus every fourth winter). The data include: (1) changes in soil total organic C and total N concentrations and stocks and nitrate N (NO3-N) concentrations over 8 years, (2) cumulative above ground and estimated below ground C and N inputs, cover crop and crop N uptake, and harvested crop N export over 8 years, (3) soil permanganate oxidizable carbon (POX-C) concentrations and stocks at time 0, 6 and 8 years, and (4) cumulative, estimated yields of lettuce and broccoli (using total biomass and harvest index values) over the 8 years. The C inputs from the vegetables and cover crops included estimates of below ground inputs based on shoot biomass and literature values for shoot:root. The data in this article support and augment information presented in the PLoS ONE research article “Winter cover crops increase readily decomposable soil carbon, but compost drives total soil carbon during eight years of intensive, organic vegetable production in California”.
Resource Title: Supplementary materials.
File Name: Web Page, url: https://ars.els-cdn.com/content/image/1-s2.0-S2352340920313639-mmc1.zip
Zipped Excel (xlsx) data comprising
\nSupplementary Table 1: Raw data of soil total organic carbon concentrations, total nitrogen concentrations, nitrate nitrogen concentrations, total organic carbon stocks, and total nitrogen stocks over 8 years from the Salinas Organic Cropping Systems experiment in Salinas, California. This includes data from all eight systems in the experiment. The related article in PLoS ONE only included data from five of the eight systems with optimal seeding rates for weed suppression.
\nSupplementary Table 2: Raw data of cumulative cover crop and vegetable carbon inputs, legume nitrogen fixation, cover crop and vegetable crop N uptake and export during 8 years at the Salinas Organic Cropping Systems experiment in Salinas, California. This includes data from all eight systems in the experiment. The related article in PLoS ONE only included data from five of the eight systems with optimal seeding rates for weed suppression.
\nSupplementary Table 3: Raw data of soil permanganate oxidizable carbon (POX-C) concentrations and stocks at the 0 to 6.7 cm depth in years 0 and 6, and the 0 to 30 cm depth in year 8 from the Salinas Organic Cropping Systems experiment in Salinas, California This data from five of the eight systems with optimal seeding rates for weed suppression was included the related paper in PLoS ONE.
\nSupplementary Table 4: Raw data of cumulative, estimated yields of lettuce and broccoli crop during 8 years at the Salinas Organic Cropping Systems experiment in Salinas, California; yields are on an oven-dry basis. This includes data from all eight systems in the experiment.
\nIntermediate wheatgrass [Thinopyrum intermedium (Host) Barkw. & D.R. Dewey subsp. intermedium] is a high-yielding cool-season grass with adaptable uses for grazing, haying, and soil restoration. Despite its adaptability, adoption of intermediate wheatgrass has been limited due to inadequate stand longevity under grazing stress. A study was conducted near Mandan, ND USA to investigate if stand longevity of intermediate wheatgrass was affected by changes in soil properties due to grazing. Soil data from this study included measurements of soil bulk density, soil pH, soil organic carbon, and total soil nitrogen on a Wilton silt loam soil (USDA: Fine-silty, mixed, superactive frigid Pachic Haplustoll). Measurements were made in May 1997 (baseline) and again in May 2004 following four years of grazing. Data may be used to understand soil property responses to grazed perennial forages. Data are generally applicable to rainfed conditions under a semiarid Continental climate for the following associated soil types: Temvik, Grassna, Linton, Mandan, and Williams.
\nResources in this dataset:
\nResource title: Intermediate Wheatgrass Grazing Study Data Dictionary\nFile name: IWGS_Data Dictionary.xlsx\nResource description: Data dictionary for associated dataset.
\nResource title: Intermediate Wheatgrass Grazing Study_Soil Data for Aggregated Depths\nFile name: IWGS_Soil Data_Aggregated Depths.xlsx\nResource description: File includes data for 0-30 cm depth.
\nResource title: Intermediate Wheatgrass Grazing Study_Soil Data for Separated Depths\nFile name: IWGS_Soil Data_Separated Depths.xlsx\nResource description: Soil data for 0-5, 5-10, 10-20, and 20-30 cm depths.
\nResource title: Intermediate Wheatgrass Grazing Study_Soil Data_Aggregated Depths\nFile name: IWGS_Soil Data_Aggregated Depths.csv\nResource description: Data for aggregated depths in csv format.
\nResource title: Intermediate Wheatgrass Grazing Study_Metadata_Aggregated Depths\nFile name: IWGS_Soil Data_Aggregated Depths_Metadata.csv\nResource description: Metadata for aggregated depths.
\nResource title: Intermediate Wheatgrass Grazing Study_Soils Data_Separated Depths\nFile name: IWGS_Soil Data_Separated Depths.csv\nResource description: Soil data for 0-5, 5-10, 10-20, and 20-30 cm depths.
\nResource title: Intermediate Wheatgrass Grazing Study_Metadata_Separated Depths\nFile name: IWGS_Soil Data_Separated Depths_Metadata.csv\nResource description: Metadata for soils data separated by depth increment.
", "title": "Data from: Soil resistance under grazed intermediate wheatgrass", "distribution": [ { "@type": "dcat:Distribution", "downloadURL": "https://ndownloader.figshare.com/files/44541314", "format": "xlsx", "mediaType": "application/vnd.openxmlformats-officedocument.spreadsheetml.sheet", "title": "IWGS_Data Dictionary.xlsx" }, { "@type": "dcat:Distribution", "downloadURL": "https://ndownloader.figshare.com/files/44541317", "format": "xlsx", "mediaType": "application/vnd.openxmlformats-officedocument.spreadsheetml.sheet", "title": "IWGS_Soil Data_Aggregated Depths.xlsx" }, { "@type": "dcat:Distribution", "downloadURL": "https://ndownloader.figshare.com/files/44541320", "format": "xlsx", "mediaType": "application/vnd.openxmlformats-officedocument.spreadsheetml.sheet", "title": "IWGS_Soil Data_Separated Depths.xlsx" }, { "@type": "dcat:Distribution", "downloadURL": "https://ndownloader.figshare.com/files/44541323", "format": "csv", "mediaType": "application/csv", "title": "IWGS_Soil Data_Aggregated Depths.csv" }, { "@type": "dcat:Distribution", "downloadURL": "https://ndownloader.figshare.com/files/44541326", "format": "csv", "mediaType": "text/plain", "title": "IWGS_Soil Data_Aggregated Depths_Metadata.csv" }, { "@type": "dcat:Distribution", "downloadURL": "https://ndownloader.figshare.com/files/44541329", "format": "csv", "mediaType": "application/csv", "title": "IWGS_Soil Data_Separated Depths.csv" }, { "@type": "dcat:Distribution", "downloadURL": "https://ndownloader.figshare.com/files/44541332", "format": "csv", "mediaType": "text/plain", "title": "IWGS_Soil Data_Separated Depths_Metadata.csv" } ], "license": "https://www.usa.gov/publicdomain/label/1.0/", "bureauCode": [ "005:18" ], "modified": "2024-02-15", "publisher": { "@type": "org:Organization", "name": "Agricultural Research Service" }, "accrualPeriodicity": "irregular", "keyword": [ "Perennial forages", "Northern Great Plains", "soil organic carbon", "soil pH", "soil bulk density", "NP215", "data.gov", "ARS" ], "spatial": "{\"type\": \"Point\", \"coordinates\": [-100.90610013015, 46.776374053019]}" }, { "identifier": "10.15482/USDA.ADC/1528680", "accessLevel": "public", "contactPoint": { "hasEmail": "mailto:steven.valles@usda.gov", "fn": "Valles, Steven" }, "programCode": [ "005:040" ], "description": "Data collected to compare the foraging/food consumption and impacts of Solenopsis invicta virus 3 on fire ant colonies, Solenopsis invicta. Ant colonies infected with Solenopsis invicta virus 3 were compared with uninfected (control) colonies. Four data sets include foraging/food consumption, brood changes, queen fecundity, and virus quantity.
\nResources in this dataset:
\nResource Title: Brood ratings of virus infected ant colonies\nFile Name: Raw data brood rating.csv\nResource Description: Change in brood quantity (rating) after treatment with Solenopsis invicta virus 3. Data include the number of days after exposure to virus, the brood ratings for four treatment (virus exposure) replicates and three control replicates, and the means for each group.
\nResource Title: Ant food consumption data\nFile Name: Raw data consumption 1.csv\nResource Description: Food consumption in ant colonies treated with Solenopsis invicta virus 3. Data include the number of days after treatment with SINV-3, the raw data for four treatment replicates and control replicates, means for treatment and control groups, the quantity (grams) of food consumed for each group, and the standard error for each group.
\nResource Title: Solenopsis invicta virus 3 genome quantification\nFile Name: Raw data SINV3 quantity.csv\nResource Description: Quantitative PCR data to detect Solenopsis invicta virus 3. Data include the day after treatment the measurements were taken, the raw data for four treatment replicates and 3 control replicates, means and standard deviation of each treatment group.
\nResource Title: Queen fecundity after treatment with Solenopsis invicta virus 3\nFile Name: Raw data eggs laid.csv\nResource Description: Eggs laid (fecundity) in a 24 hour period by Solenopsis invicta queens after SINV-3 exposure. Data sheet includes colony group (four replicate treatment colonies and three replicate control colonies) and the number of eggs laid by queens from these colonies on 24, 31, and 39 days after virus exposure.
\nResource Title: Brood ratings of virus infected ant colonies.
File Name: Raw data brood rating.csv
Resource Description: Change in brood quantity (rating) after treatment with Solenopsis invicta virus 3. Data include the number of days after exposure to virus, the brood ratings for four treatment (virus exposure) replicates and three control replicates, and the means for each group.
Resource Title: Solenopsis invicta virus 3 genome quantification.
File Name: Raw data SINV3 quantity.csv
Resource Description: Quantitative PCR data to detect Solenopsis invicta virus 3. Data include the day after treatment the measurements were taken, the raw data for four treatment replicates and 3 control replicates, means and standard deviation of each treatment group.
Resource Title: Queen fecundity after treatment with Solenopsis invicta virus 3.
File Name: Raw data eggs laid.csv
Resource Description: Eggs laid (fecundity) in a 24 hour period by Solenopsis invicta queens after SINV-3 exposure. Data sheet includes colony group (four replicate treatment colonies and three replicate control colonies) and the number of eggs laid by queens from these colonies on 24, 31, and 39 days after virus exposure.
Resource Title: Ant food consumption data.
File Name: Raw data consumption 1.csv
Resource Description: Food consumption in ant colonies treated with Solenopsis invicta virus 3. Data include the number of days after treatment with SINV-3, the raw data for four treatment replicates and control replicates, means for treatment and control groups, the quantity (grams) of food consumed for each group, and the standard error for each group.
These datasets were generated for calibrating robot-camera systems. In an extension, we also considered the problem of calibrating robots with more than one camera.
\nThese datasets are provided as a companion to the paper \"Solving the Robot-World Hand-Eye(s) Calibration Problem with Iterative Methods\" by Amy Tabb and Khalil M. Ahmad Yousef.
\nIncluded are eight datasets in zipped files, numbered DS1.zip, DS2.zip, etc.
\nExplanations of the format of the datasets is provided in the README resource in the file \"README_input_format.txt\". Generally, each zipped folder consists of images and a text file of robot positions when those images were acquired.
\nOpen source code can be found at:\nhttps://github.com/amy-tabb/RWHEC-Tabb-AhmadYousef
\nWe also include the results of using our code on one of the datasets so that you can be sure that the code worked correctly. This folder is named DS1_write.zip and can be found in the resource titled \"Output from running methods on Dataset 1\".
\nProblems/Comments/Bugs should be addressed to amy.tabb@ars.usda.gov
Resource Title: README.
File Name: README_input_format.txt.txt
Resource Description: This file gives an in-depth description of the image and robot position datasets.
Resource Title: Dataset 1.
File Name: DS1.zip
Resource Title: Dataset 2.
File Name: DS2.zip
Resource Title: Dataset 3.
File Name: DS3.zip
Resource Title: Dataset 4.
File Name: DS4.zip
Resource Title: Dataset 5.
File Name: DS5.zip
Resource Title: Dataset 6.
File Name: DS6.zip
Resource Title: Dataset 7.
File Name: DS7.zip
Resource Title: Dataset 8.
File Name: DS8.zip
Resource Title: Output from running methods on Datatset 1.
File Name: DS1_write.zip
Switchgrass (Panicum virgatum L.) is a warm-season grass native to the tallgrass prairie in North America with various ecosystem benefits and enhance the resiliency of ecosystems. These resilient qualities of switchgrass may be due to the steroidal saponins produced by the grass. Steroidal saponins are plant secondary metabolites in the group of terpenes. Steroidal saponins are triterpenes that have antibacterial and antifungal characteristics. Switchgrass cultivars “Liberty” and “Independence” are two prominent bioenergy switchgrass cultivars for the Great Plains and Midwest. This dataset shows the relative steroidal saponin concentration in leaf and stem tissues from both Liberty and Independence switchgrass. The steroidal saponins, protodioscin, dichotomin, and saponin B, were detected in all leaf and stem tissues of both Liberty and Independence cultivars.
", "title": "Data from: Steroidal saponin concentrations in switchgrass cultivars Liberty and Independence in North America", "distribution": [ { "@type": "dcat:Distribution", "downloadURL": "https://ndownloader.figshare.com/files/44541269", "format": "xls", "mediaType": "application/vnd.ms-excel", "title": "Switchgrass_Saponins in liberty and independence varieties.xls" } ], "license": "https://www.usa.gov/publicdomain/label/1.0/", "bureauCode": [ "005:18" ], "modified": "2024-02-15", "publisher": { "@type": "org:Organization", "name": "Agricultural Research Service" }, "keyword": [ "saponins", "switchgrass Liberty", "switchgrass Independence", "NP216", "data.gov", "ARS" ], "spatial": "{\"type\": \"Polygon\", \"coordinates\": [[[-96.559867858887, 41.14842974148], [-96.559867858887, 41.166110437886], [-96.516334527405, 41.166110437886], [-96.516334527405, 41.14842974148], [-96.559867858887, 41.14842974148]]]}" }, { "identifier": "10.15482/USDA.ADC/25387891.v1", "accessLevel": "public", "contactPoint": { "hasEmail": "mailto:brian.smart@ndsu.edu", "fn": "Smart, Brian, C." }, "programCode": [ "005:040" ], "description": "Abstract
\nThe expansive range of Lewis flax (Linum lewisii Pursh.), an herbaceous perennial, exposes the species to a diversity of climatic conditions. As interest in the domestication and adoption of perennial crop alternatives grows and interest in this species for natural area restoration continues, the assurance of a commercial plant variety’s ability to endure the full range of possible climatic extremes is paramount. This study examines the freezing tolerance of a geographically representative sampling of 44 Lewis flax accessions at winter temperature extremes experienced in the northern Great Plains of the United States. Survival analysis models were adapted to include temperature exposure, in replacement of ordinal time typically used in such models, to produce statistics evaluating reactions to extreme temperatures that Lewis flax would encounter in our field environments. Our results revealed Lewis flax is more freezing tolerant than previously reported, and revealed four accessions with significantly superior genetic freezing tolerance than the released ‘Maple Grove’ cultivar. Furthermore, regrowth analyses indicate variation among accessions not associated with survival, which could lead to improving regrowth rate and survival simultaneously. These findings and their methodology expand the understanding of Lewis flax adaptation for winter hardiness and offer an efficient, new model that can be used to evaluate freezing tolerance at ordinal temperatures without requiring extensive prior physiological knowledge for a species.
\nContent
\nFrost tolerance of 44 Linum lewisii accessions collected from western North America.
", "title": "Data from: Survival analysis of freezing stress in the North American native perennial flax, Linum lewisii Pursh.", "distribution": [ { "@type": "dcat:Distribution", "downloadURL": "https://ndownloader.figshare.com/files/44982850", "format": "xlsx", "mediaType": "application/vnd.openxmlformats-officedocument.spreadsheetml.sheet", "title": "data Gossweiler et al 2024.xlsx" }, { "@type": "dcat:Distribution", "downloadURL": "https://ndownloader.figshare.com/files/45266032", "format": "csv", "mediaType": "application/csv", "title": "Freeze_Seed_Geo_Collection.csv" }, { "@type": "dcat:Distribution", "downloadURL": "https://ndownloader.figshare.com/files/45266035", "format": "csv", "mediaType": "text/plain", "title": "flaxPostFrostHeightTrendNoLessThanSigns.csv" }, { "@type": "dcat:Distribution", "downloadURL": "https://ndownloader.figshare.com/files/45266038", "format": "csv", "mediaType": "application/csv", "title": "flaxFrostSurvivorFunctionEstimateHazardTime3 (1).csv" }, { "@type": "dcat:Distribution", "downloadURL": "https://ndownloader.figshare.com/files/45266041", "format": "csv", "mediaType": "text/plain", "title": "flaxAcclimatizationGrowthFreeze.csv" }, { "@type": "dcat:Distribution", "downloadURL": "https://ndownloader.figshare.com/files/45266044", "format": "csv", "mediaType": "application/csv", "title": "BioClim_codes.csv" }, { "@type": "dcat:Distribution", "downloadURL": "https://ndownloader.figshare.com/files/45266047", "format": "xlsx", "mediaType": "application/vnd.openxmlformats-officedocument.spreadsheetml.sheet", "title": "Supplemental Tables freeze tolerance.xlsx" }, { "@type": "dcat:Distribution", "downloadURL": "https://ndownloader.figshare.com/files/45266050", "format": "csv", "mediaType": "text/plain", "title": "RDA_Accession.csv" }, { "@type": "dcat:Distribution", "downloadURL": "https://ndownloader.figshare.com/files/45266053", "format": "csv", "mediaType": "application/csv", "title": "NDAWN_Fargo_10_25_1990-2021_BareTurfSoilTemp.csv" }, { "@type": "dcat:Distribution", "downloadURL": "https://ndownloader.figshare.com/files/45266056", "format": "csv", "mediaType": "text/plain", "title": "GrowthChamberTemperatures.csv" } ], "license": "https://creativecommons.org/publicdomain/zero/1.0/", "bureauCode": [ "005:18" ], "modified": "2024-04-23", "publisher": { "@type": "org:Organization", "name": "Agricultural Research Service" }, "accrualPeriodicity": "irregular", "keyword": [ "Linum lewisii", "Frost hardiness", "perennial grains" ] }, { "identifier": "10.15482/USDA.ADC/25564443.v1", "accessLevel": "public", "contactPoint": { "hasEmail": "mailto:elizabeth.mcmillan@usda.gov", "fn": "McMillan, Elizabeth, A." }, "programCode": [ "005:040" ], "description": "This repository contains all data and code required to reproduce the cumulative logistic mixed-effects model for the manuscript:
\"Susceptibility of pESI positive Salmonella to treatment with biocide chemicals approved for use in poultry processing as compared to Salmonella without the pESI plasmid\": citation to be added upon publication.
Abstract: Salmonella is a common cause of human foodborne illness which is frequently associated with consumption of contaminated or undercooked poultry meat. Serotype Infantis is among the most common serotypes isolated from poultry products. Isolates of serotype Infantis carrying the pESI plasmid have been shown to exhibit oxidizer tolerance. Therefore, sixteen strains of Salmonella with and without pESI carriage were investigated for susceptibility to biocide chemical processing aids approved for use in U.S. poultry processing. All strains tested were susceptible to all concentrations of peracetic acid, cetylpiridinium chloride, and sodium hypochlorite when applied for 90 minutes. When cetylpiridinium chloride, calcium hypochlorite, and sodium hypochlorite were applied for 15 seconds to simulate spray time, strains responded similarly to each other. However, strains responded variably to exposure to PAA. The variation was not statistically significant and appears unrelated to pESI carriage. Results highlight the necessity of testing biocide susceptibility in the presence of organic material and in relevant in situ applications.
Finite nutrients, such as P and K are assumedly remobilized post-senescence in herbaceous feedstocks like switchgrass (Panicum virgatum L.) as a function of environmental signaling and genotype. Harvesting early during the maturation phase may result in yield reductions and higher nutrient removal in biomass depending on ecotype. Therefore, it is necessary to target harvest dates that optimize yield while minimizing nutrient removal per cultivar. Consequently, objectives were to compare yields from 2010–2011 on eight widely used and experimental upland and lowland genotype (whole plot) at two locations in Tennessee, to determine: (i) which harvest timing (split-plot) provides maximum yield; (ii) effects of harvest timing (mid-September, October, November, and late October) on overall total P and K removal; and, (iii) how results are affected by cultivar. Among all post-senescence harvests, yields peaked early November (13.2 Mg ha–1), which was greater than all other harvests (P < 0.05), with mid-October and late October not differing from one another. Because yields peaked in early November, P and K removal did not vary across harvest dates (despite both P and K concentrations declining mid-October). Lowland cultivars yielded 3.9 Mg ha–1 more biomass annually than upland entries, suggesting lowland cultivars are better suited to environments in the Southeast. Due to lower yields, P and K removals were lower for upland (Blackwell and C62), compared with lowland cultivars. Consequently, switchgrass can be harvested as early as mid-September without removing greater amounts of P and K, although variations within upland and lowland cultivars will likely occur.
Resource Title: Switchgrass variety nutrient removal.
File Name: variety removal.csv
Resource Description: Switchgrass variety P and K tissue (leaves and stems) removal for fall harvest periods (mid-September, October, November, and late October), at East Tennessee and Highland Rim Research and Education Centers from 2010–2011.
Resource Title: Data Dictionary.
File Name: switchgrass-variety-nutrient-removal-data-dictionary.csv
Resource Description: Defines variables, units, and data types for the tabular data.
Some U.S bioethanol plants use a blend of maize and sorghum grains as feedstocks depending on availability and price. Knowledge of the grain composition of milled feedstock is beneficial for maximizing process efficiency and for potential future regulatory requirements. To analyze feedstock composition, we developed a duplex real-time PCR assay based on TaqMan™ probes for the simultaneous analysis of flour blends. For sorghum, the method amplified a sequence within the F-Box domain-containing protein and for maize, the method amplified a sequence of the high mobility group a (HMGa) proteins. To acquire fluorescent signals simultaneously, FAM and TAMRA fluorescent probes were used to label the sorghum- and maize- specific probes, respectively. Results showed that the primers and probes were highly specific either for maize or sorghum. The real-time duplex PCR assay was validated on simulated flour binary mixtures and high in the precision and accuracy for the sorghum PCR system. Results with the established method showed specificity and sensitivity in quantifying sorghum composition in bioethanol feedstock mixtures.
\nResources in this dataset:
\nResource title: Primer sets used\nFile name: Table 1 1.jpg
\nResource title: Experimental setup\nFile name: experiemntal set ups Real time PCR project Sorgh-Maize.xlsx
\nResource title: Multiplex data HMGa and FBox\nFile name: 2022-01-24 multiplex FBox - HMGa 60 C 200nM.xls\nResource description: Data and analysis of sorhum maize and miusxtures using HMGa and FBox genes
\nResource title: multiplex FBox HMGa flour mixes 60 C\nFile name: 2022-02-22 multiplex FBox HMGa flour mixes 60 C 11 points.xls\nResource description: PCR multiplex data FBox HMGa flour mixes 60 C
\nResource title: Standard curves for zein DNA HMGa gene\nFile name: 2022-01-11 Hmga - Zein X07535 standard curves.xls\nResource description: Standard curves for zein DNA HMGa gene detection
\nData files for manuscript titled \"Temperature influences lipid content in the red harvester ant, Pogonomyrmex barbatus\".
\nExcel file with 3 tabs: Metadata, Monthly Lipid Content, and 10 Day Lipid Content. Metadata is contained within Excel file that describes all variables for each tab.
\nAbstract from paper:\nTemperature is one of the most important environmental conditions affecting physiological processes in ectothermic organisms like ants. Yet we often lack information on how certain physiological traits co-vary with temperature across time. Here, we test predictions on how one trait—lipid content—co-varies with temperature using a conspicuous, ground-dwelling harvester ant. We focus on lipid content as fat bodies are metabolically active tissues that are important for storing and releasing energy in response to demand, which could be vital for survival under variable temperatures. From March to November, we extracted lipids from surface workers of 14 colonies while simultaneously recording ground temperature. We first assessed if lipid content was highest during cooler temperatures when ants were less active and less metabolically stressed. In doing so, we found that lipid content of ants declined almost 70% from cool months (November lipid content = 14.6%) to hot months (August lipid content = 4.6%). We next assessed if lipid levels from a group of ants collected at a single time point could change by placing individuals into environmental chambers set at 10, 20, and 30°C (i.e. the approximate span of average temperatures from March to November). Temperature again had a significant impact such that after 10 days, lipid content of ants in the hottest chamber (30°C) had decreased more than 75%. While intraspecific variation in physiological traits often follows seasonal patterns, our results suggest fluctuations in temperature may account for a portion of the variance observed in traits like lipid content.
", "title": "Data from: Temperature influences lipid content in the red harvester ant, Pogonomyrmex barbatus", "distribution": [ { "@type": "dcat:Distribution", "downloadURL": "https://ndownloader.figshare.com/files/44540678", "format": "xlsx", "mediaType": "application/vnd.openxmlformats-officedocument.spreadsheetml.sheet", "title": "Pogo Lipid Content MASTER_1.xlsx" } ], "license": "https://www.usa.gov/publicdomain/label/1.0/", "bureauCode": [ "005:18" ], "modified": "2024-02-16", "publisher": { "@type": "org:Organization", "name": "Agricultural Research Service" }, "keyword": [ "body size", "fat content", "Formicidae", "physiology", "Temperature", "NP304", "data.gov", "ARS" ], "spatial": "{\"type\": \"Point\", \"coordinates\": [-98.2311, 34.5478]}" }, { "identifier": "10.15482/USDA.ADC/1520517", "accessLevel": "public", "contactPoint": { "hasEmail": "mailto:manan.sharma@usda.gov", "fn": "Sharma, Manan" }, "programCode": [ "005:040" ], "description": "Escherichia coli survival in soils containing either composted poultry litter (CPL), heat-treated poultry pellets (HTPP), poultry litter (PL) or unamended (chemical fertilizer). Test plots were either covered with plastic mulch (M) or not mulched (NoM). The study was conducted in 2018 and 2019 during cucumber growing seasons at the University of Delaware research farm and each study lasted 120 days. Data from the current study were collected to examine the survival of non-pathogenic Escherichia coli and transfer to cucumbers grown in same field in two separate years. Soil moisture, total nitrogen, nitrate, total carbon, soluble carbon, soluble solids, rainfall, soil temperature and air temperature, along with the number of days needed for E. coli to decline by 4 log CFU/gdw, were included in random forest models used to a) predict 4-log declines of E. coli inoculated to soils and b) transfer of E. coli to cucumbers from soils with different biological soil amendments.\nThe data included here are specifically for other investigators to use to make different forms or versions of three different statistical models used in the submitted manuscript. Data for three models are included:\n1) Dpi4log, the number of days needed for E. coli levels in various combinations of year, amendment and mulch, were calculated by applying sigmoidal (single, double, triple, or quadruple) model to E. coli data collected over time.\n2) A random forest model using soil and weather data was used to determine which factors listed above best predicted dpi4log values. This model accounted for 98% of the observed variance.\n3) A random forest model using soil and weather data, along with dpi4log, was used to predict transfer of E. coli to soils from cucumbers (log MPN/cucumber). This model accounted for approximately 63% of the variance in the study.
\nResource Title: Graph of E. coli levels over 120 days in soils under various conditions.
File Name: Graphs of Fitted Sigmoidal Regression Models onto Observed gEclog vs DPI.pdf
Resource Description: Graph of *E. coli* levels in 24 different combinations of year, amendment, and mulch status over 120 days
Resource Title: Comparison of actual model-generated log CFU/gdw data .
File Name: Observed and Sigmoidal Model Predicted gEcLog values - Daily Increment.csv
Resource Description: Comparison of sigmoidal model-generated log CFU/gdw vs observed data
Resource Title: Soil temperature, Air temperature and Cumulative Rainfall observed in 2018 and 2019.
File Name: Soil air temp cumulative rainfall 2018 2019.xlsx
Resource Description: These are the climate data used to inform and predict E. coli survival in soils containing biological and chemical fertilizer
Resource Title: Data set used in Random Forest model to predict transfer of E. coli from soils to cucumber fruits .
File Name: UD ARS Cucumber Study Consolidated Data Version 2 Single Transference Column Original Data Scale.csv
Resource Description: This data set includes the sigmoidal model-estimated values of dpi4log (the number of days needed to achieve 4 log decline in E. coli levels) in this model
Resource Title: Dataset used in Random Forest model to identify variables and factors which predict dpi4log values of E. coli in soils containing biological soil amendment of animal origin.
File Name: Formatted Soil Data for Random Forest Analysis.xlsx
Resource Description: Dataset used in the Random Forest model to identify variables and factors which predict dpi4log values - the number of days needed to observe a 4 log reduction, estimated by sigmoidal modeling of collected E. coli data - of E. coli in soils containing biological soil amendment of animal origin
Data include microbial count data (CFUs), 16S-rRNA copy number data (qPCR), and microbial community (microbiome) data from the guts of the invasive tephritid fruit flies, melon fly (Zeugodacus cucurbitae) and medfly (Ceratitis capitata).
\nResources in this dataset:
\nResource Title: R code for dada2 processing and stacked bar charts of control microbiomes\nFile Name: Control_Processing.zip\nResource Description: Data showing performance of known controls (purchased from Zymo Research) using in-house DNA extraction and PCR methods for 16S-rRNA gene amplification and sequencing.
\nResource Title: Data processing of 16S amplicon data\nFile Name: 16S SSU rRNA Microbiome Data Processing and Analysis.zip\nResource Description: Raw data and accompanying R scripts for analysis of figure and generation of figures and tables. Data files include both amplicon sequence variant (ASV) count data matrix and accompanying ASV sequence files and taxonomies. Analysis and figure generation are made through independent R files.
\nResource Title: Data and analysis of fly culturable titers\nFile Name: CFU titers.zip\nResource Description: Colony forming units (CFUs) of fruit flies at different ages and the R code for figure generation and analysis.
\nResource Title: qPCR of 16S rRNA of Tephritid fruit flies at different ages\nFile Name: 16S qPCR Titers.zip\nResource Description: Raw data and R code of 16S rRNA copy numbers associated with medfly and melon fly gut tissues.
\nDNA sequences of each allele for 165 loci found in a population of 147 fully sequenced IncI2 plasmids with allelic identifiers.
Data is based on whole-genome sequences in the National Center for Biotechnology Information database as of July, 2017.
Resources in this dataset:
The longhorned tick, Haemaphysalis longicornis, feeds upon a wide range of bird and mammalian hosts. Mammalian hosts include cattle, deer, sheep, goats, humans, and horses. This tick is known to transmit a number of pathogens causing tick-borne diseases, and was the vector of a recent serious outbreak of oriental theileriosis in New Zealand. A New Zealand-USA consortium was established to sequence, assemble, and annotate the genome of this tick, using ticks obtained from New Zealand's North Island. In New Zealand, the tick is considered exclusively parthenogenetic and this trait was deemed useful for genome assembly. Very high molecular weight genomic DNA was sequenced on the Illumina HiSeq4000 and the long-read Pac Bio Sequel platforms. Twenty-eight SMRT cells produced a total of 21.3 million reads which were assembled with Canu on a reserved supercomputer node with access to 12 TB of RAM, running continuously for over 24 days. The final assembly dataset consisted of 34,211 contigs with an average contig length of 215,205 bp. The quality of the annotated genome was assessed by BUSCO analysis, an approach that provides quantitative measures for the quality of an assembled genome. Over 95% of the BUSCO gene set was found in the assembled genome. Only 48 of the 1066 BUSCO genes were missing and only 9 were present in a fragmented condition. The raw sequencing reads and the assembled contigs/scaffolds are archived at the National Center for Biotechnology Information.
\nFunded by USDA-ARS Knipling-Bushland US Livestock Insects Research Laboratory CRIS project 3094-32000-036-00
Resource Title: The Pacific Biosciences de novo assembled genome dataset from a parthenogenetic New Zealand wild population of the longhorned tick, Haemaphysalis longicornis Neumann, 1901.
File Name: Web Page, url: https://doi.org/10.1016/j.dib.2019.104602
NCBI data referenced in the article can be found in the related content links of this record\n
The horn fly, Haematobia irritans irritans (Linnaeus, 1758; Diptera: Muscidae), a hematophagous external parasite of cattle, causes considerable economic losses to the livestock industry worldwide. This pest is mainly controlled with insecticides; however, horn fly populations from several countries have developed resistance to many of the products available for their control. In an attempt to better understand the adult horn fly and the development of resistance in natural populations, we used an Illumina paired-end read HiSeq and GAII approach to determine the transcriptomes of untreated control adult females, untreated control adult males, permethrin-treated surviving adult males and permethrin + piperonyl butoxide-treated killed adult males from a Louisiana population of horn flies with a moderate level of pyrethroid resistance. A total of 128,769,829, 127,276,458, 67,653,920, and 64,270,124 quality-filtered Illumina reads were obtained for untreated control adult females, untreated control adult males, permethrin-treated surviving adult males and permethrin + piperonyl butoxide-treated killed adult males, respectively. The de novo assemblies using CLC Genomics Workbench 8.0.1 yielded 15,699, 11,961, 2672, 7278 contigs (≥ 200 nt) for untreated control adult females, untreated control adult males, permethrin-treated surviving adult males and permethrin + piperonyl butoxide-treated killed adult males, respectively. More than 56% of the assembled contigs of each data set had significant hits in the BlastX (UniProtKB/Swiss-Prot database) (E <0.001). The number of contigs in each data set with InterProScan, GO mapping, Enzyme codes and KEGG pathway annotations were: Untreated Control Adult Females – 10,331, 8770, 2963, 2183; Untreated control adult males – 8392, 7056, 2449, 1765; Permethrin-treated surviving adult males – 1992, 1609, 641, 495; Permethrin + PBO-treated killed adult males – 5561, 4463, 1628, 1211.
\nData is with this article and also available at the National Center for Biotechnology Information (NCBI) Short Read Archive (SRA) through the direct link https://www.ncbi.nlm.nih.gov/sra/SRP131897 or through SRA accession number SRP131897. The adult horn fly transcriptome Shotgun Assembly project has been deposited at DDBJ/EMBL/GenBank under the accession GGLM00000000. The version described in this paper is the first version, GGLM01000000. The overall BioProject ID is PRJNA429442 and the BioSample accessions are SAMN08355023, SAMN08355024, SAMN08355025, and SAMN08355026.
Resource Title: Raw reads.
File Name: Web Page, url: https://www.ncbi.nlm.nih.gov/sra/SRP131897
RNA was isolated from unfed, newly emerged adult horn flies, including untreated control adult females, untreated control adult males, permethrin-treated surviving adult males and permethrin + piperonyl butoxide-treated killed adult males. Subsequently, a single lane of 2 × 54 bp paired end RNASeq reads were obtained, de novo assembled and annotated. The raw reads are accessible at NCBI׳s SRA through the direct link https://www.ncbi.nlm.nih.gov/sra/SRP131897 or through SRA accession number SRP131897. The adult horn fly transcriptome Shotgun Assembly project has been deposited at DDBJ/EMBL/GenBank under the accession GGLM00000000. The version described in this paper is the first version, GGLM01000000. The overall BioProject ID is PRJNA429442 and the BioSample accessions are SAMN08355023, SAMN08355024, SAMN08355025, and SAMN08355026.
Insect Strains and Rearing: Two field-derived strains of T. castaneum from either Eastern Kansas, collected in 2012, or Riley County, KS, collected in 2019, were used to assess the effect of strain on the behavioral response to necromones. Except where noted, the 2012 field strain was used for each experiment. T. castaneum was reared on a mixture of 95% unbleached flour and 5% brewer’s yeast in an environmental chamber at 27.5ºC, 60% RH, and 14:10 L:D. Subculturing proceeded by adding 75 mixed-sex T. castaneum to a 947-ml mason jar filled two-thirds with mixed diet. Adults were removed after 72 h of oviposition. Mixed sex adults aged 4–8 weeks old were used in all assays. All experiments were performed between the years 2017–2020.
\nTreatments:
\nTime of Death of Prior Captures on Behavioral Response: For investigating the attraction to kairomone oil based on how long beetles were left in the oil, the following treatments were included: negative control (neg ctrl), 950μL of Trécé Storgard® Kairomone Oil (kairomone oil for the remainder of the manuscript; Adair, OK, USA) only, or 950 μL of kairomone oil plus 25 freshly killed, mixed sex T. castaneum adults aged in the oil for 1, 25, 48, 72, or 96 h. A second round of the beetles aged longer than 8 days was included with the following treatments: negative control (neg ctrl), 950μL of kairomone oil only, or 950 μL of kairomone oil plus 25 freshly killed, mixed sex T. castaneum adults aged in the oil for 8, 9, 10, or 11 d (Table 1). These experiments were performed in a combination of the wind tunnel, release-recapture assay, and two-choice olfactometer (Table 1). Treatments were added to 20 mL GC headspace vials (Gerstel, GmBH, Germany) for wind tunnel assays, while they were added to Trécé Storgard™ Dome® traps in the release-recapture assays.
\nInfluence of Density of Prior Captures on Behavioral Response: In order to evaluate whether the behavioral response of T. castaneum modulates with different densities of conspecifics in traps, the following treatments for the density response study were used: the same negative control, 950 μl of kairomone oil only, or 950 μl of kairomone oil plus either 4, 10, 20, or 40 mixed sex T. castaneum adults that were allowed to incubate for 24 h or 96 h. These experiments were performed in a combination of the wind tunnel, release-recapture assay, and headspace collection/GC-MS (Table 1). Treatments were added to 20 mL GC headspace vials (Gerstel, GmBH, Germany) for wind tunnel assays, while they were added to Trécé Storgard™ Dome® traps in the release-recapture assays.
\nEffect of Strain on Behavioral Response to Prior Captures: To rule out losing the attraction behaviors from laboratory-rearing protocols, a more recent T. castaneum strain was used and tested against the strain from Eastern Kansas collected in 2012. Thus, both a 2012 and 2019 field-collected (from Riley Co., Kansas) population of T. castaneum were tested in these experiments. The treatments for the strain effect consisted of a negative control, kairomone oil only, and 950 μl of kairomone oil plus either 4, 10, 20, or 40 mixed sex T. castaneum adults, which were allowed to incubate for 24 h. Both strains were tested in the wind tunnel and a release-recapture assay (Table 1).
\nEffect of Rancidity on Behavioral Response to Prior Captures: We conducted an experiment to test if long-term storage of the kairomone oil may have caused it to become rancid, despite being stored at 4ºC as per the manufacturer’s instructions. Treatments included: 950 μl of the kairomone oil we have used for most of our other experiments (e.g., standard Storgard® kairomone oil, or SSO) only, Storgard® kairomone oil borrowed from a colleague at the Center for Grain and Animal Health Research (CGAHR) (e.g., BSO), corn oil purchased freshly from the market (e.g., CO), or one of each of these treatments + 25 dead T. castaneum (Table 1). Attraction behavior was assessed in the wind tunnel.
\nAssay Methods:
\nWind Tunnel Assay: Wind tunnel assays were used to evaluate upwind attraction by T. castaneum to putative necromones (e.g., see Van Winkle et al. 2022 for a description). Briefly, air was generated with a fan (diameter: 36.5 cm) connected to an inlet to the wind tunnel, where the air passed through an activated carbon filter to eliminate impurities from the air, and two successively smaller slatted-metal sieves (73 × 85 cm) to create a laminar airflow, with an average airspeed of 0.38 m/s. A purified, constant, laminar flow of air was pushed over the treatments 13.5 cm upwind of a release arena (21.6 × 27.9 cm). The odor treatments (Table 1) were positioned level with the surface of the release arena in the wind tunnel and were housed in 20 mL glass headspace vials. Caps were removed from the vials when testing commenced.
\nThe adults were placed individually in the center of the release arena and were given 2 min to make a decision, including either leaving on the stimulus edge (upwind) or a non-stimulus edge (three other edges). Adults that did not respond within the timeframe were excluded from statistical analysis. Adults were never tested more than once. All treatments were represented equally in a bout of sampling. The trials were performed inside a walk-in environmental chamber at constant conditions (27.5ºC, 60% RH), with air on purge to vent build-up of odors. Behavior was evaluated using a behavioral response index (BRI) as follows: [(T-C)/N]*100, where T is the number of adults in the treatment leaving on the stimulus edge of the arena, C is the equivalent number for the control, and N is the total sample size for both groups. The BRI can vary from 100 (full attraction) to -100 (full repellency). A total of n = 60 replicate individuals were tested, depending on assay, experiment, and treatment.
\nRelease-Recapture Assay: Prior to release, 100 mixed-sex T. castaneum were settled on an 8 × 8 cm slat of cardboard for 24 h. The cardboard containing the adults was then placed in the center of a walk-in environmental chamber (5 × 6 × 2 m) set at a constant 25°C, 65% RH, and 14:10 L:D. Paper was fully laid and carefully taped on the bottom of the chamber floor to allow for easy mobility by T. castaneum. A standard Trécé Dome Trap™ that held one of each treatment (Table 1) was positioned equidistantly along the chamber’s perimeter and randomized between replicates. After 24 h, trap capture totals were calculated equal to the additional number of T. castaneum found in the trap minus those seeded in the original treatment. Experimental treatments were run simultaneously. A total of n = 8 replicates per treatment and experiment combination were used.
\nTwo-Way Olfactometer Trapping: To assess preference among stimuli, T. castaneum individuals were evaluated in a two-way olfactometer. The olfactometer arena consisted of a Petri dish (9 × 1.5 cm diameter:height) with two holes drilled through opposite sides of the base at equal distances from the edge and the center of the dish. A filter paper (85 mm diameter), bisected by a faint line, was placed on the surface of the olfactometer so that the holes were on opposite sides of the filter paper (as in Morrison et al. 2020). The putative necromones (Table 1) were placed in separate, smaller Petri dishes (3.5 cm diameter) below the release arena and centered under each hole. The position of the lure and necromones was randomized between each trial. A single adult was placed in the center of the arena and left for 24 h in an environmental chamber at constant conditions (30C, 65% R.H., 14:10 L:D). A total of n = 10 replicates per comparison were performed. The percent of adults choosing each stimulus and becoming trapped in the bottom petri dish was recorded.
\nHeadspace Collection: Volatiles were collected from traps seeded with 0 (oil only), 4, 20, or 40 dead T. castaneum and aged 24 h or 96 h. Central airflow was first scrubbed with a charcoal filter, then restricted to 1 L/min with flow meters. Airflow was guided through PTFE tubing to 500 mL-capacity headspace glass containers with lids and an inlet for air. The containers also had an outlet with a Porapaq-Q trap that collected volatiles for 3 h. Volatiles were then eluted with 150 µL of dichloromethane. An internal standard of 1 µL of tetradecane was also added prior to being run on the GC-MS according to standard methodology. There were n = 8 replicates per treatment.
\nGas Chromatography Coupled with Mass Spectrometry: All headspace collection sample extracts were run on an Agilent 7890B gas chromatograph (GC) equipped with an Agilent Durabond HP-5 column (30 m length, 0.250 mm diameter, and 0.25 μm film thickness) with He as the carrier gas at a constant 1.2 mL/min flow and 40 cm/s velocity. This was coupled with a single-quadrupole Agilent 5997B mass spectrometer (MS). The compounds were separated by auto-injecting 1 μl of each sample under splitless mode into the GC-MS at room temperature (approximately 23°C). The GC program consisted of 40°C for 1 min followed by 10°C/min increases to 300°C and then held for 26.5 min. After a solvent delay of 3 min, mass ranges between 50 and 550 atomic mass units were scanned. Compounds were tentatively identified by comparison of spectral data with those from the NIST 17 library and by GC retention index. Using the ratio of the peak area for the internal standard to the peak area for the other compounds in the headspace, the emission rates of samples were normalized in ng of volatile per 950 μl aliquot of oil, per μl of solvent, and per h of collection.
", "title": "Data from: The behavioral response to the putative necromones from dead Tribolium castaneum (Herbst) (Coleoptera: Tenebrionidae) in traps by conspecifics as a function of density and time since capture", "distribution": [ { "@type": "dcat:Distribution", "downloadURL": "https://ndownloader.figshare.com/files/44540636", "format": "csv", "mediaType": "text/plain", "title": "2012_rfb_strain_rr_necromone_density_rfb_24-96h_ag_data_commons.csv" }, { "@type": "dcat:Distribution", "downloadURL": "https://ndownloader.figshare.com/files/44540642", "format": "csv", "mediaType": "text/plain", "title": "2019_rfb_strain_rr_necromone_density_24h-96h_ag_data_commons.csv" }, { "@type": "dcat:Distribution", "downloadURL": "https://ndownloader.figshare.com/files/44540645", "format": "csv", "mediaType": "text/plain", "title": "2012_rfb_strain_wt_density_24-96h.csv" }, { "@type": "dcat:Distribution", "downloadURL": "https://ndownloader.figshare.com/files/44540648", "format": "csv", "mediaType": "text/plain", "title": "2012_rfb_strain_wt_time_24-96h.csv" }, { "@type": "dcat:Distribution", "downloadURL": "https://ndownloader.figshare.com/files/44540651", "format": "csv", "mediaType": "text/plain", "title": "2012_rfb_strain_wt_time_8-11d.csv" }, { "@type": "dcat:Distribution", "downloadURL": "https://ndownloader.figshare.com/files/44540654", "format": "csv", "mediaType": "application/csv", "title": "2019_rfb_strain_wt_density_24h.csv" }, { "@type": "dcat:Distribution", "downloadURL": "https://ndownloader.figshare.com/files/44540657", "format": "csv", "mediaType": "application/csv", "title": "two_way_olfactometer_exp_necromones.csv" }, { "@type": "dcat:Distribution", "downloadURL": "https://ndownloader.figshare.com/files/44540663", "format": "txt", "mediaType": "text/plain", "title": "file_list_necromones_Tribolium_castaneum.txt" } ], "license": "https://www.usa.gov/publicdomain/label/1.0/", "bureauCode": [ "005:18" ], "modified": "2024-02-16", "publisher": { "@type": "org:Organization", "name": "Agricultural Research Service" }, "keyword": [ "cgahr", "red flour beetle", "Tribolium castaneum", "stored products", "postharvest", "necromones", "kairomones", "trapping", "monitoring", "dome trap", "prior captures", "behavior", "chemical ecology", "semiochemicals", "attraction", "taxis", "release-recapture", "plume", "wind tunnel", "Kansas", "USDA", "choice test", "NP304", "data.gov", "ARS" ], "spatial": "{\"type\": \"Point\", \"coordinates\": [-96.599151492119, 39.19601601228]}" }, { "identifier": "10.1016/j.dib.2018.05.027", "accessLevel": "public", "contactPoint": { "hasEmail": "mailto:hmiyoshi@med.hokudai.ac.jp", "fn": "Miyoshi, Hideaki" }, "programCode": [ "005:040" ], "description": "The data presented are related to the research article entitled \"Overexpression of Perilipin1 protects against atheroma progression in apolipoprotein E knockout mice\". This Data in Brief paper describes data that were obtained from perilipin 1 (PLIN1) transgenic mice (Plin1Tg) regarding atherosclerosis. The main aim of collecting the data was to clarify the role of PLIN1 in the pathophysiology of atherosclerosis. The data were collected from C57BL/6J mice, apolipoprotein E knockout mice (ApoeKO) and Plin1Tg/ApoeKO. The atherosclerotic lesion areas of aorta were 3.3 ± 1.2% in C57BL/6J mice, 14.2 ± 3.2% in ApoeKO, and 5.6 ± 1.9% in Plin1Tg/ApoeKO. Body weight, gonadal adipose mass and plasma triglyceride concentrations were comparable among the three groups [1]. Furthermore, PLIN1 overexpression did not affect the gene expressions related to cholesterol influx and efflux in macrophage.
\nOverexpression of PLIN1 in macrophages protected against atheroma progression. No major risk factors were altered in PLIN1 transgenic mice fed normal diet. Overexpression of PLIN1 did not affect the gene expressions related to cholesterol influx and efflux in macrophage.
Resource Title: The data of change in macrophage gene expression which [is] induced by perilipin 1 overexpression.
File Name: Web Page, url: https://www.sciencedirect.com/science/article/pii/S2352340918305304
Thioglycollate-elicited peritoneal macrophages were isolated from C57BL/6J mice or perilipin 1 (PLIN1) transgenic mice (Plin1Tg). Total RNA was prepared and analyzed by reverse transcription polymerase chain reaction (RT-PCR). Expression of the PLIN1 transgene and endogenous PLIN1 and PLIN2 genes in the Plin1Tg macrophages was confirmed.
Insecticide: Two insecticides were used in this study: an existing formulation (tradename: Diacon IGR+ R ; Central Life Sciences, Schaumberg, IL, USA), and a new formulation with synergist (tradename: Gravista ). Diacon IGR+ contains 11.4% methoprene and 4.75% deltamethrin, with a label rate of 0.12 kg AI/L and 0.05 kg AI/L. The label rate as a residual surface treatment gives a range of 28.5 mL AI/L−171 mL AI/L H2O to cover 94 m2 for both compounds. We used the maximum labeled rate of 24 mg AI/m2 for deltamethrin and 57 mg AI/m2 for methoprene. This corresponded to 0.3 ml of the formulation in 25 ml H2O, sprayed at the rate of 0.3 ml per 50.3 cm2 arena, using an artist’s air brush (Badger 100 series, Badger Corporation, Franklin Park, IL, US) for each treatment. Each replicate was evenly applied to the concrete dish using a compressor pump. The new Gravista formulation has one labeled rate of 684 ml formulation/L H2O to cover 92.9 m2. To achieve this, we mixed 0.5 ml of the new formulation in 10 ml H2O. This was sprayed at the same rate as the other compound. Distilled water was used for the control arenas at 0.3 mL per arena. The arenas were given 8 h to dry prior to use in experiments. Insects (20 of each species per replicate) were exposed on the insecticide-treated petri dishes for either 4 or 24 h. After exposure, individual Prostephanus truncatus and Sitophilus zeamais were removed and placed into clean Petri dish arenas and evaluated for condition. Using a stereomicroscope (SMZ-18, Nikon Inc., Tokyo, Japan) under 60× magnification, P. truncatus and S. zeamais were classified as alive (moving normally, is able to right itself when flipped over, no twitching), affected (moving sluggishly or erratically, unable to right itself, twitching of antennae or legs may be present), or dead (completely immobile even after prodding) according to prior published definitions (Ranabhat et al., 2022).
\nDispersal and Mortality: To test dispersal capacity to new food patches, a dispersal apparatus was employed. Species-specific cohorts of 20 adults (P. truncatus or S. zeamais) were exposed to Gravista, IGR+, or an untreated control as above for 4 or 24 h, then given 48 h to disperse across 30 or 70 cm standardized sections of PVC pipe (3.175 cm ID). After exposure to insecticide formulations, insects were evaluated for condition after exposure before placing them in the dispersal apparatus. The ends of both sides of the PVC pipe were sealed with mesh (425 μm) to prevent escape. At the far end of the pipe, a hole (2 cm D) was drilled and centered over a glass jar (5 × 6.5 cm D:H) to create a pitfall trap design. The glass jar contained 20 g of whole maize kernels, representing a novel food patch, to induce insects to disperse with food kairomones. Untreated, clean, and uninfested yellow maize was used in the experiments. Grain was sourced from Heartland Mills (Marienthal, KS, USA), and frozen for 72 h prior to use to ensure no prior insect infestation was present. At the end of the sampling period, the number of insects in the jar and their mortality was scored as alive, affected or dead. In addition, the position of each individual was recorded as residing in zone 1 (at the release point), zone 2 (in first half of tube), zone 3 (in second half of tube), or zone 4 (collection jar with maize). In total, there were n = 12 replicate cohorts for each species and combination of distance and treatment. In total, 1,440 P. truncatus and 1,440 S. zeamais were tested in this experiment.
", "title": "Data from: The dispersal capacity of the invasive P. truncatus and the cosmopolitan S. zeamais after brief exposure to a novel insecticide formulation", "distribution": [ { "@type": "dcat:Distribution", "downloadURL": "https://ndownloader.figshare.com/files/44540330", "format": "csv", "mediaType": "application/csv", "title": "ag_data_commons_quellhorst_etal_dispersal_MS.csv" } ], "license": "https://www.usa.gov/publicdomain/label/1.0/", "bureauCode": [ "005:18" ], "modified": "2024-02-20", "publisher": { "@type": "org:Organization", "name": "Agricultural Research Service" }, "keyword": [ "stored products", "Maize", "stored product pest", "larger grain borer", "prostephanus truncatus", "sitophilus", "sitophilus zeamais", "maize weevil", "cgahr", "Kansas", "USDA", "spieru", "dispersal", "movement", "behavior", "insecticide", "toxicology", "deltamethrin", "methoprene", "synergist", "capacity", "NP304", "data.gov", "ARS" ], "spatial": "{\"type\": \"Point\", \"coordinates\": [-96.598654746158, 39.196135536334]}" }, { "identifier": "10.15482/USDA.ADC/1529198", "accessLevel": "public", "contactPoint": { "hasEmail": "mailto:katherine.e.east@gmail.com", "fn": "East, Katherine" }, "programCode": [ "005:040" ], "description": "Data set one: on the population density of Meloidogyne hapla after inoculated on varying soil pH and soil texture during the study. Data set one was used for calculations and associated analyses of the parameters presented in Fig 1.
\nData set two: on the population density of Mesocriconema xenoplax after inoculated on varying soil pH and soil texture during the study, as well as associated plant metrics at harvest. Data set two was used for calculations and associated analyses of the parameters presented in Fig 2.
\nData set three: on the population density of Meloidogyne hapla and Mesocriconema xenoplax after inoculated on varying soil pH and soil texture during the study and associated plant metrics at harvest. Data set three was used for calculations and associated analyses of the parameters presented in Fig 3, and 4.
\nData set four: Root parameters measured using RhizoVision Explorer v2.0.3 on K-means clustered binary root mask images. Data set four was used for calculations and analysis of the parameters presented in Fig 5 and 6.
\nData set five: Measured soil parameters. Data set five was used for calculations and associated analyses in Table 1.
\n*Note: Soil type is referred to as 'site' in all data sets. 'Site' was renamed to 'type' in the associated publication.
\nResources in this dataset:
\nResource Title: Data set 1: M. hapla\nFile Name: M. hapla - soil texture and pH on M. hapla and M. xenoplax.csv
\nResource Title: Data set 2: M. xenoplax\nFile Name: M. xenoplax - soil texture and pH on M. hapla and M. xenoplax.csv
\nResource Title: Data set 3: Nematode and host tomato metrics from harvest\nFile Name: Harvest - soil texture and pH on M. hapla and M. xenoplax.csv
\nResource Title: Data set 4: Root measurements collected using RhizoVision Explorer v2.0.3 on tomato root images\nFile Name: Root images - soil texture and pH on M. hapla and M. xenoplax.csv\nResource Description: This data set was generated from RhizoVision Explorer v2.0.3, after preprocessing of root images. All root treatment data is the total of three seminal roots collected per treatment replicate; one from the top, middle, and bottom of the root mass.
\nResource Title: Data set 5: Soil parameter data\nFile Name: Soil parameters - soil texture and pH on M. hapla and M. xenoplax.csv\nResource Description: There are only two repeats (n=2) for each treatment combination (nematode x site x pH), one from each experimental repeat (August, October).
\nResource Title: Data Dictionary for all data sets\nFile Name: Data Dictionary - soil texture and pH on M. hapla and M. xenoplax.csv\nResource Description: Data Dictionary for all data sets for soil pH and texture effects on Meloidogyne hapla and Mesocriconema xenoplax, as well as host tomato metrics and soil metrics.
\nIncludes 24 hour recall data that children were instructed to fill-out describing the previous day’s activities at baseline, weeks 2 and 4 of the intervention, after the intervention (6 weeks), and after washout (10 weeks). Includes accelerometer data using an ActiGraph to assess usual physical and sedentary activity at baseline, 6 weeks, and 10 weeks. Includes demographic data such as weight, height, gender, race, ethnicity, and birth year. Includes relative reinforcing value data showing how children rated how much they would want to perform both physical and sedentary activities on a scale of 1-10 at baseline, week 6, and week 10. Includes questionnaire data regarding exercise self-efficacy using the Children’s Self-Perceptions of Adequacy in and Predilection of Physical Activity Scale (CSAPPA), motivation for physical activity using the Behavioral Regulations in Exercise Questionnaire, 2nd edition (BREQ-2), motivation for active video games using modified questions from the BREQ-2 so that the question refers to motivation towards active video games rather than physical activity, motivation for sedentary video games using modified questions from the BREQ-2 so that the question refers to motivation towards sedentary video games behavior rather than physical activity, and physical activity-related parenting behaviors using The Activity Support Scale for Multiple Groups (ACTS-MG).
Resource Title: 24 Hour Recall Data.
File Name: 24 hour recalldata.xlsx
Resource Description: Children were instructed to fill out questions describing the previous day's activities at baseline, week 2, and week 4 of the intervention, after the intervention (6 weeks), and after washout (10 weeks).
Resource Title: Actigraph activity data.
File Name: actigraph activity data.xlsx
Resource Description: Accelerometer data using an ActiGraph to assess usual physical and sedentary activity at baseline, 6 weeks, and 10 weeks.
Resource Title: Liking Data.
File Name: liking data.xlsx
Resource Description: Relative reinforcing value data showing how children rated how much they would want to perform both physical and sedentary activities on a scale of 1-10 at baseline, week 6, and week 10.
Resource Title: Demographics.
File Name: Demographics (Birthdate-Year).xlsx
Resource Description: Includes demographic data such as weight, height, gender, race, ethnicity, and year of birth.
Resource Title: Questionnaires.
File Name: questionnaires.xlsx
Resource Description: Questionnaire data regarding exercise self-efficacy using the Children's Self-Perceptions of Adequacy in and Predilection of Physical Activity Scale (CSAPPA), motivation for physical activity using the Behavioral Regulations in Exercise Questionnaire, 2nd edition (BREQ-2), motivation for active video games using modified questions from the BREQ-2 so that the question refers to motivation towards active video games rather than physical activity, motivation for sedentary video games using modified questions from the BREQ-2 so that the question refers to motivation towards sedentary video games behavior rather than physical activity, and physical activity-related parenting behaviors using The Activity Support Scale for Multiple Groups (ACTS-MG).
Treatment groups of ducks were exposed to different virus doses (2, 4, 6 log10 50% egg infectious doses) and by different routes (contact or intrachoanal). The experimental setting was a laboratory with animal care as approved by the institutional animal care and use committee as appropriate for the species and age of bird. Data are the virus titers shed by the oral and cloacal route for individual mallard ducks exposed to H5N1 highly pathogenic avian influenza virus by day post exposure. Samples were collected through 11 days post exposure. Virus titer equivalents were determined by quantitative real-time RT-PCR. Serological data are serum antibody titers to the challenge virus as determined by hemagglutination inhibition assay (reciprocal of the log2 dilution) determined with serum collected 10 or 11 days post exposure.
Resource Title: Virus_shed_data.
File Name: Spackman_et_al_virus_shedData from H5_mallard_study_2022.csv
Resource Description: Virus shed data determined by quantitative real-time RT-PCR
Resource Title: Serology data for H5 challenged mallards.
File Name: Spackman_et_al_Serology_Data from H5_mallard_study_2022.csv
Resource Description: Serology determined by hemagglutination inhibition assay. NS= no serum (sample not run)
Data are the individual group values for oral and cloacal virus shedding and antibody titers for reach treatment group from: Mo et al., The pathogenicity and transmission of live bird market H2N2 avian influenza viruses in chickens, Pekin ducks, and guinea fowl. Vet Mic 260:109180, 2021. https://doi.org/10.1016/j.vetmic.2021.109180
\nMethods: Six H2N2 low pathogenic avian influenza viruses from US LBMs were selected based on recency and to represent the different genotypes present in the live birds markets during the time period (i.e., the presence or absence of a NA stalk deletion): A/duck/PA/14-030488-5/2014 (Dk/PA/14), A/chicken/NY/16-032621-2/2016 (Ck/NY/16), A/chicken/CT/17-008911-4/2017 (Ck/CT/17), A/chicken/NY/18-002471-4/2018 (CK/NY/02471/18), A/chicken/NY/18-042097-3/2018 (Ck/NY/042097/18) and A/chicken/NY/19-012787-1/2019 (Ck/NY/19). Isolates were evaluated in White Leghorn chickens (Gallus gallus), guinea fowl (Numida meleagris) and Pekin ducks (Anas platyrhynchos). Chickens and guinea fowl were challenged at 4 weeks of age and Pekin ducks were challenged at 2 weeks of age with 6log10 of virus by the intra-choanal route. “Contact” birds, which were hatch-mates of the inoculated birds, were co-housed with the inoculated birds 24hrs post inoculation to evaluate transmission. Viral loads in OP and CL swabs collected at 2, 4, 7, 10, and 14 days post inoculation were determined by quantitative real-time reverse-transcriptase polymerase chain reaction (qRT-PCR). RNA was extracted from swabs using the MagMAX96 Viral RNA Isolation Kit (Thermo Fisher Scientific, Waltham, MA) and the KingFisher Flex Magnetic Particle Processing System (Thermo Fisher Scientific), with an additional wash step to remove inhibitors (Das et al., 2009). The qRT‐PCR for AIV detection was conducted based on the standard USDA M gene AIV qRT‐PCR procedure (Spackman et al., 2002) using an Applied Biosystems® 7500 Fast Real‐Time PCR system (Thermo Fisher Scientific). Cycle threshold (Ct) values were determined by the 7500 Fast Software v2.3. For relative quantification, Ct values were converted to titer equivalents based on the standard curve method (Larionov et al., 2005). Values were established from ten-fold dilutions of the same titrated stock of the virus used to challenge the birds. The limit of detection was determined to be 0.8Log10 per reaction. Serological testing for antibodies to the virus utilized the hemagglutination inhibition (HI) assays using homologous antigens were performed to quantify antibody responses with serum collected from chickens, guinea fowl and Pekin ducks at 14 dpi based on the standard protocol (OIE, 2019). HI titers were reported as reciprocal log2 titers, and titers greater than 3 log2 (1:8) were considered positive.
Resource Title: H2N2 influenza pathobiology data for avian species.
File Name: H2N2 data for Archive.xlsx
Resource Description: Data by day post exposure for birds exposed to low pathogenic H2N2 avian influenza virus.
Deep sequencing technologies were used to construct the first adult female Culicoides sonorensis reference transcriptome.
\nGenetic and genomic tools for Culicoides biting midges are lacking, despite the fact that they vector a large number of arboviruses and other pathogens impacting humans and domestic animals world-wide. Libraries of tissue-specific transcripts expressed in response to feeding and oral virus challenge in C. sonorensis have previously been reported, but extensive genome-wide expression profiling in the midge has not. Here, we successfully used deep sequencing technologies to construct the first adult female C. sonorensis reference transcriptome, and utilized genome-wide expression profiling to elucidate the genetic response to blood and sucrose feeding over time. The adult female midge unigene consists of 19,041 genes, of which less than 7% are differentially expressed during the course of a sucrose meal, while up to 52% of the genes respond significantly in blood-fed midges, indicating hematophagy induces complex physiological processes. Many genes that were differentially expressed during blood feeding were associated with digestion (e.g. proteases, lipases), hematophagy (e.g., salivary proteins), and vitellogenesis, revealing many major metabolic and biological factors underlying these critical processes. Additionally, key genes in the vitellogenesis pathway were identified, which provides the first glimpse into the molecular basis of anautogeny for C. sonorensis. This is the first extensive transcriptome for this genus, which will serve as a framework for future expression studies and in informing a reference genome assembly and annotation. Moreover, this study will serve as a foundation for subsequent studies of genome-wide expression analyses during early virus infection and dissecting the molecular mechanisms behind vector competence in midges.
\nResource Title: CSV Data Dictionary for Tables 1-12.
File Name: CulicoidesReferenceTranscriptome_DataDictionary.csv
Resource Description: Defines variables and criteria for the supporting transcriptome sequence data.
Resource Title: File S1..
File Name: pone.0098123.s003.xlsx
Resource Description: Tables S1–S12. Table S1. Sample trimming results of 2×101 bp PE Illumina. Table S2. BlastX alignment of the Culicoides unigene to the NR, and Aedes and Culex transcriptomes. Table S3. Unique GO accessions of the Culicoides transcriptome mapped to the GO database. Table S4. Top 100 genes with at least 2-fold increase in abundance in early response to a blood meal. Table S5. Effect of blood feeding on differential expression of genes in female Culicoides sonorensis. Table S6. Significant differentially expressed genes between teneral and early blood-fed C. sonorensis. Table S7. Significant differentially expressed genes between teneral and late blood-fed C. sonorensis. Table S8. Significant differentially expressed genes between early and late blood-fed C. sonorensis. Table S9. Significant differentially expressed genes between teneral and early sugar-fed C. sonorensis. Table S10. Significant differentially expressed genes between teneral and late sugar-fed C. sonorensis. Table S11. Effect of sucrose feeding on differential expression of genes in female Culicoides sonorensis. Table S12. Differential expression of putative housekeeping or reference genes in C. sonorensis. doi:10.1371/journal.pone.0098123.s003
The data provided is from a study on overwintering honey bee colonies using cold storage. Colonies were summered in two different geographic regions of the USA: South Texas and North Dakota. Colonies summered in North Dakota were placed in cold storage in either October or November of 2019. Placement in cold storage of hives summered in South Texas happened in November of 2019. A second set of colonies overwintered in south Texas. All sets of colonies were evaluated and sampled prior to and after cold storage and again after almond bloom in 2020. Colonies overwintered in South Texas were evaluated during the same periods as those in cold storage. Data are provided for frames of bees and brood pre and post cold storage as well as after almond bloom. The data included in the two files shows: bee frame counts, mite counts and brood counts. Lab data provided shows fat body weight as well as protein and lipid concentrations in worker bees pre and post cold storage /overwintering.
\nResources in this dataset:
\nResource Title: Colony Evaluations Pre and Post Cold Storage\nFile Name: colony sizes.xlsx\nResource Description: The data shows the colony evaluations including frames of brood, frames of bees, and pre treatment mite counts pre and post cold storage.
\nResource Title: Protein and Lipid Concentrations of Honey Bees Colonies Pre and Post Cold Storage\nFile Name: fat body col sizes and analysis.xlsx\nResource Description: The data shows the pre and post cold storage colony lipid and protein concentrations. Data also shows the average number frames of bees, brood and mite counts associated with these treatments.
\nThe New World Screwworm (NWS), Cochliomyia hominivorax, is a pest insect that is endemic to subtropical and tropical regions of the Western Hemisphere. The female lays eggs in open wounds or orifices of warm-blooded animals. Upon hatching, the resulting larvae feed upon the host's living tissues, which can become infected and death can occur. The sterile insect technique was developed to eradicate this pest from North America and new female conditional-lethal strains that generate only male individuals are being developed for use in the eradication program. To facilitate the identification of useful transcripts and gene promoters for these new strains, an Illumina Hi-Seq protocol was used to sequence the testes transcriptome of NWS. This study reports the assembly of 4149 transcripts (≥200 nt) from testes dissected from NWS males obtained from the J06 strain used in the screwworm production plant in Pacora, Panama. Functional annotation resulted in 2060, 2031, 558, and 325 transcripts with assigned BlastX, Gene Ontology, Enzyme Codes, and KEGG pathway information, respectively. In the Gene Ontology annotations, 6% and 3% of the transcripts in the Biological Process Ontology were noted as Developmental Process and Reproduction, respectively. Supplementary data includes FastA sequences of the final assembled dataset contigs and a table of Functional annotation information for the NWS testes transcripts. This dataset will serve as a resource to facilitate studies of sex determination in the NWS and the development of recombinant vectors that can be used to create new male-only strains of NWS.
Resource Title: The testes transcriptome of the New World Screwworm, Cochliomyia hominivorax.
File Name: Web Page, url: https://www.sciencedirect.com/science/article/pii/S2352340916306862
Data in Brief article reporting the assembly of 4149 transcripts (≥200 nt) from testes dissected from New World Screwworm, Cochliomyia hominivoraxmales males obtained from the J06 strain used in the screwworm production plant in Pacora, Panama.
Data files for manuscript titled \"Thermal tolerance of western corn rootworm: critical thermal limits, knock-down resistance, and chill coma recovery\".
\nMetadata is contained within excel file that describes all variables for each tab.
\nAbstract from paper:\nWestern corn rootworm, Diabrotica virgifera virgifera, is one of the most economically important crop pests in the world with estimates of damage and control approximating over $1 billion USD annually. Despite an abundance of research devoted to studying rootworm biology in the central Corn Belt of the United States, key aspects on their thermal ecology are still lacking. Here we address this knowledge gap by measuring critical thermal limits, knock-down resistance, and chill coma recovery. In doing so, we also address methodological questions surrounding measurements of thermal tolerance using a variety of dynamic and static assays. The average critical thermal maxima across all trials was 43.0°C, while the average critical thermal minima was 2.5°C. Critical thermal limits were relatively invariant across all treatments except at faster ramping rates. Knock-down resistance decreased with increasing temperature as survival dropped from 100% at 39°C to 0% within 10 minutes at 44°C. Recovery from chill coma increased by 1.62 minutes for each hour of exposure at 0°C, while survival decreased by 50% after only 24 hours. Combined, our results present the first composite picture of different thermal traits for western corn rootworm, which will be vital for predicting their survival and potential spread under future climate change scenarios.
Resource Title: Data for \"Thermal tolerance of western corn rootworm: critical thermal limits, knock-down resistance, and chill coma recovery\".
File Name: WCR Thermal Methods - Final Data File.xlsx
Resource Description: Excel file with 6 tabs: Metadata, Start Temperature, Ramping Rate, Knock-down Resistance, Chill Coma Survival, and Chill Coma Recovery.
Conservation planning in the Great Plains often depends on understanding the degree of fragmentation of the various types of grasslands and savannas that historically occurred in this region. To define ecological subregions of the Great Plains, we used a revised version of Kuchler’s (1964) map of the potential natural vegetation of the United States. The map was digitized from the 1979 physiographic regions map produced by the Bureau of Land Management, which added 10 physiognomic types. All analyses are based on data sources specific to the United States; hence, we only analyze the portion of the Great Plains occurring in the United States.We sought to quantify the current amount of rangeland in the US Great Plains converted due to 1) woody plant encroachment; 2) urban, exurban, and other forms of development (e.g., energy infrastructure); and 3) cultivation of cropland. At the time of this analysis, the most contemporary measure of land cover across the United States was the 2011 NLCD (Homer et al. 2015). One limitation of the NLCD is that some grasslands with high rates of productivity, such as herbaceous wetlands or grasslands along riparian zones, are misclassified as cropland. A second limitation is the inability to capture cropland conversion occurring after 2011 (Lark et al. 2015). Beginning in 2009 (and retroactively for 2008), the US Department of Agriculture - NASS has annually produced a Cropland Data Layer (CDL) for the United States from satellite imagery,\nwhich maps individual crop types at a 30-m spatial resolution. We used the annual CDLs from 2011 to 2017 to map the distribution of cropland in the Great Plains. We merged this map with the 2011 NLCD to evaluate the degree of fragmentation of grasslands and savannas in the Great Plains as a result of conversion to urban land, cropland, or woodland. We produced two maps of fragmentation (best case and worst case scenarios) that quantify this fragmentation at a 30 x 30 m pixel resolution across the US Great Plains, and make them available for download here.
\nResources in this dataset:
\nResource title: Data Dictionary for Figure 2 derived land cover of the US portion of the North American Great Plains\nFile name: Figure2_Key for landcover classes.csv
\nResource title: Figure 1. Potential natural vegetation of US portion of the North American Great Plains, adapted from Kuchler (1964).\nFile name: Figure1_Kuchler_GPRangelands.zip\nResource description: Extracted grassland, shrubland, savanna, and forest communities in the US Great Plains from the revised Kuchler natural vegetation map
\nResource title: Figure 2. Derived land cover of the US portion of the North American Great Plains.\nFile name: Figure2_Key for landcover classes.zip\nResource description: The fNLCD-CDL product estimates that 43.7% of the Great Plains still consists of grasslands and shrublands, with the remainder consisting of 40.6% cropland, 4.4% forests, 3.0% UGC, 3.0% developed open space, 2.9% improved pasture or hay fields, 1.2% developed land, 1.0% water, and 0.2% barren land, with important regional and subregional variation in the extent of rangeland loss to cropland, forests, and developed land.
\nResource title: Figure 3. Variation in the degree of fragmentation of Great Plains measured in terms of distance to cropland, forest, or developed lands.\nFile name: Figure3_bestcase_disttofrag.zip\nResource description: This map depicts a “best case” scenario in which 1) croplands are mapped based only on the US Department of AgricultureNational Agricultural Statistics Service Cropland Data Layers (2011e2017), 2) all grass-dominated cover types including hay fields and improved pasture are considered rangelands, and 3) developed open space (as defined by the National Land Cover Database) are assumed to not be a fragmenting land cover type.
\nResource title: Figure 4. Variation in the degree of fragmentation of Great Plains measured in terms of distances to cropland, forest, or developed lands.\nFile name: Figure4_worstcase_disttofrag.zip\nResource description: This map depicts a ‘worst case’ scenario in which 1) croplands are mapped based on the US Department of AgricultureNational Agricultural Statistics Service Cropland Data Layers (2011e2017) and the 2011 National Land Cover Database (NLCD), 2) hay fields and improved pasture are not included as rangelands, and 3) developed open space (as defined by NLCD) is included as a fragmenting land cover type.
\nTo enhance the efficacy of the current Newcastle disease vaccine, we have tested two potential adjuvants (Imiquimod and ODN-1826) in chickens. Birds were treated with PBS, Imiquimod or ODN-1826 (50 µg/bird) or vaccinated intranasally with live LaSota strain with or without Imiquimod or ODN-1826 (50 µg/bird). Two weeks after vaccination, birds were challenged with virulent New-castle disease virus (chicken/CA/212676/2002). The experimental setting was a laboratory with animal care as approved by the institutional animal care and use committee as appropriate for the species and age of bird. Data are the serum antibody titers to the vaccine or challenge virus as determined by hemagglutination inhibition assay. Virus shedding titers by the oral and cloacal route for individual birds exposed to virulent Newcastle disease virus were determined by quantitative real-time RT-PCR. Expression of antiviral genes from tissues collected at 1 and 3 days after treating 2 week old SPF chickens with adjuvant and/or vaccines were determined by quantitative PCR.
\nResources in this dataset:
\nHemagglutination inhibition (HI) antibody titers 14 days after vaccinating 2-week-old SPF chickens with LaSota vaccine with or without adjuvant (ODN-1826 or Imiquimod)\nFile Name: Lee et al., Serology Data I from Adjuvanted live NDV vaccine study.csv
\nHemagglutination inhibition antibody titers 14 days after infecting 4 week old SPF chickens with virulent Newcastle disease virus (California/212676/2002)\nFile Name: Lee et al., Serology Data II from Adjuvanted live NDV vaccine study.csv
\nCycle threshold (Ct) value of viral RNA from swabs collected at 2 and 4 days after infecting 4-week-old SPF chickens with virulent Newcastle disease virus (California/212676/2002)\nFile Name: Lee et al.,Virus Shedding Data from Adjuvanted live NDV vaccine study.csv
\nCycle threshold (Ct) value of target specific mRNA collected at 1 and 3 days after treating 2-week-old SPF chickens with adjuvant and/or vaccines\nFile Name: Lee et al.,Transcription Data from Adjuvanted live NDV vaccine study.csv
\nThese are results of a series of laboratory experiments to determine if topical application of methoprene and 20-ecdysone can terminate reproductive diapause of the weevil, Ceratapion basicorne, which is a recently permitted biological control agent of yellow starthistle (Centaurea solstitialis). Adult weevils feed on leaves, creating pin holes, and lay eggs inside leaves. Diapausing weevils were treated with various doses of methoprene (0, 0.01, 0.1, 1.0 micrograms) dissolved in acetone in experiments 1 and 2. They were treated sequentially first with acetone or 20-ecdysone (1.0 microgram) and then with methoprene (1.0 microgram) in experiment 3 and were treated with 20-ecdysone followed by methoprene in experiment 4.
Resource Title: data dictionary.
File Name: JH Data Dictionary.csv
Resource Description: description of data fields
Resource Software Recommended: Microsoft Excel,url: https://www.microsoft.com/microsoft-365/excel
Resource Title: experiment 1.
File Name: JH expt1 data.csv
Resource Description: Methoprene dissolved in acetone was applied topically at doses of 0.0, 0.01 and 0.1 and 1.0 μg per female weevil, and the number of feeding holes and eggs were recorded daily on cut leaves of yellow starthistle at room temperature (12 h photoperiod, temperature range 17 to 21°C).
Resource Software Recommended: Microsoft Excel,url: https://www.microsoft.com/microsoft-365/excel
Resource Title: experiment 2.
File Name: JH expt2 data.csv
Resource Description: Methoprene dissolved in acetone was applied topically at doses of 0.0 and 1.0 μg to female weevils that did not produce eggs in experiment 1. The number of feeding holes and eggs were recorded daily on cut leaves of yellow starthistle at room temperature (12 h photoperiod, temperature range 17 to 21°C).
Resource Software Recommended: Microsoft Excel,url: https://www.microsoft.com/microsoft-365/excel
Resource Title: experiment 3.
File Name: JH expt3 data.csv
Resource Description: Three types of treatments were applied with sequential applications 2 days apart: 1) acetone + acetone [AA: control], 2) acetone + methoprene [AM], and 20-ecdysone + methoprene 174 [2M]. All doses were 1.0 μg. The number of feeding holes and eggs were recorded every 2 days on cut leaves of yellow starthistle at room temperature (12 h photoperiod, temperature range 17 to 21°C).
Resource Software Recommended: Microsoft Excel,url: https://www.microsoft.com/microsoft-365/excel
Resource Title: experiment 4.
File Name: JH expt4 data.csv
Resource Description: Females from experiment 3 that did not oviposit consistently were treated with 1.0 μg of 20-ecdysone followed 2 days later by 1.0 μg of methoprene. The treatments AA, AM, 2M refer to experiment 3. The number of feeding holes and eggs were recorded every 2 days on cut leaves of yellow starthistle at room temperature (12 h photoperiod, temperature range 17 to 21°C).
Resource Software Recommended: Microsoft Excel,url: https://www.microsoft.com/microsoft-365/excel
Biochars are charcoals used as soil amendments, and they have many beneficial effects on soil health. However, one negative effect is biochars often reduce concentrations of soil nitrogen that are available to plants. This is believed to be due to the high carbon and low nitrogen contents of biochars, which deprive soil microbes of nitrogen as they decompose the biochar, and cause microbes to tie up nitrogen from soil. We tested whether we could predict biochar impacts on soil nitrogen from the quantities of carbon and nitrogen in biochar that can be consumed soil microbes. Because biochars are mostly composed of carbon in molecules that can not be consumed by microbes, the microbially-available portion is generally small. We measured the microbially-available carbon and nitrogen in ten biochars, and measured how they impacted nitrogen concentrations in two soils from Oregon.
\nThis dataset includes characteristics of ten biochars and two soils, and measurements from two incubation experiments. In the first experiment we incubated 13C-labeled biochars with two soil for 101 days, and measured production of biochar- and soil-respired CO2 and soil dissolved inorganic nitrogen. In the second experiment we expanded to study ten biochar types, including seven biochars that were not isotopically-labeled. We measured how much dissolved inorganic nitrogen was produced by amended soils over 28 days.
\nSurprisingly, we found all ten biochars increased rather than decreased soil nitrogen concentrations one month after application. We also found that biochars produced at high temperatures, which were more difficult for soil microbes to consume than low-temperature biochars, stimulated more soil decomposition and released more soil nitrogen. It appeared that microbes increased soil decomposition in response to additions of biochar, and this then increased plant-available nitrogen at least temporarily. These unexpected results show that biochar can sometimes have beneficial impacts on soil nitrogen, and that biochar impacts cannot be readily predicted from the qualities of the biochars themselves. These results are relevant to biochar users, and to biochar producers interested in how to make biochars more beneficial for plant growth. These results indicate that biochar users cannot predict nitrogen impacts, and should therefore monitor soil nitrogen concentrations to ensure levels are sufficient for plant growth.
Resource Title: Biochar Properties.
File Name: Biochar Properties.csv
Resource Description: Describes production conditions and provides chemical characteristics of ten biochars used to evaluate impacts of biochar amendment on plant-available nitrogen in soil. Data were collected at the at USDA-ARS National Forage Seed Production Research Unit in Corvallis, OR in 2019-2020.
Resource Title: Experiment 1 Timeseries.
File Name: Experiment 1 Timeseries.csv
Resource Description: Three 13C-labeled barley biochars produced at 350, 500, and 700 degrees Celsius were incubated in two Oregon soils with contrasting levels of organic matter for 101 days to determine impacts of biochar on soil C and N-mineralization. Dataset provides timeseries of CO2 measured with an LGR Ultraportable Greenhouse Gas Analyzer, and nitrate and ammonium measured from 2M KCl extracts using colorimetric methods. Data were collected at the USDA-ARS National Forage Seed Production Research Unit in Corvallis, Oregon in 2019. Isotopic values of respired CO2 were measured from Exetainer samples that were send to the USDA-ARS in Ft.Collins and analyzed using a gas chromatograph-isotope ratio mass spectrometer (Isoprime Inc, UK). Quantities of CO2 respired from biochar and soil were calculated from a 2-member isotopic mixing model.
Resource Title: Experiment 2 Timeseries.
File Name: Experiment 2 Timeseries.csv
Resource Description: Ten biochars were incubated in an Oregon clay-loam soil to test impacts on plant-available soil nitrogen concentration. Biochars were added to a soil at a rate of 2% by mass, wetted to 60% water-filled pore space, and incubated at 23 degrees C under aerobic conditions for 28 days. Soil nitrate and ammonium concentrations were measured on days 0, 14, and 28, using 2M KCl extraction solutions and colorimetric methods. Net N-mineralized on days 14 and 28 was determined by subtracting total inorganic nitrogen on day 0 from values on days 14 and 28, respectively. The impact of biochar amendment was assessed by subtracting net N-mineralized in unamended soils from net N-mineralized in amended soils. Data were collected at the USDA-ARS National Forage Seed Production Research Center in 2020.
Resource Title: Data dictionary for: Towards predicting biochar impacts on plant-available soil nitrogen content.
File Name: DataDictionary_PAN Experiment.xlsx
Resource Description: Provides data descriptions for all resources in the dataset.
Resource Title: Soil Properties.
File Name: Soil Properties.csv
Resource Description: Provides soil properties for two Oregon soils used to evaluate impacts on biochar on plant-available soil nitrogen concentrations. Soils were collected near Corvallis, Oregon and were analyzed at the USDA-ARS National Forage Seed Production Center in 2019.
Data from five laboratory bioassays and three field mesocosm studies performed by Dr. Patrick Moran of the USDA-ARS Invasive Species and Pollinator Health Research Unit, to examine the toxicity of five herbicides (2,4-D, glyphosate, imazamox, penoxsulam and diquat) and two surfactants that are often applied with herbicides (a paraffinic-oil based one and a vegetable oil-based one) to the planthopper Megamelus scutellaris (Hemiptera: Delphacidae) released in the US for biological control of waterhyacinth (Eichhornia crassipes or Pontederia crassipes) an invasive floating aquatic weed. The studies were performed between 2016 and 2021 to support integrated management of waterhyacinth in the Sacramento-San Joaquin Delta of northern California. The planthopper has also been released in Florida and Mississippi, and in South Africa. Herbicide applications are often still necessary where this planthopper and other biocontrol agents have been released. The research question was 'can the planthopper survive exposure to the herbicides and surfactants?'. In lab bioassays, planthoppers from greenhouse colonies were exposed to herbicide-dipped leaves for 24 hours and then allowed to feed for six days on untreated plants. Planthoppers were then collected, frozen and counted. Exposure to diquat or the paraffinic oil-based surfactant caused 40% to 69% greater mortality than did exposure to water-dipped leaves in more than one trial, while the other four herbicides and the vegetable oil-based surfactant were not toxic. In field mesocosm tests, mesocosms were established in 21L tanks caged with mesh tents, and plants allowed to grow for 4 weeks. Between 150 and 240 adult planthoppers were then released into each mesocosm. The following day, mesocosms were sprayed with herbicide, surfactant or insecticide solutions or an insecticide positive control. Three days later, planthoppers were collected with vacuums, frozen and counted. Only treatment with the paraffinic oil-based surfactant reduced final counts (by 36% to 49%) in a manner that was statistically significant compared to water-sprayed mesocosms in more than one mesocosm field trial, along with the insecticide positive control (by up to 98%). Diquat reduced final counts by 64% in one trial. The results indicate that, with the possible exception of diquat, exposing planthoppers to herbicides does not cause significant mortality, consistent with prior regulatory evaluations of these herbicides as being safe for insects. A surfactant that is often applied with the herbicides is toxic to the planthopper, consistent with expectations that this surfactant, designed to break down plant waxes on leaf surfaces, is likely also harmful to insect cuticular waxes, which insects rely on to contain body fluids. Leaving unsprayed refuges for the planthopper may be a useful component of integrated waterhyacinth control programs.
\n
\nResources in this dataset:
Resource Title: Toxicity of herbicides and surfactants to the waterhyacinth planthopper Megamelus scutellaris.
\nFile Name: Waterhyacinth planthopper herbicide toxicity data PMoran.csv
\nResource Software Recommended: MS Excel,url: https://www.microsoft.com/en-us/microsoft-365/excel
\nResource Title: Data dictionary for dataset on toxicity of five herbicides and two surfactants towards the planthopper Megamelus scutellaris.
\nFile Name: Data dictionary for AgPub archive plain text.txt
\nResource Software Recommended: Microsoft Word,url: https://www.microsoft.com/en-us/microsoft-365/p/word
", "title": "Data from: Toxicity of herbicides used for control of waterhyacinth in the California Delta towards the planthopper Megamelus scutellaris released for biological control", "distribution": [ { "@type": "dcat:Distribution", "downloadURL": "https://ndownloader.figshare.com/files/44540207", "format": "csv", "mediaType": "text/plain", "title": "Waterhyacinth planthopper herbicide toxicity data PMoran.csv" }, { "@type": "dcat:Distribution", "downloadURL": "https://ndownloader.figshare.com/files/44540210", "format": "txt", "mediaType": "text/plain", "title": "Data dictionary for AgPub archive plain text.txt" } ], "license": "https://www.usa.gov/publicdomain/label/1.0/", "bureauCode": [ "005:18" ], "modified": "2024-02-20", "publisher": { "@type": "org:Organization", "name": "Agricultural Research Service" }, "keyword": [ "biological control", "weeds", "Waterhyacinth", "herbicides", "toxicity", "Integrated weed management", "NP304", "data.gov", "ARS" ], "spatial": "{\"type\": \"Point\", \"coordinates\": [-122.30645656586, 37.886932152592]}" }, { "identifier": "10.1016/j.dib.2016.11.093", "accessLevel": "public", "contactPoint": { "hasEmail": "mailto:acupp2@unl.edu", "fn": "Cupp, Andrea S." }, "programCode": [ "005:040" ], "description": "Affymetrix Bovine GeneChip® Gene 1.0 ST Array RNA expression analysis was performed on four somatic ovarian cell types: the granulosa cells (GCs) and theca cells (TCs) of the dominant follicle and the large luteal cells (LLCs) and small luteal cells (SLCs) of the corpus luteum. The normalized linear microarray data was deposited to the NCBI GEO repository (GSE83524). Subsequent ANOVA determined genes that were enriched (≥2 fold more) or decreased (≤−2 fold less) in one cell type compared to all three other cell types, and these analyzed and filtered datasets are presented as tables. Genes that were shared in enriched expression in both follicular cell types (GCs and TCs) or in both luteal cells types (LLCs and SLCs) are also reported in tables. The standard deviation of the analyzed array data in relation to the log of the expression values is shown as a figure. These data have been further analyzed and interpreted in the companion article \"Gene expression profiling of ovarian follicular and luteal cells provides insight into cellular identities and functions\", Romereim et al., (2017) Mol. Cell. Endocrinol. 439:379-394. https://doi.org/10.1016/j.mce.2016.09.029
\nResource Title: RNA Expression Data from Four Isolated Bovine Ovarian Somatic Cell Types.
File Name: Web Page, url: https://www.ncbi.nlm.nih.gov/geo/query/acc.cgi?acc=GSE83524
NCBI Gene Expression Omnibus (GEO) Accession Display. Analysis of the RNA present in each bovine cell type using Affymetrix microarrays yielded new cell-specific genetic markers, functional insight into the behavior of each cell type via Gene Ontology Annotations and Ingenuity Pathway Analysis, and evidence of small and large luteal cell lineages using Principle Component Analysis. Enriched expression of select genes for each cell type was validated by qPCR. This expression analysis offers insight into the lineage and differentiation process that transforms somatic follicular cells into luteal cells.\nThe orignal Affymetrix .CEL files and the normalized linear expression data are included in this submission.
RNA expression analysis was performed on the corpus luteum tissue at five time points after prostaglandin F2 alpha treatment of midcycle cows using an Affymetrix Bovine Gene v1 Array. The normalized linear microarray data was uploaded to the NCBI GEO repository (GSE94069). Subsequent statistical analysis determined differentially expressed transcripts ± 1.5-fold change from saline control with P ≤ 0.05. Gene ontology of differentially expressed transcripts was annotated by DAVID and Panther. Physiological characteristics of the study animals are presented in a figure. Bioinformatic analysis by Ingenuity Pathway Analysis was curated, compiled, and presented in tables. A dataset comparison with similar microarray analyses was performed and bioinformatics analysis by Ingenuity Pathway Analysis, DAVID, Panther, and String of differentially expressed genes from each dataset as well as the differentially expressed genes common to all three datasets were curated, compiled, and presented in tables. Finally, a table comparing four bioinformatics tools' predictions of functions associated with genes common to all three datasets is presented. These data have been further analyzed and interpreted in the companion article \"Early transcriptome responses of the bovine mid-cycle corpus luteum to prostaglandin F2 alpha includes cytokine signaling\".
Resource Title: Supporting information as Excel spreadsheets and tables.
File Name: Web Page, url: http://www.sciencedirect.com/science/article/pii/S2352340917304031?via=ihub#s0070
Supplemental information from a project describing the transcriptome of a beetle parasite of honey bees
\nThe small hive beetle (SHB), Aethina tumida, is a major pest of managed honey bee (Apis mellifera) colonies in the United States and Australia, and an emergent threat in Europe. While strong honey bee colonies generally keep SHB populations in check, weak or stressed colonies can succumb to infestations. This parasite has spread from a sub-Saharan Africa to three continents, leading to immense management and regulatory costs. We performed a transcriptomic analysis involving deep sequencing of multiple life stages and both sexes of this species. The assembled transcriptome appears to be nearly complete, as judged by conserved insect orthologs and the ability to find plausible homologs for 11,952 proteins described from the genome of the red flour beetle. Expressed genes include each of the major metabolic, developmental and sensory groups, along with genes for proteins involved with immune defenses and insecticide resistance. We also present a total of 23,085 high-quality SNP's for the assembled contigs. We highlight potential differences between this beetle and its honey bee hosts, and suggest mechanisms of future research into the biology and control of this species. SNP resources will allow functional genetic analyses and analyses of dispersal for this invasive pest.
Resource Title: SHB_SuppTable3.
File Name: SHB_SuppTable3.xlsx
Resource Description: Annotated transcript contigs
Resource Title: SHB_SuppTable2.
File Name: SHB_SuppTable2.xlsx
Resource Description: SNP data file
Resource Title: SHB_SuppTable1.
File Name: SHB_SuppTable1.xlsx
Resource Description: Microsatellite loci
Path analyses of historical streamflow data from the Pacific Northwest indicate that the precipitation amount has been the dominant control on the magnitude of low streamflow extremes compared to the air temperature‐affected timing of snowmelt runoff. The relative sensitivities of low streamflow to precipitation and temperature changes have important implications for adaptation planning because global circulation models produce relatively robust estimates of air temperature changes but have large uncertainties in projected precipitation amounts in the Pacific Northwest U.S. Quantile regression analyses indicate that low streamflow extremes from the majority of catchments in this study have declined from 1948 to 2013, which may significantly affect terrestrial and aquatic ecosystems, and water resource management. Trends in the 25th percentile of mean annual streamflow have declined and the center of timing has occurred earlier. We quantify the relative influences of total precipitation and air temperature on the annual low streamflow extremes from 42 stream gauges using mean annual streamflow as a proxy for precipitation amount effects and streamflow center of timing as a proxy for temperature effects on low flow metrics, including 7q10 summer (the minimum 7 day flow during summer with a 10 year return period), mean August, mean September, mean summer, 7q10 winter, and mean winter flow metrics. These methods have the benefit of using only readily available streamflow data, which makes our results robust against systematic errors in high elevation distributed precipitation data. Winter low flow metrics are weakly tied to both mean annual streamflow and center of timing.
Resource Title: Supporting Information: Figure S1; Table S1 - Download docx.
File Name: downloadSupplement, url: https://agupubs.onlinelibrary.wiley.com/action/downloadSupplement?doi=10.1002/2015WR018125&file=wrcr22104-sup-0001-2015WR018125-s01.doc
Figure S1. Net effect from mean annual streamflow and center of timing on low flow metrics at each gauge.\nTable S1. Basins with significant basin area classified as irrigation in USGS water year summaries (ie http://waterdata.usgs.gov/wa/nwis/wys_rpt/?site_no=14113000).
Sequence alignments for cox2 and nc LSU rDNA datasets, as well as a reduced cox2 dataset used to determine the variable molecular characters that help to distinguish between the two new Plasmopara species described. The earliest specimen studied was collected in 1884, the most recent in 2021.
Resource Title: Cox2 dataset, aligned.
File Name: Salgado_Salazar_COX2_dataset_Plasmoparaspnov.fasta
Resource Title: Cox2 dataset for barcoding, alignment.
File Name: Salgado-Salazar_COX2_Plasmoparaspnov_barcodes.fasta
Resource Title: rDNA LSU dataset, alignment.
File Name: Salgado-Salazar_LSU_dataset_Plasmoparaspnov.fasta
This dataset consists of point intercept data, sampled with a point frame, from three 1 ha sites along an elevation and precipitation gradient within Reynolds Creek Experimental Watershed collected between late May and mid July, 2019. The lowest elevation site ('wbs1', 1,425 m) was vegetated by shrub steppe dominated Wyoming big sage (Artemisia tridentata ssp. wyomingensis). Vegetation at the middle elevation site ('los1', 1,680 m) was shrub steppe dominated by low sage (Artemisia arbuscula). Shrub steppe at the highest elevation site ('mbs1', 2,110 m) was dominated by mountain big sage (Artemisia tridentata ssp. vaseyana) and Utah snowberry (Symphoricarpos oreophilus utahensis). At each site 30 randomly located square 1 m^2 plots were sampled. The plots were oriented with one axis randomly chosen from 45, 90, 135, 180, 225, 270, 315 and 360 degrees north azimuth. A point frame of 20 pins was orientated perpendicular to the azimuth and each pin was lowered through the canopy and each contact was recorded to species or other plant material category. Whether the contacted material was photosynthetic (coded as a '+') or non-photosynthetic (coded as '-') was also recorded. Last seasons senesced plant material that is alive but not photosynthetic is coded as '.'. There may be 0, 1, 2 or more canopy hits for each pin (numbered 1 through n with 1 being the top-most canopy hit). A final basal hit is recorded for each pin and coded as hit 0. The point frame was moved so that a total of 5 rows were recorded for a total of 100 pins for each plot. The plant species codes used follow the USDA Plants Database.
Resource Title: Data from: UAS imagery protocols to map vegetation are transferable between dryland sites across an elevational gradient .
File Name: point_frame_2019_reynoldscreek.xlsx
Resource Description: This dataset consists of point frame data from three 1 ha sites along an elevation and precipitation gradient within Reynolds Creek Experimental Watershed collected between late May and mid July, 2019. The lowest site's ('wbs1', 1,425 m) characteristic dominant shrub is Wyoming big sage (Artemisia tridentata ssp. wyomingensis). The middle elevation site's ('los1', 1,680 m) dominant shrub is low sage (Artemisia arbuscula). The highest elevation site's ('mbs1', 2,110 m) dominant shrubs are mountain big sage (Artemisia tridentata ssp. vaseyana) and Utah snowberry (Symphoricarpos oreophilus utahensis). At each site 30 randomly located square 1 m^2 plots were sampled. The plots were oriented with one axis randomly chosen from 45, 90, 135, 180, 225, 270, 315 and 360 degrees north azimuth. A point frame of 20 pins was orientated perpendicular to the azimuth and each pin was lowered through the canopy and each contact was recorded to species or other plant material category. Whether the contacted material was photosynthetic (coded as a '+') or non-photosynthetic (coded as '-') was also recorded. Last seasons senesced plant material that is alive but not photosynthetic is coded as '.'. There may be 0, 1, 2 or more canopy hits for each pin (numbered 1 through n with 1 being the top-most canopy hit). A final basal hit is recorded for each pin and coded as hit 0. The point frame was moved so that a total of rows rows were recorded for a total of 100 pins for each plot. The plant species codes used follow the USDA Plants Database.
Resource Software Recommended: Microsoft Excel,url: https://www.microsoft.com/en-us/microsoft-365/excel
Resource Title: GeoJSON.
File Name: ReynoldsCrkExpWtrshdGeoJSON.json
Established in 1912, the Northern Great Plains Research Laboratory (NGPRL) is a USDA Agricultural Research Service facility located in Mandan, Morton County, North Dakota. In 1916, NGPRL scientists established a long-term rangeland management research project focusing on developing the most appropriate stocking rates for rangelands in the region. The research project ran for 100 years and included pasture 62, a heavily stocked pasture, and 66, a moderately stocked pasture for the entire time. Also, in 1931, pasture 37 was converted from smooth bromegrass to crested wheatgrass, which was both lightly and moderately stocked. NGPRL's grazing season is traditionally May-October which reflects the surrounding region. Animals may be put on slightly later or pulled earlier due to extreme weather conditions or events (e.g. drought, blizzard). The legacy livestock production data from these pastures include 100 years (1916-2016) of livestock production data from pastures 62 and 66 and 84 years (1932-2016) from pasture 37. Pasture 37 was fertilized annually in spring with 40 pounds nitrogen urea [46-0-0] per acre until 2010 and after that it was fertilized intermittently. Grazing treatments on these pastures were applied with stocking rates calculated in 1916 based on 600 lb. animal. Stocking rates were adjusted when pasture sizes were decreased, and this information is included in the data dictionary for the stocking rate and AUM data table. Please note data is missing from 1984 and 1985 from all the pastures.\nJohnson Thatcher Sarvis established the experiment in 1915 and managed it until 1940. The experiment was continued by George Rogler from 1940 to 1952, Russell Lorenz and George Rogler from 1953 to 1973, Russell Lorenz from 1974 to 1979, Lenat Hofmann from 1980 to 1992, and James Karns from 1993 to 2002. Numerous technicians and part-time students were also involved in the day-to-day management and conduct of the experiment. We would like to recognize these scientists and support staff for their extraordinary foresight and determination in skillfully managing and continuing this experiment into the twenty-first century. Thanks also to Holly Johnson at the Northern Great Plains Research Laboratory for organizing, cataloging, and annotating the publications from the long-term experiment.
\nResource Title: Legacy Livestock Production .
File Name: LegacyProduction.csv
Resource Description: In 1916 long-term rangeland management research was established to meet the needs of farmers and ranchers in the region. These are the legacy livestock production data from those research pastures, which included pastures: 62, a heavily grazed pasture; 66, a lightly grazed pasture; and 37, a pasture planted with crested wheatgrass and subsequently fertilized was both moderately and lightly grazed. NGPRL's grazing season is traditionally April-October.
Resource Title: Data Dictionary Defining Attributes of Legacy Production Data.
File Name: DataDictionaryLegacyProduction.csv
Resource Title: Calendar Dates for Legacy Livestock Production Data.
File Name: CalendarDates.csv
Resource Description: Animals may be put on slightly later or pulled earlier due to extreme weather conditions or events (e.g. drought, blizzard).
Resource Title: Data Dictionary for Calendar Dates for Legacy Livestock Production Data.
File Name: DataDictionaryCalendarDates.csv
Resource Title: Animal Unit Months and Stocking Rates for Legacy Livestock Production Data.
File Name: AUM_StockingRates.csv
Resource Description: Pastures 62 and 66 have over one hundred years of data (1916-2016). Pasture 37 was cultivated out of brome-grass in 1931 to plant crested wheatgrass and thus has eighty-four years of data. Pasture 37 was fertilized annually in spring with 40 pounds nitrogen urea [46-0-0] per acre, per year. Grazing treatments on these pastures were applied with stocking rates calculated in 1916 based on 600 lb. animal. Stocking rates were adjusted when pasture sizes were decreased, and this information is included in the data dictionary for the stocking rate and AUM data table.
Resource Title: Data Dictionary for Animal Unit Months and Stocking Rates for Legacy Livestock Production Data.
File Name: DataDictionaryAUM_StockingRates.csv
Published in Transactions of the ASABE 58(2): 281-295 (doi: 10.13031/trans.58.10896). 2015 American Society of Agricultural and Biological Engineers.
\nThe current USDA-ARS aerial spray nozzle models were updated to reflect both new standardized measurement methods and systems as well as to increase operational spray pressure, aircraft airspeed, and nozzle orientation angle limits. The new models were developed using both central composite design and custom design response surface methodologies, which provide excellent fits to independently measured data (R2 values ranging from 0.81 to 0.99) for all droplet size parameters. The new models also updated the droplet size classification ratings by adopting a previously recommended set of nozzles and operational pressures that provide similar data to ASABE Standard Reference nozzles but are evaluated under aerial application conditions (primarily airspeed). Generally, for flat fan and deflection type nozzles, the new models result in increases to predicted DV0.1 data (droplet diameter at which 10% of the total spray volume is contained in droplets of equal or lesser diameter), decreases in DV0.5 and DV0.9 data (similar to DV0.1 but 50% and 90% of total spray volume), and increases in the percent of spray contained in droplets of 200 µm diameter or smaller. With straight stream nozzles, the DV0.1, DV0.5, and DV0.9 trends tend to be reversed. Droplet size classifications with the new models for flat fan and deflector type nozzles tend to shift ratings downward, as compared to the current models, with classes centered around fine and medium sprays. However, with straight stream nozzles, droplet size classifications tend to shift ratings upward as compared to the current models. The updated models will be used to populate spreadsheet and mobile device software-based user interfaces to provide aerial applicators with droplet size information for an increased range of nozzles and operational settings, allowing for better nozzle selection and operational guidance.
\nResources in this dataset:
\nShiga toxin-producing Escherichia coli (STEC) and Listeria monocytogenes are responsible for severe foodborne illnesses in the United States. Current identification methods require at least four days to identify STEC and six days for L. monocytogenes. Adoption of long-read, whole genome sequencing for testing could significantly reduce the time needed for identification, but method development costs are high. Therefore, the goal of this project was to use NanoSim-H software to simulate Oxford Nanopore sequencing reads to assess the feasibility of sequencing-based foodborne pathogen detection and guide experimental design. Sequencing reads were simulated for STEC, L. monocytogenes, and a 1:1 combination of STEC and Bos taurus genomes using NanoSim-H. This dataset includes all of the simulated reads generated by the project in fasta format. This dataset can be analyzed bioinformatically or used to test bioinformatic pipelines.
", "title": "Data from: Use of long-read sequencing simulators to assess real-world applications for food safety", "distribution": [ { "@type": "dcat:Distribution", "downloadURL": "https://ndownloader.figshare.com/files/43772694", "format": "fasta", "mediaType": "text/plain", "title": "O157H7_10read_simulated.fasta" }, { "@type": "dcat:Distribution", "downloadURL": "https://ndownloader.figshare.com/files/43772697", "format": "fasta", "mediaType": "text/plain", "title": "O157H7_50read_simulated.fasta" }, { "@type": "dcat:Distribution", "downloadURL": "https://ndownloader.figshare.com/files/43772700", "format": "fasta", "mediaType": "text/plain", "title": "O157H7_75read_simulated.fasta" }, { "@type": "dcat:Distribution", "downloadURL": "https://ndownloader.figshare.com/files/43772703", "format": "fasta", "mediaType": "text/plain", "title": "O157H7_100read_simulated.fasta" }, { "@type": "dcat:Distribution", "downloadURL": "https://ndownloader.figshare.com/files/43772706", "format": "fasta", "mediaType": "text/plain", "title": "O157H7_250read_simulated.fasta" }, { "@type": "dcat:Distribution", "downloadURL": "https://ndownloader.figshare.com/files/43772709", "format": "fasta", "mediaType": "text/plain", "title": "O157H7_500read_simulated.fasta" }, { "@type": "dcat:Distribution", "downloadURL": "https://ndownloader.figshare.com/files/43772712", "format": "fasta", "mediaType": "text/plain", "title": "O157H7_750read_simulated.fasta" }, { "@type": "dcat:Distribution", "downloadURL": "https://ndownloader.figshare.com/files/43772715", "format": "fasta", "mediaType": "text/plain", "title": "O157H7_1000read_simulated.fasta" }, { "@type": "dcat:Distribution", "downloadURL": "https://ndownloader.figshare.com/files/43772718", "format": "fasta", "mediaType": "text/plain", "title": "O157H7_2500read_simulated.fasta" }, { "@type": "dcat:Distribution", "downloadURL": "https://ndownloader.figshare.com/files/43772721", "format": "fasta", "mediaType": "text/plain", "title": "O157H7_5000read_simulated.fasta" }, { "@type": "dcat:Distribution", "downloadURL": "https://ndownloader.figshare.com/files/43772724", "format": "fasta", "mediaType": "text/plain", "title": "O157H7_7500read_simulated.fasta" }, { "@type": "dcat:Distribution", "downloadURL": "https://ndownloader.figshare.com/files/43772727", "format": "fasta", "mediaType": "text/plain", "title": "O157H7_10000read_simulated.fasta" }, { "@type": "dcat:Distribution", "downloadURL": "https://ndownloader.figshare.com/files/43772730", "format": "fasta", "mediaType": "text/plain", "title": "O157H7_50000read_simulated.fasta" }, { "@type": "dcat:Distribution", "downloadURL": "https://ndownloader.figshare.com/files/43772736", "format": "fasta", "mediaType": "text/plain", "title": "O157H7_75000reads_simulated.fasta" }, { "@type": "dcat:Distribution", "downloadURL": "https://ndownloader.figshare.com/files/43772739", "format": "fasta", "mediaType": "text/plain", "title": "O157H7_100000read_simulated.fasta" }, { "@type": "dcat:Distribution", "downloadURL": "https://ndownloader.figshare.com/files/43772784", "format": "fasta", "mediaType": "text/plain", "title": "O157H7_250000read_simulated.fasta" }, { "@type": "dcat:Distribution", "downloadURL": "https://ndownloader.figshare.com/files/43772793", "format": "fasta", "mediaType": "text/plain", "title": "O157H7_500000read_simulated.fasta" }, { "@type": "dcat:Distribution", "downloadURL": "https://ndownloader.figshare.com/files/43772814", "format": "fasta", "mediaType": "text/plain", "title": "Lmono_10reads_simulated.fasta" }, { "@type": "dcat:Distribution", "downloadURL": "https://ndownloader.figshare.com/files/43772817", "format": "fasta", "mediaType": "text/plain", "title": "Lmono_50reads_simulated.fasta" }, { "@type": "dcat:Distribution", "downloadURL": "https://ndownloader.figshare.com/files/43772820", "format": "fasta", "mediaType": "text/plain", "title": "Lmono_75reads_simulated.fasta" }, { "@type": "dcat:Distribution", "downloadURL": "https://ndownloader.figshare.com/files/43772823", "format": "fasta", "mediaType": "text/plain", "title": "Lmono_100reads_simulated.fasta" }, { "@type": "dcat:Distribution", "downloadURL": "https://ndownloader.figshare.com/files/44730022", "format": "fasta", "mediaType": "application/zip", "title": "Lmono_750000reads_simulated.fasta" }, { "@type": "dcat:Distribution", "downloadURL": "https://ndownloader.figshare.com/files/44730061", "format": "fasta", "mediaType": "application/zip", "title": "Lmono_1000000reads_simulated.fasta" }, { "@type": "dcat:Distribution", "downloadURL": "https://ndownloader.figshare.com/files/43772826", "format": "fasta", "mediaType": "text/plain", "title": "Lmono_250reads_simulated.fasta" }, { "@type": "dcat:Distribution", "downloadURL": "https://ndownloader.figshare.com/files/44730025", "format": "fasta", "mediaType": "application/zip", "title": "O157H7_750000read_simulated.fasta" }, { "@type": "dcat:Distribution", "downloadURL": "https://ndownloader.figshare.com/files/43772829", "format": "fasta", "mediaType": "text/plain", "title": "Lmono_500reads_simulated.fasta" }, { "@type": "dcat:Distribution", "downloadURL": "https://ndownloader.figshare.com/files/43772832", "format": "fasta", "mediaType": "text/plain", "title": "Lmono_750reads_simulated.fasta" }, { "@type": "dcat:Distribution", "downloadURL": "https://ndownloader.figshare.com/files/44730058", "format": "fasta", "mediaType": "application/zip", "title": "O157H7_1000000read_simulated.fasta" }, { "@type": "dcat:Distribution", "downloadURL": "https://ndownloader.figshare.com/files/44730067", "format": "fasta", "mediaType": "application/zip", "title": "1000000 simulated.fasta" }, { "@type": "dcat:Distribution", "downloadURL": "https://ndownloader.figshare.com/files/43772835", "format": "fasta", "mediaType": "text/plain", "title": "Lmono_1000reads_simulated.fasta" }, { "@type": "dcat:Distribution", "downloadURL": "https://ndownloader.figshare.com/files/43772838", "format": "fasta", "mediaType": "text/plain", "title": "Lmono_2500reads_simulated.fasta" }, { "@type": "dcat:Distribution", "downloadURL": "https://ndownloader.figshare.com/files/43772841", "format": "fasta", "mediaType": "text/plain", "title": "Lmono_5000reads_simulated.fasta" }, { "@type": "dcat:Distribution", "downloadURL": "https://ndownloader.figshare.com/files/43772844", "format": "fasta", "mediaType": "text/plain", "title": "Lmono_7500reads_simulated.fasta" }, { "@type": "dcat:Distribution", "downloadURL": "https://ndownloader.figshare.com/files/43772847", "format": "fasta", "mediaType": "text/plain", "title": "Lmono_10000reads_simulated.fasta" }, { "@type": "dcat:Distribution", "downloadURL": "https://ndownloader.figshare.com/files/43772853", "format": "fasta", "mediaType": "text/plain", "title": "Lmono_50000reads_simulated.fasta" }, { "@type": "dcat:Distribution", "downloadURL": "https://ndownloader.figshare.com/files/43773156", "format": "fasta", "mediaType": "text/plain", "title": "Lmono_75000reads_simulated.fasta" }, { "@type": "dcat:Distribution", "downloadURL": "https://ndownloader.figshare.com/files/43773159", "format": "fasta", "mediaType": "text/plain", "title": "Lmono_100000reads_simulated.fasta" }, { "@type": "dcat:Distribution", "downloadURL": "https://ndownloader.figshare.com/files/43773165", "format": "fasta", "mediaType": "text/plain", "title": "Lmono_250000reads_simulated.fasta" }, { "@type": "dcat:Distribution", "downloadURL": "https://ndownloader.figshare.com/files/43773171", "format": "fasta", "mediaType": "text/plain", "title": "Lmono_500000reads_simulated.fasta" }, { "@type": "dcat:Distribution", "downloadURL": "https://ndownloader.figshare.com/files/43773183", "format": "fasta", "mediaType": "text/plain", "title": "10 simulated.fasta" }, { "@type": "dcat:Distribution", "downloadURL": "https://ndownloader.figshare.com/files/43773186", "format": "fasta", "mediaType": "text/plain", "title": "50 simulated.fasta" }, { "@type": "dcat:Distribution", "downloadURL": "https://ndownloader.figshare.com/files/43773189", "format": "fasta", "mediaType": "text/plain", "title": "75 simulated.fasta" }, { "@type": "dcat:Distribution", "downloadURL": "https://ndownloader.figshare.com/files/43773192", "format": "fasta", "mediaType": "text/plain", "title": "100 simulated.fasta" }, { "@type": "dcat:Distribution", "downloadURL": "https://ndownloader.figshare.com/files/43773195", "format": "fasta", "mediaType": "text/plain", "title": "250 simulated.fasta" }, { "@type": "dcat:Distribution", "downloadURL": "https://ndownloader.figshare.com/files/43773198", "format": "fasta", "mediaType": "text/plain", "title": "500 simulated.fasta" }, { "@type": "dcat:Distribution", "downloadURL": "https://ndownloader.figshare.com/files/43773201", "format": "fasta", "mediaType": "text/plain", "title": "750 simulated.fasta" }, { "@type": "dcat:Distribution", "downloadURL": "https://ndownloader.figshare.com/files/43773204", "format": "fasta", "mediaType": "text/plain", "title": "1000 simulated.fasta" }, { "@type": "dcat:Distribution", "downloadURL": "https://ndownloader.figshare.com/files/43773207", "format": "fasta", "mediaType": "text/plain", "title": "2500 simulated.fasta" }, { "@type": "dcat:Distribution", "downloadURL": "https://ndownloader.figshare.com/files/43773210", "format": "fasta", "mediaType": "text/plain", "title": "5000 simulated.fasta" }, { "@type": "dcat:Distribution", "downloadURL": "https://ndownloader.figshare.com/files/43773213", "format": "fasta", "mediaType": "text/plain", "title": "7500 simulated.fasta" }, { "@type": "dcat:Distribution", "downloadURL": "https://ndownloader.figshare.com/files/43773225", "format": "fasta", "mediaType": "text/plain", "title": "10000 simulated.fasta" }, { "@type": "dcat:Distribution", "downloadURL": "https://ndownloader.figshare.com/files/43773234", "format": "fasta", "mediaType": "text/plain", "title": "50000 simulated.fasta" }, { "@type": "dcat:Distribution", "downloadURL": "https://ndownloader.figshare.com/files/43773243", "format": "fasta", "mediaType": "text/plain", "title": "75000 Reads.fasta" }, { "@type": "dcat:Distribution", "downloadURL": "https://ndownloader.figshare.com/files/43773261", "format": "fasta", "mediaType": "text/plain", "title": "100000 simulated.fasta" }, { "@type": "dcat:Distribution", "downloadURL": "https://ndownloader.figshare.com/files/43773276", "format": "fasta", "mediaType": "text/plain", "title": "250000 simulated.fasta" }, { "@type": "dcat:Distribution", "downloadURL": "https://ndownloader.figshare.com/files/43773294", "format": "fasta", "mediaType": "text/plain", "title": "500000 simulated.fasta" }, { "@type": "dcat:Distribution", "downloadURL": "https://ndownloader.figshare.com/files/43773315", "format": "fasta", "mediaType": "application/zip", "title": "750000 simulated.fasta" } ], "license": "https://www.usa.gov/publicdomain/label/1.0/", "bureauCode": [ "005:18" ], "modified": "2024-02-28", "publisher": { "@type": "org:Organization", "name": "Agricultural Research Service" }, "keyword": [ "sequencing simulation", "long-read sequencing", "MinION", "Escherichia coli O157:H7", "Listeria monocytogenes", "NP108", "data.gov", "ARS" ], "spatial": "{\"type\": \"Point\", \"coordinates\": [-795.18665313721, 40.077810523208]}" }, { "identifier": "10.15482/USDA.ADC/25029497.v1", "accessLevel": "public", "contactPoint": { "hasEmail": "mailto:Bethany.McGregor@usda.gov", "fn": "McGregor, Bethany L." }, "programCode": [ "005:040" ], "description": "Vector-borne disease prevalence is increasing at a time when surveillance capacity in the United States is decreasing. One way to address this surveillance deficiency is to utilize established infrastructure, such as zoological parks, to investigate animal disease outbreaks and improve our epidemiological understanding of vector-borne pathogens. During fall 2020, an outbreak of epizootic hemorrhagic disease (EHD) at the Minnesota Zoo resulted in morbidity and seroconversion of several collection animals. In response to this outbreak, insect surveillance was conducted, and the collected insects were tested for the presence of epizootic hemorrhagic disease virus (EHDV) by RT-qPCR to better understand the local transmitting vector populations responsible for the outbreak. Six pools of Culicoides biting midges were positive for EHDV, including three pools of Culicoides sonorensis, two pools of Culicoides variipennis, and a pool of degraded C. variipennis complex midges. All three endemic serotypes of EHDV (1, 2, and 6) were detected in both animals and midge pools from the premises. Despite this outbreak, no EHDV cases had been reported in wild animals near the zoo. This highlights the importance and utility of using animal holding facilities, such as zoos, as sentinels to better understand the spatio-temporal dynamics of pathogen transmission.
", "title": "Data from: Using zoos as sentinels for re-emerging arboviruses: Vector surveillance during an outbreak of epizootic hemorrhagic disease at the Minnesota Zoo", "distribution": [ { "@type": "dcat:Distribution", "downloadURL": "https://ndownloader.figshare.com/files/44152970", "format": "csv", "mediaType": "text/plain", "title": "MNZooEHDVData_qPCR.csv" } ], "license": "https://creativecommons.org/licenses/by/4.0/", "bureauCode": [ "005:18" ], "modified": "2024-03-05", "publisher": { "@type": "org:Organization", "name": "Agricultural Research Service" }, "accrualPeriodicity": "irregular", "keyword": [ "Epizootic Hemorrhagic Disease Virus", "Culicoides", "Surveillance", "Zoo", "Culicoides sonorensis", "Culicoides variipennis" ], "spatial": "{\"type\": \"MultiPoint\", \"coordinates\": [[-93.20444, 44.775827], [-93.187814, 44.777581], [-93.198091, 44.764937], [-93.207156, 44.764827]]}" }, { "identifier": "10.15482/USDA.ADC/24727866.v2", "accessLevel": "public", "contactPoint": { "hasEmail": "mailto:david.schneider1@usda.gov", "fn": "Schneider, David A." }, "programCode": [ "005:040" ], "description": "The diagnostic performance of a standardized RT-QuIC protocol using two sources of assay substrate was studied for detecting chronic wasting disease (CWD) in mock rectal mucosa biopsy samples from farmed white-tailed deer (Odocoileus virginianus).
The entire collection of reaction data used to determine the diagnostic performance of a standardized RT-QuIC protocol (DOI: dx.doi.org/10.17504/protocols.io.yxmvmn2y6g3p/v1). The variables (columns) in the dataset include the name of the substrate source, the plate reader ID, plate well position, assay time in fractional hours, the ThT signal measured in relative fluorescence units, and also the following animal information for the sample tested: an anonymized white-tailed deer ID, sex, age in years, PRNP genotype at codons 95 and 96, and stage of infection. The animal's stage of infection was determined by immunohistochemistry for CWD-associated prion protein accumulation in the medial retropharyngeal lymph nodes (MRPLN) and the obex. All deer were from farms on which infected deer had been previously detected; thus, all deer were considered exposed. Based on the results of CWD-IHC, deer were classified for CWD as infection not detected in these tissues (ND), as early preclinical when CWD-IHC positive in only the MRPLN, and as late preclinical when CWD-IHC positive in both the MRPLN and obex. None of the deer were reported to be clinical at the time of sample collection.
A series of 26 PNG files representing the reaction data from RTQuIC_reactions.xlsx.
Each PNG file plots the ThT data acquired from a 96-well plate over time. Each file includes a header identifying the substrate source, plate ID (1-13 for each substrate source), and plate reader ID. Each plot indicates the white-tailed deer ID being tested and shows the quadruplicate reactions recorded. Also included are the quadruplicate reaction data for the plate negative control (a sample from an ND deer) and positive control (a late preclinical deer).
Gross purity of recombinant prion protein substrates. After the initial performance testing of the standardized RT-QuIC assay protocol, the gross purities of the independently produced recombinant truncated hamster prion protein (rPrP Ha90) substrates were compared by denaturing gel electrophoresis and Coomassie staining. A subsequent production run of the commercial source (MNPROtein) and laboratory source rPrPs were obtained and routinely prepared in RT-QuIC reaction buffer at a working concentration of 0.1 mg/mL before processing for electrophoresis (NuPAGETM; Invitrogen). An image of the resultant gel is shown in which Precision Plus Protein WesternC (BioRad) markers were loaded into lanes 1 and 4, and the processed RT-QuIC reaction buffers containing MNPROtein or laboratory produced rPrP Ha90 substrates were respectively loaded into lanes 2 and 3. The molecular mass and amount of each production source of rPrP substrate in RT-QuIC reaction buffer appear equivalent and without gross evidence of impurities.
", "title": "Data from: Validation of a real-time quaking-induced conversion (RT-QuIC) assay protocol to detect chronic wasting disease using rectal mucosa of naturally infected, pre-clinical white-tailed deer (Odocoileus virginianus)", "distribution": [ { "@type": "dcat:Distribution", "downloadURL": "https://ndownloader.figshare.com/files/43638531", "format": "xlsx", "mediaType": "application/vnd.openxmlformats-officedocument.spreadsheetml.sheet", "title": "RTQuIC_reactions.xlsx" }, { "@type": "dcat:Distribution", "downloadURL": "https://ndownloader.figshare.com/files/43762485", "format": "png", "mediaType": "image/png", "title": "S1 Fig 001.png" }, { "@type": "dcat:Distribution", "downloadURL": "https://ndownloader.figshare.com/files/43762488", "format": "png", "mediaType": "image/png", "title": "S1 Fig 002.png" }, { "@type": "dcat:Distribution", "downloadURL": "https://ndownloader.figshare.com/files/43762491", "format": "png", "mediaType": "image/png", "title": "S1 Fig 003.png" }, { "@type": "dcat:Distribution", "downloadURL": "https://ndownloader.figshare.com/files/43762494", "format": "png", "mediaType": "image/png", "title": "S1 Fig 004.png" }, { "@type": "dcat:Distribution", "downloadURL": "https://ndownloader.figshare.com/files/43762497", "format": "png", "mediaType": "image/png", "title": "S1 Fig 005.png" }, { "@type": "dcat:Distribution", "downloadURL": "https://ndownloader.figshare.com/files/43762500", "format": "png", "mediaType": "image/png", "title": "S1 Fig 006.png" }, { "@type": "dcat:Distribution", "downloadURL": "https://ndownloader.figshare.com/files/43762503", "format": "png", "mediaType": "image/png", "title": "S1 Fig 007.png" }, { "@type": "dcat:Distribution", "downloadURL": "https://ndownloader.figshare.com/files/43762506", "format": "png", "mediaType": "image/png", "title": "S1 Fig 008.png" }, { "@type": "dcat:Distribution", "downloadURL": "https://ndownloader.figshare.com/files/43762509", "format": "png", "mediaType": "image/png", "title": "S1 Fig 009.png" }, { "@type": "dcat:Distribution", "downloadURL": "https://ndownloader.figshare.com/files/43762512", "format": "png", "mediaType": "image/png", "title": "S1 Fig 010.png" }, { "@type": "dcat:Distribution", "downloadURL": "https://ndownloader.figshare.com/files/43762515", "format": "png", "mediaType": "image/png", "title": "S1 Fig 011.png" }, { "@type": "dcat:Distribution", "downloadURL": "https://ndownloader.figshare.com/files/43762518", "format": "png", "mediaType": "image/png", "title": "S1 Fig 012.png" }, { "@type": "dcat:Distribution", "downloadURL": "https://ndownloader.figshare.com/files/43762521", "format": "png", "mediaType": "image/png", "title": "S1 Fig 013.png" }, { "@type": "dcat:Distribution", "downloadURL": "https://ndownloader.figshare.com/files/43762524", "format": "png", "mediaType": "image/png", "title": "S1 Fig 014.png" }, { "@type": "dcat:Distribution", "downloadURL": "https://ndownloader.figshare.com/files/43762527", "format": "png", "mediaType": "image/png", "title": "S1 Fig 015.png" }, { "@type": "dcat:Distribution", "downloadURL": "https://ndownloader.figshare.com/files/43762530", "format": "png", "mediaType": "image/png", "title": "S1 Fig 016.png" }, { "@type": "dcat:Distribution", "downloadURL": "https://ndownloader.figshare.com/files/43762533", "format": "png", "mediaType": "image/png", "title": "S1 Fig 017.png" }, { "@type": "dcat:Distribution", "downloadURL": "https://ndownloader.figshare.com/files/43762536", "format": "png", "mediaType": "image/png", "title": "S1 Fig 018.png" }, { "@type": "dcat:Distribution", "downloadURL": "https://ndownloader.figshare.com/files/43762539", "format": "png", "mediaType": "image/png", "title": "S1 Fig 019.png" }, { "@type": "dcat:Distribution", "downloadURL": "https://ndownloader.figshare.com/files/43762542", "format": "png", "mediaType": "image/png", "title": "S1 Fig 020.png" }, { "@type": "dcat:Distribution", "downloadURL": "https://ndownloader.figshare.com/files/43762545", "format": "png", "mediaType": "image/png", "title": "S1 Fig 021.png" }, { "@type": "dcat:Distribution", "downloadURL": "https://ndownloader.figshare.com/files/43762548", "format": "png", "mediaType": "image/png", "title": "S1 Fig 022.png" }, { "@type": "dcat:Distribution", "downloadURL": "https://ndownloader.figshare.com/files/43762551", "format": "png", "mediaType": "image/png", "title": "S1 Fig 023.png" }, { "@type": "dcat:Distribution", "downloadURL": "https://ndownloader.figshare.com/files/43762554", "format": "png", "mediaType": "image/png", "title": "S1 Fig 024.png" }, { "@type": "dcat:Distribution", "downloadURL": "https://ndownloader.figshare.com/files/43762557", "format": "png", "mediaType": "image/png", "title": "S1 Fig 025.png" }, { "@type": "dcat:Distribution", "downloadURL": "https://ndownloader.figshare.com/files/43762560", "format": "png", "mediaType": "image/png", "title": "S1 Fig 026.png" }, { "@type": "dcat:Distribution", "downloadURL": "https://ndownloader.figshare.com/files/45289750", "format": "tif", "mediaType": "image/tiff", "title": "S2 Fig 1.tif" } ], "license": "https://creativecommons.org/publicdomain/zero/1.0/", "bureauCode": [ "005:18" ], "modified": "2024-06-17", "publisher": { "@type": "org:Organization", "name": "Agricultural Research Service" }, "keyword": [ "chronic wasting disease (CWD)", "cwd diagnosis", "prion aggregation formation assay", "Prions (PrPSc)", "white-tailed deer", "RT-QuIC assay", "RT-QuIC data", "Diagnostic accuracy research", "standardized protocol", "MNPROtein", "real-time quaking induced conversion", "Odocoileus virginianus", "rectal biopsy", "rectoanal mucosa-associated lymphoid tissue (RAMALT)", "recombinant prion protein" ] }, { "identifier": "10.15482/USDA.ADC/1329930", "accessLevel": "public", "contactPoint": { "hasEmail": "mailto:Keith.Hopper@ars.usda.gov", "fn": "Hopper, Keith" }, "programCode": [ "005:040" ], "description": "We measured genome sizes and determined the karyotypes of nine species of aphid parasitoids in the genus Aphelinus. We found large differences in genome size and karyotype between Aphelinus species, which is surprising given the similarity in their morphology and life history. Genome sizes estimated from flow cytometry were larger for species in the mali complex than those for the species in the daucicola and varipes complexes. Haploid karyotypes of the daucicola and mali complexes comprised five metacentric chromosomes of similar size, whereas those of the varipes complex had four chromosomes, including a larger and a smaller metacentric chromosome and two small acrocentric chromosomes or a large metacentric and three smaller acrocentric chromosomes. Total lengths of female haploid chromosome sets correlated with genome sizes estimated from flow cytometry. Phylogenetic analysis of karyotypic variation revealed a chromosomal fusion together with pericentric inversions in the common ancestor of the varipes complex and further pericentric inversions in the clade comprising Aphelinus kurdjumovi and Aphelinus hordei. Fluorescence in situ hybridization with a 28S ribosomal DNA probe revealed a single site on chromosomes of the haploid karyotype of Aphelinus coreae. The differences in genome size and total chromosome length between species complexes matched the phylogenetic divergence between them.
\nMaterials and Methods
\nSpecimens\nThe parasitoid species studied and the sources of the colonies are listed in the data file \"Aphelinus_species_studied.csv\". These colonies were reared on aphids at the USDA-ARS, Beneficial Insect Introductions Research Unit, in Newark, Delaware, USA. Females of the yellow-white strain of Drosophila melanogaster (Meigen, 1830) (stock number 1495, obtained from the Bloomington Drosophila Stock Center at Indiana University, http://flystocks.bio.indiana.edu) were used as internal controls for flow cytometry. All institutional and national guidelines for the care and use of laboratory animals were followed.
\nFlow cytometry\nLive Aphelinus were sexed, flash frozen in liquid nitrogen, and stored at −80°C. To estimate genome sizes, we used the flow cytometry protocol described by Hanrahan and Johnston (2011) and Hare and Johnston (2011). We dissected heads from both males and females of the Aphelinus species in cold Galbraith buffer (Galbraith et al. 1983). Heads of female D. melanogaster were used as internal standards (1C = 175 Mb or 0.17 pg). To release the nuclei from cells, 15 female Aphelinus heads and one female Drosophila head, were ground together in one milliliter of cold Galbraith buffer using 15 strokes of the \"A\" pestle in a 2-ml Kontes Dounce tissue grinder. Three to six replicates were done for females and males of each species, but because male genome sizes were too close to that of Drosophila, we used heads from females of the same parasitoid species as internal standards for males. The samples were passed through a 35 micron filter and then stained with 40 parts per million of propidium iodide in the dark for 3-5 hours at 4°C. Samples were analyzed on a Becton Dickinson FACSCalibur Flow Cytometer with laser excitation at 488 nm. Red fluorescence from the propidium iodide was detected using an FL2 filter. The haploid content of DNA in megabases (Mb) was calculated for each Aphelinus sample from the ratio of mean fluorescence of the sample to mean fluorescence of the standard times the genome size of the standard. We report genome size estimates in megabases, but also give estimates in picograms (pg) calculated by dividing the amount of DNA in Mb by the standard 1C value of 978 Mb.
\nKaryotypes\nChromosome preparations were made from cerebral ganglia of prepupae using a modified version of the technique in Imai et al. (1988). Wasps were dissected in 0.5% hypotonic sodium citrate solution containing 0.005% colchicine, and the tissues were incubated in fresh solution for ~30 minutes at room temperature. The material was transferred to a pre-cleaned microscope slide using a Pasteur pipette and gently flushed with Fixative I (glacial acetic acid: absolute ethanol: distilled water 3:3:4). Tissues were disrupted in an additional drop of Fixative I using dissecting needles. Another drop of Fixative II (glacial acetic acid: absolute ethanol 1:1) was then applied to the center of the area and blotted off the edges of the slide. The slide was air dried for ~30 minutes at room temperature. For conventional staining, preparations were stained with freshly prepared 3% Giemsa solution in 0.05M Sørensen's phosphate buffer (Na2HPO4 + KH2PO4, pH 6.8). Mitotic divisions were studied and photographed using an optic microscope Zeiss Axioskop 40 FL fitted with a digital camera AxioCam MRc (Carl Zeiss, Oberkochen, Germany). To obtain karyograms, the resulting images were processed with image analysis programs: Zeiss AxioVision version 3.1 and Adobe Photoshop version 8.0. Mitotic chromosomes were measured for 5-19 cells in 1-4 wasps per species using Adobe Photoshop. We report total length of all chromosomes in each karyotype; for diploid sets, we divided total length by two to make the values comparable to haploid sets. We also report relative lengths (RL; 100 x length of each chromosome divided by total length of the set) and centromeric indices (CI; 100 x length of shorter arm divided by total length of a chromosome). Chromosomes were classified into metacentric (M) or acrocentric (A) according to the guidelines in Levan et al. (1964).
Resource Title: Collection locations and years for Aphelinus species studied.
File Name: Aphelinus_species_studied.csv
Resource Description: Fields are species complex, species, authority (last name, year published), collection year, and collection country.
Resource Title: Genome sizes of Aphelinus species estimated using flow cytometry.
File Name: Aphelinus_flow_cytometry_genome_sizes.csv
Resource Description: Fields are species complex, species, sex, genome size (Mbases).
Resource Title: Total lengths of chromosome sets for Aphelinus species.
File Name: Aphelinus_karyotypes_total_lengths.csv
Resource Description: Fields are species complex, species, individual wasp ID, cell ID for metaphase chromosome set, and total length of chromosome set in µm.
Resource Title: Relative lengths and centromeric indices for chromosomes of Aphelinus species.
File Name: Aphelinus_karyotypes_relative_length_centromeric_index.csv
Resource Description: Fields are species complex, species, chromosome, wasp ID, cell ID for metaphase set, relative length as percent of total length, length of shorter arm to centromere as percent of chromosome length.
The data is in csv format. It contains the plant averages for all data presented in the published manuscript 'Variations in Phytochemical Content and Composition in Distillers Corn Oil from 30 U.S. Ethanol Plants'. The analytical replications vary by test type, and are specified in the published paper.
Resource Title: dataset from: Variations in Phytochemical Content and Composition in Distillers Corn Oil from 30 U.S. Ethanol Plants .
File Name: DCO oil analysis.csv
Resource Description: this is the csv file
The dataset includes 30 minutes values of partitioned evaporation (E) and transpiration (T), T:ET ratios, and other ancillary datasets for three ET partitioning methods viz. Flux Variance Similarity (FVS) method, Transpiration Estimation Algorithm (TEA), and Underlying Water Use Efficiency (uWUE) method for three wheat sites. Three wheat sites had different grazing treatments. For example, Site 1 was Grain-only and Graze-grain wheat for the 2016-17 and 2017-18 growing seasons, respectively. Site 2 was Grain-only wheat for the 2017-18 growing season. Site 3 was Graze-grain and Graze-out wheat for the 2016-17 and 2017-18 growing seasons, respectively.
\nThe grain-only wheat system is a single purpose to produce wheat grains only. Graze-grain wheat system has a dual purpose as it serves as a pasture for grazing cattle from November to February and is used to produce wheat grains later. Graze-out wheat system is also a single purpose crop that is grazed by the cattle for the entire season to solely serve as a pasture.
\nFVS method performed ET partitioning using the high frequency (10 Hz) data collected from Eddy Covariance Flux stations, located near the middle of each field. The high-frequency data were also processed using the EddyPro software to get good quality estimates of different fluxes at 30-minute intervals. The processed 30-min data were used by TEA and uWUE methods for ET partitioning. Ancillary hydro-meteorological variables including net radiation, air temperature, soil water content, relative humidity, and others, also have been included in this dataset.
\nThe study sites were located at the United States Department of Agriculture, Agricultural Research Service (USDA-ARS), Grazinglands Research Laboratory, El Reno, Oklahoma. All sites were rainfed.
Resource Title: FVS output and other met data and site info.
File Name: FVS_output_and_other_met_data_and_site_info.xlsx
Resource Description: Output of FVS model along with corresponding meteorological data and site metadata.
Resource Title: TEA output.
File Name: TEA_output.xlsx
Resource Description: Out from TEA model along with site metadata.
Resource Title: WUE output.
File Name: uWUE_output.xlsx
Resource Description: Output of WUE model run along with site metadata.
The dataset includes 30 minutes values of partitioned evaporation (E) and transpiration (T), T:ET ratios, and other ancillary datasets for three ET partitioning methods viz. Flux Variance Similarity (FVS) method, Transpiration Estimation Algorithm (TEA), and Underlying Water Use Efficiency (uWUE) method for three wheat sites. Three wheat sites had different grazing treatments. For example, Site 1 was Grain-only and Graze-grain wheat for the 2016-17 and 2017-18 growing seasons, respectively. Site 2 was Grain-only wheat for the 2017-18 growing season. Site 3 was Graze-grain and Graze-out wheat for the 2016-17 and 2017-18 growing seasons, respectively.
\nThe grain-only wheat system is a single purpose to produce wheat grains only. Graze-grain wheat system has a dual purpose as it serves as a pasture for grazing cattle from November to February and is used to produce wheat grains later. Graze-out wheat system is also a single purpose crop that is grazed by the cattle for the entire season to solely serve as a pasture.
\nFVS method performed ET partitioning using the high frequency (10 Hz) data collected from Eddy Covariance Flux stations, located near the middle of each field. The high-frequency data were also processed using the EddyPro software to get good quality estimates of different fluxes at 30-minute intervals. The processed 30-min data were used by TEA and uWUE methods for ET partitioning. Ancillary hydro-meteorological variables including net radiation, air temperature, soil water content, relative humidity, and others, also have been included in this dataset.\nThe study sites were located at the United States Department of Agriculture, Agricultural Research Service (USDA-ARS), Grazinglands Research Laboratory, El Reno, Oklahoma. All sites were rainfed.
Resource Title: FVS output and other met data and site info.
File Name: FVS_output_and_other_met_data_and_site_info.xlsx
Resource Description: Output of FVS model along with corresponding meteorological data and site metadata.
Resource Title: TEA output.
File Name: TEA_output.xlsx
Resource Description: Out from TEA model along with site metadata.
Resource Title: WUE output.
File Name: uWUE_output.xlsx
Resource Description: Output of WUE model run along with site metadata.
The effectiveness of vegetative buffer strips (VBS) for reducing herbicide transport has not been well documented for runoff prone soils. A multi‐year plot‐scale study was conducted on an eroded claypan soil with the following objectives: (1) assess the effects of buffer width, vegetation, and season on runoff transport of atrazine (ATR), metolachlor (MET), and glyphosate; (2) develop VBS design criteria for herbicides; and (3) compare differences in soil quality among vegetation treatments. Rainfall simulation was used to create uniform antecedent soil water content and to generate runoff. Vegetation treatment and buffer width impacted herbicide loads much more than season. Grass treatments reduced herbicide loads by 19‐28% and sediment loads by 67% compared to the control. Grass treatments increased retention of dissolved‐phase herbicides by both infiltration and adsorption, but adsorption accounted for the greatest proportion of retained herbicide load. This latter finding indicated VBS can be effective on poorly drained soils or when the source to buffer area ratio is high. Grass treatments modestly improved surface soil quality 8‐13 years after establishment, with significant increases in organic C, total N, and ATR and MET sorption compared to continuously tilled control. Herbicide loads as a function of buffer width were well described by first‐order decay models which indicated VBS can provide significant load reductions under anticipated field conditions.
Resource Title: Supplemental Material: Main factor interaction effects on runoff (flow depth), herbicide and sediment loads, and dissolved‐phase herbicide retention - Download docx.
File Name: downloadSupplement, url: https://onlinelibrary.wiley.com/action/downloadSupplement?doi=10.1111/1752-1688.12526&file=jawr12526-sup-0001-Supinfo.docx
Table S1. The effect of vegetation and buffer width on runoff depth.\nTable S2. The effect of vegetation and buffer width on input normalized atrazine, metolachlor, glyphosate, and sediment loads.\nTable S3. Vegetation by season interactions for input normalized atrazine and metolachlor loads.\nTable S4. The effect of vegetation and buffer width on reductions in dissolved-phase herbicide loads by infiltration and adsorption.\nFigure S1. Effect of vegetation treatment and buffer width on herbicide and sediment input normalized loads, illustrating the significant vegetation by width interaction for all four contaminants.\n
Culicoides sonorensis biting midges are well-known agricultural pests and transmission vectors of arboviruses such as vesicular stomatitis virus (VSV). The epidemiology of VSV is complex and encompasses a broad range of vertebrate hosts, multiple routes of transmission, and diverse vector species. In temperate regions, viruses can overwinter in the absence of infected animals through unknown mechanisms, to reoccur the next year. Non-conventional routes for VSV vector transmission may help explain viral maintenance in midge populations during inter-epidemic periods and times of adverse conditions for bite transmission. In this study, we examined whether VSV could be transmitted venereally between male and female midges. Our results showed that VSV-infected females could venereally transmit virus to uninfected naïve males at a rate as high as 76.3% (RT-qPCR), 31.6% (virus isolation) during the third gonotrophic cycle. Additionally, VSV-infected males could venereally transmit virus to uninfected naïve females at a rate as high as 76.6% (RT-qPCR), 49.2% (virus isolation). Immunofluorescent staining of micro-dissected reproductive organs, immunochemical staining of midge histological sections, examination of internal reproductive organ morphology, and observations of mating behaviors were used to determine relevant anatomical sites for virus location and to hypothesize the potential mechanism for VSV transmission in C. sonorensis midges through copulation.
", "title": "Data from: Venereal Transmission of Vesicular Stomatitis Virus by Culicoides sonorensis Midges", "distribution": [ { "@type": "dcat:Distribution", "downloadURL": "https://ndownloader.figshare.com/files/44073167", "format": "csv", "mediaType": "text/plain", "title": "RT_qPCR data Fig2a.csv" }, { "@type": "dcat:Distribution", "downloadURL": "https://ndownloader.figshare.com/files/44073173", "format": "csv", "mediaType": "text/plain", "title": "RT_qPCR data Fig2b.csv" }, { "@type": "dcat:Distribution", "downloadURL": "https://ndownloader.figshare.com/files/44073164", "format": "csv", "mediaType": "text/plain", "title": "RT_qPCR data Fig3.csv" }, { "@type": "dcat:Distribution", "downloadURL": "https://ndownloader.figshare.com/files/44073170", "format": "csv", "mediaType": "text/plain", "title": "RT_qPCR data Fig4.csv" } ], "license": "https://creativecommons.org/publicdomain/zero/1.0/", "bureauCode": [ "005:18" ], "modified": "2024-01-30", "publisher": { "@type": "org:Organization", "name": "Agricultural Research Service" }, "keyword": [ "vesicular stomatitis virus", "Culicoides midges", "non-conventional transmission", "venereal transmission", "reproductive anatomy", "mating behavior" ] }, { "identifier": "10.15482/USDA.ADC/1529428", "accessLevel": "public", "contactPoint": { "hasEmail": "mailto:rswab@holdenfg.org", "fn": "Swab, Rebecca M." }, "programCode": [ "005:040" ], "description": "Pollinator and flowering plant surveys were conducted in three mineland reclamation sites in southeast Ohio during 2019. Floral abundance, floral richness, floral evenness, pollinator richness, and pollinator Shannon’s diversity were calculated from these surveys and counts of individual taxa are also included in the dataset. The sampling month (June, July, August, or September) and seeding treatment (Traditional, Native Light, or Native heavy) were also recorded. Sites were privately owned abandoned mine lands and had variable soil conditions, area, seeding dates, and other minor factors, all detailed in Swab et al (2017). Three plots of 0.4 ha were established at each site. Two plots were revegetated with an experimental native prairie seed mix comprised of both non-native species typically used in reclamation, as well as native species including Panicum virgatum, Sorghastrum nutans, Chamaecrista fasciculata, Coreopsis tinctoria, Rudbeckia triloba, Helianthus maximiliani, and Asclepias syriaca, as well as nonnatives Lotus corniculatus, Lolium perenne, and Dactylis glomerata as insurance, at 16.81 kg ha-1 (Native Light) and 33.63 kg ha-1 (Native Heavy) rates. The other plot was revegetated with a non-native mix frequently used in the reclamation of mine lands in Ohio (Traditional), with a seeding rate of 33.63 kg ha-1. Each site was sampled four times from June-September 2019 on warm (21-32°C) days with no rainfall and ≤ 4.0 m/s winds. One site was sampled per day and subsequent sampling events at each site were approximately 4 weeks apart. Within each plot, 25-m transects were established from a central point, choosing direction with a random number generator. One transect per plot was surveyed per round (early morning, late-morning, and afternoon) a total of three per plot. The counts of pollinators and floral units, respectively, were summed by taxa across quadrats and six-minute walks for each plot by sampling session combination (n = 36). To account for blocking by site, plots nested within sites, and repeated measures on plots, random intercepts of site, plot, and interaction of site and plot were included, despite zero variances, in all univariate models.
\nResources in this dataset:
\nResource title: Data Dictionary\nFile name: Data Dictionary_Pollinators NIR.csv
\nResource title: Natives in Reclamation Pollinator Dataset\nFile name: Pollinator_NIR_Data (FIXED).csv\nResource description: Diversity indices and counts of pollinator and flowering plants in reclaimed minelands in 2019. Seeding treatments were typical seed mix with a seeding density of 33.63 kg ha-1 (traditional), the typical plant species plus natives (Panicum virgatum, Sorghastrum nutans, Chamaecrista fasciculata, Coreopsis tinctoria, Rudbeckia triloba, Helianthus maximiliani, and Asclepias syriaca, as well as nonnatives Lotus corniculatus, Lolium perenne, and Dactylis glomerata) at 16.81 kg ha-1 (Native Light), and typical plant species plus natives at a higher density at 33.63 kg ha-1 (Native Heavy).
\nPhytophthora rubi and P. fragariae are two closely related soil-borne oomycete plant pathogens that exhibit strong morphological and physiological similarities but are specialized to infect different hosts of economic importance, namely, raspberry and strawberry. Here, we report the draft genome sequences of these two Phytophthora species as a first step toward understanding the genomic processes underlying plant host adaptation in these pathogens.
Resource Title: Whole Genome Sequences of the Raspberry and Strawberry Pathogens Phytophthora rubi and P. fragariae.
File Name: Web Page, url: https://doi.org/10.1094/MPMI-04-17-0081-A
Data links from the paper can be found in the related content section of this record.
The complete genome sequence data of S. aureus SJTUF_J27 isolated from seaweed in China is reported here. The size of the genome is 2.8 Mbp with 32.9% G+C content, consisting of 2614 coding sequences and 77 RNAs. A number of virulence factors, including antimicrobial resistance genes (fluoroquinolone, beta-lactams, fosfomycin, mupirocin, trimethoprim, and aminocoumarin) and the egc enterotoxin cluster, were found in the genome. In addition, the genes encoding metal-binding proteins and associated heavy metal resistance were identified. Phylogenetic data analysis, based upon genome-wide single nucleotide polymorphisms (SNPs), and comparative genomic evaluation with BLAST Ring Image Generator (BRIG) were performed for SJTUF_J27 and four S. aureus strains isolated from food. The completed genome data was deposited in NCBI's GenBank under the accession number CP019117, https://www.ncbi.nlm.nih.gov/nuccore/CP019117.
Resource Title: NCBI GenBank Accession CP019117.1: Staphylococcus aureus strain SJTUF_J27 chromosome, complete genome.
File Name: Web Page, url: https://www.ncbi.nlm.nih.gov/nuccore/CP019117
With an average of 331-fold sequencing coverage, a genome size of 2,804,759 bp constituting 32.9% of G+C content was generated. RAST annotation of the genome revealed a total of 399 subsystems, 2614 coding sequences (80 of them related to virulence, disease and defense), and 77 RNAs. PathogenFinder showed the probability of this strain being a human pathogen was 98%. Bacteria and source DNA available from Xianming Shi, 800 Dongchuan Road, Shanghai, China, 200240. Annotation was added by the NCBI Prokaryotic Genome Annotation Pipeline (released 2013).
Data and code for \"Cover crop inclusion and residue retention improves soybean production and physiology in drought conditions\"
\nCONTEXT: Soybean (Glycine max (L.) Merr.) planting has increased in central and western North Dakota despite frequent drought occurrences that limit productivity. Soybean plants need high photosynthetic and transpiration rates to be productive, but they also need high water use efficiency when water is limited. Retaining crop residues and including cover crops in crop rotations are management strategies that could improve soybean drought resilience in the northern Great Plains.
\nOBJECTIVE: We aimed to examine how a management practice that included cover crops and residue retention impacts agronomic, ecosystem water and carbon dioxide flux, and canopy-scale physiological attributes of soybeans in the northern Great Plains under drought conditions.
\nMETHODS: We compared two soybean fields over two years with business-as-usual and aspirational management that included residue retention and cover crops during a drought year. This comparison was based on yield, aboveground biomass, Phenocam images, and fluxes from eddy covariance and ancillary measurements. These measurements were used to derive meteorological, physical, and physiological attributes with the ‘big leaf’ framework.
\nRESULTS: Soybean yields were 29% higher under drought conditions in the field managed in a system that included cover crops and residue retention. This yield increase was caused by extending the maturity phenophase by 5 days, increasing agronomic and intrinsic water use efficiency by 27% and 33%, respectively, increasing water uptake, and increasing the rubisco-limited photosynthetic capacity (Vcmax25) by 42%.
\nCONCLUSIONS: The inclusion of cover crops and residue retention into a cropping system improved soybean productivity because of differences in water use, phenology timing, and photosynthetic capacity.
\nIMPLICATIONS: These results suggest that farmers can improve soybean productivity and yield stability by incorporating cover crops and residue retention into their management practices because these practices allow soybean plants to shift to a more aggressive water uptake strategy.
\nData\nHalf_Hourly.csv: Half hour data from eddy covariance towers
\nManagement.csv: data about field management
\nPhenocamdata.csv: The output of 1_phenocam.Rmd code
\nPredicted_Height_LAI.csv: The output of 3_Inferring_LAI_and_Height.Rmd
\nVegetation.csv: biomass and yield data
\nCode\n1_phenocam.rmd: Code to download Phenocam data and identify phenophase transition dates.
\n2_Daily_CO2_Water_Fluxes.Rmd: Code to analyze daily carbon and water fluxes (Figure 1, 2 3 and Table 2).
\n3_Inferring_LAI_and_Height.Rmd: Code to calculate the predicted LAI and height for each day. The output is used in the big-leaf framework.
\n4_Big_Leaf.Rmd: Code for the big-leaf ecophysiology estimates (Figure 4, 5 and 6; Table 3 and 4).
\n4_Data_Dictionary_Variables: Code to identify the data dictionary variables.
", "title": "Dataset for \"Cover crop inclusion and residue retention improves soybean production and physiology in drought conditions\"", "distribution": [ { "@type": "dcat:Distribution", "downloadURL": "https://zenodo.org/record/8335085", "mediaType": "text/html", "title": "https://zenodo.org/record/8335085" } ], "license": "https://www.usa.gov/publicdomain/label/1.0/", "bureauCode": [ "005:18" ], "modified": "2024-02-15", "publisher": { "@type": "org:Organization", "name": "Agricultural Research Service" }, "accrualPeriodicity": "R/PT1S", "keyword": [ "big leaf", "Drought stress", "soybean", "Management Practices", "Northern Great Plains", "NP216", "data.gov", "ARS" ], "spatial": "{\"type\": \"MultiPoint\", \"coordinates\": [[-100.95109, 46.775423], [-100.9257, 46.7614]]}" }, { "identifier": "10.15482/USDA.ADC/1471685", "accessLevel": "public", "contactPoint": { "hasEmail": "mailto:Erin.Scully@ars.usda.gov", "fn": "Scully, Erin" }, "programCode": [ "005:040" ], "description": "To study the impact of wheat streak mosaic virus on global gene expression in wheat curl mite, we generated a de novo transcriptome assembly using 50 x 50 paired end reads from the Illumina HiSeq 2500. Reads were assembled using Trinity (version 2.0.6) and contigs greater than 200 nt were retained. All assembled transcripts were annotated using the Trinotate pipeline using blastp searches against the Swiss-prot/Uni-Prot database, blastx searches against the Swiss-prot/Uni-Prot databases, HMM searches against the Pfam-A database, blastp searches against the non-redundant protein database, and signalP and tmHMM predictions. To reduce noise from low abundance transcripts not well supported by the data, we filtered the assembly to retain only those transcripts with TPM values >=0.5.
Resource Title: Raw Trinity Assembly.
File Name: Trinity.fasta.txt
Resource Description: Raw trinity assembly obtained from wheat curl mite using 50 x 50 Illumina paired end reads from the HiSeq2500.
Resource Software Recommended: Notepad++,url: https://notepad-plus-plus.org/
Resource Title: Raw Trinity Assembly.
File Name: Trinity.fasta.txt
Resource Description: Raw trinity assembly obtained from wheat curl mite using 50 x 50 Illumina paired end reads from the HiSeq2500.
Resource Software Recommended: Text wrangler,url: https://itunes.apple.com/us/app/textwrangler/id404010395?mt=12
Resource Title: Trinotate annotations for raw Trinity assembly.
File Name: trinotate_annotations_report.xls
Resource Description: Trinotate results for raw wheat curl mite transcriptome assembly
Resource Software Recommended: Excel,url: https://products.office.com/en-us/excel
Resource Title: Trinotate annotations for raw Trinity assembly.
File Name: trinotate_annotations_report.xls
Resource Description: Trinotate results for raw wheat curl mite transcriptome assembly
Resource Software Recommended: Libre Office Calc,url: https://www.libreoffice.org/discover/calc/
Resource Title: Blastp results versus non-redundant protein database.
File Name: wheat_curl_mite_blastp_nr.txt
Resource Description: Blastp results for protein coding unigenes from raw Trinity transcriptome assembly (wheat curl mite). Output format is default.
Resource Software Recommended: Notepad++,url: https://notepad-plus-plus.org/
Resource Title: Blastp results versus non-redundant protein database.
File Name: wheat_curl_mite_blastpnr.txt
Resource Description: Blastp results for protein coding unigenes from raw Trinity transcriptome assembly (wheat curl mite). Output format is default.
Resource Software Recommended: Text wrangler,url: https://itunes.apple.com/us/app/textwrangler/id404010395?mt=12
Resource Title: Protein predictions for raw trinity transcriptome assembly (wheat curl mite).
File Name: transcriptome.all.cds.pep.fasta.txt
Resource Description: Putative coding regions were predicted using Transdecoder. Default parameters were used in conjunction with Pfam-A searches to identify putative open reading frames (ORFs).
Resource Title: Protein predictions for final transcriptome assembly (wheat curl mite).
File Name: transcriptome.all.cds.pep.fasta.txt
Resource Description: Protein coding regions were predicted using Transdecoder. ORFs were identified using default parameters in conjunction with Pfam-A searches.
Resource Software Recommended: Notepad++,url: https://notepad-plus-plus.org/
Resource Title: Protein predictions for final transcriptome assembly (wheat curl mite).
File Name: transcriptome.all.cds.pep.fasta.txt
Resource Description: Protein coding regions were predicted using Transdecoder. ORFs were identified using default parameters in conjunction with Pfam-A searches.
Resource Software Recommended: Text wrangler,url: https://itunes.apple.com/us/app/textwrangler/id404010395?mt=12
Resource Title: Final trinity transcriptome assembly for wheat curl mite.
File Name: Trinity.mite.fasta.txt
Resource Description: Transcripts less than 200 nt and transcripts with TPM values less than 0.5 were removed from the assembly. In addition, transcripts whose coding sequences had highest scoring blastp matches to microbes were also removed from the assembly.
Resource Title: Nucleotide coding regions for final transcriptome assembly for wheat curl mite.
File Name: transcriptome.mite.cds.fasta.txt
Resource Description: Nucleotide sequences corresponding to coding regions from the final transcriptome assembly for wheat curl mite. Open reading frames (ORFs) were predicted using transdecoder. Default parameters with the addition of the identification of Pfam-A domains was used for ORF identification.
Resource Title: Trinotate annotations for final Trinity assembly (wheat curl mite).
File Name: trinotate.mite.xls
Resource Description: Trinotate results for final wheat curl mite transcritpome assembly. Blastp and blastx searches against Swiss-Prot/Uni-Prot were performed along with Pfam-A searches using HMMER. Signal peptides and transmembrane domains were also identified.
Resource Software Recommended: Excel,url: https://products.office.com/en-us/excel
Resource Title: Trinotate annotations for final Trinity assembly (wheat curl mite).
File Name: trinotate.mite.xls
Resource Description: Trinotate results for final wheat curl mite transcritpome assembly. Blastp and blastx searches against Swiss-Prot/Uni-Prot were performed along with Pfam-A searches using HMMER. Signal peptides and transmembrane domains were also identified.
Resource Software Recommended: Libre Office Calc,url: https://www.libreoffice.org/discover/calc/
Transcriptome was generated from pooled adult aphids that were fed on wheat plants containing the Dn4 and DN7 resistance gene as well as Yuma plants containing no resistant genes (Dn0). The assembly was generated using Trinity. All assembled transcripts, including those that were not predicted to encode ORFs, are included along with their corresponding functional annotations from Trinotate.
Resource Title: De novo transcriptome assembly of Schizaphis graminum Biotype I.
File Name: Trinity.fasta_.txt
Resource Description: Reads were assembled using Trinity version 2.3.2. All transcripts greater than 200 nt were retained in this version of the assembly.
Resource Software Recommended: Notepad++,url: https://notepad-plus-plus.org/
Resource Title: Filtered Transcriptome Assembly of Schizaphis graminum.
File Name: GreenbugFilteredTrinity.transdecoder.mRNA.fasta_.txt
Resource Description: Only transcripts with transcripts per million mapped reads values (TPM) >=0.05 and transcripts whose expression levels represented >=10% of their dominant isoform were retained for differential expression.
Resource Software Recommended: Notepad++,url: https://notepad-plus-plus.org/
Resource Title: Trinotate results for Schizaphis graminum transcriptome assembly.
File Name: Greenbug_trinotate_annotation_report.xls
Resource Description: Trinotate was used to obtain highest scoring blastp matches to annotated proteins curated in the swiss-prot, detect Pfam domains, obtain gene ontology annotations, and obtain KEGG annotations.
Resource Software Recommended: Microsoft Excel,url: https://products.office.com/en-us/excel
Resource Title: Protein coding translations of Schizaphis graminum assembly.
File Name: Greenbug_FilteredTrinityfastafromTrial6.sh.o2516954.fasta.transdecoder.pep.txt
Resource Description: TransDecoder was used to predict open reading frames in the final transcriptome assembly.
Resource Software Recommended: Notepad++,url: https://notepad-plus-plus.org/
The Delta Food Outlets Study was an observational study designed to assess the nutritional environments of 5 towns located in the Lower Mississippi Delta region of Mississippi. It was an ancillary study to the Delta Healthy Sprouts Project and therefore included towns in which Delta Healthy Sprouts participants resided and that contained at least one convenience (corner) store, grocery store, or gas station. Data were collected via electronic surveys between March 2016 and September 2018 using the Nutrition Environment Measures Survey (NEMS) tools. Survey scores for the NEMS Corner Store, NEMS Grocery Store, and NEMS Restaurant were computed using modified scoring algorithms provided for these tools via SAS software programming. Because the towns were not randomly selected and the sample sizes are relatively small, the data may not be generalizable to all rural towns in the Lower Mississippi Delta region of Mississippi.
\nDataset one (NEMS-C) contains data collected with the NEMS Corner (convenience) Store tool.\nDataset two (NEMS-G) contains data collected with the NEMS Grocery Store tool.\nDataset three (NEMS-R) contains data collected with the NEMS Restaurant tool.
\nResource Title: Delta Food Outlets Data Dictionary.
File Name: DFO_DataDictionary_Public.csv
Resource Description: This file contains the data dictionary for all 3 datasets that are part of the Delta Food Outlets Study.
Resource Software Recommended: Microsoft Excel,url: https://products.office.com/en-us/excel
Resource Title: Dataset One NEMS-C.
File Name: NEMS-C Data.csv
Resource Description: This file contains data collected with the Nutrition Environment Measures Survey (NEMS) tool for convenience stores.
Resource Software Recommended: Microsoft Excel,url: https://products.office.com/en-us/excel
Resource Title: Dataset Two NEMS-G.
File Name: NEMS-G Data.csv
Resource Description: This file contains data collected with the Nutrition Environment Measures Survey (NEMS) tool for grocery stores.
Resource Software Recommended: Microsoft Excel,url: https://products.office.com/en-us/excel
Resource Title: Dataset Three NEMS-R.
File Name: NEMS-R Data.csv
Resource Description: This file contains data collected with the Nutrition Environment Measures Survey (NEMS) tool for restaurants.
Resource Software Recommended: Microsoft Excel,url: https://products.office.com/en-us/excel
The Delta Neighborhood Physical Activity Study was an observational study designed to assess characteristics of neighborhood built environments associated with physical activity. It was an ancillary study to the Delta Healthy Sprouts Project and therefore included towns and neighborhoods in which Delta Healthy Sprouts participants resided. The 12 towns were located in the Lower Mississippi Delta region of Mississippi. Data were collected via electronic surveys between August 2016 and September 2017 using the Rural Active Living Assessment (RALA) tools and the Community Park Audit Tool (CPAT). Scale scores for the RALA Programs and Policies Assessment and the Town-Wide Assessment were computed using the scoring algorithms provided for these tools via SAS software programming. The Street Segment Assessment and CPAT do not have associated scoring algorithms and therefore no scores are provided for them. Because the towns were not randomly selected and the sample size is small, the data may not be generalizable to all rural towns in the Lower Mississippi Delta region of Mississippi.
\nDataset one contains data collected with the RALA Programs and Policies Assessment (PPA) tool.\nDataset two contains data collected with the RALA Town-Wide Assessment (TWA) tool.\nDataset three contains data collected with the RALA Street Segment Assessment (SSA) tool.\nDataset four contains data collected with the Community Park Audit Tool (CPAT).
\n[Note : title changed 9/4/2020 to reflect study name]
Resource Title: Dataset One RALA PPA Data Dictionary.
File Name: RALA PPA Data Dictionary.csv
Resource Description: Data dictionary for dataset one collected using the RALA PPA tool.
Resource Software Recommended: Microsoft Excel,url: https://products.office.com/en-us/excel
Resource Title: Dataset Two RALA TWA Data Dictionary.
File Name: RALA TWA Data Dictionary.csv
Resource Description: Data dictionary for dataset two collected using the RALA TWA tool.
Resource Software Recommended: Microsoft Excel,url: https://products.office.com/en-us/excel
Resource Title: Dataset Three RALA SSA Data Dictionary.
File Name: RALA SSA Data Dictionary.csv
Resource Description: Data dictionary for dataset three collected using the RALA SSA tool.
Resource Software Recommended: Microsoft Excel,url: https://products.office.com/en-us/excel
Resource Title: Dataset Four CPAT Data Dictionary.
File Name: CPAT Data Dictionary.csv
Resource Description: Data dictionary for dataset four collected using the CPAT.
Resource Software Recommended: Microsoft Excel,url: https://products.office.com/en-us/excel
Resource Title: Dataset One RALA PPA.
File Name: RALA PPA Data.csv
Resource Description: Data collected using the RALA PPA tool.
Resource Software Recommended: Microsoft Excel,url: https://products.office.com/en-us/excel
Resource Title: Dataset Two RALA TWA.
File Name: RALA TWA Data.csv
Resource Description: Data collected using the RALA TWA tool.
Resource Software Recommended: Microsoft Excel,url: https://products.office.com/en-us/excel
Resource Title: Dataset Three RALA SSA.
File Name: RALA SSA Data.csv
Resource Description: Data collected using the RALA SSA tool.
Resource Software Recommended: Microsoft Excel,url: https://products.office.com/en-us/excel
Resource Title: Dataset Four CPAT.
File Name: CPAT Data.csv
Resource Description: Data collected using the CPAT.
Resource Software Recommended: Microsoft Excel,url: https://products.office.com/en-us/excel
Resource Title: Data Dictionary.
File Name: DataDictionary_RALA_PPA_SSA_TWA_CPAT.csv
Resource Description: This is a combined data dictionary from each of the 4 dataset files in this set.
The Delta Produce Sources Study was an observational study designed to measure and compare food environments of farmers markets (n=3) and grocery stores (n=12) in 5 rural towns located in the Lower Mississippi Delta region of Mississippi. Data were collected via electronic surveys from June 2019 to March 2020 using a modified version of the Nutrition Environment Measures Survey (NEMS) Farmers Market Audit tool. The tool was modified to collect information pertaining to source of fresh produce and also for use with both farmers markets and grocery stores. Availability, source, quality, and price information were collected and compared between farmers markets and grocery stores for 13 fresh fruits and 32 fresh vegetables via SAS software programming. Because the towns were not randomly selected and the sample sizes are relatively small, the data may not be generalizable to all rural towns in the Lower Mississippi Delta region of Mississippi.
Resource Title: Delta Produce Sources Study dataset .
File Name: DPS Data Public.csv
Resource Description: The dataset contains variables corresponding to availability, source (country, state and town if country is the United States), quality, and price (by weight or volume) of 13 fresh fruits and 32 fresh vegetables sold in farmers markets and grocery stores located in 5 Lower Mississippi Delta towns.
Resource Software Recommended: Microsoft Excel,url: https://www.microsoft.com/en-us/microsoft-365/excel
Resource Title: Delta Produce Sources Study data dictionary.
File Name: DPS Data Dictionary Public.csv
Resource Description: This file is the data dictionary corresponding to the Delta Produce Sources Study dataset.
Resource Software Recommended: Microsoft Excel,url: https://www.microsoft.com/en-us/microsoft-365/excel
DepositScan is a scanning program that can quickly evaluate spray deposit distribution on water sensitive paper or Kromekote cards. The program consists of a set of custom plugins that are used by an image-processing program to produce a number of measurements useful for expressing spray deposit distribution. The DepositScan program offers a convenient solution for on-the-spot evaluation of spray quality even under field working conditions.
\nTo download and install the DepositScan software:
\n
\n
Refer to the DepositScanManual.pdf in the DepositScan folder for guidance in setting up your scanner and using DepositScan.
\nUpdate 12/4/2009:
\nWe have added ExtractResults_v1.1, a tool for consolidating output files of the DepositScan program. Refer to the ExtractResults Manual provided for assistance in using the program.
Resource Title: DepositScan.
File Name: Web Page, url: https://www.ars.usda.gov/research/software/download/?softwareid=247&modecode=50-82-05-00
download page
These are data on variation in host specificity and genetics among 16 populations of an aphid parasitoid, Aphelinus certus, 15 from Asia and one from North America. Host range was the same for all the parasitoid populations, but levels of parasitism varied among aphid species, suggesting adaptation to locally abundant aphids. Differences in host specificity did not correlate with geographical distances among parasitoid populations, suggesting that local adaption is mosaic rather than clinal, with a spatial scale of less than 50 kilometers. Analysis of reduced representation libraries for each population showed genetic differentiation among them. Differences in host specificity correlated with genetic distances among the parasitoid populations.
Resource Title: data dictionary for Aphelinus certus population variation.
File Name: data_dictionary_Aphelinus_certus.csv
Resource Description: This is the data dictionary for the other files (Aphelinus_certus_host_use.csv, Aphelinus_certus_culture_data.csv) in this project.
Resource Title: Host specificity of Aphelinus certus populations.
File Name: Aphelinus_certus_host_use.csv
Resource Description: Results of no-choice experiments in the laboratory on parasitism, adult emergence rate, and progeny sex ratio for 15 populations of Aphelinus certus from China, Japan, and South Korea and one population from the US.
Resource Title: Culture data for Aphelinus certus populations.
File Name: Aphelinus_certus_culture_data.csv
Resource Description: This file gives data on the locations, dates, founding numbers, and collectors for the populations of Aphelinus certus studied in this project.
Resource Title: Fst and host use distances among populations of Aphelinus certus.
File Name: A_certus_Fst_host_dist.csv
Resource Description: We used next-generation sequencing of reduced-representation genomic libraries to genotype single nucleotide polymorphisms (SNPs) among the 16 A. certus populations. Libraries were prepared as described in Manching et al. (2017). Briefly, genomic DNA was extracted from pools of wasps from each population using Qiagen DNeasy Blood and Tissue Kits (Qiagen, Valencia, CA), following the standard protocol. The resulting DNA was digested with restriction endonucleases using one rare cutter (NgoMIV with a 6 bp recognition site) and one frequent cutter (CviQI with a 4 bp recognition site) (New England Biolabs, Inc., Ipswich, MA), which together determined the number of unique locations of fragments across the genome and the lengths of these fragments. Custom adaptors, with barcodes for each population that also served to register clusters on the Illumina HiSeq during sequencing, were ligated onto the fragments using T4 ligase (New England Biolabs, Inc., Ipswich, MA). The ligates were pooled and purified using Agencourt AMPure XP beads (Beckman Coulter, Indianapolis, IN). The purified ligate was separated into 10 aliquots that were amplified in separate PCR reactions to both increase copy number at each locus and add more adaptor sequence for sequencing. The adaptors were designed so that the only fragments that amplify would have the rare-common combination of cut sites. After PCR, the products were pooled and then size-selected (300-350 bp) using the BluePippin system (Sage Science, Beverly, MA). After quantification with qPCR, the resulting fragments were sequenced for ~100 nucleotides in single-end reads an Illumina HiSeq 2500 (Illumina, San Diego, CA) at the Delaware Biotechnology Institute.
\nSequence data were processed with a reduced-representation computational pipeline called RedRep (described in Manching et al. (2017)); the scripts and documentation for the pipeline are available under an open source MIT license at https://github.com/UD-CBCB/RedRep. Briefly, sequences were deconvoluted by barcode using custom scripts and the FASTX-Toolkit (version 0.0.14; http://hannonlab.cshl.edu/fastx_toolkit). Custom scripts and CutAdapt (version 1.14; Martin 2011) were then used to remove adapters, trim low quality read ends, and filter out sequences that did not meet minimum length/quality standards or did not meet expectations for the restriction-site sequences. High-quality reads were mapped to the draft genome of A. certus using BWA-MEM program (version 0.7.16a; Li 2013). SNP loci were identified using the GATK HaplotypeCaller (version 3.5-0; McKenna et al. 2010). We filtered the SNP loci for read depth ≥ 50 and then for presence in all populations using BEDtools (version 2.26) and custom scripts written in R (version 3.3.3; R.Core.Team 2017). We tested the relationship between host use distance and genetic distance, as measured by FST. Because A. certus individuals were pooled within populations to make the libraries for sequencing, we used read depths to estimate allele frequencies for SNP loci. We filtered the data for SNP loci that were present in all populations and had read depth ≥ 50, and we used the numbers of individuals in each pool in calculating FST between populations with the calcPopDiff function in the polysat R package (version 1.7-2; Clark 2017). Using Mantel's permutation test, we compared the genetic and parasitism distance matrices (10,000 permutations with the mantel.randtest function in the ade4 R package).
\nClark, L. V. (2017) polysat version 1.7-2. Tools for polyploid microsatellite analysis. in.\nLi, H. (2013) Aligning sequence reads, clone sequences and assembly contigs with BWA-MEM. arXiv: 1303.3997v1 [q-bio.GN].\nManching, H., Sengupta, S., Hopper, K. R., Polson, S. W., Ji, Y. and Wisser, R. J. (2017) Phased genotyping-by-sequencing enhances analysis of genetic diversity and reveals divergent copy number variants in maize. Genes Genomes Genetics, 7(7), pp. 2161-2170.\nMartin, M. (2011) Cutadapt removes adapter sequences from high-throughput sequencing reads. . EMBnet.journal, 17, pp. 10-12.\nMcKenna, A., Hanna, M., Banks, E., Sivachenko, A., Cibulskis, K., Kernytsky, A., Garimella, K., Altshuler, D., Gabriel, S., Daly, M. and DePristo, M. A. (2010) The Genome Analysis Toolkit: A MapReduce framework for analyzing next-generation DNA sequencing data. Genome Research, 20(9), pp. 1297-1303.\nR.Core.Team (2017) R: A language and environment for statistical computing. in: R Foundation for Statistical Computing, Vienna, Austria. https://www.R-project.org/.\n
Of interest to pharmaceutical, nutritional, and biomedical researchers, as well as individuals and companies involved with alternative therapies and and herbal products, this database is one of the world's leading repositories of ethnobotanical data, evolving out of the extensive compilations by the former Chief of USDA's Economic Botany Laboratory in the Agricultural Research Service in Beltsville, Maryland, in particular his popular Handbook of phytochemical constituents of GRAS herbs and other economic plants (CRC Press, Boca Raton, FL, 1992). In addition to Duke's own publications, the database documents phytochemical information and quantitative data collected over many years through research results presented at meetings and symposia, and findings from the published scientific literature.
\nThe current Phytochemical and Ethnobotanical databases facilitate plant, chemical, bioactivity, and ethnobotany searches. A large number of plants and their chemical profiles are covered, and data are structured to support browsing and searching in several user-focused ways. For example, users can
\nReferences to the supporting scientific publications are provided for each specific result.
Resource Title: Duke-Source-CSV.zip.
File Name: Duke-Source-CSV.zip
Resource Description: Dr. Duke's Phytochemistry and Ethnobotany - raw database tables for archival purposes.
\nVisit https://phytochem.nal.usda.gov/phytochem/search for the interactive web version of the database.
Resource Title: Data Dictionary (preliminary).
File Name: DrDukesDatabaseDataDictionary-prelim.csv
Resource Description: This Data Dictionary describes the columns for each table. [Note that this is in progress and some variables are yet to be defined or are unused in the current implementation. Please send comments/suggestions to nal-adc-curator@ars.usda.gov ]
Statistical software package for estimating field scale spatial salinity patterns from electromagnetic induction signal data (for Windows XP).
\nThe ESAP software package currently contains five programs:
\nAll five programs have been designed to work together in a seamless and efficient manner, and each program employs a simple, easy to learn graphical user interface.
\nResource Title: ESAP download page.
File Name: Web Page, url: https://www.ars.usda.gov/research/software/download/?softwareid=94&modecode=20-36-15-00
EV Smith Study for Resilient Economic Agricultural Practices in Auburn, Alabama\nThere is a potential in the southeastern US to harvest winter cover crops from cotton (Gossypium hirsutum L.) fields for biofuels or animal feed use, but this could impact yields and nitrogen (N) fertilizer response. An experiment was established to examine rye (Secale cereale L.) residue management (RM) and N rates on cotton productivity. Three RM treatments (no winter cover crop (NC), residue removed (REM) and residue retained (RET)) and four N rates for cotton were studied. Cotton population, leaf and plant N concentration, cotton biomass and N uptake at first square, and cotton biomass production between first square and cutout were higher for RET, followed by REM and NC. However, leaf N concentration at early bloom and N concentration in the cotton biomass between first square and cutout were higher for NC, followed by REM and RET. Seed cotton yield response to N interacted with year and RM, but yields were greater with RET followed by REM both years. These results indicate that a rye cover crop can be beneficial for cotton, especially during hot and dry years. Long-term studies would be required to completely understand the effect of rye residue harvest on cotton production under conservation tillage.
Resource Title: Auburn, AL EV Smith (ALAUEVS) data.
File Name: ALAUEVS_csv_data.zip
Resource Description: CSV format data on Experimental Units, Field Sites, Residue Management, Persons, Treatments, Weather Daily, Weather Station. \n
This metadata is the documentation for the field soil observations, ecological site identification, and geomorphology characteristics collected by the Assessment, Inventory, and Monitoring (AIM) terrestrial program between 2012 and 2021 in 14 states of the western United States. The AIM program is conducted by the Bureau of Land Management (BLM)’s and provides information to guide site-specific management of ecosystem functions and services. There are 31,267 monitoring plots (79% of plots) with identified ecological sites and 29,228 plots (74% of plots) containing soil morphology descriptions of soil horizons examined in excavated pits. While soil texture class is observed in most soil horizons (98%), rock fragment volume is the soil property with the least data availability (75%). The consistency of soil data (e.g., clay content observations within the ranges of texture classes) increases as a function of time following guidance in soil profile description training for AIM data collectors. Nearly 47% of AIM plots are found on gentle slopes of 0-5% steepness and on Flat/Plain and Hill/Mountain landscape types. The AIM database is a source of georeferenced soil and geomorphology information that can be used for land management and research on land potential, soil geography, and assessment of soil health indicators across the western United States.
\nResources in this dataset:
\nResource title: Plot characteristics\nFile name: PlotCharacteristics.csv\nResource description: Plot characteristics table contains information on GPS coordinates, ecological site ID, and geomorphological settings, such as slope, aspect, landscape type, etc.
\nResource title: Soil horizon\nFile name: SoilHorizon.csv\nResource description: The soil horizon table has information on soil morphology attributes, such as color, texture class, effervescence, soil structure, etc.
\nResource title: Plot characteristics data dictionary\nFile name: PlotCharacteristicsDataDictionary.csv
\nResource title: Soil horizon data dictionary\nFile name: SoilHorizonDataDictionary.csv
\nResource title: Methods\nFile name: Methods.txt
\nThis spreadsheet is a model of the economics of deficit irrigation that is described in detail in: Trout, T.J. and D.T. Manning. 2019. An economic and biophysical model of deficit irrigation. Agron. J. 111:1–12. doi:10.2134/agronj2019.03.0209 .
\nThe model calculates net income from a crop on a unit of land based on a quadratic crop water production function, amount of effective precipitation, irrigation efficiency, cost of the irrigation water supply, crop production costs, and revenue from selling the crop. The model includes potential income from leasing out saved irrigation water. All biophysical variables are defined in terms of the relative evapotranspiration. Net income is maximized by optimizing the amount of water consumed by the crop.
\nThe spreadsheet progressively presents biophysical and economic models of deficit irrigation with water leasing. Economic and biophysical parameters are input into the highlighted cells of each worksheet. Parameters from previous worksheets are copied to following worksheets. Relationships are graphed. Output is the net income (NI) for a set of biophysical and economic parameters and level of deficit irrigation that maximizes net income.
\nResource Title: Economic Model of Deficit Irrigation (spreadsheet).
File Name: WPF Econ Model V2.xlsx
Resource Title: Description of the Model.
File Name: Description of the Deficit Irrigation Economics Model.pdf
Resource Description: Description of the Model inputs and operation.
This spreadsheet model calculates the net income for irrigated agricultural production. The model is designed to evaluate the economics of deficit irrigation (irrigation at less than the amount required to produce maximum yield).
\nThe spreadsheet first models the water production function for a crop, then uses that relationship along with crop price and production costs to calculate net income and the irrigation amount that maximizes net income.
\nThis spreadsheet is similar to another posted at Ag Data Commons: \"Economic Model of Deficit Irrigation\" (http://dx.doi.org/10.15482/USDA.ADC/1504421). That model was designed primarily to evaluate deficit irrigation as a means to compare revenue with reduced water consumption to income gained by transferring the saved water.
\nThe model includes two common scenarios: 1) irrigation water supply is adequate but expensive, and 2) irrigation water supply is inadequate to fully irrigate the available land. In the first scenario, net income is maximized when the marginal costs of production, including water, is equal to the marginal revenue. In the second scenario, net income is maximized when the value of the water is maximized by selecting the portion of the land that should be irrigated. In the second scenario, the value and costs of the un-irrigated land are included.
\nThe first worksheet of the spreadsheet describes the relationships used in each worksheet and the input parameters required. Additional worksheets calculate the water production function, the irrigation water production function, and the net income for each of the two scenarios. The worksheets allow the user to input the various biophysical and economic parameters relevant to their conditions and allows evaluating various parameter combinations. Each worksheet contains graphs to visualize the results.
Resource Title: Economic Model of Deficit Irrigation II (spreadsheet).
File Name: WPF Econ Model V2 Mod.xlsx
Resource Description: Spreadsheet contains 5 worksheets. The first worksheet describes the relationships in the remaining worksheets and the parameters required by the model.
Resource Software Recommended: Microsoft Excel 365 (may work on earlier versions),url: https://www.microsoft.com/en-us/microsoft-365/get-started-with-office-2019
Resource Title: Description of the Model.
File Name: DataDictionary.pdf
Resource Description: Description of the model and input parameters.
Resource Software Recommended: Adobe Reader,url: https://get.adobe.com/reader/otherversions/
These data come from three eddy covariance (EC) towers that were installed as part of a project to assess the productivity of sugarcane agricultural systems for biofuel production. These towers were operated from 2011-2013 in Maui, USA. Major observational parameters include net carbon exchange, evapotranspiration, and energy fluxes.
Resource Title: Link to data for EC tower site Sugarcane Sheltered/Lee.
File Name: SuS.zip
Resource Description:
\nContinuous, irrigated, sugarcane cultivation for >100 years. Practice is to grow plant sugarcane for 2 years, drydown, burn leaves, harvest cane, and then till and replant very shortly after harvest. First cycle of observations were from July 2011 to November 2012. Second cycle was from April 2013 to December 2013. Site differs from Sugarcane Windy and Sugarcane Middle in soil type and meteorology.
Find the site data and information at https://ameriflux.lbl.gov/sites/siteinfo/US-SuS
Resource Title: Link to data for EC tower site Sugarcane Windy.
File Name: SuW.zip
Resource Description:
\nContinuous, irrigated, sugarcane cultivation for >100 years. Practice is to grow plant sugarcane for 2 years, drydown, burn leaves, harvest cane, and then till and replant very shortly after harvest. Site differs from Sugarcane Lee/Sheltered and Sugarcane Middle in soil type and site meteorology.
Find the site data and information at https://ameriflux.lbl.gov/sites/siteinfo/US-SuW
Resource Title: Link to data for EC tower site Sugarcane Middle.
File Name: SuM.zip
Resource Description: Continuous, irrigated, sugarcane cultivation for >100 years. Practice is to grow plant sugarcane for 2 years, drydown, burn leaves, harvest cane, and then till and replant very shortly after harvest. Site differs from Sugarcane Windy and Sugarcane Lee/sheltered in soil and meteorology.
\nFind the site data and information at https://ameriflux.lbl.gov/sites/siteinfo/US-SuM
Since 1964, the University of Minnesota has selectively bred a Holstein herd to maintain genetically static, unselected Holsteins (UH). Comparison of these UH cows with contemporary Holstein (CH) has demonstrated that the UH cows not only produce less milk but also have fewer health concerns than their CH herdmates. The objective of this study was to determine the effects of Holstein genotype on innate immune response in an experimental intramammary E. coli challenge model. Primiparous UH (n= 5) and CH (n = 7) cows received 430 cfu E. coli strain P4 in 1 quarter. Blood samples were collected at 0, 0.5, 1, 2, 7d relative to E. coli infusion. RNA Sequencing was conducted using the HiSeq 2500 platform (Illumina, San Diego, CA) to generate an average of 46.96 ± 2.67 million 100 bp paired end reads per sample.
\nFor more information about this dataset contact:\nJohn Lippolis: john.lippolis@usda.gov\nHao Ma: hao.ma@usda.gov
Resource Title: Effect of Holstein genotype on immune response to an intramammary Escherichia coli challenge.
File Name: Supplemental Table 1.csv
Resource Description: The results of RNA sequencing analysis. The raw sequencing data were submitted to NCBI SRA database with reference PRJNA808034.
Relative species and cover group data from a four-year long replicated experiment comparing the effects of season of fire (spring or fall) and sheep grazing deferment on sagebrush-steppe rangelands in east Idaho, USA. Study conducted by USDA-Agriculture Research Service Range Sheep Production Efficiency Research unit staff at the US Sheep Experiment Station near Dubois, ID. Deferment treatments included either no grazing for one or two growing seasons after fire, or no deferment, in which domestic sheep returned in the season after fire. Data also include species lookup table, precipitation data, and data library.
\nResources in this dataset:
\nResource Title: Species Lookup Table\nFile Name: SpeciesListPrint2.csv\nResource Description: Species code and cover group code table
\nResource Title: Data dictionary\nFile Name: DataDictionary_SFF_2023.xlsx\nResource Description: Data dictionary for data tables
\nResource Title: US Sheep Experiment Station Long Term Precipitation Record (inches)\nFile Name: PrecipUSSESInches.csv\nResource Description: US Sheep Experiment Station Long Term Precipitation Record (inches). Collected at Station Headquarters near Dubois, Idaho.
\nResource Title: Relative Cover Data by Species\nFile Name: FoliarCoverSpecies.csv\nResource Description: Relative cover data by species (codes). See species lookup table for species names.
\nResource Title: Relative cover data by cover groups\nFile Name: FoliarCoverGroups.csv\nResource Description: Relative foliar cover data summarized by cover type. See species lookup table for species names.
\nData for the article: \"Modeling the Formulation pH of Elderberry Syrup with multiple weak acids\", https://doi.org/10.1111/1750-3841.16664. To develop methods to assess the influence of the ingredients of an acidified elderberry syrup on product pH., a total of 16 model syrup formulations containing elderberry juice with mixed acids (malic, acetic, and ascorbic) and having pH values between 3 and 4 were prepared. The pH values of the formulations were compared to predicted values from combined buffer models of the individual ingredients. Regression analysis indicated an excellent fit of the observed and predicted pH data, with a root mean square error of 0.076 pH units. The results indicated that buffer models may be useful for in silico estimates of how the ingredients in acid and acidified foods may influence pH, thus aiding in product development and safety assessments.
Resources in this dataset:
Environmental Policy Integrated Climate (EPIC) model is a cropping systems model that was developed to estimate soil productivity as affected by erosion as part of the Soil and Water Resources Conservation Act analysis for 1980, which revealed a significant need for improving technology for evaluating the impacts of soil erosion on soil productivity. EPIC simulates approximately eighty crops with one crop growth model using unique parameter values for each crop. It can be configured for a wide range of crop rotations and other vegetative systems, tillage systems, and other management strategies. It predicts effects of management decisions on soil, water, nutrient and pesticide movements, and their combined impact on soil loss, water quality, and crop yields for areas with homogeneous soils and management.
\nEPIC functions on a daily time step and can simulate hundreds of years. Since the initial development, EPIC has been continually improving through the additions of algorithms to simulate water quality, nitrogen and carbon cycling, climate change, and the effects of atmospheric carbon dioxide. The processes simulated include leaf interception of solar radiation; conversion to biomass; division of biomass into roots, above ground mass, and economic yield; root growth; water use; and nutrient uptake. It can be configured for a wide range of crop rotations and other vegetative systems, tillage systems, and other management practices. The model can also assess the cost of erosion for determining optimal management strategies.
Resource Title: Environmental Policy Integrated Climate (EPIC) Model.
File Name: Web Page, url: https://epicapex.tamu.edu/epic/
Web site for the EPIC model: describes capabilities, examples of applications, and download links for executables, source code, and supporting tools.
Average estimated yields and associated CV values for current (2018) model runs. Based on work done by Harsimran Kaur et al in 2017. The following is from her thesis:\n\nAgro-ecological classes (AECs) of dryland cropping systems in the inland Pacific Northwest have been predicted to become more dynamic with greater use of annual fallow under projected climate change. At the same time, initiatives are being taken by growers either to intensify or diversify their cropping systems using oilseed and grain legume crops. The main objective of this study was to use a mechanistic model (CropSyst) to provide yield and soil water forecasts at regional scales which could compare fallow versus spring crop choices (flex/opportunity crop). Model simulations were based on historic weather data (1981-2010) as well as combined with actual year weather data for simulations at pre-planting dates starting in Dec. for representative years. Yield forecasts of spring pea, canola and wheat were compared to yield simulations using only weather of the representative year via linear regression analysis to assess pre-plant forecasts. Crop yield projections on pre-plant forecast date of Feb 1st had higher R2 with yield simulated using actual years weather data and lower CVs across the region as compared to forecasts based on historic weather data and other pre-season forecast dates (Dec. 1st and Jan. 1st). Therefore, Feb. 1st was considered the most reliable time to predict yield and other relevant outputs such as available water forecasts on a regional scale. Regional forecast maps of predicted spring crop yields and CVs showed ranges of 1 to 4367 kg/ha and 11 to 293% for spring canola, 72 to 2646 kg/ha and 11 to 143% for spring pea and 39 to 5330 kg/ha and 11 to 158% for spring wheat across study region for a representative year. These data combined with predicted available water after fallow and following spring crop yield as well as estimates of winter wheat yield reduction would collectively serve as information contributing to decisions related to crop intensification and diversification.
Resource Title: GeoData catalog record.
File Name: Web Page, url: https://geodata.nal.usda.gov/geonetwork/srv/eng/catalog.search#/metadata/459d2dba-a346-4e54-9750-ef3178c18f38
Pooling individual samples prior to DNA extraction can mitigate the cost of DNA extraction and genotyping; however, these methods need to accurately generate equal representation of individuals within pools. This data set was generated to determine accuracy of pool construction based on white blood cell counts compared to two common DNA quantification methods. Fifty individual bovine blood samples were collected, and then pooled with all individuals represented in each pool. Pools were constructed with the target of equal representation of each individual animal based on number of white blood cells, spectrophotometric readings, spectrofluorometric readings and whole blood volume with 9 pools per method and a total of 36 pools. Pools and individual samples that comprised the pools were genotyped using a commercially available genotyping array. ASReml was used to estimate variance components for individual animal contribution to pools. The correlation between animal contributions between two pools was estimated using bivariate analysis with starting values set to the result of a univariate analysis.
\nThe dataset includes:\n1) pooling allele frequencies (PAF) for all pools and individual animals computed from normalized intensities for red (X) and green (Y); PAF = X/(X+Y).\n2) Genotypes or number of copies of B(green) allele (0,1,2).\n3) Definitions for each sample.
\nResource Title: Pooling Allele Frequencies (paf) for all pools and individual animals.
File Name: pafAnimal.csv.gz
Resource Description: Pooling Allele Frequencies (paf) for all pools and individual animals computed from normalized intensities for red (X) and green (Y); paf = X / (X + Y)
Resource Title: Genotypes for individuals within pools.
File Name: g.csv.gz
Resource Description: Genotypes (number of copies of the B (green) allele (0,1,2)) for individual bovine animals within pools.
Resource Title: Sample Definitions .
File Name: XY Data Key.xlsx
Resource Description: Definitions for each sample (both pools and individual animals).
This dataset contains water balance data for each year when alfalfa was grown at the USDA-ARS Conservation and Production Laboratory (CPRL), Soil and Water Management Research Unit (SWMRU) research weather station, Bushland, Texas (Lat. 35.186714°, Long. -102.094189°, elevation 1170 m above MSL). Alfalfa was grown on two large, precision weighing lysimeters, each in the center of a 4.44 ha square field in 1996 through 1999. Irrigation was by linear move sprinkler system. Irrigations were managed to replenish soil water used by the crop on a weekly or more frequent basis as determined by soil profile water content readings made with a neutron probe to 2.4-m depth in the field. The weighing lysimeters were used to measure relative soil water storage to 0.05 mm accuracy at 5-minute intervals, and the 5-minute change in soil water storage was used along with precipitation and irrigation amounts to calculate crop evapotranspiration (ET), which is reported at 15-minute intervals. Because the large (3 m by 3 m surface area) weighing lysimeters are better rain gages than are tipping bucket gages, the 15-minute precipitation data are derived for each lysimeter from changes in lysimeter mass. The land slope is <0.3% and flat.
\nThe water balance data consist of 15-minute and daily amounts of evapotranspiration (ET), dew/frost fall, precipitation (rain/snow), irrigation, scale counterweight adjustment, and emptying of drainage tanks, all in mm. The values are the result of a rigorous quality control process involving algorithms for detecting dew/frost accumulations, and precipitation (rain and snow). Changes in lysimeter mass due to emptying of drainage tanks, counterweight adjustment, maintenance activity, and harvest are accounted for such that ET values are minimally affected. The ET data should be considered to be the best values offered in these datasets. Even though ET data are also presented in the \"lysimeter\" datasets, the values herein are the result of a more rigorous quality control process. Dew and frost accumulation varies from year to year and seasonally within a year, and it is affected by lysimeter surface condition [bare soil, tillage condition, residue amount and orientation (flat or standing), etc.]. Particularly during winter and depending on humidity and cloud cover, dew and frost accumulation sometimes accounts for an appreciable percentage of total daily ET.
\nThese datasets originate from research aimed at determining crop water use (ET), reference \"tall crop\" ET, crop coefficients for use in ET-based irrigation scheduling based on a reference ET, crop growth, yield, harvest index, and crop water productivity as affected by irrigation method, timing, amount (full or some degree of deficit), agronomic practices, cultivar, and weather. Prior publications have focused on alfalfa ET, crop coefficients, crop water productivity reference \"tall crop\" ET, alternative methods of estimating reference ET from weather data. Crop coefficients have been used by ET networks. The data have utility for testing simulation models of crop ET, growth, and yield.
Resource Title: 1996 Bushland, TX. East Alfalfa Evapotranspiration, Irrigation, and Water Balance Data.
File Name: 1996_alfalfa_water_balance.xlsx
Resource Description: The data consist of 15-minute and daily amounts of evapotranspiration (ET), dew/frost accumulation, precipitation (rain/snow), irrigation, scale counterweight adjustment, and emptying of drainage tanks, all in mm. The values are the result of a rigorous quality control process involving algorithms for detecting dew/frost accumulations, and precipitation (rain and snow). Changes in lysimeter mass due to precipitation, irrigation, frost and dew accumulation, emptying of drainage tanks, counterweight adjustment, maintenance activity, and harvest are accounted for such that ET values are minimally affected.
Resource Title: 1997 Bushland, TX. East Alfalfa Evapotranspiration, Irrigation, and Water Balance Data.
File Name: 1997_alfalfa_water_balance.xlsx
Resource Description: The data consist of 15-minute and daily amounts of evapotranspiration (ET), dew/frost accumulation, precipitation (rain/snow), irrigation, scale counterweight adjustment, and emptying of drainage tanks, all in mm. The values are the result of a rigorous quality control process involving algorithms for detecting dew/frost accumulations, and precipitation (rain and snow). Changes in lysimeter mass due to precipitation, irrigation, frost and dew accumulation, emptying of drainage tanks, counterweight adjustment, maintenance activity, and harvest are accounted for such that ET values are minimally affected.
Resource Title: 1998 Bushland, TX. East Alfalfa Evapotranspiration, Irrigation, and Water Balance Data.
File Name: 1998_alfalfa_water_balance.xlsx
Resource Description: The data consist of 15-minute and daily amounts of evapotranspiration (ET), dew/frost accumulation, precipitation (rain/snow), irrigation, scale counterweight adjustment, and emptying of drainage tanks, all in mm. The values are the result of a rigorous quality control process involving algorithms for detecting dew/frost accumulations, and precipitation (rain and snow). Changes in lysimeter mass due to precipitation, irrigation, frost and dew accumulation, emptying of drainage tanks, counterweight adjustment, maintenance activity, and harvest are accounted for such that ET values are minimally affected.
Resource Title: 1999 Bushland, TX. East Alfalfa Evapotranspiration, Irrigation, and Water Balance Data.
File Name: 1999_alfalfa_water_balance.xlsx
Resource Description: The data consist of 15-minute and daily amounts of evapotranspiration (ET), dew/frost accumulation, precipitation (rain/snow), irrigation, scale counterweight adjustment, and emptying of drainage tanks, all in mm. The values are the result of a rigorous quality control process involving algorithms for detecting dew/frost accumulations, and precipitation (rain and snow). Changes in lysimeter mass due to precipitation, irrigation, frost and dew accumulation, emptying of drainage tanks, counterweight adjustment, maintenance activity, and harvest are accounted for such that ET values are minimally affected.
This dataset contains water balance data for each growing season (year) when maize (Zea mays, L., also known as corn in the United States) was grown for grain at the USDA-ARS Conservation and Production Laboratory (CPRL), Soil and Water Management Research Unit (SWMRU) research weather station, Bushland, Texas (Lat. 35.186714°, Long. -102.094189°, elevation 1170 m above MSL). Maize was grown for grain on two large, precision weighing lysimeters, each in the center of a 4.44 ha square field. Irrigation was by linear move sprinkler system in 1989, 1990, and 1994. In 2013, 2016, and 2018, maize was grown on four lysimeters; two lysimeters and their respective fields were irrigated using subsurface drip irrigation (SDI), and two lysimeters and their respective fields were irrigated by a linear move sprinkler system. Irrigations were managed to replenish soil water used by the crop on a weekly or more frequent basis as determined by soil profile water content readings made with a neutron probe to 2.4-m depth in the field. The weighing lysimeters were used to measure relative soil water storage to 0.05 mm accuracy at 5-minute intervals, and the 5-minute change in soil water storage was used along with precipitation and irrigation amounts to calculate crop evapotranspiration (ET), which is reported at 15-minute intervals. Because the large (3 m by 3 m surface area) weighing lysimeters are better rain gages than are tipping bucket gages, the 15-minute precipitation data are derived for each lysimeter from changes in lysimeter mass. The land slope is <1% and flat.
The water balance data consist of 15-minute and daily amounts of evapotranspiration (ET), dew/frost fall, precipitation (rain/snow), irrigation, scale counterweight adjustment, and emptying of drainage tanks, all in mm. The values are the result of a rigorous quality control process involving algorithms for detecting dew/frost accumulations, and precipitation (rain and snow). Changes in lysimeter mass due to emptying of drainage tanks, counterweight adjustment, maintenance activity, and harvest are accounted for such that ET values are minimally affected. The ET data should be considered to be the best values offered in these datasets. Even though ET data are also presented in the \"lysimeter\" datasets, the values herein are the result of a more rigorous quality control process. Dew and frost accumulation varies from year to year and seasonally within a year, and it is affected by lysimeter surface condition [bare soil, tillage condition, residue amount and orientation (flat or standing), etc.]. Particularly during winter and depending on humidity and cloud cover, dew and frost accumulation sometimes accounts for an appreciable percentage of total daily ET.
These datasets originate from research aimed at determining crop water use (ET), crop coefficients for use in ET-based irrigation scheduling based on a reference ET, crop growth, yield, harvest index, and crop water productivity as affected by irrigation method, timing, amount (full or some degree of deficit), agronomic practices, cultivar, and weather. Prior publications have focused on maize ET, crop coefficients, and crop water productivity. Crop coefficients have been used by ET networks. The data have utility for testing simulation models of crop ET, growth, and yield and have been used by the Agricultural Model Intercomparison and Improvement Project (AgMIP), by OPENET, and by many others for testing, and calibrating models of ET that use satellite and/or weather data.
Resources in this dataset:
This dataset contains water balance data for each year when soybean [Glycine max (L.) Merr.] was grown at the USDA-ARS Conservation and Production Laboratory (CPRL), Soil and Water Management Research Unit (SWMRU), Bushland, Texas (Lat. 35.186714°, Long. -102.094189°, elevation 1170 m above MSL). Soybean [Glycine max (L.) Merr.] was grown on two large, precision weighing lysimeters, each in the center of a 4.44 ha square field in 1995, 2003, 2004 and 2010. Soybean was grown on four large, precision weighing lysimeters and their surrounding 4.4-ha fields in 2019. Irrigation in 1995, 2003, 2004, and 2010 was by linear move sprinkler system. Irrigation in 2019 was by subsurface drip irrigation (SDI) system on the northeast (NE) and southeast (SE) weighing lysimeters an fields, while irrigation was by linear move sprinkler system on the northwest (NW) and southwest (SW) lysimeters and fields. Full irrigations were managed to replenish soil water used by the crop on a weekly or more frequent basis as determined by soil profile water content readings made with a neutron probe to 2.4-m depth in the field. Deficit irrigations were less than full - see crop calendars and irrigation data in these files for details. The weighing lysimeters were used to measure relative soil water storage to 0.05 mm accuracy at 5-minute intervals, and the 5-minute change in soil water storage was used along with precipitation and irrigation amounts to calculate crop evapotranspiration (ET), which is reported at 15-minute intervals. Because the large (3 m by 3 m surface area) weighing lysimeters are better rain gages than are tipping bucket gages, the 15-minute precipitation data are derived for each lysimeter from changes in lysimeter mass. The land slope is <0.3% and flat.
\nThe water balance data consist of 15-minute and daily amounts of evapotranspiration (ET), dew/frost fall, precipitation (rain/snow), irrigation, scale counterweight adjustment, and emptying of drainage tanks, all in mm. The values are the result of a rigorous quality control process involving algorithms for detecting dew/frost accumulations, and precipitation (rain and snow). Changes in lysimeter mass due to emptying of drainage tanks, counterweight adjustment, maintenance activity, and harvest are accounted for such that ET values are minimally affected. The ET data should be considered to be the best values offered in these datasets. Even though ET data are also presented in the \"lysimeter\" datasets, the values herein are the result of a more rigorous quality control process. Dew and frost accumulation varies from year to year and seasonally within a year, and it is affected by lysimeter surface condition [bare soil, tillage condition, residue amount and orientation (flat or standing), etc.]. Particularly during winter and depending on humidity and cloud cover, dew and frost accumulation sometimes accounts for an appreciable percentage of total daily ET.
\nThese datasets originate from research aimed at determining crop water use (ET), crop coefficients for use in ET-based irrigation scheduling based on a reference ET, crop growth, yield, harvest index, and crop water productivity as affected by irrigation method, timing, amount (full or some degree of deficit), agronomic practices, cultivar, and weather. Prior publications have focused on crop ET, crop coefficients, and crop water productivity. Crop coefficients have been used by ET networks. The data have utility for testing simulation models of crop ET, growth, and yield.
See the README for descriptions of each data file.
Resource Title: 1995 Bushland, TX, West Soybean Evapotranspiration, Irrigation, and Water Balance Data.
File Name: 1995_W_Soybean_water_balance.xlsx
Resource Title: 2003 Bushland, TX, East Soybean Evapotranspiration, Irrigation, and Water Balance Data.
File Name: 2003_E_Soybean_water_balance.xlsx
Resource Title: 2004 Bushland, TX, East Soybean Evapotranspiration, Irrigation, and Water Balance Data.
File Name: 2004_E_Soybean_water_balance.xlsx
Resource Title: 2010 Bushland, TX, West Soybean Evapotranspiration, Irrigation, and Water Balance Data.
File Name: 2010_W_Soybean_water_balance.xlsx
Resource Title: 2019 Bushland, TX, East Soybean Evapotranspiration, Irrigation, and Water Balance Data.
File Name: 2019_E_Soybean_water_balance.xlsx
Resource Title: 2019 Bushland, TX, West Soybean Evapotranspiration, Irrigation, and Water Balance Data.
File Name: 2019_W_Soybean_water_balance.xlsx
Resource Title: README.
File Name: README_Soybean_Water_Balance.txt
This dataset contains water balance data for each year when sunflower was grown at the USDA-ARS Conservation and Production Laboratory (CPRL), Soil and Water Management Research Unit (SWMRU), Bushland, Texas (Lat. 35.186714°, Long. -102.094189°, elevation 1170 m above MSL). Sunflower was grown on two large, precision weighing lysimeters, each in the center of a 4.44 ha square field in 2009 and 2011. Irrigation was by linear move sprinkler system. Full irrigations were managed to replenish soil water used by the crop on a weekly or more frequent basis as determined by soil profile water content readings made with a neutron probe to 2.4-m depth in the field. Deficit irrigations were less than full - see crop calendars and irrigation data in these files for details. The weighing lysimeters were used to measure relative soil water storage to 0.05 mm accuracy at 5-minute intervals, and the 5-minute change in soil water storage was used along with precipitation and irrigation amounts to calculate crop evapotranspiration (ET), which is reported at 15-minute intervals. Because the large (3 m by 3 m surface area) weighing lysimeters are better rain gages than are tipping bucket gages, the 15-minute precipitation data are derived for each lysimeter from changes in lysimeter mass. The land slope is <0.3% and flat.
\nThe water balance data consist of 15-minute and daily amounts of evapotranspiration (ET), dew/frost fall, precipitation (rain/snow), irrigation, scale counterweight adjustment, and emptying of drainage tanks, all in mm. The values are the result of a rigorous quality control process involving algorithms for detecting dew/frost accumulations, and precipitation (rain and snow). Changes in lysimeter mass due to emptying of drainage tanks, counterweight adjustment, maintenance activity, and harvest are accounted for such that ET values are minimally affected. The ET data should be considered to be the best values offered in these datasets. Even though ET data are also presented in the \"lysimeter\" datasets, the values herein are the result of a more rigorous quality control process. Dew and frost accumulation varies from year to year and seasonally within a year, and it is affected by lysimeter surface condition [bare soil, tillage condition, residue amount and orientation (flat or standing), etc.]. Particularly during winter and depending on humidity and cloud cover, dew and frost accumulation sometimes accounts for an appreciable percentage of total daily ET.
\nThese datasets originate from research aimed at determining crop water use (ET), crop coefficients for use in ET-based irrigation scheduling based on a reference ET, crop growth, yield, harvest index, and crop water productivity as affected by irrigation method, timing, amount (full or some degree of deficit), agronomic practices, cultivar, and weather. Prior publications have focused on sunflower ET, crop coefficients, and crop water productivity. Crop coefficients have been used by ET networks. The data have utility for testing simulation models of crop ET, growth, and yield.
Resource Title: 2009 Bushland, TX. East Sunflower Evapotranspiration, Irrigation, and Water Balance Data.
File Name: 2009_E_Sunflower_water_balance.xlsx
Resource Description: The data consist of 15-minute and daily amounts of evapotranspiration (ET), dew/frost accumulation, precipitation (rain/snow), irrigation, scale counterweight adjustment, and emptying of drainage tanks, all in mm. The values are the result of a rigorous quality control process involving algorithms for detecting dew/frost accumulations, and precipitation (rain and snow). Changes in lysimeter mass due to precipitation, irrigation, frost and dew accumulation, emptying of drainage tanks, counterweight adjustment, maintenance activity, and harvest are accounted for such that ET values are minimally affected.
Resource Title: 2011 Bushland, TX. East Sunflower Evapotranspiration, Irrigation, and Water Balance Data.
File Name: 2011_E_Sunflower_water_balance.xlsx
Resource Description: The data consist of 15-minute and daily amounts of evapotranspiration (ET), dew/frost accumulation, precipitation (rain/snow), irrigation, scale counterweight adjustment, and emptying of drainage tanks, all in mm. The values are the result of a rigorous quality control process involving algorithms for detecting dew/frost accumulations, and precipitation (rain and snow). Changes in lysimeter mass due to precipitation, irrigation, frost and dew accumulation, emptying of drainage tanks, counterweight adjustment, maintenance activity, and harvest are accounted for such that ET values are minimally affected.
This dataset contains water balance data for each year when winter wheat was grown at the USDA-ARS Conservation and Production Laboratory (CPRL), Soil and Water Management Research Unit (SWMRU) research weather station, Bushland, Texas (Lat. 35.186714°, Long. -102.094189°, elevation 1170 m above MSL). Winter wheat was grown on two large, precision weighing lysimeters, each in the center of a 4.44 ha square field in the 1989-1990, 1991-1992, and 1992-1993 seasons. Irrigation was by linear move sprinkler system. Full irrigations were managed to replenish soil water used by the crop on a weekly or more frequent basis as determined by soil profile water content readings made with a neutron probe to 2.4-m depth in the field. Deficit irrigations were less than full - see crop calendars and irrigation data in these files for details. The weighing lysimeters were used to measure relative soil water storage to 0.05 mm accuracy at 5-minute intervals, and the 5-minute change in soil water storage was used along with precipitation and irrigation amounts to calculate crop evapotranspiration (ET), which is reported at 15-minute intervals. Because the large (3 m by 3 m surface area) weighing lysimeters are better rain gages than are tipping bucket gages, the 15-minute precipitation data are derived for each lysimeter from changes in lysimeter mass. The land slope is <0.3% and flat.
\nThe water balance data consist of 15-minute and daily amounts of evapotranspiration (ET), dew/frost fall, precipitation (rain/snow), irrigation, scale counterweight adjustment, and emptying of drainage tanks, all in mm. The values are the result of a rigorous quality control process involving algorithms for detecting dew/frost accumulations, and precipitation (rain and snow). Changes in lysimeter mass due to emptying of drainage tanks, counterweight adjustment, maintenance activity, and harvest are accounted for such that ET values are minimally affected. The ET data should be considered to be the best values offered in these datasets. Even though ET data are also presented in the \"lysimeter\" datasets, the values herein are the result of a more rigorous quality control process. Dew and frost accumulation varies from year to year and seasonally within a year, and it is affected by lysimeter surface condition [bare soil, tillage condition, residue amount and orientation (flat or standing), etc.]. Particularly during winter and depending on humidity and cloud cover, dew and frost accumulation sometimes accounts for an appreciable percentage of total daily ET.
\nThese datasets originate from research aimed at determining crop water use (ET), crop coefficients for use in ET-based irrigation scheduling based on a reference ET, crop growth, yield, harvest index, and crop water productivity as affected by irrigation method, timing, amount (full or some degree of deficit), agronomic practices, cultivar, and weather. Prior publications have focused on winter wheat ET, crop coefficients, and crop water productivity. Crop coefficients have been used by ET networks. The data have utility for testing simulation models of crop ET, growth, and yield.
Resource Title: 1989 Bushland, TX. West Winter Wheat Evapotranspiration, Irrigation, and Water Balance Data.
File Name: 1989_W_Wheat_water_balance.xlsx
Resource Description: The data consist of 15-minute and daily amounts of evapotranspiration (ET), dew/frost accumulation, precipitation (rain/snow), irrigation, scale counterweight adjustment, and emptying of drainage tanks, all in mm. The values are the result of a rigorous quality control process involving algorithms for detecting dew/frost accumulations, and precipitation (rain and snow). Changes in lysimeter mass due to precipitation, irrigation, frost and dew accumulation, emptying of drainage tanks, counterweight adjustment, maintenance activity, and harvest are accounted for such that ET values are minimally affected.
Resource Title: 1990 Bushland, TX. West Winter Wheat Evapotranspiration, Irrigation, and Water Balance Data.
File Name: 1990_W_Wheat_water_balance.xlsx
Resource Description: The data consist of 15-minute and daily amounts of evapotranspiration (ET), dew/frost accumulation, precipitation (rain/snow), irrigation, scale counterweight adjustment, and emptying of drainage tanks, all in mm. The values are the result of a rigorous quality control process involving algorithms for detecting dew/frost accumulations, and precipitation (rain and snow). Changes in lysimeter mass due to precipitation, irrigation, frost and dew accumulation, emptying of drainage tanks, counterweight adjustment, maintenance activity, and harvest are accounted for such that ET values are minimally affected.
Resource Title: 1991 Bushland, TX. East Winter Wheat Evapotranspiration, Irrigation, and Water Balance Data.
File Name: 1991_E_Wheat_water_balance.xlsx
Resource Description: The data consist of 15-minute and daily amounts of evapotranspiration (ET), dew/frost accumulation, precipitation (rain/snow), irrigation, scale counterweight adjustment, and emptying of drainage tanks, all in mm. The values are the result of a rigorous quality control process involving algorithms for detecting dew/frost accumulations, and precipitation (rain and snow). Changes in lysimeter mass due to precipitation, irrigation, frost and dew accumulation, emptying of drainage tanks, counterweight adjustment, maintenance activity, and harvest are accounted for such that ET values are minimally affected.
Resource Title: 1992 Bushland, TX. East Winter Wheat Evapotranspiration, Irrigation, and Water Balance Data.
File Name: 1992_E_Wheat_water_balance.xlsx
Resource Description: The data consist of 15-minute and daily amounts of evapotranspiration (ET), dew/frost accumulation, precipitation (rain/snow), irrigation, scale counterweight adjustment, and emptying of drainage tanks, all in mm. The values are the result of a rigorous quality control process involving algorithms for detecting dew/frost accumulations, and precipitation (rain and snow). Changes in lysimeter mass due to precipitation, irrigation, frost and dew accumulation, emptying of drainage tanks, counterweight adjustment, maintenance activity, and harvest are accounted for such that ET values are minimally affected.
Resource Title: 1992 Bushland, TX. West Winter Wheat Evapotranspiration, Irrigation, and Water Balance Data.
File Name: 1992_W_Wheat_water_balance.xlsx
Resource Description: The data consist of 15-minute and daily amounts of evapotranspiration (ET), dew/frost accumulation, precipitation (rain/snow), irrigation, scale counterweight adjustment, and emptying of drainage tanks, all in mm. The values are the result of a rigorous quality control process involving algorithms for detecting dew/frost accumulations, and precipitation (rain and snow). Changes in lysimeter mass due to precipitation, irrigation, frost and dew accumulation, emptying of drainage tanks, counterweight adjustment, maintenance activity, and harvest are accounted for such that ET values are minimally affected.
Resource Title: 1993 Bushland, TX. West Winter Wheat Evapotranspiration, Irrigation, and Water Balance Data.
File Name: 1993_W_Wheat_water_balance.xlsx
Resource Description: The data consist of 15-minute and daily amounts of evapotranspiration (ET), dew/frost accumulation, precipitation (rain/snow), irrigation, scale counterweight adjustment, and emptying of drainage tanks, all in mm. The values are the result of a rigorous quality control process involving algorithms for detecting dew/frost accumulations, and precipitation (rain and snow). Changes in lysimeter mass due to precipitation, irrigation, frost and dew accumulation, emptying of drainage tanks, counterweight adjustment, maintenance activity, and harvest are accounted for such that ET values are minimally affected.
Red Bluff Research Ranch is a 13,750-acre ranch is part of the Montana Agricultural Experiment station, and associated with Montana State University in Bozeman, MT. The ranch occupies most of the once thriving late 19th- to early 20th-century gold mining community in the Hot Springs Mining District, which was second only in gold production to Alder Gulch. The ranch nearly surrounds the town of Norris. Historically about 900 head of sheep were maintained year-round at the research ranch. The livestock, as well as the rangeland, are used for both teaching and research. Sheep nutrition studies included nutrition levels, management practices and sheep behavior. Animal scientists look at breeding as a major way to improve livestock production. Hybridization was studied in sheep to help predict staple length, open faces, smoothness and body conformation related to better and more meat. These data include ewe and lamb body condition, breeding and production data from 1960-2012.
\nSupported/funded by Montana State University College of Agriculture, Montana Agricultural Research Service, Montana Wool Lab., and the USDA Agricultural Research Service.
\nResource Title: MSU_EWES_1960-2012.
File Name: MSU_EWES_1960-2012.csv
Resource Title: MSU_LAMBS_1960-2012.
File Name: MSU_LAMBS_1960-2012.csv
Resource Title: Data dictionary for Montana State University ewe data 1960-2012.
File Name: MSU_Ewe_DataDictionary.csv
Resource Title: Data dictionary for Montana State University lamb data 1960-2012.
File Name: MSU_Lamb_DataDictionary.csv
Researchers sequenced 10,368 expressed sequence tags (EST) clones using a normalized cDNA library made from pooled samples of the trophont, tomont, and theront life-cycle stages, and generated 9,769 sequences (94.2% success rate). Post-sequencing processing led to 8,432 high quality sequences. Clustering analysis of these ESTs allowed identification of 4,706 unique sequences containing 976 contigs and 3,730 singletons.
\nThe ciliate protozoan Ichthyophthirius multifiliis (Ich) is an important parasite of freshwater fish that causes 'white spot disease' leading to significant losses. A genomic resource for large-scale studies of this parasite has been lacking. To study gene expression involved in Ich pathogenesis and virulence, our goal was to generate ESTs for the development of a powerful microarray platform for the analysis of global gene expression in this species. Here, we initiated a project to sequence and analyze over 10,000 ESTs.
\nResource Title: Data Dictionary - Supplemental Tables 1, 2, and 3.
File Name: IchthyophthiriusESTs_DataDictionary.csv
Resource Description: Machine-readable comma-separated values (CSV) definitions for data elements of Supplemental Tables 1-3 concerning *I. multifiliis* unique EST sequences, BLAST searches of the Ich ESTs against *Tetrahymena thermophila* and *Plasmodium falciparum* genomes, and gene ontology (GO) profile.
Resource Title: Table 3. Table of gene ontology (GO) profiles..
File Name: 12864_2006_889_MOESM3_ESM.xls
Resource Description: Supplemental Table 3, Excel spreadsheet; Table of gene ontology (GO) profiles; Provided information includes unique EST name, accession numbers, BLASTX top hit, GO identification numbers and enzyme commission (EC) numbers. \n\nData resources found on the main article page under the \"Electronic supplementary material\" section: http://bmcgenomics.biomedcentral.com/articles/10.1186/1471-2164-8-176\n\nDirect download for this resource: https://static-content.springer.com/esm/art:10.1186/1471-2164-8-176/MediaObjects/12864_2006_889_MOESM3_ESM.xls Title: Table I. Multifiliis unique EST sequences.
File Name: 12864_2006_889_MOESM1_ESM.xls
Resource Description: Supplemental Table 1 for article, \"Generation and analysis of expressed sequence tags from the ciliate protozoan parasite Ichthyophthirius multifiliis.\" Excel spreadsheet; Table of I. multifiliis unique EST sequences; Provided information includes I. multifiliis BLASTX top hits to the non-redundant database in GenBank with unique EST name and accession numbers. Also included are significant protein domain comparisons to the Swiss-Prot database. Putative secretory proteins are highlighted.\n\nData resources found on the main article page under the \"Electronic supplementary material\" section: http://bmcgenomics.biomedcentral.com/articles/10.1186/1471-2164-8-176\n\nDirect download for this resource: https://static-content.springer.com/esm/art:10.1186/1471-2164-8-176/MediaObjects/12864_2006_889_MOESM1_ESM.xls Title: Table 2. Excel spreadsheet; Summary of BLAST searches of the Ich ESTs against Tetrahymena thermophila and Plasmodium falciparum genomes.
File Name: 12864_2006_889_MOESM2_ESM.xls
Resource Description: Table 2 from \"Generation and analysis of expressed sequence tags from the ciliate protozoan parasite Ichthyophthirius multifiliis.\" Excel spreadsheet; Summary of BLAST searches of the Ich ESTs against Tetrahymena thermophila and Plasmodium falciparum genomes. Provided information includes I. multifiliis BLASTX top hits to the non-redundant database in GenBank with unique EST name, tBLASTx top hits to the T. thermophila genome, and BLASTX top hits to the P. falciparum genome sequences. This table correlates with the Venn diagram in figure 1.\n\nData resources found on the main article page under the \"Electronic supplementary material\" section: http://bmcgenomics.biomedcentral.com/articles/10.1186/1471-2164-8-176\n\nDirect download link for this data resource: https://static-content.springer.com/esm/art:10.1186/1471-2164-8-176/MediaObjects/12864_2006_889_MOESM2_ESM.xls
This program is developed to predict the major ion, B composition, electrical conductivity (EC) and osmotic pressure (OP) of a soil solution at a desired water content based on the known ion composition at another water content.
\nThe major uses of the model are envisioned as:\nObtaining a predicted saturation extract composition, EC and OP based on analysis of a 1:1, 1:2 or 1:5 soil water extract.\nCorrection of the soil water extract data for gypsiferous soils when calibrating field electromagnetic or electrical resistivity surveys for salinity.\nCalculating UNSATCHEM or other chemical transport model input soil water concentrations at a specific pressure head (and thus water content) based on analyses of soil extracts.\nBasis of the model
\nThe program is based on the chemical routines used in the UNSATCHEM model (Suarez and Simunek, 1996, 1997). It considers major ions, boron, and the chemical processes of cation exchange, precipitation-dissolution of calcite and gypsum, and boron adsorption using the constant capacitance model.
\nThe model can be run in batch mode or in individual cases with display to the screen.
Resource Title: ExtractChem download page.
File Name: Web Page, url: https://www.ars.usda.gov/research/software/download/?softwareid=155&modecode=20-36-15-00
The findhap.f90 program finds haplotypes and imputes genotypes using multiple chip sets and sequence data. Program and download information can be found at the Animal Improvement Program (AIP) web site: http://aipl.arsusda.gov/software/findhap
\nDownloads\nVersion 4 program, example files, and executable\n(beta version — not quite ready for routine use on U.S. chip data, but performs better than version 3 for sequence data)
\nExample data files for imputation study presented by VanRaden and Sun at the 2014 World Congress on Genetics Applied to Livestock Production
\nOther examples in the study can be generated by setting other options for programs findhap4, geno2seq, and genosim.
\nResource Title: FINDHAP.
File Name: Web Page, url: https://www.ars.usda.gov/research/software/download/?softwareid=494&modecode=80-42-05-30
download page
The findmap.f90 program aligns sequence reads to reference map, calls previous variants, and identifies new variants. Program and download information can be found at the Animal Improvement Program (AIP) web site: http://aipl.arsusda.gov/software/findhap
\nSequencing research requires efficient computation. Few programs use already known information about DNA variants when aligning sequence data to the reference map. New program findmap.f90 reads the previous variant list before aligning sequence, calling variant alleles, and summing the allele counts for each DNA source in a single pass. Advantages are faster processing, more precise alignment, more useful data summaries, more compact output, and fewer steps. Programs findmap and BWA were compared using simulated paired end reads of length 150 from fragments of length 1,000 at random locations within the UMD3.1 bovine reference assembly. Each base had 1% probability of error and 1% probability of missing. The 39 million variants from run 5 of the 1,000 bull genomes project were included, with every other variant set to reference or alternate. With 1 processor, BWA required 629 minutes per 1X for alignment, whereas findmap required 12 minutes per 1X for alignment and variant calling. Percentage of correctly mapped reads was 90.5% from BWA and 92.9% from findmap. Variant calls were output by findmap only for the 88.2% of pairs where both ends were located within the fragment length and of opposite orientation. Percentages of variants called correctly were 99.8% for SNPs and 99.9% for deletions, while insertions had 99.9% of alternate calls correct but only 98.6% of reference calls. Memory required by BWA was 4.6 Gbytes / processor, whereas findmap required 46 Gbytes that could be shared by multiple processors. Simultaneous alignment and variant calling is an efficient and accurate strategy.
Resource Title: FINDMAP.
File Name: Web Page, url: https://www.ars.usda.gov/research/software/download/?softwareid=495&modecode=80-42-05-30
download page
Data from this project focuses on the evaluation of breeding lines. Significant progress was made in advancing breeding populations directed towards release of improved varieties in Tanzania. Thirty promising F4:7, 1st generation 2014 PIC (Phaseolus Improvement Cooperative) and ~100 F4:6, 2nd generation 2015 PIC breeding lines were selected. In addition, ~300 F4:5, 3rd generation 2016 PIC single plant selections were completed in Arusha and Mbeya. These breeding lines, derived from 109 PIC populations specifically developed to combine abiotic and biotic stress tolerance, showed superior agronomic potential compared with checks and local landraces. The diversity, scale, and potential of the material in the PIC breeding pipeline is invaluable and requires continued support to ensure the release of varieties that promise to increase the productivity of common bean in the E. African region.
\nData available includes databases, spreadsheets, and images related to the project.
Resource Title: Data Dictionary.
File Name: ADP-1_DD.pdf
Resource Title: ADP-1 Database.
File Name: ADP1-DB.zip
Resource Description: This file is a link to a draft version of the development and characterization of the common bean diversity panel (ADP) database in Microsoft Access. Preliminary information is provided in this database, while the full version is being prepared. In order to use the database you’ll need to download the complete file, extract it and open the MS access file. You must allow active content when opening the database for it to work properly. Downloaded on November 17, 2017.
Resource Title: Anthracnose Screening of Andean Diversity Panel (ADP) .
File Name: Anthracnose-screening-of-ADP.pdf
Resource Description: Approximately 230 ADP lines of the ADP were screened with 8 races of anthracnose under controlled conditions at Michigan State University. Dr. James Kelly has provided this valuable dataset for sharing in light of the Open Data policy of the US government. This dataset represents the first comprehensive screening of the ADP with a broad set of races of a specific pathogen.
Resource Title: ARS - Feed the Future Shared Data .
File Name: ARS-FtF-Data-Sharing.zip
Resource Description: The data provided herein is an early draft version of the data that has been generated by the ARS Feed-the-Future Grain Legumes Project that is focused on common bean research.\n
Resource Title: PIC (Phaseolus Improvement Cooperative) Populations .
File Name: PIC-breeding-populations.xlsx
Resource Description: The complete list of PIC breeding populations (Excel Format)
\nPIC (Phaseolus Improvement Cooperative) populations are bulked populations for improvement of common bean in Feed the Future Countries, with a principal focus on sub-Saharan Africa. These populations are for distribution to collaborators, are segregating for key biotic and abiotic stress constraints, and can be used for selection and release of improved cultivars/germplasm. Many of these populations are derived from crosses between ADP landrances and cultivars from sub-Saharan Africa and other improved genotypes with key biotic or abiotic stress tolerance. Phenotypic and genotypic information related to the parents of the crosses can be found in the ADP Database.\n
Field 70/71 Study for Resilient Economic Agricultural Practices in Ames, Iowa\nSee REAP brochure
Resource Title: Ames, IA Field 70/71 Study (IAAM7071) CSV data.
File Name: IAAM7071_csv_data.zip
Resource Description: CSV format data on Experimental Units, Field Sites, Biomass, Harvest Fraction, Residue Management, Soil Chemistry, Soil Cover, Soil Physics, Amendments, Planting, Tillage, Persons, Treatments, Weather Daily, Weather Station.
Plastic tarps currently used during soil fumigation to control emissions have been shown to be permeable to fumigant vapors, resulting in appreciable losses to the atmosphere. New low-permeability films are being developed to reduce fumigant emissions and increase efficacy.
\nA rapid, reliable, and sensitive method is required to measure the permeability of various films that may be used in new management practices. This manuscript presents an approach for estimating the mass transfer coefficient (h) of fumigant compounds across agricultural films. The h is a measure of the resistance to diffusion which, unlike other measures of permeability, is a property of the film-chemical combination and independent of the concentration gradient across the film.
\nThis method uses static sealed cells; fumigant vapor is spiked to one side of the film and the concentrations on both sides of the film are monitored until equilibrium. An analytical model is fitted to the data to obtain h. This model relies on a mass balance approach and includes sorption to and diffusion across the film membrane. The method was tested using two polyethylene films and a very low-permeability film and showed that the method produces a sensitive and reproducible measure of film permeability.
Resource Title: FilmPC download page.
File Name: Web Page, url: https://www.ars.usda.gov/research/software/download/?softwareid=302&modecode=20-36-05-00
Flat Mites of the World provides a portal to a variety of keys, images, and fact sheets to help support identification of this diverse, potentially destructive group of mites.
\nIn Flat Mites of the World Edition 2, you will find interactive keys, fact sheets, descriptions, and images to aid in the identification of flat mites (Acari: Trombidiformes: Tetranychoidea: Tenuipalpidae) from the United States and around the world. Please note that this tool is a work in progress! The newest edition of the tool, updated as of May 2013, will help identify the 38 genera of flat mites present throughout the world, including specific diagnostics for 20 species of Raoiella, 19 species of Brevipalpus, 3 species of Cenopalpus, Dolichotetranychus floridanus, Tenuipalpus pacificus, T. crassulus, and a closely related new species T. nr crassulus. The genus Raoiella is of major concern to quarantine world-wide due to the rapid spread of one species, the red palm mite (RPM), R. indica Hirst. The genus Brevipalpus is the most commonly intercepted genus of Tenuipalpidae in quarantine world-wide, but it is also the most complicated and by far the most diverse genus in the family. The three most important species in the family world-wide, Brevipalpus californicus, B. obovatus and B. phoenicis, though still consistently confused and misidentified, can be identified using this tool, and the Brevipalpus phoenicis species complex has been further separated into seven cryptic species. Dolichotetranychus is increasingly diverse genus of monocot-associated flat mites. Here we present diagnostics for an economically important species associated with pineapple across the world, D. floridanus. Tenuipalpus is a hugely diverse and complicated genus. Tenuipalpus pacificus is the name most commonly applied, correctly or incorrectly, to species in the genus Tenuipalpus intercepted on orchids across the world. We provide diagnostics for T. pacificus, based on type material. A recent incursion in the USA of an unidentified Tenuipalpus mite near T. crassulus sparked our interest in providing diagnostics for these two flat mite species associated with succulent plants.
\nExotic species of flat mite pose a significant threat to USA’s biosecurity both as plant pests and as vectors of plant disease; however, the available diagnostics do not allow accurate and reliable identification of species. This tool is aimed at enhancing our diagnostic capabilities for key taxa and to ultimately allow plant protection and quarantine services to develop rapid solutions to serious biosecurity threats. The necessity to accurately and efficiently identify intercepted flat mites will increase as globalization increases. Flat Mites of the World provides a portal to a variety of keys, images, and fact sheets to help support identification of this diverse, potentially destructive group of mites.
\nThis tool is designed to help identify any flat mite to the taxonomic level of genus, and in some cases to species, without the need for expertise in the group. Target users include USDA-APHIS pest survey specialists, ports of entry inspectors, other inspection personnel, students, and scientists. The “Is it a flat mite?” page provides information on how to distinguish a flat mite from other members of the spider mite superfamily Tetranychoidea.
\nSlide mounted mites: A flat mite looks very different alive under a stereoscope compared to after it has been squashed flat and slide mounted. Often the 3D shape of the mite is lost in the process.
\nMicroscopy for mites: When dealing with mites, we are interested mainly in the morphology of surface structures, and DIC offers better interpretation of these features than phase contrast does.
\nThe key is designed for users with limited knowledge about the group to identify flat mites to genus (and to identify critical genera to species). All characters are best observed using DIC (differential interference contrast) on a compound microscope. Ideally the user should have access to a compound microscope with a magnification capacity of 1000X (10X eyepiece + 100X oil objective) with DIC. The microscope images provided in the key were taken using DIC, mostly at 1000X. We highly recommend the use of DIC over Phase Contrast for identifying mites as the optical properties of DIC allow a more accurate interpretation of mite morphology. Please see the “DIC VS Phase Contrast” page for more information.
\nResource Title: Flat Mites of the World.
File Name: Web Page, url: http://idtools.org/id/mites/flatmites/index.php
Food Intakes Converted to Retail Commodities Databases (FICRCD) provide data for foods consumed in the United States national dietary intake surveys at the retail commodity level. The survey foods are converted into 65 retail-level commodities. The commodities are grouped into eight major categories: Dairy Products; Fats and Oils; Fruits; Grains; Meat, Poultry, Fish and Eggs; Nuts; Caloric Sweeteners; and Vegetables, Dry Beans and Legumes.
\nThe Food Intakes Converted to Retail Commodities Databases were jointly developed by USDA's Agricultural Research Service (ARS) and Economic Research Service (ERS) for the following six surveys:
\nWhat We Eat in America, National Health and Nutrition Examination Survey 2007-2008.
\nResource Title: Food Intakes Converted to Retail Commodities Databases (FICRCD).
File Name: Web Page, url: https://www.ars.usda.gov/northeast-area/beltsville-md-bhnrc/beltsville-human-nutrition-research-center/food-surveys-research-group/docs/ficrcd-overview/
Web site of the Food Intakes Converted to Retail Commodities Databases (FICRCD), which provide data for foods consumed in the national dietary intake surveys at the retail commodity level. Provides links to Data Tables, Methodology and User Guide, and Factsheets.
USDA’s Food Patterns Equivalents Database (FPED) converts the foods and beverages in the Food and Nutrient Database for Dietary Studies to the 37 USDA Food Patterns components. The FPED was formerly known as the MyPyramid Equivalents Database.
The FPED serves as a unique research tool to evaluate food and beverage intakes of Americans with respect to the 2015-2020 Dietary Guidelines for Americans recommendations.
The Food Patterns are measured as cup equivalents of Fruit, Vegetables, and Dairy; ounce equivalents of Grains and Protein Foods; teaspoon equivalents of Added Sugars; gram equivalents of Solid Fats and Oils; and the number of Alcoholic Drinks.
In addition to the SAS datasets, the FPED release includes: (1) the Food Patterns Equivalents Ingredient Database (FPID) that includes the 37 USDA Food Patterns components per 100 grams of each unique ingredient used in the FNDDS; and (2) listings of gram weights for one cup equivalents of fruits, vegetables, dairy, and legumes used in the FPED.
\nResource Title: Food Patterns Equivalents Database.
File Name: Web Page, url: https://www.ars.usda.gov/northeast-area/beltsville-md-bhnrc/beltsville-human-nutrition-research-center/food-surveys-research-group/docs/fped-overview/
Food Patterns Equivalents Database (FPED) converts the foods and beverages in the Food and Nutrient Database for Dietary Studies to the 37 USDA Food Patterns components. The FPED serves as a unique research tool to evaluate food and beverage intakes of Americans with respect to the 2015-2020 Dietary Guidelines for Americans recommendations.
[Note: Integrated as part of FoodData Central, April 2019.]\nUSDA's Food and Nutrient Database for Dietary Studies (FNDDS) is a database that is used to convert food and beverages consumed in What We Eat In America (WWEIA), National Health and Nutrition Examination Survey (NHANES) into gram amounts and to determine their nutrient values. Because FNDDS is used to generate the nutrient intake data files for WWEIA, NHANES, it is not required to estimate nutrient intakes from the survey. FNDDS is made available for researchers using WWEIA, NHANES to review the nutrient profiles for specific foods and beverages as well as their associated portions and recipes. Such detailed information makes it possible for researchers to conduct enhanced analysis of dietary intakes. FNDDS can also be used in other dietary studies to code foods/beverages and amounts eaten and to calculate the amounts of nutrients/food components in those items.
\nFNDDS is released every two-years in conjunction with the WWEIA, NHANES dietary data release. The FNDDS is available for free download from the FSRG website.
\nResource Title: Website Pointer to Food and Nutrient Database for Dietary Studies.
File Name: Web Page, url: https://www.ars.usda.gov/northeast-area/beltsville-md-bhnrc/beltsville-human-nutrition-research-center/food-surveys-research-group/docs/fndds/
USDA's Food and Nutrient Database for Dietary Studies (FNDDS) is a database that is used to convert food and beverages consumed in What We Eat In America (WWEIA), National Health and Nutrition Examination Survey (NHANES) into gram amounts and to determine their nutrient values.
Several USDA food composition databases, including the Food and Nutrient Database for Dietary Studies (FNDDS), Standard Reference (SR) Legacy, and the USDA Branded Food Products Database, have transitioned to FoodData Central, a new and harmonized USDA food and nutrient data system. FoodData Central also includes expanded nutrient content information as well as links to diverse data sources that offer related agricultural, environmental, food, health, dietary supplement, and other information. The new system is designed to strengthen the capacity for rigorous research and policy applications through its search capabilities, downloadable datasets, and detailed documentation. Application developers can incorporate the information into their applications and web sites through the application programming interface (API) REST access.
\nThe constantly changing and expanding food supply is a challenge to those who are interested in using food and nutrient data. Including diverse types of data in one data system gives researchers, policymakers, and other audiences a key resource for addressing vital nutrition and health issues.
\nFoodData Central:
\nFoodData Central is managed by the Agricultural Research Service and hosted by the National Agricultural Library.
\nResource Title: Website Pointer for FoodData Central.
File Name: Web Page, url: https://fdc.nal.usda.gov/index.html
Includes Search, Download data, API Guide, Data Type Documentation, and Help pages.
Data were collected on the Central Plains Experimental Range (CPER) from 2014-2018, near Nunn, Colorado as part of the common experiments in grazinglands for the Long-Term Agroecosystem Research network. LTAR scientists seek to create new knowledge regarding sustainable management of grazinglands. This dataset on cattle foraging behavior and distribution provides new information towards understanding how management practices influence grazing livestock movements in space and time. The common experiment at CPER is called Collaborative Adaptive Rangeland Management (CARM) and is a ten-year ranch-scale (2,600-ha) social-ecological experiment designed to examine how adaptive rotations of a single large cattle herd among paddocks within a heterogeneous landscape during the growing season (collaborative, adaptive rangeland management; CARM) contrasts with continuous, season-long grazing of paddocks by small non-rotational herds (traditional rangeland management; TRM). Differences in movement patterns between the two treatments were examined with data collected from global positioning system tracking collars (Lotek 3300LR GPS) combined with activity sensors. These data were used to determine daily metrics of foraging behavior by steers in both treatments at five-minute intervals and include (1) location, (2) distance moved within 5 minutes, and (3) and grazing activity. These data are from the first half of the CARM experiment to support the publication, \"Adaptive, multi-paddock, rotational grazing management alters foraging behavior and spatial grazing distribution of free-ranging cattle.\"
\nResources in this dataset:
\nResource Title: Data dictionary for foraging activity and location data for cattle\nFile Name: DataDictionary_Template_nek.csv
\nResource Title: Foraging activity and location data for cattle in adaptive, multi-paddock, rotational grazing management\nFile Name: CARMappended2014_2018.csv\nResource Description: These data were used to determine daily metrics of foraging behavior by steers in both treatments at five-minute intervals and include (1) location, (2) distance moved within 5 minutes, and (3) and grazing activity.
\nResource Title: Foraging activity and location data for cattle in traditional grazing management\nFile Name: TRMappended2014_2018.csv\nResource Description: These data were used to determine daily metrics of foraging behavior by steers in both treatments at five-minute intervals and include (1) location, (2) distance moved within 5 minutes, and (3) and grazing activity.
\nFort Ellis Research and Extension Center Study for Greenhouse gas Reduction through Agricultural Carbon Enhancement network in Sidney, Montana\nSheep (Ovis aries L.) grazing is an inexpensive method of weed control in dryland cropping systems but little is known about its effect on net greenhouse gas (GHG) emissions. We evaluated the effect of sheep grazing compared to herbicide application for weed control on GHG (CO2, N2O, and CH4) emissions from May to October, 2010 and 2011, net global warming potential (GWP), and greenhouse gas intensity (GHGI) in a silt loam under dryland cropping systems in western Montana. Treatments were two fallow management practices (sheep grazing [GRAZ] and herbicide application [CHEM]) and three cropping sequences (continuous alfalfa [Medicago sativa L.] [CA], continuous spring wheat [Triticum aestivum L.] [CSW], and spring wheat-pea [Pisum sativum L.] /barley [Hordeum vulgaris L.] hay-fallow [W-P/B-F]). Gas samples were collected at 3 to 14 d intervals with a vented, static chamber. Regardless of treatments, GHG fluxes peaked immediately following substantial precipitation (>12 mm) and/or N fertilization mostly from May to August. Total CO2 flux from May to October was greater in GRAZ with CA, but total N2O flux was greater in CHEM and GRAZ with CSW than in other treatments. Total CH4 flux was greater in CA than in W-P/B-F. Net GWP and GHGI were greater in GRAZ with W-P/B-F than in most other treatments. Greater CH4 flux due to increased enteric fermentation as a result of longer duration of grazing during fallow, followed by reduced crop residue returned to the soil and/or C sequestration rate, probably increased net GHG flux in GRAZ with W-P/B-F. Sheep grazing on cropping sequence containing fallow may not reduce net GHG emissions compared to herbicide application for weed control on continuous crops.
Resource Title: GeoData catalog record.
File Name: Web Page, url: https://geodata.nal.usda.gov/geonetwork/srv/eng/catalog.search#/metadata/d9d64353-0b6d-4890-b27a-9278dd8678d1
We present the annotation results of 15 arthropod proteomes using an open source, open access and containerized pipeline for genome-scale functional annotation of insect proteomes and apply it to a diverse range of arthropod species. You can find more information about the pipeline at our readthedocs site. The files for each genome include GOanna, InterproScan and KOBAS predictions.
\nArthropod genomes selected for this study and their assembly and annotation statistics.
\nDiaphorina citri (Asian citrus psyllid)
\nResource Title: Cimex lectularius (Cimicidae bed bug) annotation.
File Name: CLEC.tar.gz
Resource Description: Functional annotation for Clec-OGSv1.2 protein set
Resource Title: Tribolium castaneum (red flour beetle) annotation.
File Name: TCAS.tar.gz
Resource Description: Functional annotation for TCAS_OGS_v3 protein set
Resource Title: Drosophila melanogaster (fruit fly) annotation.
File Name: DMEL.tar.gz
Resource Description: Functional annotation for DMEL_r6.38 protein set\n
Resource Title: Varroa destructor (parasitic mite) annotation.
File Name: VDES.tar.gz
Resource Description: Functional annotation for NCBI Varroa destructor Annotation Release 100 protein set based on Vdes_3.0 genome (GCA_002443255.1)
\nResource Title: Oncopeltus fasciatus (Large milkweed bug) annotation.
File Name: ONCFAS.tar.gz
Resource Description: Functional annotation for oncfas_OGSv1.2 protein set
Resource Title: Apis Mellifera (honey bee) annotation.
File Name: AMEL.tar.gz
Resource Description: Functional annotation for OGSv3.3 protein set from Amel_4.5 genome (GCA_000002195.1)
\nResource Title: Homalodisca vitripennis (Glassy-winged sharpshooter) annotation.
File Name: HVIT.tar.gz
Resource Description: Functional annotation for HVIT-BCM_version_0.5.3 protein set based on Hvit_1.0 genome (GCA_000696855.1)\n
Resource Title: Limnephilus lunatus (caddisfly) annotation.
File Name: LLUN.tar.gz
Resource Description: Functional annotation for LLUN-BCM_version_0.5.3 protein set from Llun_1.0 genome (GCA_000648945.1)
\nResource Title: Latrodectus hesperus (Western black widow spider) annotation.
File Name: LHES.tar.gz
Resource Description: Functional annotation for LHES-BCM_version_0.5.3 protein set from Lhes_1.0 genome (GCA_000697925.1)
\nResource Title: Eurytemora affinis (calanoid copepod) annotation.
File Name: EAFF.tar.gz
Resource Description: Functional annotation for EAFF-BCM_version_0.5.3 protein set from Eaff_1.0 genome (GCA_000591075.1)\n
Resource Title: Copidosoma floridanum (parasitoid wasp) annotation.
File Name: CFLO.tar.gz
Resource Description: Functional annotation for CFLO-BCM_version_0.5.3 protein set based on Cflo_1.0 genome (GCA_000648655.1)\n
Resource Title: Ceratitis capitata (Mediterranean fruit fly) annotation.
File Name: CCAP.tar.gz
Resource Description: Functional annotation for Ccap-OGSv1 protein set based on Ccap_1.1 assembly (GCA_000347755.2)
\nResource Title: Athalia rosae (turnip sawfly) annotation.
File Name: AROS.tar.gz
Resource Description: Functional annotation for AROS-BCM_version_0.5.3 protein set based on Aros_1.0 genome (GCA_000344095.1)
Resource Title: Agrilus planipennis (emerald ash borer) annotation.
File Name: APLA.tar.gz
Resource Description: Functional annotation for APLA-BCM_version_0.5.3 protein set based on Apla_1.0 genome (GCA_000699045.1)
The genosim package simulates genotypes, breeding values, and phenotypes; simulates DNA sequence read depth (numbers of A and B alleles); and resolves SNP conflicts between parent and offspring genotypes.
Resource Title: GENOSIM.
File Name: Web Page, url: https://www.ars.usda.gov/research/software/download/?softwareid=496&modecode=80-42-05-30
download page
Geopack is a comprehensive, user-friendly software package containing several computer programs for carrying out geostatistical analyses of spatially correlated data. The programs were written so that they can be used by scientists, engineers or regulators with little experience in geostatistical techniques and still satisfy the requirements of more advanced users. Using the programs, and spending a little time becoming familiar with geostatistics, the end-user should be able to include the geostatistical techniques in their work and research environment.
Resource Title: GEOPACK download page.
File Name: Web Page, url: https://www.ars.usda.gov/research/software/download/?softwareid=95&modecode=20-36-15-00
GOSSYM is a dynamic, process-level simulation model of cotton growth and yield. GOSSYM essentially is a materials balance model which keeps track of carbon and nitrogen in the plant and water and nitrogen in the soil root zone. GOSSYM predicts the response of the field crop to variations in the environment and to cultural inputs. Specifically, the model responds to weather inputs of daily total solar radiation, maximum and minimum air temperatures, daily total wind run, and rainfall and/or irrigation amount. The model also responds to cultural inputs such as preplant and withinseason applications of nitrogen fertilizer, row spacing and within row plant density as they affect total plant population, and cultivation practices.
", "title": "GOSSYM", "distribution": [], "license": "https://creativecommons.org/publicdomain/zero/1.0/", "bureauCode": [ "005:18" ], "modified": "2024-02-15", "publisher": { "@type": "org:Organization", "name": "Agricultural Research Service" }, "keyword": [ "computer software", "crop management", "farms", "crop models", "simulation models", "cotton", "models", "carbon", "nitrogen", "soil", "rhizosphere", "field crops", "weather", "solar radiation", "air temperature", "wind", "rain", "irrigation rates", "nitrogen fertilizers", "row spacing", "plant density" ] }, { "identifier": "10113/AA22566", "accessLevel": "public", "contactPoint": { "hasEmail": "mailto:Justin.Derner@ars.usda.gov", "fn": "Derner, Justin" }, "programCode": [ "005:040" ], "description": "GPFARM (Great Plains Framework for Agricultural Resource Management) is a simulation model computer application. It incorporates state of the art knowledge in agronomy, animal science, economics, weed science and risk management into a user-friendly, decision support tool. Producers, agricultural consultants, action agencies and scientists can utilize GPFARM to test alternative management strategies that may in turn lead to sustainable agriculture, a reduction in pollution, or maximum economic return. GPFARM Express contains default projects to allow users to quickly set up their operations.
\nGPFARM Decision Support System (DSS) Objective:\nDevelop a resource management decision support system (DSS) that is capable of simulating and analyzing 10-50 year farm/ranch production plans with respect to water, nutrient, and pest management along with their associated economic and environmental risks.
\nGPFARM DSS Benefits:\nGPFARM integrates state of the art agricultural science knowledge with associated economic and environmental analysis into a whole-enterprise evaluation. Results from the DSS provide agricultural consultants, producers, and action agencies with information for making management decisions that promote sustainable agriculture.
\nGPFARM provides feedback concerning the most effective technology and assists in determining areas requiring further research and development. This is an evolutionary process that ties research and technology transfer closely together.
\nGPFARM serves to bring scientists from different disciplines together with producers and consultants to solve complex problems in agriculture. Products within GPFARM:
\nSpatial data visualization tools.
\nResource Title: GPFARM.
File Name: Web Page, url: https://www.ars.usda.gov/research/software/download/?softwareid=234&modecode=30-12-30-25
download page
GRACEnet (Greenhouse gas Reduction through Agricultural Carbon Enhancement network) is a research program initiated in the early 2000s . Goals are to better quantify greenhouse gas GHG emissions from cropped and grazed soils under current management practices and to identify and further develop improved management practices that will enhance carbon (C) sequestration in soils, decrease GHG emissions, promote sustainability and provide a sound scientific basis for carbon credits and GHG trading programs. This program generates information that is needed by agro-ecosystem modelers, producers, program managers and policy makers. Coordinated multi-location field studies follow standardized protocols to compare net GHG emissions (carbon dioxide, nitrous oxide, methane), C sequestration, crop/forge yields, and broad environmental benefits under different management systems that:
\nMeet sustainable production and broad environmental benefit goals (including C sequestration, net GHG emissions, water, air and soil quality, etc.)
\nResource Title: GRACEnet Brochure 2016.
File Name: GRACENET brochure REVISED June 2017.pdf
Resource Title: Data Entry Template 2017.
File Name: DET_GRACEnet_REAP.zip
Resource Description: Includes Excel templates for Experiment description worksheets, Site characterization worksheets, Management worksheets, Measurement worksheets where experimental unit data are reported, and Information that may be useful to the user, including drop down lists of treatment specific information and ranges of expected values. General and introductory instructions, as well as a Data Validation check are also included.
Resource Title: GRACEnet Brochure 2017.
File Name: GRACENET brochure REVISED July 2017 final.pdf
Resource Title: GRACEnet-NUOnet Data Dictionary.
File Name: GRACEnet-NUOnet_DD.csv
Resource Title: GRACEnet Data Search.
File Name: natres.zip
Resource Description: The attached file contains data from all sites as of February 9, 2022. For an interactive and up to date version of data visit https://usdaars.maps.arcgis.com/apps/MapSeries/index.html?appid=b66de747da394ed5aeab07dc9f50e516
To help enhance USA soil health, and ensure a robust living soil component that sustains essential functions for healthy plants, animals, and environment, and ultimately provides food for a healthy society, the GRACEnet Soil Biology group are working together with the larger USDA-ARS GRACEnet community to provide soil biology component measurements across regions and to eliminate data gaps for GRACEnet and REAP efforts. The Soil Biology group is focused on efforts that foster method comparison and meta-analyses to allow researchers to better assess soil biology and soil health indicators that are most responsive to agricultural management and that reflect the ecosystems services associated with a healthy, functioning soil.
\nThe GRACEnet Soil Biology mission is to produce the soil biology data, including methods of identifying and quantifying specific organisms and processes they govern, that are needed to evaluate impacts on agroecosystems and sustainable agricultural practices. This data collection effort is being accomplished in a highly structured manner to support current and future soil health and antimicrobial resistance research initiatives. The outcomes of the efforts of this team will provide a common biological data platform for several ARS databases, including: GRACEnet/REAP, Nutrient Use and Outcome Network (NUOnet), Long-Term Agroecosystem Research (LTAR) network, soil biology (e.g., MyPhyloDB) databases, and others.
\nResource Title: Soil Biology Data Search.
File Name: Web Page, url: https://agcros-usdaars.opendata.arcgis.com/datasets?group_ids=091b86e9e44a4e948ef2aeae3c916ca5
This package contains gap-filled daily precipitation values for the 15 NPP sites at Jornada Basin LTER in southern New Mexico, USA. Sites were selected to represent the 5 major ecosystem types in the Chihuahuan Desert (upland grasslands, playa grasslands, mesquite-dominated shrublands, creosotebush-dominated shrublands, tarbush-dominated shrublands). For each ecosystem type, three sites were selected to represent the range in variability in production and plant diversity; thus the locations are not replicates. Gap-filled daily precipitation was calculated for the period from 1980 to 2019 at each site using the closest rain gauges that provided a minimum resolution of daily precipitation data. The Methods section and attached documents describe this in detail. The rain gauges used are described, with respect to their relationship to NPP sites, in the attached \"daily_gapfill_ppt_gauge_usage.csv\" file. Although automated weather stations became operational at all NPP sites in 2013 (except P-SMAL, in 2017), updates to this data package are ongoing and are intended to gap-fill any missing or invalid data from the weather stations.
Resource Title: Website Pointer to html file.
File Name: Web Page, url: https://portal.edirepository.org/nis/mapbrowse?scope=knb-lter-jrn&identifier=210425001
Webpage with information and links to data files for download
Gas Flux from Band Application (GF-Band) is an MS Excel spreadsheet tool that calculates the effective gas flux from soil of a multiple-band area to which manure or fertilizer has been applied in bands. One spreadsheet is for circular gas flux chambers and another is for rectangular chambers.
\nGreenhouse gases are emitted following application of manure and nitrogen‐containing fertilizers to soil. Manure and fertilizers are often applied in subsurface bands in the soil, or in bands on the soil surface. This article presents a method that has been developed for calculating the effective gas flux for a multiple‐band area to which manure or fertilizer has been applied in bands. The method has been developed for circular and rectangular flux chambers. In analyzing the method, a combination of CO2 gas fluxes from a field experiment that gave a relatively low whole‐plot effective flux and a combination that gave a relatively high whole‐plot effective flux were used. For the lower‐end flux situation, when the dimension of the flux chamber in the direction perpendicular to the band is considerably less than the band spacing, if the flux in a chamber that is centered on a band is assumed to be the whole‐plot effective flux, then this assumption would overestimate the actual whole‐plot effective flux by a considerable amount. The error of this type of assumption is reduced for the higher‐end flux situation, regardless of flux chamber dimensions, and is reduced when the lower‐end flux situation occurs and the dimension of the flux chamber in the direction perpendicular to the band is intermediate to nearly as large as the band spacing. The method in useful in calculating effective gas fluxes for whole plots to which manure or fertilizer has been band‐applied.
Resource Title: Gas Flux from Band Application.
File Name: Web Page, url: https://www.ars.usda.gov/research/software/download/?softwareid=291&modecode=60-10-05-00
download page
Fopius arisanus (Sonan) is a braconid wasp (subfamily Opiinae) and biological control agent of a broad range of tephritid fruit fly species, including the global pests Mediterranean fruit fly Ceratitis capitata and the Oriental fruit fly Bactrocera dorsalis. In an effort to create foundational genomic resources for this species, the complete genome and transcriptomes for several wasp life stages have been recently generated. Manual annotation of 55 viral genes and phylogenetic analysis revealed that F. arisanus has independently acquired a symbiotic virus related to alpha-nudiviruses.
Resource Title: FARI_manual_annotations_1-19-2018_gburke.
File Name: FARI_manual_annotations_1-19-2018_gburke.tar.gz
Resource Description: This set of data contains three fasta files (coding sequences, peptide sequences, and transcript sequences) from genes of viral origin annotated in the F. arisanus genome. A single gff3 file contains the annotations in tab delimited format.
The GSOR website describes the GSOR germplasm collection; provides information on how to donate to the collection and how to request from the collection.
Resource Title: Web Page.
File Name: Web Page, url: https://www.ars.usda.gov/southeast-area/stuttgart-ar/dale-bumpers-national-rice-research-center/docs/genetic-stocks-oryza-gsor-collection-home/
Genetic fingerprinting of 184 Aspergillus section Flavi isolates from Ethiopia screened with 24 Insertion/Deletion markers located within the aflatoxin-biosynthesis gene cluster. Each file name contains in this order: isolate number, marker number, range of base pairs on the aflatoxin-biosynthesis cluster where the marker is located, and well position within the 384 microplate used for capillary electrophoresis.
Resource Title: AFLC01.
File Name: 01AFC.zip
Resource Description: Genetic fingerprinting of 184 Aspergillus isolates from Ethiopia screened with Insertion/Deletion marker AFLC01.
Resource Title: AFLC02.
File Name: 02AFC.zip
Resource Description: Description: Genetic fingerprinting of 184 Aspergillus isolates from Ethiopia screened with Insertion/Deletion marker AFLC02
Resource Title: AFLC03.
File Name: 03AFC.zip
Resource Description: Description: Genetic fingerprinting of 184 Aspergillus isolates from Ethiopia screened with Insertion/Deletion marker AFLC03
Resource Title: AFLC04.
File Name: 04AFC.zip
Resource Description: Genetic fingerprinting of 184 Aspergillus isolates from Ethiopia screened with Insertion/Deletion marker AFLC04
Resource Title: AFLC05.
File Name: 05AFC.zip
Resource Description: Genetic fingerprinting of 184 Aspergillus isolates from Ethiopia screened with Insertion/Deletion marker AFLC05
Resource Title: AFLC06.
File Name: 06AFC.zip
Resource Description: Genetic fingerprinting of 184 Aspergillus isolates from Ethiopia screened with Insertion/Deletion marker AFLC06
Resource Title: AFLC07.
File Name: 07AFC.zip
Resource Description: Genetic fingerprinting of 184 Aspergillus isolates from Ethiopia screened with Insertion/Deletion marker AFLC07
Resource Title: AFLC08.
File Name: 08AFC.zip
Resource Description: Genetic fingerprinting of 184 Aspergillus isolates from Ethiopia screened with Insertion/Deletion marker AFLC08
Resource Title: AFLC09.
File Name: 09AFC.zip
Resource Description: Genetic fingerprinting of 184 Aspergillus isolates from Ethiopia screened with Insertion/Deletion marker AFLC09
Resource Title: AFLC10.
File Name: 10AFC.zip
Resource Description: Genetic fingerprinting of 184 Aspergillus isolates from Ethiopia screened with Insertion/Deletion marker AFLC10
Resource Title: AFLC11.
File Name: 11AFC.zip
Resource Description: Genetic fingerprinting of 184 Aspergillus isolates from Ethiopia screened with Insertion/Deletion marker AFLC11
Resource Title: AFLC12.
File Name: 12AFC.zip
Resource Description: Genetic fingerprinting of 184 Aspergillus isolates from Ethiopia screened with Insertion/Deletion marker AFLC12
Resource Title: AFLC13.
File Name: 13AFC.zip
Resource Description: Genetic fingerprinting of 184 Aspergillus isolates from Ethiopia screened with Insertion/Deletion marker AFLC13
Resource Title: AFLC14.
File Name: 14AFC.zip
Resource Description: Genetic fingerprinting of 184 Aspergillus isolates from Ethiopia screened with Insertion/Deletion marker AFLC14
Resource Title: AFLC15.
File Name: 15AFC.zip
Resource Description: Genetic fingerprinting of 184 Aspergillus isolates from Ethiopia screened with Insertion/Deletion marker AFLC15
Resource Title: AFLC16.
File Name: 16AFC.zip
Resource Description: Genetic fingerprinting of 184 Aspergillus isolates from Ethiopia screened with Insertion/Deletion marker AFLC16
Resource Title: AFLC17.
File Name: 17AFC.zip
Resource Description: Genetic fingerprinting of 184 Aspergillus isolates from Ethiopia screened with Insertion/Deletion marker AFLC17
Resource Title: AFLC18.
File Name: 18AFC.zip
Resource Description: Genetic fingerprinting of 184 Aspergillus isolates from Ethiopia screened with Insertion/Deletion marker AFLC18
Resource Title: AFLC19.
File Name: 19AFC.zip
Resource Description: Genetic fingerprinting of 184 Aspergillus isolates from Ethiopia screened with Insertion/Deletion marker AFLC19
Resource Title: AFLC20.
File Name: 20AFC.zip
Resource Description: Genetic fingerprinting of 184 Aspergillus isolates from Ethiopia screened with Insertion/Deletion marker AFLC20
Resource Title: AFLC21.
File Name: 21AFC.zip
Resource Description: Genetic fingerprinting of 184 Aspergillus isolates from Ethiopia screened with Insertion/Deletion marker AFLC21
Resource Title: AFLC22.
File Name: 22AFC.zip
Resource Description: Genetic fingerprinting of 184 Aspergillus isolates from Ethiopia screened with Insertion/Deletion marker AFLC22
Resource Title: AFLC23.
File Name: 23AFC.zip
Resource Description: Genetic fingerprinting of 184 Aspergillus isolates from Ethiopia screened with Insertion/Deletion marker AFLC23
Resource Title: AFLC24.
File Name: 24AFC.zip
Resource Description: Genetic fingerprinting of 184 Aspergillus isolates from Ethiopia screened with Insertion/Deletion marker AFLC24
Boxwood plants are affected by many different diseases caused by fungi. Some boxwood diseases are deadly and quickly kill the infected plants, but with others, the plant can survive and even thrive when infected. The fungus that causes volutella blight is the most common of these weak boxwood pathogens. Even the healthiest boxwood plants are infected by the volutella fungus, and often there are no signs that the plants are hurt by the infection. In order to understand why the volutella blight fungus is such a weak pathogen and to understand the genetic mechanisms it uses to interact with boxwood, the complete genome of the volutella fungus was sequenced and characterized. These datasets are generated from the genome sequence of Pseudonectria foliicola, strain ATCC13545, the fungus responsible for volutella disease of boxwood. Datasets include the nuclear genome and mitochondrial genome assemblies (sequenced using Illumina technology), the predicted gene model dataset generated using MAKER, the multiple sequence alignment of single-copy orthologs used for phylogenetic analysis, CMAP files generated from SimpleSynteny analysis of mitogenomes, and high quality photographic images.
Resource Title: Ab initio gene prediction for the draft genome assembly of Pseudonectria foliicola ATCC 13545.
File Name: PfoliicolamakerRun.all.maker.proteins.txt
Resource Description: Ab initio gene prediction for the draft genome assembly of Pseudonectria foliicola ATCC 13545 was performed using the MAKER2 v.2.31.6 annotation pipeline. Gene training was performed according to the program documentation using SNAP and AUGUSTUS v.3.2.1 (Stanke et al. 2004) using Fusarium graminearum as a model organism.
Resource Title: SimpleSynteny CMAP file of Pseudonectria foliicola mitogenome.
File Name: 1VB.cmap.txt
Resource Title: SimpleSynteny CMAP file of Dactylonectria macrodidyma mitogenome.
File Name: 2DM.cmap.txt
Resource Title: SimpleSynteny CMAP file of Fusarium graminearum mitogenome.
File Name: 3FG.cmap.txt
Resource Title: Genome assembly of Pseudonectria foliicola ATCC 13545 .
File Name: Volutella foliicola_ATCC13545_genome assembly.txt
Resource Description: The genome of Pseudonectria foliicola ATCC 13545 was sequenced on an Illumina MiSeq from gDNA used to construct a TruSeq Nano DNA LT Library. The library was sequenced on an Illumina MiSeq in two independent runs using paired-end 300-cycle reagent cartridge v.3 (Illumina, Inc.). Reads were processed and assembled using CLC Genomics Workbench version 7.5.1 (CLC Bio, Boston, MA, USA). Illumina adapters were trimmed and low quality reads (Phred score <0.05) were removed. Summary statistics for the draft genome were generated using CLC Genomics Workbench, PRINSEQ v.0.20.4 and QUAST. Completeness of the P. foliicola draft genome assembly was evaluated using BUSCO v.1.1b1
Resource Title: Photograph of Pseudonectria foliicola growing from boxwood leaf.
File Name: Pseudonectria_foliicola_leaf1.jpg
Resource Title: Photograph of Pseudonectria foliicola growing from boxwood leaf.
File Name: Pseudonectria_foliicola_leaf2.jpg
Resource Title: Multiple sequence alignment of single-copy orthologs.
File Name: All_OrthMCL2316_PHYLIP_alignment.txt
Resource Description: Fourteen publicly available fungal genomes were used to examine the phylogenetic placement of Pseudonectria foliicola through the analysis of single copy orthologous genes. For this analysis, the predicted proteomes of Aspergillus nidulans FGSC A4 (ASM114v1), Botrytis cinerea BcDW1 (Assembly GCA000349525), Fusarium graminearum PH-1 (GCA000240135), Macrophomina phaseolina MS6 (GCA000302655), Magnaporthe oryzeae 70-15 (MG8), Neurospora crassa (GCA000786625), Penicillium oxalicum 114-2 (GCA000346795), Pyrenophora tritici-repentis (GCA000149985), Sclerotinia sclerotiorum 1980 UF-70 (ASM1469v1), Trichoderma reesei RUT C-30 (GCA000513815), Ustilago maydis 521 (UM1), Verticillium dahliae JR2 (GCA000400815) and Yarrowia lipolytica CLIB122 (GCA000002525) were downloaded from the EnsemblFungi database (https://fungi.ensembl.org/index.html). The genome of the Dactylonectria macrodidyma JAC15-245 (NCBI GenBank accession JYGD00000000 was downloaded and used to generate gene models using the program MAKER. The program OrthoMCL identified 16,356 gene clusters, from which 1,884 orthologous genes were shared across all 15 fungal species. From these shared gene clusters, 1,511 orthologous genes were found as single copy genes and used for the phylogenetic analysis. All proteomes were searched against each other using BLASTp and clustered in orthologous gene sets using OrthoMCL v1.4 in the iPLANT Discovery Environment. Single copy genes found in all 15 fungal proteomes were extracted from the orthologous dataset and amino acid alignments were performed using MUSCLE v3.8.31. Gblocks v.0.91b was used to remove ambiguously aligned regions using less stringent settings. The final aligned dataset after removal of ambiguously aligned regions consists of 388.7 Mb. The alignment is provided in PHYLIP format.
Annotation data were generated from existing genome assemblies of Calonectria henricotiae JAC13-131 (aka P-10-5865) and C. pseudonaviculata JAC13-27 (aka CT1). Gene prediction and annotations were conducted using the Funannotate v1.8.1 pipeline (https://funannotate.readthedocs.io/en/latest/).
", "title": "Genome annotation data from Calonectria species", "distribution": [ { "@type": "dcat:Distribution", "downloadURL": "https://ndownloader.figshare.com/files/43375578", "format": "zip", "mediaType": "application/zip", "title": "Calonectria_henricotiae.zip" }, { "@type": "dcat:Distribution", "downloadURL": "https://ndownloader.figshare.com/files/43375581", "format": "zip", "mediaType": "application/zip", "title": "Calonectria_pseudonaviculata.zip" } ], "license": "https://www.usa.gov/publicdomain/label/1.0/", "bureauCode": [ "005:18" ], "modified": "2023-11-30", "publisher": { "@type": "org:Organization", "name": "Agricultural Research Service" }, "keyword": [ "plant pathogens", "fungal genome", "NP303", "data.gov", "ARS" ], "spatial": "{\"type\": \"MultiPoint\", \"coordinates\": [[-121.65521621704, 36.673263748673], [-121.60892128944, 36.672404846288]]}" }, { "identifier": "10.15482/USDA.ADC/1410184", "accessLevel": "public", "contactPoint": { "hasEmail": "mailto:joanne.crouch@ars.usda.gov", "fn": "Crouch, Jo Anne" }, "programCode": [ "005:040" ], "description": "Boxwood blight disease, caused by the fungi Calonectria henricotiae and C. pseudonaviculata, is an emergent threat to natural and managed landscapes worldwide.
\nBoxwood blight emerged for the first time in the U.K. during the 1990s, then spread rapidly throughout Europe. By 2011, the fungus that causes the disease, Calonectria pseudonaviculata, was found in the U.S., threatening an industry valued at $103 million annually and countless mature landscapes, some dating back to early Colonial times. Since the first U.S. outbreaks, boxwood blight has been identified from a total of 19 states that together comprise 62% of the total U.S. boxwood production. A second pathogen, C. henricotiae, was recently described from five European countries. Infection can be latent, and the pathogen may sequester in less susceptible boxwood cultivars. Because there are no curative treatments—fungicides are at best suppressive of symptoms—infected plants are rendered unfit for sale. If infected plants are not destroyed, they provide a long-lived source of inoculum that spreads the pathogen by spores or resistant survival structures in soil, air, or water. Our goal is to provide knowledge and tools needed to reduce the impact of boxwood blight on the green industry.
\nThis database includes genome datasets from Calonectria pathogens of boxwood and related species.
Resource Title: Genome assembly, Calonectria pseudonaviculata CBS 139707 (aka cpsCT01).
File Name: CT1_ALLPATHS.scaffolds_FINAL.txt
Resource Description: This assembly is also accessioned on NCBI GenBank under accession number PGGA00000000. The genome is contained in 27 contigs derived from Illumina and PacBio reads, depth of coverage 285x.
Resource Title: Draft genome assembly, Calonectria henricotiae NL009.
File Name: NL009contigs_FINAL111517.txt
Resource Description: This is a partial genome assembly for Calonectria henricotiae isolate NL009. The assembly is also accessioned on NCBI GenBank as PGSF00000000. Sequences were generated using Illumina MiSeq, total depth of coverage is 34x.
Resource Title: Draft genome assembly, Calonectria henricotiae isolate CB077.
File Name: CB77contigs_subset_FINAL111517.txt
Resource Description: This is a partial genome assembly of Calonectria henricotiae CB077, also accessioned on NCBI GenBank as PGSE00000000. The sequences were generated using an Illumina MiSeq, depth of coverage 30x.
Resource Title: Genome assembly, Calonectia leucothoes CBS 109166.
File Name: Cleucothes _contigs_032017REV1.txt
Resource Description: Draft genome assembly from Calonectria leucothoes CBS 109166, also accessioned on NCBI GenBank as NAJI00000000. The sequences were generated using an Illumina MiSeq, average depth of coverage 124x.
Resource Title: Genome assembly, Calonectria naviculata CBS 101121.
File Name: Cnaviculata_CBS101121 contig list_031017_FINAL2 (1).txt
Resource Description: Draft genome assembly of Calonectria naviculata CBS 101121, also accessioned on NCBI GenBank as NAGG00000000. The genomes was generated using an Illumina MiSeq, average depth of coverage 84x.
Resource Title: Calonectria pseudonaviculata CBS 139707, Gene model predictions (CDs).
File Name: CpseudonaviculataPredicted_CT1_CDS.txt
Resource Description: CDs file of gene models predicted using Coding Quarry 2
Resource Title: Calonectria pseudonaviculata CBS 139707, GFF file for gene model predictions.
File Name: CpseudonaviculataCT1PredictedPass.gff3.txt
Resource Description: Gene model predictions and GFF file generated using CodingQuarry2.
Resource Title: Draft genome assembly, Calonectria henricotiae CBS 138102 (aka CB045).
File Name: CB45Jelly1b_FINAL111717_FINAL.txt
Resource Description: This datatset contains a draft genome assembly for Calonectria henricotiae CBS 138102; these data are also accessioned on NCBI GenBank as JYJY00000000.
Resource Title: Genome assembly, Calonectria pseudonaviculata CBS 139394.
File Name: CBS 139394.txt
Resource Description: This file contains the draft genome assembly for Calonectria pseudonaviculata CBS 139394. The assembly is accessioned with NCBI GenBank, JYJY00000000
Resource Title: Draft genome assembly, Calonectria pseudonaviculata CBS 114417.
File Name: cbs114417contigs_FINAL_final112017.txt
Resource Title: Draft genome assembly, Calonectria pseudonaviculata cpsCT13.
File Name: cpsCT13_Final_FINAL111717.txt
Resource Title: Draft genome assembly Calonectria pseudonaviculata ICMP 14368.
File Name: ICMP14368FINAL112017_final.txt
Resource Title: Draft genome assembly, Calonectria pseudonaviculata NC-BB1.
File Name: NCBB1contigs_FINAL_final112017.txt
Resource Title: Draft genome assembly, Calonectria pseudonaviculata ODA1.
File Name: ODA1contigs_FINAL112117final.txt
Resource Title: Draft genome assembly, Calonectria henricotiae NL017.
File Name: NL017contigs_FINAL111717.txt
A subset of ~30 inbreds were evaluated in 2014 and 2015 to develop an image based ear phenotyping tool. The data is stored in CyVerse.
\nData types in this directory tree are: dimension and width profile data collected from scanned images of ears, cobs, and kernels collected from the Genomes To Fields (G2F) project cooperators. G2F is an umbrella initiative to support translation of maize (Zea mays) genomic information for the benefit of growers, consumers and society. This public-private partnership is building on publicly funded corn genome sequencing projects to develop approaches to understand the functions of corn genes and specific alleles across environments. Ultimately this information will be used to enable accurate prediction of the phenotypes of corn plants in diverse environments. There are many dimensions to the over-arching goal of understanding genotype-by-environment (GxE) interactions, including which genes impact which traits and trait components, how genes interact among themselves (GxG), the relevance of specific genes under different growing conditions, and how these genes influence plant growth during various stages of development.
Resource Title: CyVerse Genomes To Fields Inbred Ear Imaging 2017 dataset download.
File Name: Web Page, url: http://datacommons.cyverse.org/browse/iplant/home/shared/commons_repo/curated/Edgar_Spalding_G2F_Inbred_Ear_Imaging_June_2017
Dataset (csv, tar.gz) and metadata (BibTex/Endnote) downloads. See _readme.txt for file contents.
Phenotypic, genotypic, and environment data for the 2014 field season: The data is stored in CyVerse.
\nData types in this directory tree are: dimension and width profile data collected from scanned images of ears, cobs, and kernels collected from the Genomes To Fields (G2F) project cooperators. G2F is an umbrella initiative to support translation of maize (Zea mays) genomic information for the benefit of growers, consumers and society. This public-private partnership is building on publicly funded corn genome sequencing projects to develop approaches to understand the functions of corn genes and specific alleles across environments. Ultimately this information will be used to enable accurate prediction of the phenotypes of corn plants in diverse environments. There are many dimensions to the over-arching goal of understanding genotype-by-environment (GxE) interactions, including which genes impact which traits and trait components, how genes interact among themselves (GxG), the relevance of specific genes under different growing conditions, and how these genes influence plant growth during various stages of development.
Resource Title: CyVerse Genomes To Fields 2014 dataset download.
File Name: Web Page, url: http://datacommons.cyverse.org/browse/iplant/home/shared/commons_repo/curated/Carolyn_Lawrence_Dill_G2F_Nov_2016_V.3
Dataset (csv, h5, gz) and metadata (BibTex/Endnote) downloads. See _readme.txt for file contents.
Phenotypic, genotypic, and environment data for the 2015 field season: The data is stored in CyVerse.
\nData types in this directory tree are: hybrid and inbred agronomic and performance traits; inbred genotypic data; and environmental (soil, weather) data collected from the Genomes To Fields (G2F) project cooperators. G2F is an umbrella initiative to support translation of maize (Zea mays) genomic information for the benefit of growers, consumers and society. This public-private partnership is building on publicly funded corn genome sequencing projects to develop approaches to understand the functions of corn genes and specific alleles across environments. Ultimately this information will be used to enable accurate prediction of the phenotypes of corn plants in diverse environments. There are many dimensions to the over-arching goal of understanding genotype-by-environment (GxE) interactions, including which genes impact which traits and trait components, how genes interact among themselves (GxG), the relevance of specific genes under different growing conditions, and how these genes influence plant growth during various stages of development.
Resource Title: CyVerse Genomes To Fields 2015 dataset download.
File Name: Web Page, url: http://datacommons.cyverse.org/browse/iplant/home/shared/commons_repo/curated/Carolyn_Lawrence_Dill_G2F_Mar_2017
Dataset (csv) and metadata (BibTex, Endnote) data downloads. See _readme.txt for file contents.
Phenotypic, genotypic, and environment data for the 2016 field season: The data is stored in CyVerse.
\nData types in this directory tree are: hybrid and inbred agronomic and performance traits; inbred genotypic data; and environmental (soil, weather) data collected from the Genomes To Fields (G2F) project cooperators. G2F is an umbrella initiative to support translation of maize (Zea mays) genomic information for the benefit of growers, consumers and society. This public-private partnership is building on publicly funded corn genome sequencing projects to develop approaches to understand the functions of corn genes and specific alleles across environments. Ultimately this information will be used to enable accurate prediction of the phenotypes of corn plants in diverse environments. There are many dimensions to the over-arching goal of understanding genotype-by-environment (GxE) interactions, including which genes impact which traits and trait components, how genes interact among themselves (GxG), the relevance of specific genes under different growing conditions, and how these genes influence plant growth during various stages of development.
Resource Title: CyVerse Genomes To Fields 2016 dataset download.
File Name: Web Page, url: http://datacommons.cyverse.org/browse/iplant/home/shared/commons_repo/curated/GenomesToFields_G2F_2016_Data_Mar_2018
Dataset (csv) and metadata (BibTex, Endnote) data downloads. See _readme.txt for file contents.
These data are from soil salinity surveys conducted on California irrigated farmland between 1991 and 2017. The data consist of: (i.) geospatial field survey measurements of bulk soil electrical conductivity (ECa) and (ii.) laboratory determinations of soil salinity (ECe) and saturation percentage (SP) made on soil core sections extracted from the surveyed fields. The data consist of 277,624 ECa measurements and 8,575 ECe and SP determinations.
\nSoil bulk electrical conductivity (ECa) is relatively easy to measure in agricultural fields using electromagnetic induction (EMI) instrumentation. EMI instruments are readily mobilized and thus can be used to characterize in detail the spatial variability of ECa within fields (Corwin, 2005; 2008). ECa is a useful property because it often correlates with difficult-to-measure soil physical and chemical properties that affect crop production, including soil water content, clay percentage, bulk density, PH, and especially soil salinity. The standard quantitative measure of soil salinity is defined to be the electrical conductivity of the soil saturation paste extract, or ECe (U.S. Salinity Laboratory Staff, 1954). Saturation percentage (SP) is the dry-weight moisture percentage of the saturation paste.
\nThe data can be used to test and explore model relationships between ECe, SP, and ECa (EMv and EMh), as well as their spatial variability. In particular, the data may be useful for comparing and testing modeling approaches that account for both deterministic and random components of soil spatial variability at single-field and multi-field scales, and to support high-resolution digital soil mapping studies across irrigated lands.
\nData Files\nData are stored column-wise in two comma-delimited text files, ECe_USDA_ARS_USSL_v01.csv and ECa_USDA_ARS_USSL_v01.csv. Joining the files on the 'ID' column returns data for geolocations at which field measurements of ECa and laboratory determinations of ECe and SP both exist. For example:
\nECe <- read.csv('ECe_USDA_ARS_USSL_v01.csv')\nECa <- read.csv('ECa_USDA_ARS_USSL_v01.csv')\ndat <- plyr::join(ECe, ECa, 'ID')\nplot3D::scatter3D(dat$ECe, dat$EMv_grd, dat$EMh_grd, \n zlab='EMh (dS/m)', xlab='ECe (dS/m)',\n ylab='EMv (dS/m)', clab = c(\"dS/m\"), bty = \"b2\")The DATASET label in each file indicates the survey or field campaign from which the data are taken.
\nDATASET_1. Survey of the Broadview Water District in California performed by Corwin and co-workers in 1991 (Corwin et al, 1999). Data include: (i.) ECe and SP determinations on 1,889 soil samples (depths) from 315 soil cores (locations) and (ii.) 2613 ECa (EMv and EMh) field measurements. Data from this survey have been used previously for interpreting the spatial variability of soil salinity at the regional scale (Corwin, 2005).
\nDATASET_2. Survey of Coachella Valley, California farmland conducted between 2005 and 2008 and led by the Coachella Water District. Data consist of: (i.) ECe and SP determinations on 2,088 samples from 476 soil cores and (ii.) 133,037 ECa (EMv and EMh) measurements across the Coachella Valley. This dataset has been used in previous work for validating linear approaches to regional-scale ECa and ECe calibration (Corwin and Lesch, 2014).
\nDATASET_3. Survey led by Singh and colleagues across four fields in western San Joaquin Valley for the purpose of assessing environmental risk associated with saline drainage (Singh et al,. 2020). Data include: (i.) ECe and SP determinations on 1,080 samples from 273 soil cores and (ii.) 36,236 ECa (EMv and EMh) field measurements.
\nDATASET_4. Soil salinity survey led by USDA-ARS U.S. Salinity Laboratory between 2012 and 2013. The survey covered 21 fields in San Joaquin Valley, California. Data consist of: (i.) ECe and SP determinations on 1,634 samples from 180 soil cores and (ii.) 63,225 ECa (EMv and EMh) field measurements. These data were used previously for large scale soil salinity assessments and is described in detail by Scudiero et al. (2014).
\nDATASET_5. Data from surveys of 6 miscellaneous fields in California led by the USDA-ARS U.S. Salinity Laboratory. Data consist of: (i.) 244 determinations of ECe and SP on samples taken from 62 soil cores and (ii.) 62 corresponding ECa (EMv and EMh) field measurements.
\nDATASET_6. Soil salinity surveys led by the USDA-ARS U.S. Salinity Laboratory between 1999 and 2012. One field in southern San Joaquin Valley was assessed several times over many years. Data consist of: (i.) ECe and SP determinations on 1,640 samples from 239 soil cores and (ii.) 42,458 ECa (EMv and EMh) field measurements. These data have been used in previous works focusing on long-term and short-term monitoring and mapping of the spatial and temporal variability of soil salinity (Corwin, 2008, Corwin, 2012, Scudiero et al., 2017).
\nMajority funding provided by USDA-ARS Office of National Programs. Additional funding provided by Office of Naval Research (No. 3200001344), Coachella Valley Resource Conservation District (No. 09FG340003), and California Department of Water Resources (No. 4600011273).
\nReferences\nCorwin, D.L. (2005). Geospatial Measurement of Apparent Soil Electrical Conductivity for Characterizing Soil Spatial Variability. doi: 10.1201/9781420032086 (Chapter 18)
\nCorwin, D.L. (2008). Past, present, and future trends of soil electrical conductivity measurement using geophysical methods. Handbook of Agricultural Geophysics, CRC Press.
\nCorwin, D.L. (2012). Field-scale monitoring of the long-term impact and sustainability of drainage water reuse on the west side of California's San Joaquin Valley. Journal of Environmental Monitoring 14(6), 1576-1596. doi: 10.1039/c2em10796a.
\nCorwin, D.L., Carrillo, M.L.K., Vaughan, P.J., Rhoades, J.D., Cone, D.G. (1999). Evaluation of a GIS-linked model of salt loading to groundwater. Journal of Environmental Quality 28(2), 471-480. doi: 10.2134/jeq1999.00472425002800020012x.
\nCorwin, D.L., Lesch, S. (2014). A simplified regional-scale electromagnetic induction: Salinity calibration model using ANOCOVA modeling techniques. Geoderma. s 230-231. 288-295. 10.1016/j.geoderma.2014.03.019.
\nScudiero, E., Skaggs, T., Corwin, D.L. (2014). Regional Scale Soil Salinity Evaluation Using Landsat 7, Western San Joaquin Valley, California, USA. Geoderma Regional. 2-3. 82-90. 10.1016/j.geodrs.2014.10.004.
\nScudiero, E., Skaggs, T. H., Corwin, D. L. (2017). Simplifying field-scale assessment of spatiotemporal changes of soil salinity. Sci. Total Environ., 587–588:273–281. doi:10.1016/j.scitotenv.2017.02.136.
\nSingh, A., Quinn, N.W.T., Benes, S.E., Cassel, F. (2020). Policy-Driven Sustainable Saline Drainage Disposal and Forage Production in the Western San Joaquin Valley of California. Sustainability 12(16), 6362.
\nU.S. Salinity Laboratory Staff. 1954. Diagnosis and improvement of saline and alkali soils. USDA Agric. Handbook. 60. U.S. Gov. Print. Office, Washington, DC.
", "title": "Geospatial Measurements of Soil Electrical Conductivity, Soil Salinity, and Soil Saturation Percentage in Irrigated Farmland", "distribution": [ { "@type": "dcat:Distribution", "downloadURL": "https://ndownloader.figshare.com/files/44529974", "format": "csv", "mediaType": "application/csv", "title": "ECa_USDA_ARS_USSL_v01.csv" }, { "@type": "dcat:Distribution", "downloadURL": "https://ndownloader.figshare.com/files/44529980", "format": "csv", "mediaType": "text/plain", "title": "ECe_USDA_ARS_USSL_v01.csv" }, { "@type": "dcat:Distribution", "downloadURL": "https://ndownloader.figshare.com/files/44529983", "format": "txt", "mediaType": "text/plain", "title": "README_GeospMeasurementsSoil.txt" } ], "license": "https://creativecommons.org/publicdomain/zero/1.0/", "bureauCode": [ "005:18" ], "modified": "2024-02-16", "publisher": { "@type": "org:Organization", "name": "Agricultural Research Service" }, "keyword": [ "EARTH SCIENCE > AGRICULTURE > SOILS > SOIL SALINITY/SOIL SODICITY", "geospatial data", "NP211", "NP212", "NP216", "data.gov", "ARS" ], "spatial": "{\"type\": \"MultiPolygon\", \"coordinates\": [[[[-124.409591, 42.009518], [-124.409591, 32.534156], [-114.131489, 32.534156], [-114.131489, 42.009518], [-124.409591, 42.009518]]]]}" }, { "identifier": "10113/AA334963", "accessLevel": "public", "contactPoint": { "hasEmail": "mailto:gary.kinard@usda.gov", "fn": "Kinard, Gary" }, "programCode": [ "005:040" ], "description": "The Germplasm Resources Information Network (GRIN) is an online portal for information about agricultural genetic resources that are managed by the Agricultural Research Service of USDA, along with U.S. partnering organizations.
\nThe content includes general information about ARS animal, microbial and plant germplasm collections, most notably the U.S. National Plant Germplasm System (NPGS). The NPGS curates more than 600,000 active accessions of living plant material at 20 genebank locations around the U.S., and makes small quantities available globally to plant breeders and other professional scientists.
\nGRIN also documents activities of Crop Germplasm Committees (CGC) that support the NPGS. The CGCs are comprised of public and private sector subject matter experts for a given crop (there are currently 44 CGCs) who voluntarily provide input on technical and operational matters to the NPGS.
\nThe site includes two searchable datasets: the ARS Rhizobium collection and Plant Variety Protection Certificates. The Rhizobium collection is living bacteria that nodulate the roots of leguminous plants symbiotically to provide nitrogen fixation. Samples are available to research scientists globally upon request. The Plant Variety Protection (PVP) Certificates are issued by the Agricultural Marketing Service (AMS) of USDA to provide intellectual property protection to registered new varieties of plants that are propagated by seed or tubers. The GRIN site allows queries of PVPs by certificate number, name of the crop, variety name, or certificate holder, all using data provided by the AMS.
\nResource Title: Website Pointer for Germplasm Resources Information Network (GRIN).
File Name: Web Page, url: https://www.ars-grin.gov/
The purpose of this tool is to estimate daily precipitation patterns for a yearly cycle at any location on the globe. The user input is simply the latitude and longitude of the selected location. There is an embedded Zip Code search routine to find the latitude and longitude for US cities.
\nGlobalRainSIM forecasts the daily rainfall based upon two databases.The first was the average number of days in a month with precipitation (wet days) that were compiled and interpolated by Legates and Willmott (1990a and 1990b) with further improvements by Willmott and Matsuura (1995). The second database was the global average monthly precipitation data collected 1961-1990 and cross-validated by New et al. (1999). These two datasets were then used to establish the monthly precipitation totals and the frequency of precipitation in a month. The average precipitation event was calculated as the monthly mean divided by the number of wet days. This mean value was then randomly assigned to a day of the month looping through the number of wet days. In other words, if the average monthly rainfall was 10 mm/month with 5 average wet days, each rain event was 2 mm. This amount (2 mm) was then randomly assigned to 5 days of that month. The advantage of this tool is that a typical pattern of precipitation can be simulated for any global location arriving at an •average year• as a baseline case for comparison. This tool also outputs the daily rainfall as a file or can be easily embedded within another program.
Resource Title: Global RainSIM Verson 1.0.
File Name: Web Page, url: https://www.ars.usda.gov/research/software/download/?softwareid=227&modecode=50-60-05-00
download page
The purpose of this tool is to estimate daily maximum and minimum air temperatures for a yearly cycle at any location on the globe. Global TempSIM predicts the daily average air temperature based upon 30-yr (1961 • 1990) temperature records that were compiled and interpolated by Legates and Willmott (1990a and 1990b) with further improvements by Willmott and Matsuura (1995) (data located at http://climate.geog.udel.edu/~climate/).
Resource Title: Global TempSIM - Version 1.0.
File Name: Web Page, url: https://www.ars.usda.gov/research/software/download/?softwareid=158&modecode=50-60-05-00
download page
Global Warming Potential Study for Greenhouse gas Reduction through Agricultural Carbon Enhancement network in Mandan, North Dakota\nNo long-term evaluation of net global warming potential (GWP) for grassland ecosystems in the northern Great Plains (NGP) of North America has been reported. Given this need, we sought to determine net GWP for three grazing management systems located within the NGP. Grazing management systems included two native vegetation pastures (moderately grazed pasture [MGP], heavily grazed pasture [HGP]) and a heavily grazed crested wheatgrass [Agropyron desertorum (Fisch. ex. Link) Schult.] pasture (CWP) near Mandan, ND. Factors evaluated for their contribution to GWP included (i) CO2 emissions associated with N fertilizer production and application, (ii) literature-derived estimates of CH4 production for enteric fermentation, (iii) change in soil organic carbon (SOC) over 44 yr using archived soil samples, and (iv) soil–atmosphere N2O and CH4 fl uxes over 3 yr using static chamber methodology. Analysis of SOC indicated all pastures to be significant sinks for SOC, with sequestration rates ranging from 0.39 to 0.46 Mg C ha−1 yr−1. All pastures were minor sinks for CH4 (<2.0 kg CH4–C ha−1 yr−1). Greater N inputs within CWP contributed to annual N2O emission nearly threefold greater than HGP and MGP. Due to diff erences in stocking rate, CH4 production from enteric fermentation was nearly threefold less in MGP than CWP and HGP. When factors contributing to net GWP were summed, HGP and MGP were found to serve as net CO2equiv. sinks, while CWP was a net CO2equiv. source. Values for GWP and GHG intensity, however, indicated net reductions in GHG emissions can be most eff ectively achieved through moderate stocking rates on native vegetation in the NGP.
Resource Title: GeoData catalog record.
File Name: Web Page, url: https://geodata.nal.usda.gov/geonetwork/srv/eng/catalog.search#/metadata/0bc3b108-4663-47da-b9d8-918554c27b31
GrainGenes is a popular repository for information about genetic maps, mapping probes and primers, genes, alleles and QTLs for the following crops: wheat, barley, rye and oat.
\nDocumentation includes such data as primer sequences, polymorphism descriptions, genotype and trait scoring data, experimental protocols used, and photographs of marker polymorphisms, disease symptoms and mutant phenotypes. These data, curated with the help of many members of the research community, are integrated with sequence and bibliographic records selected from external databases and results of BLAST searches of the ESTs. Records are linked to corresponding records in other important databases, e.g. Gramene's EST homologies to rice BAC/PACs, TIGR's Gene Indices and GenBank. In addition to this information within the GrainGenes database itself, the GrainGenes homepage at http://wheat.pw.usda.gov provides many other community resources including publications (the annual newsletters for wheat, barley and oat, monographs and articles), individual datasets (mapping and QTL studies, polymorphism surveys, variety performance evaluations), specialized databases (Triticeae repeat sequences, EST unigene sets) and pages to facilitate coordination of cooperative research efforts in specific areas such as SNP development, EST-SSRs and taxonomy. The goal is to serve as a central point for obtaining and contributing information about the genetics and biology of these cereal crops
Resource Title: GrainGenes, the genome database for small-grain crops (main web site).
File Name: Web Page, url: http://wheat.pw.usda.gov/GG3/
GrainGenes is the primary repository for information about genetic maps, mapping probes and primers, genes, alleles and QTLs; crops are wheat, barley, rye and oat. Documentation includes such data as primer sequences, polymorphism descriptions, genotype and trait scoring data, experimental protocols used, and photographs of marker polymorphisms, disease symptoms and mutant phenotypes. These data, curated with the help of many members of the research community, are integrated with sequence and bibliographic records selected from external databases and results of BLAST searches of the ESTs. Records are linked to corresponding records in other important databases, e.g. Gramene's EST homologies to rice BAC/PACs, TIGR's Gene Indices and GenBank.
Gramene is a curated, open-source, integrated data resource for comparative functional genomics in crops and model plant species.
\nResource Title: The Gramene Database website.
File Name: Web Page, url: http://www.gramene.org/
Gramene is a curated, open-source, integrated data resource for comparative functional genomics in crops and model plant species. The Gramene database is freely available for download and use as long as Gramene is cited as the source (see http://www.gramene.org/cite). This includes the tools available at Gramene including but not limited to RiceCyc, CMap Viewer, Gramene Mart and the Genome Browser. When using Gramene or the information derived from Gramene databases, kindly acknowledge the Gramene project by citing the web address (http://www.gramene.org) and identifying the version of Gramene being used (identified on the Home page) and the date accessed.
Stilbenoid levels in resistant (Freedom) and susceptible (O39-16) grapevine rootstock roots, in plants that were healthy or infected with root knot nematodes (RKN).
Resource Title: Grapevine Root Stilbenoids and Induction by Root Knot Nematodes.
File Name: RKN induced grapevine root stilbenoids.xlsx
Resource Description: Comparison of the phenolic stilbenoids in roots of root-knot nematode susceptible (O39-16) and resistant (Freedom) grapevines
Grass-Cast: Experimental Grassland Productivity Forecast for the Great Plains
\nGrass-Cast uses almost 40 years of historical data on weather and vegetation growth in order to project grassland productivity in the Western U.S. More details on the projection model and method can be found at https://esajournals.onlinelibrary.wiley.com/doi/full/10.1002/ecs2.3280.
\nEvery spring, ranchers in the drought‐prone U.S. Great Plains face the same difficult challenge—trying to estimate how much forage will be available for livestock to graze during the upcoming summer grazing season. To reduce this uncertainty in predicting forage availability, we developed an innovative new grassland productivity forecast system, named Grass‐Cast, to provide science‐informed estimates of growing season aboveground net primary production (ANPP). Grass‐Cast uses over 30 yr of historical data including weather and the satellite‐derived normalized vegetation difference index (NDVI)—combined with ecosystem modeling and seasonal precipitation forecasts—to predict if rangelands in individual counties are likely to produce below‐normal, near‐normal, or above‐normal amounts of grass biomass (lbs/ac). Grass‐Cast also provides a view of rangeland productivity in the broader region, to assist in larger‐scale decision‐making—such as where forage resources for grazing might be more plentiful if a rancher’s own region is at risk of drought. Grass‐Cast is updated approximately every two weeks from April through July. Each Grass‐Cast forecast provides three scenarios of ANPP for the upcoming growing season based on different precipitation outlooks. Near real‐time 8‐d NDVI can be used to supplement Grass‐Cast in predicting cumulative growing season NDVI and ANPP starting in mid‐April for the Southern Great Plains and mid‐May to early June for the Central and Northern Great Plains. Here, we present the scientific basis and methods for Grass‐Cast along with the county‐level production forecasts from 2017 and 2018 for ten states in the U.S. Great Plains. The correlation between early growing season forecasts and the end‐of‐growing season ANPP estimate is >50% by late May or early June. In a retrospective evaluation, we compared Grass‐Cast end‐of‐growing season ANPP results to an independent dataset and found that the two agreed 69% of the time over a 20‐yr period. Although some predictive tools exist for forecasting upcoming growing season conditions, none predict actual productivity for the entire Great Plains. The Grass‐Cast system could be adapted to predict grassland ANPP outside of the Great Plains or to predict perennial biofuel grass production.
\nThis new experimental grassland forecast is the result of a collaboration between Colorado State University, U.S. Department of Agriculture (USDA), National Drought Mitigation Center, and the University of Arizona. Funding for this project was provided by the USDA Natural Resources Conservation Service (NRCS), USDA Agricultural Research Service (ARS), and the National Drought Mitigation Center.
\nWatch for updates on the Grass-Cast website or on Twitter (@PeckAgEc). Project Contact: Dannele Peck, Director of the USDA Northern Plains Climate Hub, at dannele.peck@ars.usda.gov or 970-744-9043.
Resource Title: Cattle weight gain.
File Name: Cattle_weight_gains.xlsx
Resource Description: Cattle weight gain data for Grass-Cast Database.
Resource Title: NDVI.
File Name: NDVI.xlsx
Resource Description: Annual NDVI growing season values for Grass-Cast sites. See readme for more information and NDVI_raw for the raw values.
Resource Title: NDVI_raw .
File Name: NDVI_raw.xlsx
Resource Description: Raw bimonthly NDVI values for Grass-Cast sites.
Resource Title: ANPP.
File Name: ANPP.xlsx
Resource Description: Dataset for annual aboveground net primary productivity (ANPP). Excel sheet is broken into two tabs, 1) 'readme' describing the data, 2) 'ANPP' with the actual data.
Resource Title: Grass-Cast_sitelist .
File Name: Grass-Cast_sitelist.xlsx
Resource Description: This provides a list of sites-studies that are currently incorporated into the Database as well as meta-data and contact info associated with the data sets. Includes a 'readme' tab and 'sitelist' tab.
Resource Title: Grass-Cast_AgDataCommons_overview.
File Name: Grass-Cast_AgDataCommons_download.html
Resource Description: Html document that shows database overview information. This document provides a glimpse of the data tables available within the data resource as well as respective meta-data tables.\nThe R script (R markdown, .Rmd format) that generates the html file, and can be used to upload the Grass-Cast associated Ag Data Commons data files can be downloaded at the 'Grass-Cast R script' zip folder. The Grass-Cast files still need to be locally downloaded before use, but we are looking to make a download automated.
Resource Title: Grass-Cast R script .
File Name: R_access_script.zip
Resource Description: R script (in Rmarkdown [Rmd] format) for uploading and looking at Grass-Cast data.
Greenhouse Gas Study for Greenhouse gas Reduction through Agricultural Carbon Enhancement network in Bowling Green, Kentucky\nAlternative N fertilizers that produce low greenhouse gas (GHG) emissions from soil are needed to reduce the impacts of agricultural practices on global warming potential (GWP). We quantified and compared growing season fluxes of N2O, CH4, and CO2resulting from applications of different N fertilizer sources, urea (U), urea-ammonium nitrate (UAN), ammonium nitrate (NH4 NO3), poultry litter, and commercially available, enhanced-efficiency N fertilizers as follows: polymer-coated urea (ESN), SuperU, UAN + AgrotainPlus, and poultry litter + AgrotainPlus in a no-till corn (Zea maysL.) production system. Greenhouse gas fluxes were measured during two growing seasons using static, vented chambers. The ESN delayed the N2O flux peak by 3 to 4 wk compared with other N sources. No significant differences were observed in N2O emissions among the enhanced-efficiency and traditional inorganic N sources, except for ESN in 2009. Cumulative growing season N2O emission from poultry litter was significantly greater than from inorganic N sources. The N2O loss (2-yr average) as a percentage of N applied ranged from 0.69% for SuperU to 4.5% for poultry litter. The CH4–C and CO2–C emissions were impacted by environmental factors, such as temperature and moisture, more than the N source. There was no significant difference in corn yield among all N sources in both years. Site specifics and climate conditions may be responsible for the differences among the results of this study and some of the previously published studies. Our results demonstrate that N fertilizer source and climate conditions need conideration when selecting N sources to reduce GHG emissions.
Resource Title: Bowling Green, KY Greenhouse Gas Study (KYBGGHG) CSV data.
File Name: KYBGGHG_csv_data.zip
Resource Description: CSV format data on Experimental Units, Field Sites, Greenhouse Gas Flux, Harvest Fraction, Nutrient Efficiency, Soil Chemistry, Soil Physics, Amendments, Planting, Persons, Treatments, Weather Daily, Weather Station.
CLImate GENerator (CLIGEN) is a stochastic weather generator that produces daily and sub-daily timeseries of weather variables. The resulting timeseries are statistically similar to observed timeseries considering various temporal scales and climate factors. This dataset consisting of CLIGEN inputs may be used to generate timeseries at any point in a 0.25 arc degree resolution grid covering South American and African continents. Estimated parameter values at each grid point are based on 20-year records taken from global climate datasets. Precipitation parameters are statistically downscaled from grid-scale to point-scale based on observations from globally distributed ground networks representing >10,000 stations. This dataset is intended for use in climate-related research in ungauged areas where observed climate records are unavailable.
\nThe data are formatted as CLIGEN .par files, which are the only required input for CLIGEN. The files are separated into Africa and South America folders containing n=40936 and n=24588 files, respectively. The files are labeled according to grid point lat/lon coordinates (WGS84) in decimal degrees. The labeling convention uses 'N' and 'E' (north, east) to represent coordinates with a positive sign and 'S' and 'W' (south, west) to represent coordinates with a negative sign.
Resource Title: Grid Files.
File Name: Grid Files.zip
Resource Description: CLIGEN input files (.par) for the South America and Africa grid.
Resource Title: Summary Table.
File Name: Summary Table.docx
Resource Description: Summary table that lists CLIGEN parameters and basic dataset characteristics of the gridded parameterization.
CLImate GENerator (CLIGEN) is a stochastic weather generator that produces daily and sub-daily timeseries of weather variables. This gridded CLIGEN parameterization complements existing coverage for South America and Africa by adding new coverage for Central America, the Caribbean, the Middle East, South Asia, Southeast Asia, Australia, New Zealand, and various islands. This parameterization used the methodology and trained machine learning models discussed in a dataset article by Fullhart et al. (2022), https://doi.org/10.1080/20964471.2022.2136610. The primary dataset for South America and Africa may also be found in Ag Data Commons at https://doi.org/10.15482/USDA.ADC/1524754.
The data are formatted as CLIGEN .par files, which are the only required input for CLIGEN. The files are contained in the \"Grid Files\" download with n=37105 files. The files are labeled according to grid point lat/lon coordinates (WGS84) in decimal degrees. The labeling convention uses 'N' and 'E' (north, east) to represent coordinates with a positive sign and 'S' and 'W' (south, west) to represent coordinates with a negative sign.
Resources in this dataset:
CLImate GENerator (CLIGEN) is a stochastic weather generator that produces weather time series for soil erosion modeling and various other applications. The generated time series are statistically similar to observed long-term time series. This gridded CLIGEN parameterization with 0.25° spatial resolution complements existing global coverages by filling in remaining gaps that existed in the northern hemisphere (see the map layer *.kmz file with all grid point locations). The coverage is largely represented by Canada, Europe, and Russia and encompasses countries north of ~40°N with no previous known coverage. The CLIGEN inputs may be used to generate daily precipitation, temperature, dewpoint, solar radiation, and wind time series, as well as sub-daily precipitation patterns. The gridded parameterization allows CLIGEN time series to be generated at any point the grid. In particular, the dataset can provide climate drivers for climate-related research in ungauged areas where observed climate records are unavailable.
\nThe data are formatted as CLIGEN *.par files, which are the only required input for CLIGEN. The files are contained in the \"Grid Files\" download with n=114,150 files corresponding to the total number of grid points. The files are labeled according to grid point lat/lon coordinates (WGS84) in decimal degrees. The labeling convention uses 'N' and 'E' (north, east) to represent coordinates with a positive sign and 'S' and 'W' (south, west) to represent coordinates with a negative sign.
", "title": "Gridded 20-year Parameterization of a Stochastic Weather Generator (CLIGEN) to Fill Gaps in Coverage in the Northern Hemisphere", "distribution": [ { "@type": "dcat:Distribution", "downloadURL": "https://ndownloader.figshare.com/files/44540807", "format": "zip", "mediaType": "application/zip", "title": "Grid Files_1.zip" }, { "@type": "dcat:Distribution", "downloadURL": "https://ndownloader.figshare.com/files/44540810", "format": "docx", "mediaType": "application/vnd.openxmlformats-officedocument.wordprocessingml.document", "title": "SummaryTable_0.docx" }, { "@type": "dcat:Distribution", "downloadURL": "https://ndownloader.figshare.com/files/44540813", "format": "kmz", "mediaType": "application/zip", "title": "Map_Layer_Gridpoints.kmz" } ], "license": "https://creativecommons.org/publicdomain/zero/1.0/", "bureauCode": [ "005:18" ], "modified": "2024-02-21", "publisher": { "@type": "org:Organization", "name": "Agricultural Research Service" }, "keyword": [ "Climate Change", "climatologyMeteorologyAtmosphere", "climate models", "soil erosion", "hydrology", "NP211", "data.gov", "ARS" ], "spatial": "{\"type\": \"Polygon\", \"coordinates\": [[[-140.185546875, 48.819524141945], [-93.251953125, 49.050470195294], [-82.177734375, 41.654445072031], [-65.654296875, 44.353314321515], [-11.77734375, 35.205233347515], [7.20703125, 39.397999595421], [17.138671875, 34.323023630488], [35.2880859375, 35.896837733825], [49.2626953125, 38.761579511757], [75.322265625, 38.837568258966], [87.01171875, 48.25028349849], [100.72265625, 42.322001080603], [120.76171875, 46.343135602602], [124.98046875, 52.291682562691], [134.12109375, 46.343135602602], [130.95703125, 31.686107579079], [156.62109375, 26.779943479945], [222.5390625, 43.125043167401], [220.4296875, 45.143304739488], [223.2421875, 46.126556302419], [224.296875, 85.051128779807], [-170.15625, 85.780167984207], [-170.5078125, 52.099756925757], [-139.5703125, 53.37677497506], [-140.185546875, 48.819524141945]]]}" }, { "identifier": "10.15482/USDA.ADC/1526355", "accessLevel": "public", "contactPoint": { "hasEmail": "mailto:steve.evett@usda.gov", "fn": "Evett, Steven R." }, "programCode": [ "005:040" ], "description": "This dataset consists of growth and yield data for each year when alfalfa was grown at the USDA-ARS Conservation and Production Laboratory (CPRL), Soil and Water Management Research Unit (SWMRU) research weather station, Bushland, Texas (Lat. 35.186714°, Long. -102.094189°, elevation 1170 m above MSL). Alfalfa was grown on two large, precision weighing lysimeters, each in the center of a 4.44 ha square field. The two square fields were themselves arranged with one directly north of and contiguous with the other. The two fields and lysimeters within each field were designated northeast (NE), and southeast (SE). Irrigation was by linear move sprinkler system in autumn 1995 when the alfalfa was planted through 1999. Irrigations were managed to replenish soil water used by the crop on a weekly or more frequent basis as determined by soil profile water content readings made with a neutron probe to 2.4-m depth in the field.\nThe growth and yield data include height, leaf area index, growth stage, total above-ground biomass, leaf and stem biomass, and final yield. Data are from replicate samples in the field and non-destructive (except for harvest) measurements on the weighing lysimeters. In most cases yield data are available from both manual sampling on replicate plots in each field and from machine harvest.\nThese datasets originate from research aimed at determining crop water use (ET), crop coefficients for use in ET-based irrigation scheduling based on a reference ET, crop growth, yield, harvest index, and crop water productivity as affected by irrigation method, timing, amount (full or some degree of deficit), agronomic practices, cultivar, and weather. Prior publications have focused on alfalfa ET, comparisons with \"tall crop\" reference ET, crop coefficients, and crop water productivity. Crop coefficients have been used by ET networks. The data have utility for testing simulation models of crop ET, growth, and yield, and for studies of reference ET methods.
\nResources in this dataset:
\nResource Title: 1999 Bushland, TX, east alfalfa growth and yield data.\nFile Name: 1999_alfalfa_plantgrowth&_yield.xlsx.\nResource Description: This dataset consists of growth and yield data the 1999 season when alfalfa was grown at the USDA-ARS Conservation and Production Laboratory (CPRL), Soil and Water Management Research Unit (SWMRU) research weather station, Bushland, Texas (Lat. 35.186714°, Long. -102.094189°, elevation 1170 m above MSL). Alfalfa was grown on two large, precision weighing lysimeters, each in the center of a 4.44 ha square field. The two square fields were themselves arranged with one directly north of and contiguous with the other. Fields and lysimeters within each field were designated northeast (NE), and southeast (SE). Irrigation was by linear move sprinkler system. Irrigations were managed to replenish soil water used by the crop on a weekly or more frequent basis as determined by soil profile water content readings made with a neutron probe to 2.4-m depth in the field. Irrigation management resulted in the crop being well watered and meeting reference “tall crop” conditions during periods before harvests.\nThe growth and yield data include plant height, leaf area index, growth stage, total above-ground biomass, leaf and stem biomass, and final yield. Data are from replicate samples in the field and non-destructive (except for final harvest) measurements on the weighing lysimeters. In most cases yield data are available from both manual sampling on replicate plots in each field and from machine harvest.\nThere is a single spreadsheet for the east (NE and SE) lysimeters and fields. The spreadsheets contain tabs for data and corresponding tabs for data dictionaries. Typically, there are separate data tabs and corresponding dictionaries for plant growth during the season, crop growth stage, plant population, manual harvest from replicate plots in each field and from lysimeter surfaces, and machine (combine) harvest. An Introduction tab explains the tab names and contents, lists the authors, explains conventions, and lists some relevant references.
\nResource Title: 1998 Bushland, TX, east alfalfa growth and yield data.\nFile Name: 1998_alfalfa_plantgrowth&_yield.xlsx.\nResource Description: As described above, for 1998 season.
\nResource Title: 1997 Bushland, TX, east alfalfa growth and yield data.\nFile Name: 1997_alfalfa_plantgrowth&_yield.xlsx.\nResource Description: As described above, for 1997 season.
\nResource Title: 1996 Bushland, TX, east alfalfa growth and yield data.\nFile Name: 1996_alfalfa_plantgrowth&_yield.xlsx.\nResource Description: As described above, for 1996 season.
\nThis dataset consists of growth and yield data for each year when maize (Zea mays, L., also known as corn in the United States) was grown for grain at the USDA-ARS Conservation and Production Laboratory (CPRL), Soil and Water Management Research Unit (SWMRU) research weather station, Bushland, Texas (Lat. 35.186714°, Long. -102.094189°, elevation 1170 m above MSL). Maize was grown for grain on four large, precision weighing lysimeters, each in the center of a 4.44 ha square field. The four square fields are themselves arranged in a larger square with the fields in four adjacent quadrants of the larger square. Fields and lysimeters within each field are thus designated northeast (NE), southeast (SE), northwest (NW), and southwest (SW). Irrigation was by linear move sprinkler system in 1989, 1990, and 1994. In 2013, 2016, and 2018, two lysimeters and their respective fields (NE and SE) were irrigated using subsurface drip irrigation (SDI), and two lysimeters and their respective fields (NW and SW) were irrigated by a linear move sprinkler system. Irrigations were managed to replenish soil water used by the crop on a weekly or more frequent basis as determined by soil profile water content readings made with a neutron probe to 2.4-m depth in the field. The growth and yield data include plant population density, height, plant row width, leaf area index, growth stage, total above-ground biomass, leaf and stem biomass, ear mass (when present), kernel number, and final yield. Data are from replicate samples in the field and non-destructive (except for final harvest) measurements on the weighing lysimeters. In most cases yield data are available from both manual sampling on replicate plots in each field and from machine harvest. These datasets originate from research aimed at determining crop water use (ET), crop coefficients for use in ET-based irrigation scheduling based on a reference ET, crop growth, yield, harvest index, and crop water productivity as affected by irrigation method, timing, amount (full or some degree of deficit), agronomic practices, cultivar, and weather. Prior publications have focused on maize ET, crop coefficients, and crop water productivity. Crop coefficients have been used by ET networks. The data have utility for testing simulation models of crop ET, growth, and yield and have been used by the Agricultural Model Intercomparison and Improvement Project (AgMIP), by OPENET, and by many others for testing, and calibrating models of ET that use satellite and/or weather data.
Resources in this dataset:
This dataset consists of growth and yield data for each season when upland cotton [Gossympium hirsutum (L.)] was grown for lint and seed at the USDA-ARS Conservation and Production Research Laboratory (CPRL), Soil and Water Management Research Unit (SWMRU), Bushland, Texas (Lat. 35.186714°, Long. -102.094189°, elevation 1170 m above MSL). In the 2000 through 2004, 2008, 2010, 2012, and 2020 seasons, cotton was grown on from one to four large, precision weighing lysimeters, each in the center of a 4.44 ha square field also planted to cotton. The square fields were themselves arranged in a larger square with four fields in four adjacent quadrants of the larger square. Fields and lysimeters within each field were thus designated northeast (NE), southeast (SE), northwest (NW), and southwest (SW). Cotton was grown on different combinations of fields in different years. When irrigated, irrigation was by linear move sprinkler system years before 2014, and by both sprinkler and subsurface drip irrigation in 2020. Irrigation protocols described as full were managed to replenish soil water used by the crop on a weekly or more frequent basis as determined by soil profile water content readings made with a neutron probe to 2.4-m depth in the field. Irrigation protocols described as deficit typically involved irrigation at rates established as percentages of full irrigation ranging from 33% to 75% depending on the year.
\nThe growth and yield data typically include plant population density, height, plant row width, leaf area index, growth stage, total above-ground biomass, leaf and stem biomass, boll mass (when present), lint mass, seed mass, final yield, and lint quality. Data are from replicate samples in the field and non-destructive (except for final harvest) measurements on the weighing lysimeters. In most cases yield data are available from only manual sampling on replicate plots in each field and lysimeters.
\nThese datasets originate from research aimed at determining crop water use (ET), crop coefficients for use in ET-based irrigation scheduling based on a reference ET, crop growth, yield, harvest index, and crop water productivity as affected by irrigation method, timing, amount (full or some degree of deficit), agronomic practices, cultivar, and weather. Prior publications have focused on cotton ET, crop coefficients, crop water productivity, and simulation modeling of crop water use, growth, and yield. Crop coefficients have been used by ET networks. The data have utility for testing simulation models of crop ET, growth, and yield and have been used for testing, and calibrating models of ET that use satellite and/or weather data.
\nSee the README for descriptions of each data file.
", "title": "Growth and Yield Data for the Bushland, Texas, Cotton Datasets", "distribution": [ { "@type": "dcat:Distribution", "downloadURL": "https://ndownloader.figshare.com/files/44540405", "format": "xlsx", "mediaType": "application/vnd.openxmlformats-officedocument.spreadsheetml.sheet", "title": "2000_East_Cotton_Growth_and_Yield-V3.xlsx" }, { "@type": "dcat:Distribution", "downloadURL": "https://ndownloader.figshare.com/files/44540408", "format": "xlsx", "mediaType": "application/vnd.openxmlformats-officedocument.spreadsheetml.sheet", "title": "2000_West_Cotton_Growth_and_Yield-V3.xlsx" }, { "@type": "dcat:Distribution", "downloadURL": "https://ndownloader.figshare.com/files/44540411", "format": "xlsx", "mediaType": "application/vnd.openxmlformats-officedocument.spreadsheetml.sheet", "title": "2001_East_Cotton_Growth_and_Yield-V3.xlsx" }, { "@type": "dcat:Distribution", "downloadURL": "https://ndownloader.figshare.com/files/44540414", "format": "xlsx", "mediaType": "application/vnd.openxmlformats-officedocument.spreadsheetml.sheet", "title": "2001_West_Cotton_Growth_and_Yield-V3.xlsx" }, { "@type": "dcat:Distribution", "downloadURL": "https://ndownloader.figshare.com/files/44540417", "format": "xlsx", "mediaType": "application/vnd.openxmlformats-officedocument.spreadsheetml.sheet", "title": "2002_East_Cotton_Growth_and_Yield-V3.xlsx" }, { "@type": "dcat:Distribution", "downloadURL": "https://ndownloader.figshare.com/files/44540420", "format": "xlsx", "mediaType": "application/vnd.openxmlformats-officedocument.spreadsheetml.sheet", "title": "2003_S_West_Cotton_Growth_and_Yield-V3.xlsx" }, { "@type": "dcat:Distribution", "downloadURL": "https://ndownloader.figshare.com/files/44540423", "format": "xlsx", "mediaType": "application/vnd.openxmlformats-officedocument.spreadsheetml.sheet", "title": "2004 N West_Cotton_Growth_and_Yield-V3.xlsx" }, { "@type": "dcat:Distribution", "downloadURL": "https://ndownloader.figshare.com/files/44540426", "format": "xlsx", "mediaType": "application/vnd.openxmlformats-officedocument.spreadsheetml.sheet", "title": "2008_East_Cotton_Growth_and_Yield-V3.xlsx" }, { "@type": "dcat:Distribution", "downloadURL": "https://ndownloader.figshare.com/files/44540429", "format": "xlsx", "mediaType": "application/vnd.openxmlformats-officedocument.spreadsheetml.sheet", "title": "2008_West_Cotton_Growth_and_Yield-V3.xlsx" }, { "@type": "dcat:Distribution", "downloadURL": "https://ndownloader.figshare.com/files/44540432", "format": "xlsx", "mediaType": "application/vnd.openxmlformats-officedocument.spreadsheetml.sheet", "title": "2010_East_Cotton_Growth_and_Yield-V3.xlsx" }, { "@type": "dcat:Distribution", "downloadURL": "https://ndownloader.figshare.com/files/44540435", "format": "xlsx", "mediaType": "application/vnd.openxmlformats-officedocument.spreadsheetml.sheet", "title": "2012_West_Cotton_Growth_and_Yield-V3.xlsx" }, { "@type": "dcat:Distribution", "downloadURL": "https://ndownloader.figshare.com/files/44540438", "format": "xlsx", "mediaType": "application/vnd.openxmlformats-officedocument.spreadsheetml.sheet", "title": "2020_East_Cotton_Growth_and_Yield-V3.xlsx" }, { "@type": "dcat:Distribution", "downloadURL": "https://ndownloader.figshare.com/files/44540441", "format": "xlsx", "mediaType": "application/vnd.openxmlformats-officedocument.spreadsheetml.sheet", "title": "2020_West_Cotton_Growth_and_Yield-V3.xlsx" }, { "@type": "dcat:Distribution", "downloadURL": "https://ndownloader.figshare.com/files/44540444", "format": "txt", "mediaType": "text/plain", "title": "Cotton_Growth_and_Yield_README_0.txt" } ], "license": "https://creativecommons.org/publicdomain/zero/1.0/", "bureauCode": [ "005:18" ], "modified": "2024-04-04", "publisher": { "@type": "org:Organization", "name": "Agricultural Research Service" }, "accrualPeriodicity": "irregular", "keyword": [ "NP211", "Evapotranspiration", "growth and yield", "cotton", "cotton seed", "Fiber quality", "cotton fiber", "data.gov", "ARS" ], "spatial": "{\"type\": \"Polygon\", \"coordinates\": [[[-102.09906463948, 35.191719970106], [-102.07671433134, 35.19121493622], [-102.07678299485, 35.1865853205], [-102.07609634934, 35.177044674547], [-102.09913330298, 35.177072738625], [-102.09906463948, 35.191719970106]]]}" }, { "identifier": "10.15482/USDA.ADC/1528670", "accessLevel": "public", "contactPoint": { "hasEmail": "mailto:steve.evett@usda.gov", "fn": "Evett, Steven R." }, "programCode": [ "005:040" ], "description": "This dataset consists of growth and yield data for each season when soybean [Glycine max (L.) Merr.] was grown for seed at the USDA-ARS Conservation and Production Laboratory (CPRL), Soil and Water Management Research Unit (SWMRU) research weather station, Bushland, Texas (Lat. 35.186714°, Long. -102.094189°, elevation 1170 m above MSL). In the 1994, 2003, 2004, and 2010 seasons, soybean was grown on two large, precision weighing lysimeters, each in the center of a 4.44 ha square field. In 2019, soybean was grown on four large, precision weighing lysimeters and their surrounding 4.4 ha fields. The square fields are themselves arranged in a larger square with four fields in four adjacent quadrants of the larger square. Fields and lysimeters within each field are thus designated northeast (NE), southeast (SE), northwest (NW), and southwest (SW). Soybean was grown on different combinations of fields in different years. Irrigation was by linear move sprinkler system in 1995, 2003, 2004, and 2010 although in 2010 only one irrigation was applied to establish the crop after which it was grown as a dryland crop. Irrigation protocols described as full were managed to replenish soil water used by the crop on a weekly or more frequent basis as determined by soil profile water content readings made with a neutron probe to 2.4-m depth in the field. Irrigation protocols described as deficit typically involved irrigations to establish the crop early in the season, followed by reduced or absent irrigations later in the season (typically in the later winter and spring).\nThe growth and yield data include plant population density, height, plant row width, leaf area index, growth stage, total above-ground biomass, leaf and stem biomass, head mass (when present), kernel or seed number, and final yield. Data are from replicate samples in the field and non-destructive (except for final harvest) measurements on the weighing lysimeters. In most cases yield data are available from both manual sampling on replicate plots in each field and from machine harvest. Machine harvest yields are commonly smaller than hand harvest yields due to combine losses.\nThese datasets originate from research aimed at determining crop water use (ET), crop coefficients for use in ET-based irrigation scheduling based on a reference ET, crop growth, yield, harvest index, and crop water productivity as affected by irrigation method, timing, amount (full or some degree of deficit), agronomic practices, cultivar, and weather. Prior publications have focused on soybean ET, crop coefficients, and crop water productivity. Crop coefficients have been used by ET networks. The data have utility for testing simulation models of crop ET, growth, and yield and have been used for testing, and calibrating models of ET that use satellite and/or weather data.
\nSee the README for descriptions of each data file.
Resource Title: 1995 Bushland, TX, west soybean growth and yield data.
File Name: 1995 West Soybean_Growth_and_Yield-V2.xlsx
Resource Title: 2003 Bushland, TX, east soybean growth and yield data.
File Name: 2003 East Soybean_Growth_and_Yield-V2.xlsx
Resource Title: 2004 Bushland, TX, east soybean growth and yield data.
File Name: 2004 East Soybean_Growth-and_Yield-V2.xlsx
Resource Title: 2019 Bushland, TX, east soybean growth and yield data.
File Name: 2019 East Soybean_Growth_and_Yield-V2.xlsx
Resource Title: 2019 Bushland, TX, west soybean growth and yield data.
File Name: 2019 West Soybean_Growth_and_Yield-V2.xlsx
Resource Title: 2010 Bushland, TX, west soybean growth and yield data.
File Name: 2010 West_Soybean_Growth_and_Yield-V2.xlsx
Resource Title: README.
File Name: README_Soybean_Growth_and_Yield.txt
This dataset consists of growth and yield data for each season when sunflower (Helianthus annuus L.) was grown for seed at the USDA-ARS Conservation and Production Laboratory (CPRL), Soil and Water Management Research Unit (SWMRU) research weather station, Bushland, Texas (Lat. 35.186714°, Long. -102.094189°, elevation 1170 m above MSL). In each season, sunflower was grown on two large, precision weighing lysimeters, each in the center of a 4.44 ha square field. The square fields are themselves arranged in a larger square with four fields in four adjacent quadrants of the larger square. Fields and lysimeters within each field are thus designated northeast (NE), southeast (SE), northwest (NW), and southwest (SW). Sunflower was grown in the NE and SE fields. Irrigation was by linear move sprinkler system. Irrigation protocols described as full were managed to replenish soil water used by the crop on a weekly or more frequent basis as determined by soil profile water content readings made with a neutron probe to 2.4-m depth in the field. Irrigation protocols described as deficit typically involved irrigations to establish the crop early in the season, followed by reduced or absent irrigations later in the season (typically in the later winter and spring).\nThe growth and yield data include plant population density, height, plant row width, leaf area index, growth stage, total above-ground biomass, leaf and stem biomass, head mass (when present), kernel number, and final yield. Data are from replicate samples in the field and non-destructive (except for final harvest) measurements on the weighing lysimeters. In most cases yield data are available from both manual sampling on replicate plots in each field and from machine harvest.\nThese datasets originate from research aimed at determining crop water use (ET), crop coefficients for use in ET-based irrigation scheduling based on a reference ET, crop growth, yield, harvest index, and crop water productivity as affected by irrigation method, timing, amount (full or some degree of deficit), agronomic practices, cultivar, and weather. Prior publications have focused on sunflower ET, crop coefficients, and crop water productivity. Crop coefficients have been used by ET networks. The data have utility for testing simulation models of crop ET, growth, and yield and have been used for testing, and calibrating models of ET that use satellite and/or weather data.
Resource Title: 2009 Bushland, TX, east sunflower growth and yield data.
File Name: 2009_East_Sunflower_Growth_and_Yield.xlsx
Resource Description: This dataset consists of growth and yield data the 2009 season when sunflower (Helianthus annuus L.) was grown at the USDA-ARS Conservation and Production Laboratory (CPRL), Soil and Water Management Research Unit (SWMRU) research weather station, Bushland, Texas (Lat. 35.186714°, Long. -102.094189°, elevation 1170 m above MSL). Sunflower was grown on two large, precision weighing lysimeters, each in the center of a 4.44 ha square field. The two square fields were themselves arranged with one directly north of and contiguous with the other. Fields and lysimeters within each field were designated northeast (NE), and southeast (SE). Irrigation was by linear move sprinkler system. Irrigations were managed to replenish soil water used by the crop on a weekly or more frequent basis as determined by soil profile water content readings made with a neutron probe to 2.4-m depth in the field. Irrigation management resulted in the crop being well watered and meeting reference “tall crop” conditions during periods before harvests.\nThe growth and yield data include plant height, plant row width, leaf area index, growth stage, total above-ground biomass, leaf and stem biomass, and final yield. Data are from replicate samples in the field and non-destructive (except for final harvest) measurements on the weighing lysimeters. In most cases yield data are available from both manual sampling on replicate plots in each field and from machine harvest.\nThere is a single spreadsheet for the east (NE and SE) lysimeters and fields. The spreadsheet contains tabs for data and corresponding tabs for data dictionaries. There are separate data tabs and corresponding dictionaries for plant growth during the season, and manual harvest from replicate plots in each field and from lysimeter surfaces, and machine (combine) harvest, An Introduction tab explains the tab names and contents, lists the authors, explains conventions, and lists some relevant references.
Resource Title: 2011 Bushland, TX, east sunflower growth and yield data.
File Name: 2011_East_Sunflower_Growth_and_Yield.xlsx
Resource Description: This dataset consists of growth and yield data the 2011 season when sunflower (Helianthus annuus L.) was grown at the USDA-ARS Conservation and Production Laboratory (CPRL), Soil and Water Management Research Unit (SWMRU) research weather station, Bushland, Texas (Lat. 35.186714°, Long. -102.094189°, elevation 1170 m above MSL). Sunflower was grown on two large, precision weighing lysimeters, each in the center of a 4.44 ha square field. The two square fields were themselves arranged with one directly north of and contiguous with the other. Fields and lysimeters within each field were designated northeast (NE), and southeast (SE). Irrigation was by linear move sprinkler system. Irrigations were managed to replenish soil water used by the crop on a weekly or more frequent basis as determined by soil profile water content readings made with a neutron probe to 2.4-m depth in the field. Irrigation management resulted in the crop being well watered and meeting reference “tall crop” conditions during periods before harvests.\nThe growth and yield data include plant height, plant row width, leaf area index, growth stage, total above-ground biomass, leaf and stem biomass, and final yield. Data are from replicate samples in the field and non-destructive (except for final harvest) measurements on the weighing lysimeters. In most cases yield data are available from both manual sampling on replicate plots in each field and from machine harvest.\nThere is a single spreadsheet for the east (NE and SE) lysimeters and fields. The spreadsheet contains tabs for data and corresponding tabs for data dictionaries. There are separate data tabs and corresponding dictionaries for plant growth during the season, and manual harvest from replicate plots in each field and from lysimeter surfaces, and machine (combine) harvest, An Introduction tab explains the tab names and contents, lists the authors, explains conventions, and lists some relevant references.
This dataset consists of growth and yield data for each season when winter wheat (Triticum aestivum L.) was grown for grain at the USDA-ARS Conservation and Production Laboratory (CPRL), Soil and Water Management Research Unit (SWMRU) research weather station, Bushland, Texas (Lat. 35.186714°, Long. -102.094189°, elevation 1170 m above MSL). In each season, winter wheat was grown for grain on two large, precision weighing lysimeters, each in the center of a 4.44 ha square field. The square fields are themselves arranged in a larger square with the fields in four adjacent quadrants of the larger square. Fields and lysimeters within each field are thus designated northeast (NE), southeast (SE), northwest (NW), and southwest (SW). Irrigation was by linear move sprinkler system. Irrigation protocols described as full were managed to replenish soil water used by the crop on a weekly or more frequent basis as determined by soil profile water content readings made with a neutron probe to 2.4-m depth in the field. Irrigation protocols described as deficit typically involved irrigations to establish the crop early in the season, followed by reduced or absent irrigations later in the season (typically in the later winter and spring).\nThe growth and yield data include plant population density, height (except in 1989-1990), plant row width, leaf area index, growth stage, total above-ground biomass, leaf and stem biomass, head mass (when present), kernel number, and final yield. Data are from replicate samples in the field and non-destructive (except for final harvest) measurements on the weighing lysimeters. In most cases yield data are available from both manual sampling on replicate plots in each field and from machine harvest.\nThese datasets originate from research aimed at determining crop water use (ET), crop coefficients for use in ET-based irrigation scheduling based on a reference ET, crop growth, yield, harvest index, and crop water productivity as affected by irrigation method, timing, amount (full or some degree of deficit), agronomic practices, cultivar, and weather. Prior publications have focused on winter wheat ET, crop coefficients, and crop water productivity. Crop coefficients have been used by ET networks. The data have utility for testing simulation models of crop ET, growth, and yield and have been used by the Agricultural Model Intercomparison and Improvement Project (AgMIP) and by many others for testing, and calibrating models of ET that use satellite and/or weather data.
Resource Title: 1989-1990 Bushland, TX, west winter wheat growth and yield data.
File Name: 1989-1990_West_Wheat_Growth_and_Yield.xlsx
Resource Description: This dataset consists of growth and yield data the 1989-1990 winter wheat (Triticum aestivum L.) season at the USDA-ARS Conservation and Production Laboratory (CPRL), Soil and Water Management Research Unit (SWMRU) research weather station, Bushland, Texas (Lat. 35.186714°, Long. -102.094189°, elevation 1170 m above MSL). Winter wheat was grown on two large, precision weighing lysimeters, each in the center of a 4.44 ha square field. The two square fields were themselves arranged with one directly north of and contiguous with the other. Fields and lysimeters within each field were designated northwest (NW), and southwest (SW). Irrigation was by linear move sprinkler system. Irrigations described as full were managed to replenish soil water used by the crop on a weekly or more frequent basis as determined by soil profile water content readings made with a neutron probe to 2.4-m depth in the field. Irrigation described as deficit typically involved irrigation to establish the crop in the autumn followed by reduced or no irrigation later in the late winter or spring.\nThe growth and yield data include plant height (except in 1989-1990), leaf area index, growth stage, total above-ground biomass, leaf and stem biomass, hea biomass, and final yield. Data are from replicate samples in the field and non-destructive (except for final harvest) measurements on the weighing lysimeters. In most cases yield data are available from both manual sampling on replicate plots in each field and from machine harvest.\nThere is a single spreadsheet for the west (NW and SW) lysimeters and fields. The spreadsheets contain tabs for data and corresponding tabs for data dictionaries. Typically, there are separate data tabs and corresponding dictionaries for plant growth during the season, crop growth stage, plant population, manual harvest from replicate plots in each field and from lysimeter surfaces, and machine (combine) harvest, An Introduction tab explains the tab names and contents, lists the authors, explains conventions, and lists some relevant references.
Resource Title: 1991-1992 Bushland, TX, east winter wheat growth and yield data.
File Name: 1991-1992_East_Wheat_Growth_and_Yield.xlsx
Resource Description: This dataset consists of growth and yield data the 1991-1992 winter wheat (Triticum aestivum L.) season at the USDA-ARS Conservation and Production Laboratory (CPRL), Soil and Water Management Research Unit (SWMRU) research weather station, Bushland, Texas (Lat. 35.186714°, Long. -102.094189°, elevation 1170 m above MSL). Winter wheat was grown on two large, precision weighing lysimeters, each in the center of a 4.44 ha square field. The two square fields were themselves arranged with one directly north of and contiguous with the other. Fields and lysimeters within each field were designated northeast (NE), and southeast (SE). Irrigation was by linear move sprinkler system. Irrigations described as full were managed to replenish soil water used by the crop on a weekly or more frequent basis as determined by soil profile water content readings made with a neutron probe to 2.4-m depth in the field. Irrigation described as deficit typically involved irrigation to establish the crop in the autumn followed by reduced or no irrigation later in the late winter or spring.\nThe growth and yield data include plant height, leaf area index, growth stage, total above-ground biomass, leaf and stem biomass, hea biomass, and final yield. Data are from replicate samples in the field and non-destructive (except for final harvest) measurements on the weighing lysimeters. In most cases yield data are available from both manual sampling on replicate plots in each field and from machine harvest.\nThere is a single spreadsheet for the east (NE and SE) lysimeters and fields. The spreadsheets contain tabs for data and corresponding tabs for data dictionaries. Typically, there are separate data tabs and corresponding dictionaries for plant growth during the season, crop growth stage, plant population, manual harvest from replicate plots in each field and from lysimeter surfaces, and machine (combine) harvest, An Introduction tab explains the tab names and contents, lists the authors, explains conventions, and lists some relevant references.
Resource Title: 1992-1993 Bushland, TX, west winter wheat growth and yield data.
File Name: 1992-1993_W_Wheat_Growth_and_Yield.xlsx
Resource Description: This dataset consists of growth and yield data the 1992-1993 winter wheat (Triticum aestivum L.) season at the USDA-ARS Conservation and Production Laboratory (CPRL), Soil and Water Management Research Unit (SWMRU) research weather station, Bushland, Texas (Lat. 35.186714°, Long. -102.094189°, elevation 1170 m above MSL). Winter wheat was grown on two large, precision weighing lysimeters, each in the center of a 4.44 ha square field. The two square fields were themselves arranged with one directly north of and contiguous with the other. Fields and lysimeters within each field were designated northwest (NW), and southwest (SW). Irrigation was by linear move sprinkler system. Irrigations described as full were managed to replenish soil water used by the crop on a weekly or more frequent basis as determined by soil profile water content readings made with a neutron probe to 2.4-m depth in the field. Irrigation described as deficit typically involved irrigation to establish the crop in the autumn followed by reduced or no irrigation later in the late winter or spring.\nThe growth and yield data include plant height, leaf area index, growth stage, total above-ground biomass, leaf and stem biomass, hea biomass, and final yield. Data are from replicate samples in the field and non-destructive (except for final harvest) measurements on the weighing lysimeters. In most cases yield data are available from both manual sampling on replicate plots in each field and from machine harvest.\nThere is a single spreadsheet for the west (NW and SW) lysimeters and fields. The spreadsheets contain tabs for data and corresponding tabs for data dictionaries. Typically, there are separate data tabs and corresponding dictionaries for plant growth during the season, crop growth stage, plant population, manual harvest from replicate plots in each field and from lysimeter surfaces, and machine (combine) harvest, An Introduction tab explains the tab names and contents, lists the authors, explains conventions, and lists some relevant references.
In situ denitrification rates in intact soil cores from the Gulf Atlantic Coastal Plain (GACP) LTAR site in GA quantified by directly measuring dinitrogen (N2) and nitrous oxide (N2O) production via the Nitrogen-Free Air Recirculation Method (N-FARM) from 2016-2018. 10-day laboratory incubations provided estimates of ancillary soil data, including microbial respiration and potential net N mineralization and nitrification.
Resource Title: Gulf Atlantic Coastal Plain Data Dictionary.
File Name: Gulf Atlantic Coastal Plain Data Dictionary.csv
Resource Description: Data Dictionary for GACP dataset.
Resource Title: Gulf Atlantic Coastal Plain Metadata.
File Name: Gulf Atlantic Coastal Plain Metadata.csv
Resource Description: Metadata for GACP dataset.
Resource Title: Gulf Atlantic Coastal Plain Dataset.
File Name: Gulf Atlantic Coastal Plain Dataset.csv
Resource Description: GACP Dataset.
H3 Study for Greenhouse gas Reduction through Agricultural Carbon Enhancement network in Mandan, North Dakota\nGreenhouse gas management and understanding the carbon emissions associated with land management decisions is a growing public concern and an increasingly important component to sustainable agricultural systems. Fertilization with nitrogen is known to influence emissions of greenhouse gases from soils. Less clear is how the timing of fertilization impacts emissions. We performed an experiment to determine if emissions could be reduced by adjustment of fertilization timing alone using a maize field in production. We found fertilization of plots with urea in the early-spring resulted in lower greenhouse gas emissions than fertilization of similar plots with urea in the late-spring. This was primarily due to greater emissions of carbon dioxide at the soil surface when fertilized at temperatures greater than 10°C. The difference between treatments, when integrated over a 5-month growing season, was 548 kg C ha-1. Yields were similar for both treatments. Fertilizing at cooler temperatures resulted in a substantial carbon “savings” without affecting yield. This study indicates fertilization timing may be a management option for reducing soil carbon losses and greenhouse gas emissions. Additional study is needed to determine if this effect is consistent across years.
Resource Title: GeoData catalog record.
File Name: Web Page, url: https://geodata.nal.usda.gov/geonetwork/srv/eng/catalog.search#/metadata/86e8f236-8310-4912-8dd2-e9fb36996417
Please note: This software is no longer being updated or maintained, and is out of date.
\nHIRO2 (Hortonian Infiltration and Run-Off/On) is a spatially distributed rainfall-runoff model for event-based studies of space-time watershed processes. A grid-based routing hierarchy was defined over the watershed using the D-infinity contributing area algorithm. Computation of ponding time was included to handle variable run-on and rainfall intensity. The Green-Ampt model was adopted to calculate surface infiltration, and the kinematic wave model was used to route Hortonian runoff and channel flow. The model can handle input rainfall, soil parameters, surface roughness, and other properties that vary in space and time.
Resource Title: HIRO2.
File Name: Web Page, url: https://www.ars.usda.gov/research/software/download/?softwareid=239&modecode=30-12-30-25
download page
The HYDRUS program is a finite element model for simulating the one-dimensional movement of water, heat, and multiple solutes in variably saturated media. The program numerically solves the Richards' equation for saturated-unsaturated water flow and Fickian-based advection-dispersion equations for heat and solute transport. The flow equation incorporates a sink term to account for water uptake by plant roots. The heat transport equation considers conduction as well as convection with flowing water. The solute transport equations consider advective-dispersive transport in the liquid phase, and diffusion in the gaseous phase. The transport equations also include provisions for nonlinear and/or nonequilibrium reactions between the solid and liquid phases, linear equilibrium reactions between the liquid and gaseous phases, zero-order production, and two first-order degradation reactions: one which is independent of other solutes, and one which provides the coupling between solutes involved in sequential first-order decay reactions. The program may be used to analyze water and solute movement in unsaturated, partially saturated, or fully saturated porous media.
\nThe flow region itself may be composed of nonuniform soils. Flow and transport can occur in the vertical, horizontal, or a generally inclined direction. The water flow part of the model can deal with (constant or time-varying) prescribed head and flux boundaries, boundaries controlled by atmospheric conditions, as well as free drainage boundary conditions. Soil surface boundary conditions may change during the simulation from prescribed flux to prescribed head type conditions (and vice-versa).
\nFor solute transport the code supports both (constant and varying) prescribed concentration (Dirichlet or first-type) and concentration flux (Cauchy or third-type) boundary conditions. The dispersion coefficient includes terms reflecting the effects of molecular diffusion and tortuosity.
\nThe unsaturated soil hydraulic properties are described using van Genuchten [1980], Brooks and Correy [1964] and modified van Genuchten type analytical functions. Modifications were made to improve the description of hydraulic properties near saturation. The HYDRUS code incorporates hysteresis by using the empirical model introduced by Scott et al. [1983] and Kool and Parker [1987]. This model assumes that drying scanning curves are scaled from the main drying curve, and wetting scanning curves from the main wetting curve. HYDRUS also implements a scaling procedure to approximate hydraulic variability in a given soil profile by means of a set of linear scaling transformations which relate the individual soil hydraulic characteristics to those of a reference soil.
\nRoot growth is simulated by means of a logistic growth function. Water and salinity stress response functions can be defined according to functions proposed by Feddes et al. [1978] or van Genuchten [1987].
\nThe governing flow and transport equations are solved numerically using Galerkin type linear finite element schemes. Integration in time is achieved using an implicit (backwards) finite difference scheme for both saturated and unsaturated conditions. Additional measures are taken to improve solution efficiency for transient problems, including automatic time step adjustment and adherence to preset ranges of the Courant and Peclet numbers. The water content term is evaluated using the mass-conservative method proposed by Celia et al. [1990]. Possible options for minimizing numerical oscillations in the transport solutions include upstream weighing, artificial dispersion, and/or performance indexing.
Resource Title: HYDRUS download page.
File Name: Web Page, url: https://www.ars.usda.gov/research/software/download/?softwareid=96&modecode=20-36-15-00
HYDRUS-1D is a Microsoft Windows-based modeling environment for analysis of water flow and solute transport in variably saturated porous media. The software package includes the one-dimensional finite element model HYDRUS (version 7.0) for simulating the movement of water, heat, and multiple solutes in variably saturated media. The model is supported by an interactive graphics-based interface for data-preprocessing, discretization of the soil profile, and graphic presentation of the results.
\nThe HYDRUS program is a finite element model for simulating theone-dimensional movement of water, heat, and multiple solutes in variably saturated media. The program numerically solves the Richards' equation for saturated-unsaturated water flow and Fickian-based advection dispersion equations for heat and solute transport.
\nTheFlow equation incorporates a sink term to account for water uptake by plant roots.
\nTheHeat transport equation considers conduction as well as convection with flowing water.
\nTheSolute transport equations consider advective-dispersive transport in the liquid phase, and diffusion in the gaseous phase.
\nThe transport equations also include provisions for:
\nNonlinear\nand/orNonequilibrium reactions between the solid and liquid phases,
\nLinear equilibrium reactions between the liquid and gaseous phases,\nZero order production, and\nTwoFirst order degradation reactions:\nOne which is independent of other solutes, and\nOne which provides the coupling between solutes involved in sequential first-order decay reactions.\nThe program may be used to analyze water and solute movement in unsaturated, partially saturated, or fully saturated porous media.
\nThe flow region itself may be composed of nonuniform soils. Flow and transport can occur in the vertical, horizontal, or a generally inclined direction. The water flow part of the model can deal with (constant or time-varying) prescribed head and flux boundaries, boundaries controlled by atmospheric conditions, as well as free drainage boundary conditions. Soil surface boundary conditions may change during the simulation from prescribed flux to prescribed head type conditions (and vice versa).
\nFor solute transport the code supports both (constant and varying) prescribed concentration (Dirichlet or first-type) and concentration flux (Cauchy or third-type) boundary conditions. The dispersion coefficient includes terms reflecting the effects of molecular diffusion and tortuosity.
\nThe Unsaturated Soil Hydraulic Properties are described using van Genuchten [1980], Brooks and Correy [1964] and modified van Genuchten type analytical functions. Modifications were made to improve the description of hydraulic properties near saturation. The HYDRUS code incorporates hysteresis by using the empirical model introduced by Scott et al. [1983] and Kool and Parker [1987]. This model assumes that drying scanning curves are scaled from the main drying curve, and wetting scanning curves from the main wetting curve.
\nHYDRUS also implements a scaling procedure to approximate hydraulic variability in a given soil profile by means of a set of linear scaling transformations which relate the individual soil hydraulic characteristics to those of a reference soil.
\nRoot growth is simulated by means of a logistic growth function. Water and salinity stress response functions can be defined according to functions proposed by Feddes et al. [1978] or van Genuchten [1987].
\nThe governing flow and transport equations are solvednumerically using Galerkin type linear finite element schemes. Integration in time is achieved using an implicit (backwards) finite difference scheme for both saturated and unsaturated conditions. Additional measures are taken to improve solution efficiency for transient problems, including automatic time step adjustment and adherence to preset ranges of the Courant and Peclet numbers. The water content term is evaluated using the mass conservative method proposed by Celia et al. [1990]. Possible options for minimizing numerical oscillations in the transport solutions include upstream weighing, artificial dispersion, and/or performance indexing.
\nHYDRUS implements a Marquardt-Levenberg type parameter estimation technique for inverse estimation of selected soil hydraulic and/or solute transport and reaction parameters from measured transient or steady-state flow and/or transport data. The procedure permits several unknown parameters to be estimated from observed water contents, pressure heads, concentrations, and/or instantaneous or cumulative boundary fluxes (e.g., infiltration or outflow data). Additional retention or hydraulic conductivity data, as well as a penalty function for constraining the optimized parameters to remain in some feasible region (Bayesian estimation), can be optionally included in the parameter estimation procedure.
\nResource Title: HYDRUS-1D download page.
File Name: Web Page, url: https://www.ars.usda.gov/research/software/download/?softwareid=97&modecode=20-36-15-00
This dataset presents the Halyomorpha halys Official Gene Set (OGS) v1.2. OGSv1.2 is an update of Halyomorpha halys OGSv1.1 (https://doi.org/10.15482/USDA.ADC/1504240) to the coordinates of genome assembly GCA_000696795.3 (https://www.ncbi.nlm.nih.gov/assembly/GCA_000696795.3) using https://github.com/NAL-i5K/coordinates_conversion/.
\nThe original OGSv1.0 is an integration of automatic gene predictions from NCBI's eukaryotic annotation pipeline, NCBI Halyomorpha halys Annotation Release 100 (https://www.ncbi.nlm.nih.gov/genome/annotation_euk/Halyomorpha_halys/100/; ftp://ftp.ncbi.nlm.nih.gov/genomes/all/GCF/000/696/795/GCF_000696795.1_Hhal_1.0), with manual annotations by the research community (performed via the Apollo manual curation software, http://genomearchitect.org/). Manual annotations performed by the community were downloaded from Apollo, QC'd, and merged with NCBI Halyomorpha halys Annotation Release 100 using the GFF3toolkit software (https://github.com/NAL-i5K/GFF3toolkit/releases/tag/v1.4.4). The resulting merged dataset was formatted for ingest into the i5k Workspace and GenBank databases, resulting in Halyomorpha halys Official Gene Set (OGS) v1.0.
\nHalyomorpha Official Gene Set halhal_OGSv1.1 is a minor update of halhal_OGSv1.0: Alias attributes were added to all manually annotated cathepsin models; six models from contaminated scaffolds were removed; and notes were added to 3 models located on possibly contaminated scaffolds.
Resource Title: Halymorpha halys Official Gene Set OGSv1.2.
File Name: halhal_OGSv1.2.tar.gz
Resource Description: The attached tar.gz archive (halhal_OGSv1.2.tar.gz) contains the following files:
\nhalhal_OGSv1.2.gff. Gff3 of all gene predictions of Halymorpha halys genome annotations OGSv1.2\nhalhal_OGSv1.2_CDS.fa. CDS sequences of Halymorpha halys genome annotations OGSv1.2\nhalhal_OGSv1.2_pep.fa. Amino acid sequences of Halymorpha halys genome annotations OGSv1.2\nhalhal_OGSv1.2_trans.fa. Transcript sequences of Halymorpha halys genome annotations OGSv1.2\nreadme. Readme file describing Halymorpha halys genome annotations OGSv1.2
\nThe data set contains concentration, load, and daily discharge data for Devils Icebox Cave and Hunters Cave from 1999 to 2002. The data are available in Microsoft Excel 2010 format. Sheet 1 (Cave Streams Metadata) contains supporting information regarding the length of record, site locations, parameters measured, parameter units, method detection limits, describes the meaning of zero and blank cells, and briefly describes unit area load computations. Sheet 2 (Devils Icebox Concentration Data) contains concentration data from all samples collected from 1999 to 2002 at the Devils Icebox site for 12 analytes and two computed nutrient parameters. Sheet 3 (Devils Icebox SS Conc Data) contains 15-minute suspended sediment (SS) concentrations estimated from turbidity sensor data for the Devils Icebox site. Sheet 4 (Devils Icebox Load & Discharge Data) contains daily data for discharge, load, and unit area loads for the Devils Icebox site. Sheet 5 (Hunters Cave Concentration Data) contains concentration data from all samples collected from 1999 to 2002 at the Hunters Cave site for 12 analytes and two computed nutrient parameters. Sheet 6 (Hunters Cave SS Conc Data) contains 15-minute SS concentrations estimated from turbidity sensor data for the Hunters Cave site. Sheet 7 (Hunters Cave Load & Discharge Data) contains daily data for discharge, load, and unit area loads for the Hunters Cave site.\n\nAtrazine concentrations in Goodwater Creek Experimental Watershed (GCEW) were shown to be among the very highest of any watershed in the United States based on comparisons using the national Watershed Regressions for Pesticides (WARP) model and by direct comparison with the 112 watersheds used in the development of WARP. The herbicide data collected in GCEW are documented at plot, field, and watershed scales. This 20-yr-long (1991-2010) effort was augmented with a spatially broad effort within the Central Mississippi River Basin encompassing 12 related claypan watersheds in the Salt River Basin, two cave streams on the fringe of the Central Claypan Areas in the Bonne Femme watershed, and 95 streams in northern Missouri and southern Iowa. The research effort on herbicide transport has highlighted the importance of restrictive soil layers with smectitic mineralogy to the risk of transport vulnerability. Near-surface soil features, such as claypans and argillic horizons, result in greater herbicide transport than soils with high saturated hydraulic conductivities and low smectitic clay content.
Resource Title: GeoData catalog record.
File Name: Web Page, url: https://geodata.nal.usda.gov/geonetwork/srv/eng/catalog.search#/metadata/GoodwaterNutrient_jjm_2015-03-12_1533
High efficiency Nitrogen Study for Greenhouse gas Reduction through Agricultural Carbon Enhancement network in Fort Collins, Colorado\nNitrogen fertilization is essential for optimizing crop yields; however, it increases N2O emissions. The study objective was to compare N2O emissions resulting from application of commercially available enhanced-efficiency N fertilizers with emissions from conventional dry granular urea in irrigated cropping systems. These emissions were monitored from several irrigated cropping systems receiving N fertilizer rates ranging from 0-202 kg/ha years 2009-2011. Fertilizer types include Urea, UAN, SuperU (N inhibitor), ESN(slow release). In 2009, we eliminated the conventional tillage treatment. Cropping systems from 2009-2011 included a more conservative strip-till continuous corn (ST-CC) rotation and a no-till continuous corn (NT-CC) rotation. We also tested different fertilizer placements, including broadcast (bc), surface banded (bd) sub-surface banded (ssb) N inputs. Nitrous oxide fluxes were measured during these three growing seasons using static, vented chambers and a gas chromatograph analyzer. This work shows that the use of no-till and enhanced-efficiency N fertilizers can potentially reduce N2O emissions from irrigated systems.
Resource Title: Fort Collins, CO High Efficiency Nitrogen Study (COFOARD3) CSV data.
File Name: COFOARD3_csv_data.zip
Resource Description: CSV format data on Experimental Units, Field Sites, Greenhouse Gas Flux, Residue Management, Soil Chemistry, Soil Physics, Amendments, Planting, Tillage, Persons, Treatments, Weather Daily, Weather Station.
Organisms living in honey bees and honey bee colonies form large associative holobiont communities that are integral to bee biology. High-throughput sequencing approaches to characterize these holobiont communities from honey bees in various states of health and disease are now commonplace, producing large amounts of nucleotide sequence data that must be accurately and consistently analyzed in order to produce reliable and comparable reports. In addition, new species designations and revisions are actively being made from honey bee holobiont communities, complicating nomenclature in larger databases where taxonomic descriptions associated with archived sequences can quickly become outdated and misleading.
\nTo improve the accuracy and consistency of honey bee holobiont research, we have developed HoloBee: a curated database of publicly accessioned nucleotide sequences from the honey bee holobiont community. Except in rare and noted exceptions made by curators, sequences used in HoloBee were obtained from, or in association with, Apis mellifera (Western honey bee) as well as other honey bee species where available (e.g. Apis cerana, Apis dorsata, Apis laboriosa, Apis koschevnikovi, Apis florea, Apis andreniformis and Apis nigrocincta). Sources include: within or on the surface of honey bees (adult, pupae, larvae, egg), corbicular pollen, bee bread, royal jelly, honey, comb, hive surfaces (e.g. bottom board debris, frames, landing platforms), and isolates of microbes, parasites and pathogens from honey bees. HoloBee contains two non-overlapping sets of sequence data, HoloBee-Barcode and HoloBee-Mop, each of which have distinct intended uses.
\nHoloBee-Barcode is a non-redundant database of taxonomically informative barcoding loci for all viruses, bacteria, fungi, protozoans and metazoans associated with honey bees (Apis spp.). It was created from an exhaustive master sequence archive of all valid holobiont sequences. Redundancy was removed from this master archive using a clustering algorithm that grouped sequences with ≥ 99% identity and retained the longest sequence from each cluster as the representative accession for that sequence type (“centroid”). These centroid sequences were concatenated into a fasta formatted file to create the HoloBee-Barcode database. Associated taxonomy for each centroid, including Superkingdom through Species and Strain/Isolate, was individually reviewed and corrected when necessary by a curator. Cross reference tables (separated according to 5 major taxonomic groups) provide a user-friendly outline of information for each centroid accession within HoloBee-Barcode including taxonomy, gene/product name, sequence length, the unaltered NCBI definition line, the number and identity of redundant sequences clustered within each centroid, and any additional information provided by the curator. HoloBee-Barcode centroid counts are: Viruses = 86; Bacteria = 496; Fungi = 41; Protozoa = 4; Metazoa = 60.
\nHoloBee-Barcode is intended to improve and standardize quantitative and qualitative metagenomic descriptions of holobiont communities associated with honey bees by providing a curated set of barcode sequences. The goal of genetic barcoding is to associate a nucleotide sequence sample to a taxonomically valid species. Genomic regions targeted for such barcoding purposes varied by taxonomic group. The small subunit (SSU) ribosomal RNA, or 16S rRNA, is the most commonly used barcode for bacteria and is used in HB-Barcode. These 16S rRNA sequences will support the analysis of data generated with the widely used approach of amplicon-based 16S rRNA deep sequencing to study microbiota communities. Although barcode markers for fungi are less definitive than bacteria, HB-Barcode defaults to the ribosomal RNA internal transcribed spacer region (ITS), which typically includes ITS-1, 5.8S, and ITS-2. For some clades that cannot be resolved by this region, other barcode markers were selected. The majority of barcodes for metazoan taxa are the mitochondrial locus cytochrome c oxidase subunit I (COI). Complete mitochondrial DNA (mtDNA) sequence for Apis cerana (Asian honey bee) and Galleria mellonella (Greater wax moth) are included as barcodes for these species. We note that A. cerana mtDNA is included because it is considered a potentially invasive honey bee species and monitoring for its occurrence is in practice regionally, including in Australia, New Zealand and the USA. Protozoan barcodes include cytochrome b oxidase (Cytb), SSU, or ITS while entire genomes are used for viral barcoding.
\nHoloBee-Mop is a database comprised mostly of chromosomal, mitochondrial and plasmid genome assemblies in order to aggregate as much honey bee holobiont genomic sequence information as possible. For a few organisms without genome assembly data, transcriptome data are included (e.g. Aethina tumida, small hive beetle). Unlike HoloBee-Barcode, redundancy removal was not performed on the HoloBee-Mop database and thus this resource provides an archive of nucleotide sequence assemblies from honey bee holobionts. However, since full viral genomes are used in HoloBee-Barcode, only redundant viral sequences occur in HoloBee-Mop. All accessions within each of these assemblies were concatenated into a single fasta formatted file to create the HoloBee-Mop database. The intended purpose of HoloBee-Mop is to improve honey bee genome and transcriptome assemblies by “mopping-up” as much viral, bacterial, fungal, protozoan and non-honey bee metazoan sequence data as possible. Therefore, sequence data remaining after processing reads through both HoloBee-Barcode and HoloBee-Mop that do not map to the honey bee genome may contain unique data from taxonomic variants or novel species. Details for each sequence assembly within HoloBee-Mop are tabulated in cross reference tables according to each major taxonomic group. HoloBee-Mop assembly counts are: Viruses = 2; Bacteria = 55; Fungi = 5; Protozoa = 1; Metazoa = 6.
\nFollow the HoloBee database on Twitter at: https://twitter.com/HoloBee_db
\nFor questions about the HoloBee database, contact:\nHoloBee database team: holobee.db@gmail.com\nJay Evans: Jay.Evans@ars.usda.gov\nAnna Childers: Anna.Childers@ars.usda.gov
\nResource Title: HoloBee_v2016.1 sequence database.
File Name: HB_v2016.1.zip
Resource Description: This compressed file contains two fasta sequence files: \n\n1. HB_Bar_v2016.1.fasta (HoloBee-Barcode database)\n2. HB_Mop_v2016.1.fasta (HoloBee-Mop database)\n\nmd5 values: \n\n* HB_v2016.1.zip: 6e372e443744282128eb51488176503f\n* HB_Bar_v2016.1.fasta: 109e1f686a690c70ef78fc4b5066a01f\n* HB_Mop_v2016.1.fasta: ced8c3f5987dce69e800c8c491471eba\n\n
Resource Title: data dictionary for HoloBee_v2016.1.
File Name: Data_Dictionary_HoloBee_v2016.1.xlsx
Resource Title: HoloBee_v2016.1 cross reference tables.
File Name: HB_v2016.1_crossref.zip
Resource Description: This compressed file contains ten spreadsheet files (.xlsx) tabulating detailed information for all centroids (HoloBee-Barcode database) and sequence assemblies (HoloBee-Mop database) used in HoloBee v2016.1: \n\n1. HB_Bar_v2016.1_bacteria_crossref_2016-05-18.xlsx\n2. HB_Bar_v2016.1_fungi_crossref_2016-05-20.xlsx\n3. HB_Bar_v2016.1_metazoa_crossref_2016-05-16.xlsx\n4. HB_Bar_v2016.1_protozoa_crossref_2016-05-20.xlsx\n5. HB_Bar_v2016.1_viruses_crossref_2016-05-17.xlsx\n6. HB_Mop_v2016.1_bacteria_crossref_2016-05-12.xlsx\n7. HB_Mop_v2016.1_fungi_crossref_2016-05-12.xlsx\n8. HB_Mop_v2016.1_metazoa_crossref_2016-04-15.xlsx\n9. HB_Mop_v2016.1_protozoa_crossref_2016-04-11.xlsx\n10. HB_Mop_v2016.1_viruses_crossref_2016-05-12.xlsx\n\nmd5 value:\n\n* HB_v2016.1_crossref.zip: a8a57d92830eb77904743afc95980465\n
Resource Title: data dictionary for HoloBee_v2016.1.
File Name: Data_Dictionary_HoloBee_v2016.1.csv
The Baylor College of Medicine recently sequenced and annotated the Homalodisca vitripennis genome as part of the i5k pilot project.
\nThe Glassy-winged sharpshooter, GWSS, (Homalodisca vitripennis) [Hemiptera: Cicadellidae], occurs naturally within the southern United States. Once restricted to the southeastern states, it was accidentally spread across the south into California. The GWSS is a voracious feeder, and can fly long distances, preferring to feed upon cultivated crops, ie. Grapevine, fruit trees, and in the nymphal stages many weeds and grasses.\n\nThe GWSS is a serious threat to the viticulture industry as the primary vector of the plant-infecting bacterium, Xylella fastidiosa, Xf. The GWSS feeds on a diverse number of plants, during which the bacteria can infect many tree fruit, nut, vine, and woody ornamental crops.\n\nGlassy-winged Sharpshooter adults are ½ inch (13mm) long being fairly large for the Sharpshooter leafhopper family of insects. Sharpshooters use an ovipositor to lay eggs inside of the underside of leaves. The Sharpshooter will lay its eggs on almost any plant including cactus. The egg masses are usually composed of 10-20 eggs, but can lay more or as few as 1. Most of the egg masses have a waxy coating of brocosomes around the eggs for protection. The nymphs (5 instars) do not have wings, but develop wing pads in the 5th instar and are generally smaller than the adults, ranging in size from .07 inches (2 mm) to nearly ½ inch (13mm) long. The nymphs have very distinct red eyes. The Sharpshooter can consume about 300 times its own weight in fluids from the xylem vessels of the plants upon which it feeds, thus producing copious amounts of excreta fluid.
\nThis dataset presents the Homalodisca vitripennis genome v1.0. This assembly version is the pre-release version, prior to filtering and quality control by the National Center for Biotechnology Information's GenBank resource (https://www.ncbi.nlm.nih.gov/assembly/GCA_000696855.1). Assembly method details will be available in a forthcoming publication.
\nIf you wish to use this dataset, please follow the Baylor College of Medicine's conditions for data use: https://www.hgsc.bcm.edu/bcm-hgsc-conditions-use
\nResource Title: Homalodisca vitripennis genome assembly v1.0 fasta and agp files for contigs and scaffolds.
File Name: Hvit_1.0.tgz
Resource Description:
The attached tar.gz archive (Hvit_1.0.tgz) contains the following files:
\nHvit.contigs.80.fa. This file contains the sequence information of the contigs of the Homalodisca vitripennis 1.0 assembly.
\nHvit.scaffolds.50.fa. This file contains the sequence information of the scaffolds of the Homalodisca vitripennis 1.0 assembly.
\nHvit.agp.V2. This file contains information linking the contigs and scaffolds for the Homalodisca vitripennis 1.0 assembly. A description of the agp format is available here: http://www.ncbi.nlm.nih.gov/projects/genome/assembly/agp/AGP_Specification.shtml
\nNOTE.contamination.screen. This file describes results from NCBI's contamination screen on the assembly.
Resource Title: History HVIT_Earliest work contributions on EST’s, transcriptome, Assemblies, Annotations, Microbiome..
File Name: Hunter_2012. History of Early Contributions Homalodisca coagulata (Glassy-winged sharpshooter) ESTs, Transcriptome, Micrbiome.docx
Resource Description: List of contributors who worked on EST's, transcriptomes, assemblies, annotations, and microbiome of *Homalodisca vitripennis* (aka. *H. coagulata*).
The Homalodisca vitripennis genome was recently sequenced and annotated as part of the i5k pilot project by the Baylor College of Medicine.
\nThe Glassy-winged sharpshooter, GWSS, (Homalodisca vitripennis) [Hemiptera: Cicadellidae], occurs naturally within the southern United States. Once restricted to the southeastern states, it was accidentally spread across the south into California. The GWSS is a voracious feeder, and can fly long distances, preferring to feed upon cultivated crops, ie. Grapevine, fruit trees, and in the nymphal stages many weeds and grasses.\n\nThe GWSS is a serious threat to the viticulture industry as the primary vector of the plant-infecting bacterium, Xylella fastidiosa, Xf. The GWSS feeds on a diverse number of plants, during which the bacteria can infect many tree fruit, nut, vine, and woody ornamental crops.\n\nGlassy-winged Sharpshooter adults are ½ inch (13mm) long being fairly large for the Sharpshooter leafhopper family of insects. Sharpshooters use an ovipositor to lay eggs inside of the underside of leaves. The Sharpshooter will lay its eggs on almost any plant including cactus. The egg masses are usually composed of 10-20 eggs, but can lay more or as few as 1. Most of the egg masses have a waxy coating of brocosomes around the eggs for protection. The nymphs (5 instars) do not have wings, but develop wing pads in the 5th instar and are generally smaller than the adults, ranging in size from .07 inches (2 mm) to nearly ½ inch (13mm) long. The nymphs have very distinct red eyes. The Sharpshooter can consume about 300 times its own weight in fluids from the xylem vessels of the plants upon which it feeds, thus producing copious amounts of excreta fluid.
\nThis dataset presents the Homalodisca vitripennis genome v1.0. This assembly version is the pre-release version, prior to filtering and quality control by the National Center for Biotechnology Information's GenBank resource (https://www.ncbi.nlm.nih.gov/assembly/GCA_000696855.1). Assembly method details will be available in a forthcoming publication.
\nNOTE: This gene set is an unstable pre-release (v0.5.3), and was provided to facilitate manual curation and analyses before the official gene set is released. Gene identifiers from this gene set will likely not be maintained.
\nIf you wish to use this dataset, please follow the Baylor College of Medicine's conditions for data use: https://www.hgsc.bcm.edu/bcm-hgsc-conditions-use
\nResource Title: Homalodisca vitripennis genome annotations v0.5.3 for genome assembly Homalodisca vitripennis v1.0.
File Name: Hvit_genome_annotations_v0.5.3.tgz
Resource Description:
The attached tar.gz archive (Hvit_genome_annotations_v0.5.3.tgz) contains the following files:
\nHVIT.CDS.fna. CDS sequences of Homalodisca vitripennis genome annotations v0.5.3.
\nHVIT.faa. Amino acid sequences of Homalodisca vitripennis genome annotations v0.5.3.
\nHVIT.fna. cDNA sequences of Homalodisca vitripennis genome annotations v0.5.3.
\nHVIT.Models.gff3. Gff3 of all gene predictions of Homalodisca vitripennis genome annotations v0.5.3.
\nHVIT.Analysis.gff3. Gff3 of all evidence files for Homalodisca vitripennis genome annotations v0.5.3.
\nToxicological data generated for Apis mellifera honey bees and an ectoparasitic mite (Varroa destructor) in laboratory toxicity trials are presented. Data were generated over a four-year period by members of the Varroacide Research and Testing Team (VRTT) as part of a foundational grant from the Foundation for Food and Agricultural Research (FFAR). Data may be used to explore toxicological responses of honey bees and Varroa mites to a wide range of natural and synthetic chemical treatments against Varroa infestations in honey bee colonies. Data may be collected and analyzed together with other data sets not generated by VRTT.
Resource Title: Toxicity data generated from vial and jar assays by USDA-ARS Beltsville bee lab in summer, 2019.
File Name: Vial & Jar Data Summer 2019 USDA .csv
Resource Description: Toxicity data generated for Apis mellifera honey bees and Varrroa destructor mites from laboratory vial and jar assays in 2019 by the USDA-ARS Bee Research Lab, Beltsville MD
Resource Title: Honey bee (Apis mellifera) and Varroa destructor toxicity data from 2019 cage trials at USDA laboratory.
File Name: Cage Data Summer 2019 USDA ultimate.csv
Resource Description: Bees and mites were housed together in 1 L plastic deli containers modified into cages. Toxicants were applied to acetate strips hung from the center of the upper lid. Bee and mite mortality were gauged at 3 time points, 4 hours, 24 hours, and 48 hours after exposure to toxicants.
Resource Title: Vial and Jar toxicity data 2018 USDA.
File Name: Vial Jar toxicity data Summer 2018_USDA.csv
Resource Description: Honey bee (Apis mellifera) and Varroa destructor mite toxicity data from vial and jar assays 2018 USDA
Resource Title: Vial and Jar toxicity data OSU 2018.
File Name: Vial and Jar toxicity data OSU 2018.csv
Resource Description: Toxicity data for Varroa destructor mites and Apis mellifera honey bees completed for various active ingredients conducted by laboratory of Dr. Reed Johnson at the Ohio State University in 2018.
Resource Title: Vial and Jar toxicity data OSU 2019.
File Name: Vial and Jar toxicity data OSU 2019.csv
Resource Description: Toxicity data for Varroa destructor mites and Apis mellifera honey bees completed for various active ingredients conducted by laboratory of Dr. Reed Johnson at the Ohio State University in 2019.
These data represent temporal changes in the concentrations of individual oxylipins (OxL) and endocannabinoids (eCB) in adult women during a sub-maximal aerobic exercise bout, and at recovery (20 min. post-cessation of exercise) (Supplementary Materials 1). Results are depicted both before (pre-) and after (post-) a weight loss and fitness intervention lasting at least 14 wk. Participants were obese, sedentary, and insulin resistant in the pre-intervention phase. Also depicted are statistical groupings of metabolites, as an Excel file (Supplementary Materials 2).
Resource Title: Supporting Materials 1.
File Name: oxy_timecourse, SUPPLEMENTAL MATERIALS 1, for submission.pdf
Resource Description: Blood plasma oxylipin and endocannabinoid concentrations over time during an acute sub-maximal aerobic exercise bout in women, both before and after a 14 wk+ fitness and weight loss intervention. Total exercise time = 30 min, followed by a recovery period of 20 min.
Resource Software Recommended: Adobe Acrobat,url: https://acrobat.adobe.com/us/en/acrobat/pdf-reader.html
Resource Title: Supporting Materials 2, oxylipin and endocannabinoid statistics & clustering.
File Name: SUPPLEMENTAL MATERIALS 2, for submissionXLS.xls
Resource Description: Excel sheet with statistics and statistical pattern clustering associated with blood plasma oxylipins and endocannabinoids in women performing 30 min. sub-maximal aerobic exercise, followed by a 20 min recovery period.
Resource Software Recommended: Microsoft Excel,url: https://products.office.com/en-us/excel
The Hyalella azteca genome was recently sequenced and annotated as part of the i5k pilot project by the Baylor College of Medicine. The Hyalella azteca research community has manually reviewed and curated the computational gene predictions and generated an official gene set, OGSv1.0. The OGS is an integration of automatic gene predictions from Maker with manual annotations by the research community (via the Apollo manual annotation software).
\nIf you wish to use this dataset, please follow the Baylor College of Medicine's conditions for data use: https://www.hgsc.bcm.edu/bcm-hgsc-conditions-use
Resource Title: Hyalella azteca Official Gene Set OGSv1.0.
File Name: hyaazt_OGS_v1-0.tar.gz
Resource Description:
The attached tar.gz archive (hyaazt_OGS_v1-0.tar.gz) contains the following files:
hyaazt_OGSv1.0_cds.fa. CDS sequences of Hyalella azteca genome annotations OGSv1.0.
hyaazt_OGSv1.0_pep.fa. Amino acid sequences of Hyalella azteca genome annotations OGSv1.0.
hyaazt_OGSv1.0_trans.fa. cDNA sequences of Hyalella azteca genome annotations OGSv1.0.
hyaazt_OGSv1.0.gff. Gff3 of all gene predictions of Hyalella azteca genome annotations OGSv1.0
hyaazt_Manual2OGSv1.0_id_mapping.txt. A mapping file describing ID and name updates from dataset Hyalella azteca genome annotations v0.5.3.
readme.txt. This file briefly describes how the dataset Hyalella azteca Official Gene Set OGSv1.0 was generated.
This dataset presents the Hyalella azteca Official Gene Set OGSv1.3. This is an update to Official Gene Sets OGSv1.0 and OGSv1.2. Official Gene Set hyaazt_OGSv1.3 was generated by mapping hyaazt_OGSv1.2 (https://i5k.nal.usda.gov/bio_data/836772) to assembly GCF_000764305.2 using the program Liftoff v1.6.3 (https://github.com/agshumate/Liftoff).
", "title": "Hyalella azteca Official Gene Set v1.3", "distribution": [ { "@type": "dcat:Distribution", "downloadURL": "https://ndownloader.figshare.com/files/44572117", "format": "gz", "mediaType": "application/x-gzip", "title": "OGSv1.3.tar.gz" } ], "license": "https://creativecommons.org/licenses/by-sa/4.0/", "bureauCode": [ "005:18" ], "modified": "2024-02-16", "publisher": { "@type": "org:Organization", "name": "Agricultural Research Service" }, "keyword": [ "i5k", "Hyalella azteca", "arthropods", "data.gov", "ARS" ] }, { "identifier": "10113/AA6252", "accessLevel": "public", "contactPoint": { "hasEmail": "mailto:michael.gates@usda.gov", "fn": "Gates, Michael" }, "programCode": [ "005:040" ], "description": "This website is a collaborative effort among several individuals. Michael Gates (USDA, Smithsonian Institution, Washington, DC) conceptualized the project. Robert Kula (USDA, Smithsonian Institution, Washington, DC) and Matthew Buffington (USDA, Smithsonian Institution, Washington, DC) contributed to the design of the website. Type photographs were taken by Mr. Jeffrey Chiu and Eugenio (Gino) Nearns (APHIS/PPQ/NIS) developed the website and prepared the on-line searchable database. Signiphoridae type specimens were photographed and processed by members of the Woolley Lab (Ana Dal Molin and Lydia Wessner) and support provided by National Science Foundation - PEET DEB-0730616 grant to Dr. Jim Woolley (Texas A&M University) and Dr. John Heraty (University of California, Riverside).
\nResource Title: Hymenoptera Holotypes of the Smithsonian Institution.
File Name: Web Page, url: http://usnmhymtypes.com/default.asp?Action=Show_About
A set of PYTHON programs to implement image processing of ground and aerial images by offering via graphical user interface (GUI) 1) plot-level metrics extraction through a series of algorithms for image conversion, band math, radiometric/geometric calibrations, segmentation, masking, adaptive region of interest (ROI), gridding, heatmap, and batch process, 2) GIS interface for GeoTIFF pixels to Lat/Lon, UTM conversion, read/write shapefile, Lat/Lon to ROI, grid to polygon, and 3) utility GUI functions for zooming, panning, rotation, images to video, file I/O, and histogram.
Resource Title: IMAP: Image Mapping & Analytics for Phenotyping.
File Name: IMAP.zip
The ribosomal RNA (rRNA) internal transcribed spacer (ITS) regions are commonly used to identify fungi and other eukaryotic taxa in amplicon sequencing. The highly conserved rRNA regions flanking the ITS need to be trimmed before being used for taxonomic assignment. The Python software package ITSxpress rapidly trims single-end or paired-end sequences in FASTQ format for use in amplicon sequence variant clustering methods like DADA2. This new major release of ITSxpress improves the paired-end merging method, simplifies installation of the QIIME 2 ITSxpress plugin, removes major dependencies, adds use cases, and is compatible with newer compression formats. This paper discusses the modifications to ITSxpress that improve the output and user experience, leading to a major version increase.
", "title": "ITSxpress: Software to rapidly trim internal transcribed spacer sequences with quality scores for amplicon sequencing", "distribution": [ { "@type": "dcat:Distribution", "downloadURL": "https://github.com/USDA-ARS-GBRU/itsxpress", "mediaType": "text/html", "title": "https://github.com/USDA-ARS-GBRU/itsxpress" } ], "license": "https://creativecommons.org/publicdomain/zero/1.0/", "bureauCode": [ "005:18" ], "modified": "2024-04-23", "publisher": { "@type": "org:Organization", "name": "Agricultural Research Service" }, "accrualPeriodicity": "irregular", "keyword": [ "Amplicon Sequencing", "internal transcribed spacer (ITS) sequence", "QIIME 2" ] }, { "identifier": "10.15482/USDA.ADC/1528959", "accessLevel": "public", "contactPoint": { "hasEmail": "mailto:phillip.shults@usda.gov", "fn": "Shults, Phillip" }, "programCode": [ "005:040" ], "description": "These data represent the microsatellite peak calls generated after genotyping the specimens, as well as, the outputs from downstream analyses and the metadata used to construct some of the figures and tables. The microsatellite data can be found in \"Shults_2023_peak_calls.xlsx\" and contains the identity of each peak scored scored using Geneious v.9.1 software. An \"x\" represents no peak call at that marker for that individual. These data were used as input for all of the subsequent population genetic analyses. All of the data used to create the tables and figures of the manuscript can be found in \"Shults_2023_tables_figs.xlsx\".
\nResources in this dataset:
\nResource Title: Microsatellite peak calls\nFile Name: Shults_2023_peak_calls.xlsx\nResource Description: Contained in this file are all of the individual specimens (rows) genotype during this project. An \"x\" represents an uncalled peak for that specific marker.
\nResource Title: Tables and Figures\nFile Name: Shults_2023_tables_figs.xlsx\nResource Description: Contained in this file are all of the metadata used to create the tales and figures from the manuscript. Each tab is labeled with the corresponding information and IBT stands for isolation by time.
\nThe Imperfect SSR Finder is an online tool to help geneticists find Simple Sequence Repeats (SSR), aka microsatellites or Short Tandem Repeats (STR), in uploaded FASTA sequences.
\nThe Imperfect SSR Finder is an interactive website to help you find imperfect (and perfect) SSRs. You can test small snippets or upload large files, change the lengths and types of the SSRs your are looking for, and create output with SSRs in inverted case and/or color highlights. A tabular information file is also created in .CSV format, for easy import into any spreadsheet program.
Resource Title: Imperfect SSR Finder.
File Name: Web Page, url: https://ssr.nwisrl.ars.usda.gov/
IncA/C plasmids are a class of plasmids from Enterobacteraciae that are relatively large (49 to >180 kbp), are readily transferred by conjugation, and carry multiple antimicrobial resistance genes. Reconstruction of the phylogeny of these plasmids has been difficult because of the high rate of remodeling by recombination-mediated horizontal gene transfer (HGT). We hypothesized that evaluation of nucleotide polymorphisms relative to the rate of HGT would help to develop a clock to show if anthropic practices have had significant influences on the lineages of the plasmid. A system was developed to rapidly sequence up to 191 known open27 reading-frames from each of 39 recently isolated IncA/C plasmids from a diverse panel of Salmonella enterica and Escherichia coli. With these data plus sequences from Genbank we were able to distinguish six distinct lineages that had extremely low numbers of polymorphisms within each lineage, especially among the largest group designated as Lineage 1. Two regions, each about half the plasmid in size, could be distinguished with a separate lineal pattern. The distribution of Lineage 1 showed that it has migrated extremely rapidly with fewer polymorphisms than can be expected in two-thousand years. Remodeling by frequent HGT was evident with a pattern that appeared to have the highest rate just upstream of the putative conjugation origin of transfer (ori-T). It seems likely that when an IncA/C plasmid is transferred also adjacent to a multiple antimicrobial resistance gene cassette.
\nResource Title: Website pointer to Inc A/C Sequence Data.
File Name: Web Page, url: https://www.ars.usda.gov/southeast-area/athens-ga/us-national-poultry-research-center/bacterial-epidemiology-antimicrobial-resistance-research/docs/inc-ac-sequence-data/
Inc A/C Alignment - FastA format, Inc A/C Alignment - Geneious format (compatible with versions 6.1 and later), Supplemental Table
Gene ontologies generated using GOanna with a standard pipeline (https://agbase-docs.readthedocs.io/en/latest/goanna/using_goanna_cmd.html ; default settings) with queries against the invertebrate subsection of the UniProt database. Alignments provided in html format. The initial set of gene ontology (GO) terms in the sliminput.txt files generated by GOanna were used as input for GOSlimViewer to parse and summarize molecular function (F), biological process (P) and cellular component (C) at level 2. Annotations were also converted to gene annotation format (.gaf) file using Goanna2ga.
Resource Title: Alignment of Diabrotica virgifera virgifera RefSeq GCF_003013835.1 protein models against invertebrate proteins in the UniProt database .
File Name: Dvir_2.0GOAnna.align.sn060d1588083909.html
Resource Description: Gapped BLAST and PSI-BLAST results for Diabrotica virgifera virgifera RefSeq GCF_003013835.1 protein models against 22,595 invertebrate protein sequences in the UniProt database at AgBase (invertebrates_exponly.fa)
Resource Software Recommended: GOanna,url: https://agbase.arizona.edu/cgi-bin/tools/GOanna.cgi
Resource Title: Summary of all putative GO annotations received for Diabrotica virgifera virgifera RefSeq GCF_003013835.1 protein models.
File Name: Dvir_2.0_GOAnna_GOs.sn060d1588083909.txt
Resource Description: Putative GO annotations received for Diabrotica virgifera virgifera RefSeq GCF_003013835.1 protein models. Contains all putative hit with proteins in a curated UniProt invertebrate database, invertebrates_exponly.fa, maintained at AgAbase (https://agbase.arizona.edu/cgi-bin/team.pl)
Resource Software Recommended: GOanna,url: https://agbase.arizona.edu/cgi-bin/tools/GOanna.cgi
Resource Title: Annotations used for Diabrotica virgifera virgifera RefSeq GCF_003013835.1 protein models.
File Name: Dvir_2.0_GOAnna_ProtAnnotations_sn060d1588083909.txt
Resource Description: Top annotation received for each Diabrotica virgifera virgifera RefSeq GCF_003013835.1 protein models. Contains only the \"top\" hit with proteins in a curated UniProt invertebrate database, invertebrates_exponly.fa, maintained at AgAbase (https://agbase.arizona.edu/cgi-bin/team.pl). Carried through for analyses using GOslim.
Resource Software Recommended: GOanna,url: https://agbase.arizona.edu/cgi-bin/tools/GOanna.cgi
Resource Title: Putative GO annotations received for Diabrotica virgifera virgifera RefSeq GCF_003013835.1 protein models reformatted for GOslim input.
File Name: Dvir_2.0_GOAnna_sliminput_sn060d1588083909.txt
Resource Description: Putative GO terms received for Diabrotica virgifera virgifera RefSeq GCF_003013835.1 protein models.
Resource Title: Summary of GO biological process (BP) terms received for Diabrotica virgifera virgifera RefSeq GCF_003013835.1 protein models.
File Name: Dvir_2.0GOslimout.bp.w63fq51588102929.bp_.txt
Resource Software Recommended: GOslimViewer,url: https://agbase.arizona.edu/cgi-bin/tools/goslimviewer_select.pl
Resource Title: Summary of GO cellular component (CC) terms received for Diabrotica virgifera virgifera RefSeq GCF_003013835.1 protein models..
File Name: Dvir_2.0GOslimoutcc.w63fq51588102929.cc.txt
Resource Software Recommended: GOslimViewer,url: https://agbase.arizona.edu/cgi-bin/tools/goslimviewer_select.pl
Resource Title: Summary of GO molecular function (MF) terms received for Diabrotica virgifera virgifera RefSeq GCF_003013835.1 protein models..
File Name: Dvir_2.0_GOslimoutmf.w63fq51588102929.txt
Resource Software Recommended: GOslimViewer,url: https://agbase.arizona.edu/cgi-bin/tools/goslimviewer_select.pl
Resource Title: Gene annotation file (.gaf) output generated for GO terms assigned to Diabrotica virgifera virgifera RefSeq GCF_003013835.1 protein models..
File Name: GOanna2GA_Reformat_kky33f1592832838.xls
Resource Software Recommended: GOanna2ga,url: https://agbase.arizona.edu/cgi-bin/tools/GOanna2ga.cgi
The need for a research tool that integrates the many physical and biological processes on a farm has led to the development of the Integrated Farm System Model (IFSM). The model has been used to evaluate a wide variety of technologies and management strategies, and these analyses have been reported in the scientific and farm-trade literature. Systems research in dairy and beef production remains as the primary purpose of this tool, but the model also provides an effective teaching aid. With the model, students gain a better appreciation for the complexity of livestock forage systems. The learn how small changes affect many parts of the system, causing unanticipated results. They may also use the model to develop a more optimum food production system. When used in extension type teaching, producers can learn more about their farms and obtain information useful in strategic planning. By testing and comparing different options with the model, those offering the greatest economic benefit with acceptable environmental impact can be found.
\nInput information is supplied to the program through three parameter files. The farm parameter file contains data describing the farm such as crop areas, soil type, equipment and structures used, numbers of animals at various ages, harvest, tillage, and manure handling strategies, and prices for various farm inputs and outputs. The machinery file includes parameters for each machine available for use on a simulated farm.
\nSimulation output is available in four files, which contain summary tables, report tables, optional tables, and parameter tables. The summary tables provide average performance, environmental impact, costs, and returns for the years simulated. These values consist of crop yields, feeds produced, feeds bought and sold, manure produced, nutrient losses to the environment, production costs, income from products sold, and the net return or profitability of the farm. Values are provided for the average and standard deviation of each over all simulated years. The report tables provide extensive output information including all the data given in the summary tables. In these tables, values are given for each simulated year of weather as well as the mean and variance over all simulated years. Optional tables are available for a closer inspection of how the components of the full simulation are functioning. These tables include very detailed data, often on a daily basis. Parameter tables summarize the input parameters specified for a given simulation. These tables provide a convenient method of documenting the parameter settings used for a simulation.
\nResource Title: Projected Climate Data for IFSM.
File Name: Web Page, url: https://www.ars.usda.gov/research/software/download/?softwareid=497&modecode=80-70-05-00
Downscaled climate data (1950 to 2100) are available for 78 locations across the United States formatted for use in IFSM. Each location includes 18 climate files created using 9 general circulation models (GCM) and 2 projected emission scenarios. Emission scenarios include Representative Concentration Pathways (RCP) 4.5 and 8.5 where RCP 4.5 represents a somewhat optimistic outlook for reducing greenhouse gas emissions and 8.5 represents continuing the current trend for emissions.
This dataset represents CLIGEN input parameters for locations in 68 countries. CLIGEN is a point-scale stochastic weather generator that produces long-term weather simulations with daily output. The input parameters are essentially monthly climate statistics that also serve as climate benchmarks. Three unique input parameter sets are differentiated by having been produced from 30-year, 20-year and 10-year minimum record lengths that correspond to 7673, 2336, and 2694 stations, respectively. The primary source of data is the NOAA GHCN-Daily dataset, and due to data gaps, records longer than the three minimum record lengths were often queried to produce the needed number of complete monthly records. The vast majority of stations used at least some data from the 2000's, and temporal coverages are shown in the Excel table for each station. CLIGEN has various applications including being used to force soil erosion models. This dataset may reduce the effort needed in preparing climate inputs for such applications.
\nRevised input files added on 11/16/20. These files were revised from the original dataset. Fixed metadata issues with the headings of each file. Fixed inconsistencies with MX.5P and transition probability values for extremely dry climates and/or months.
\nSecond revision input files added on 2/12/20. A formatting error was fixed that affected transition probabilities for 238 stations with zero recorded precipitation for one or more months. The affected stations were predominantly in Australia and Mexico.
Resource Title: 30-year input files.
File Name: 30-year.zip
Resource Description: CLIGEN .par input files based on 30-year minimum record lengths. May be viewed with text editor.
Resource Software Recommended: CLIGEN v5.3,url: https://www.ars.usda.gov/midwest-area/west-lafayette-in/national-soil-erosion-research/docs/wepp/cligen/
Resource Title: 20-year input files.
File Name: 20-year.zip
Resource Description: CLIGEN .par input files based on 20-year minimum record lengths. May be viewed with text editor.
Resource Software Recommended: CLIGEN v5.3,url: https://www.ars.usda.gov/midwest-area/west-lafayette-in/national-soil-erosion-research/docs/wepp/cligen/
Resource Title: 10-year input files.
File Name: 10-year.zip
Resource Description: CLIGEN .par input files based on 10-year minimum record lengths. May be viewed with text editor.
Resource Software Recommended: CLIGEN v5.3,url: https://www.ars.usda.gov/midwest-area/west-lafayette-in/national-soil-erosion-research/docs/wepp/cligen/
Resource Title: Map Layer.
File Name: MapLayer.kmz
Resource Description: Map Layer showing locations of the new CLIGEN stations. This layer may be imported into Google Earth and used to find the station closest to an area of interest.
Resource Software Recommended: Google Earth,url: https://www.google.com/earth/
Resource Title: Temporal Ranges of Years Queried.
File Name: GHCN-Daily Year Ranges.xlsx
Resource Description: Excel tables of the first and last years queried from GHCN-Daily when searching for complete monthly records (with no gaps in data). Any ranges in excess of 30 years, 20 years and 10 years, for respective datasets, are due to data gaps.
Resource Title: 30-year input files (revised).
File Name: 30-year revised.zip
Resource Description: CLIGEN .par input files based on 30-year minimum record lengths. May be viewed with text editor. Revised from the original dataset. Fixed metadata issues with the headings of each file. Fixed inconsistencies with MX.5P and transition probability values for extremely dry climates and/or months.
Resource Software Recommended: CLIGEN v5.3,url: https://www.ars.usda.gov/midwest-area/west-lafayette-in/national-soil-erosion-research/docs/wepp/cligen/
Resource Title: 20-year input files (revised).
File Name: 20-year revised.zip
Resource Description: CLIGEN .par input files based on 20-year minimum record lengths. May be viewed with text editor. Revised from the original dataset. Fixed metadata issues with the headings of each file. Fixed inconsistencies with MX.5P and transition probability values for extremely dry climates and/or months.
Resource Software Recommended: Cligen v5.3,url: https://www.ars.usda.gov/midwest-area/west-lafayette-in/national-soil-erosion-research/docs/wepp/cligen/
Resource Title: 10-year input files (revised).
File Name: 10-year revised.zip
Resource Description: CLIGEN .par input files based on 10-year minimum record lengths. May be viewed with text editor. Revised from the original dataset. Fixed metadata issues with the headings of each file. Fixed inconsistencies with MX.5P and transition probability values for extremely dry climates and/or months.
Resource Software Recommended: Cligen v5.3,url: https://www.ars.usda.gov/midwest-area/west-lafayette-in/national-soil-erosion-research/docs/wepp/cligen/
Resource Title: 30-year input files (revised 2).
File Name: 30-year revised 2.zip
Resource Description: CLIGEN .par input files based on 30-year minimum record lengths. May be viewed with text editor. Fixed formatting issue for 238 stations that affected transition probabilities.
Resource Software Recommended: Cligen v5.3,url: https://www.ars.usda.gov/midwest-area/west-lafayette-in/national-soil-erosion-research/docs/wepp/cligen/
Resource Title: 20-year input files (revised 2).
File Name: 20-year revised 2.zip
Resource Description: CLIGEN .par input files based on 20-year minimum record lengths. May be viewed with text editor. Fixed formatting issue for 238 stations that affected transition probabilities.
Resource Software Recommended: Cligen v5.3,url: https://www.ars.usda.gov/midwest-area/west-lafayette-in/national-soil-erosion-research/docs/wepp/cligen/
Resource Title: 10-year input files (revised 2).
File Name: 10-year revised 2.zip
Resource Description: CLIGEN *.par input files based on 10-year minimum record lengths. May be viewed with text editor. Fixed formatting issue for 238 stations that affected transition probabilities.
Resource Software Recommended: Cligen v5.3,url: https://www.ars.usda.gov/midwest-area/west-lafayette-in/national-soil-erosion-research/docs/wepp/cligen/
United States agricultural researchers have many options for making their data available online. This dataset aggregates the primary sources of ag-related data and determines where researchers are likely to deposit their agricultural data. These data serve as both a current landscape analysis and also as a baseline for future studies of ag research data.
\nAs sources of agricultural data become more numerous and disparate, and collaboration and open data become more expected if not required, this research provides a landscape inventory of online sources of open agricultural data.
\nAn inventory of current agricultural data sharing options will help assess how the Ag Data Commons, a platform for USDA-funded data cataloging and publication, can best support data-intensive and multi-disciplinary research. It will also help agricultural librarians assist their researchers in data management and publication. The goals of this study were to
\nThe National Agricultural Library team focused on Agricultural Research Service (ARS), Natural Resources Conservation Service (NRCS), and United States Forest Service (USFS) style research data, rather than ag economics, statistics, and social sciences data. To find domain-specific, general, institutional, and federal agency repositories and databases that are open to US research submissions and have some amount of ag data, resources including re3data, libguides, and ARS lists were analysed. Primarily environmental or public health databases were not included, but places where ag grantees would publish data were considered.
\nWe first compiled a list of known domain specific USDA / ARS datasets / databases that are represented in the Ag Data Commons, including ARS Image Gallery, ARS Nutrition Databases (sub-components), SoyBase, PeanutBase, National Fungus Collection, i5K Workspace @ NAL, and GRIN. We then searched using search engines such as Bing and Google for non-USDA / federal ag databases, using Boolean variations of “agricultural data” /“ag data” / “scientific data” + NOT + USDA (to filter out the federal / USDA results). Most of these results were domain specific, though some contained a mix of data subjects.
\nWe then used search engines such as Bing and Google to find top agricultural university repositories using variations of “agriculture”, “ag data” and “university” to find schools with agriculture programs. Using that list of universities, we searched each university web site to see if their institution had a repository for their unique, independent research data if not apparent in the initial web browser search. We found both ag specific university repositories and general university repositories that housed a portion of agricultural data. Ag specific university repositories are included in the list of domain-specific repositories. Results included Columbia University – International Research Institute for Climate and Society, UC Davis – Cover Crops Database, etc. If a general university repository existed, we determined whether that repository could filter to include only data results after our chosen ag search terms were applied. General university databases that contain ag data included Colorado State University Digital Collections, University of Michigan ICPSR (Inter-university Consortium for Political and Social Research), and University of Minnesota DRUM (Digital Repository of the University of Minnesota). We then split out NCBI (National Center for Biotechnology Information) repositories.
\nNext we searched the internet for open general data repositories using a variety of search engines, and repositories containing a mix of data, journals, books, and other types of records were tested to determine whether that repository could filter for data results after search terms were applied. General subject data repositories include Figshare, Open Science Framework, PANGEA, Protein Data Bank, and Zenodo.
\nFinally, we compared scholarly journal suggestions for data repositories against our list to fill in any missing repositories that might contain agricultural data. Extensive lists of journals were compiled, in which USDA published in 2012 and 2016, combining search results in ARIS, Scopus, and the Forest Service's TreeSearch, plus the USDA web sites Economic Research Service (ERS), National Agricultural Statistics Service (NASS), Natural Resources and Conservation Service (NRCS), Food and Nutrition Service (FNS), Rural Development (RD), and Agricultural Marketing Service (AMS). The top 50 journals' author instructions were consulted to see if they (a) ask or require submitters to provide supplemental data, or (b) require submitters to submit data to open repositories.
\nData are provided for Journals based on a 2012 and 2016 study of where USDA employees publish their research studies, ranked by number of articles, including 2015/2016 Impact Factor, Author guidelines, Supplemental Data?, Supplemental Data reviewed?, Open Data (Supplemental or in Repository) Required? and Recommended data repositories, as provided in the online author guidelines for each the top 50 journals.
\nWe ran a series of searches on all resulting general subject databases with the designated search terms. From the results, we noted the total number of datasets in the repository, type of resource searched (datasets, data, images, components, etc.), percentage of the total database that each term comprised, any dataset with a search term that comprised at least 1% and 5% of the total collection, and any search term that returned greater than 100 and greater than 500 results.
\nWe compared domain-specific databases and repositories based on parent organization, type of institution, and whether data submissions were dependent on conditions such as funding or affiliation of some kind.
\nA summary of the major findings from our data review:
\nSee included README file for descriptions of each individual data file in this dataset.
\nResource Title: Journals.
File Name: Journals.csv
Resource Title: Journals - Recommended repositories.
File Name: Repos_from_journals.csv
Resource Title: TDWG presentation.
File Name: TDWG_Presentation.pptx
Resource Title: Domain Specific ag data sources.
File Name: domain_specific_ag_databases.csv
Resource Title: Data Dictionary for Ag Data Repository Inventory.
File Name: Ag_Data_Repo_DD.csv
Resource Title: General repositories containing ag data.
File Name: general_repos_1.csv
Resource Title: README and file inventory.
File Name: README_InventoryPublicDBandREepAgData.txt
Irrigation Residue Removal Study for Greenhouse gas Reduction through Agricultural Carbon Enhancement network and Resilient Economic Agricultural Practices in Lincoln, Nebraska\nUSDA-ARS REAP Study (Ithaca, NE) - NEMEIRR Sustainable intensification of high-yielding production systems may help meet increasing demands for food, fuel, and fiber worldwide. Specifically, corn stover is being removed by producers for livestock purposes, and stover is also targeted as a primary 2nd generation biofuel feedstock. The NEMEIRR experimental objectives are to quantify how stover removal (no removal, moderate removal, high removal) and tillage management (no-till, disk) affect crop yields, soil organic carbon, soil greenhouse gas emissions, and other soil responses (microbial community structure, function; soil health). This experiment is conducted in a fully irrigated continuous corn system in the western Corn Belt, and soil and plant measurements have been taken since study establishment in 2001. By: V.L. Jin (1 Sep 2016). (41 9 43.3 N. 96 14 41.4 W; 349 m asl). Thc soil is Tomck silt loam (a fine, smectitic. mesic Pachic Argiudoll) and Filbert silt loam (a fine, smectitie. mesie Verne Argialboll). Long-term (1981-2010) mean annual precipitation is 74 cm and tempera¬ture is 9.8°C The study has been in continuous corn since 2000. Thc experimental design is a randomized complete block with factorial treatments arranged in split plots. The whole-plot factor is tillage treatment (NT or CT) and the subplot factor is none (0%). medium (•35%). and high (40%) stover removal calcu¬lated on a mass basis. Nitrogen fertilizer was applied at 202 kg N ha-I yr I in 2001. 2002. 2004. 2007. 2008. 2009, and 2010.190 kg N hi t yr-I in 2003. and 168 kg N ha 1 yr- I in 2005 and 2006. Treatments (tillage) and subplot treatments (residue re¬moval levels) were randomly assigned in a factorial arrangement to whole-plot experimental units (9 by 45.6 m) and subplots within the whole plots (9 by 15.2 m) in six blocks. The previous crop for the entire area in 2000 was corn under rainfcd conditions. Before 2000. the study site was historically cropped with corn, soybean [Glycinc max (L.) Merr.). oat (Arena JoIliM L.), and alfalfa (Maid-ago saliva L). In the spring of 2001, residue was removed from the medium and high stover removal treatments using a flail chopper. The entire study was then disked to remove ridges formed during the previous crop year. In each successive year of the study, only the disk treatment area was tilled to a depth of 15 to 20 cm. usually in the spring before plant¬ing. Irrigation was conducted with a solid set sprinkler system in 2001, then supplemental water applications from 2002 to 2010 were made using a linear-move irrigation system. Irrigation treat¬ments were applied when deemed necessary, with annual rates averaging 12.5 ± 7.0 cm from 2001-2010 (Table I). Glyphosatc-tolerant corn hybrids adapted to eastern Nebraska have been used throughout the study. Corn was plant¬ed with a six-row planter in 76-cm rows at a rate *174.000 viable seeds ha 1, typically during the first week of May. Weed control was accomplished using glyphosate EN-(phosphonomethyl)gly¬eine] and atrazine (6.chloro-N-ethyl-AP-(1-methylethyl)-1.3.5- triazine-2.4-diamine) applications along with in-season cultiva.
Resource Title: GeoData catalog record.
File Name: Web Page, url: https://geodata.nal.usda.gov/geonetwork/srv/eng/catalog.search#/metadata/8e1365b5-6812-49e1-b11f-f898c9c51926
Irrigator Pro is an expert system designed to provide irrigation scheduling recommendations based on scientific data resulting in conservation minded irrigation management. The success of Irrigator Pro for Peanuts created interest in other groups. A collaborative effort between the NPRL, Cotton Commission, University of Georgia, and the Peanut Foundation was established to create comparable models for cotton and corn.
\nIrrigator Pro is an irrigation scheduling tool for peanuts, corn, and cotton developed by the USDA Agricultural Research Service National Peanut Research Lab. Irrigator Pro is an expert system designed to provide recommendations based on scientific data resulting in conservation-minded irrigation management while maintaining high yields.
\nThe Flint River Soil and Water Conservation District, with funding from USDA NRCS, partnered with the Peanut Lab and University of Georgia to develop a smartphone app and cloud-based platform for Irrigator Pro. The new version has been in beta testing for the last two crop seasons with a full launch planned for 2019.
\nIrrigator Pro is a trusted tool by farmers, crop consultants, Extension agents, and researchers across the Southeast. The original version is a desktop software that requires manual reading of soil moisture sensors in the field and manual data entry. The new smartphone app and cloud platform have automated the data collection process, integrating remote upload of soil moisture and temperature data with the Irrigator Pro model through the app and cloud platform.
\nResource Title: Website pointer to Irrigator Pro.
File Name: Web Page, url: https://irrigatorpro.org/
Irrigator Pro is an expert system designed to provide irrigation scheduling recommendations based on scientific data resulting in conservation minded irrigation management. The success of Irrigator Pro for Peanuts created interest in other groups. A collaborative effort between the NPRL, Cotton Commission, University of Georgia, and the Peanut Foundation was established to create comparable models for cotton and corn.
\nIrrigator Pro is an irrigation scheduling tool for peanuts, corn, and cotton developed by the USDA Agricultural Research Service National Peanut Research Lab. Irrigator Pro is an expert system designed to provide recommendations based on scientific data resulting in conservation-minded irrigation management while maintaining high yields.
\nThe Flint River Soil and Water Conservation District, with funding from USDA NRCS, partnered with the Peanut Lab and University of Georgia to develop a smartphone app and cloud-based platform for Irrigator Pro. The new version has been in beta testing for the last two crop seasons with a full launch planned for 2019.
\nIrrigator Pro is a trusted tool by farmers, crop consultants, Extension agents, and researchers across the Southeast. The original version is a desktop software that requires manual reading of soil moisture sensors in the field and manual data entry. The new smartphone app and cloud platform have automated the data collection process, integrating remote upload of soil moisture and temperature data with the Irrigator Pro model through the app and cloud platform.
\nThe mobile version of the app can be downloaded at https://irrigatorpro.org
Resource Title: Irrigator Pro for Corn.
File Name: Web Page, url: https://www.ars.usda.gov/research/software/download/?softwareid=248&modecode=60-44-05-00
download page
Irrigator Pro is an expert system designed to provide irrigation scheduling recommendations based on scientific data resulting in conservation minded irrigation management. The success of Irrigator Pro for Peanuts created interest in other groups. A collaborative effort between the NPRL, Cotton Commission, University of Georgia, and the Peanut Foundation was established to create comparable models for cotton and corn.
\nIrrigator Pro is an irrigation scheduling tool for peanuts, corn, and cotton developed by the USDA Agricultural Research Service National Peanut Research Lab. Irrigator Pro is an expert system designed to provide recommendations based on scientific data resulting in conservation-minded irrigation management while maintaining high yields.
\nThe Flint River Soil and Water Conservation District, with funding from USDA NRCS, partnered with the Peanut Lab and University of Georgia to develop a smartphone app and cloud-based platform for Irrigator Pro. The new version has been in beta testing for the last two crop seasons with a full launch planned for 2019.
\nIrrigator Pro is a trusted tool by farmers, crop consultants, Extension agents, and researchers across the Southeast. The original version is a desktop software that requires manual reading of soil moisture sensors in the field and manual data entry. The new smartphone app and cloud platform have automated the data collection process, integrating remote upload of soil moisture and temperature data with the Irrigator Pro model through the app and cloud platform.
\nThe mobile version of the app can be downloaded at https://irrigatorpro.org
Resource Title: Irrigator Pro for Cotton.
File Name: Web Page, url: https://www.ars.usda.gov/research/software/download/?softwareid=249&modecode=60-44-05-00
download page
Irrigator Pro is an expert system designed to provide irrigation scheduling recommendations based on scientific data resulting in conservation minded irrigation management. The success of Irrigator Pro for Peanuts created interest in other groups. A collaborative effort between the NPRL, Cotton Commission, University of Georgia, and the Peanut Foundation was established to create comparable models for cotton and corn.
\nIrrigator Pro is an irrigation scheduling tool for peanuts, corn, and cotton developed by the USDA Agricultural Research Service National Peanut Research Lab. Irrigator Pro is an expert system designed to provide recommendations based on scientific data resulting in conservation-minded irrigation management while maintaining high yields.
\nThe Flint River Soil and Water Conservation District, with funding from USDA NRCS, partnered with the Peanut Lab and University of Georgia to develop a smartphone app and cloud-based platform for Irrigator Pro. The new version has been in beta testing for the last two crop seasons with a full launch planned for 2019.
\nIrrigator Pro is a trusted tool by farmers, crop consultants, Extension agents, and researchers across the Southeast. The original version is a desktop software that requires manual reading of soil moisture sensors in the field and manual data entry. The new smartphone app and cloud platform have automated the data collection process, integrating remote upload of soil moisture and temperature data with the Irrigator Pro model through the app and cloud platform.
\nThe mobile version of the app can be downloaded at https://irrigatorpro.org
Resource Title: IrrigatorPro for Peanuts.
File Name: Web Page, url: https://www.ars.usda.gov/research/software/download/?softwareid=204&modecode=60-44-05-00
download page
This Microsoft Excel workbook (168.259 Mb) calculates Critical Ratios for triacylglycerols based on manually entered mass spectra, with isotope correction by isotope patterns calculated at www.ChemCalc.org. Average mass spectra across integrated peaks are manually entered according to the instructions in the Supplementary Material to the publication 'The Updated Bottom Up Solution for Mass Spectrometry of Soybean Oil in a Dietary Supplement Gelcap\".
Resource Title: Isotope-corrected Critical Ratio calculations.
File Name: Web Page, url: https://www.ars.usda.gov/research/software/download/?softwareid=458&modecode=80-40-05-05
download page
The variability of vegetation in rangelands can be over generalized in spatial representation and vegetation types mapped by moderate resolution vegetation maps. A high resolution (<1 meter), site specific, vegetation map may better represent the diversity and spatial complexity of rangelands – a necessity for analyzing pre-fire conditions. We pansharpened two 8-band VNIR Worldview 2 scenes to map pre-fire vegetation in Johnston Draw (1.8 square kilometers) in the Reynolds Creek Experimental Watershed in Southwest Idaho. The two Worldview 2 scenes represent peak greenness (June 14, 2023) and pre-fire (September 23, 2023) conditions with spatial resolutions of 50 centimeters and 42 centimeters, respectively. A prescribed fire burned the area on October 6, 2023. We trained a pixel based random forest classifier to map 10 site specific vegetation classes at a 50-centimeter spatial resolution. We applied a majority filter to remove speckling. Map accuracy was 83.3% when validated using a test set of 54, 30-meter diameter, plots selected to represent the following dominant vegetation types: deciduous/riparian (classes were collapsed into a single class for validation), living juniper, dead juniper, sagebrush, mixed low sage and bunchgrass, bitterbrush, and annual grasses. Barren and water classes were not validated. Training data was developed through a combination of site visit based knowledge and a training set of 30-meter diameter dominant vegetation class plots. The 1.5-billion-dollar cost of fire prevention, suppression, and restoration is stretched thin over the vast area of wildfire occurrence, where site-specific high-resolution vegetation maps are essential to mitigate fire potential and address post fire recovery. In addition to the pre-fire vegetation map a post fire burn product will also be submitted to Ag Data Commons and the related materials will be updated to reflect these complimentary submissions.
", "title": "Johnston Draw (Idaho) High Resolution Pre-Fire Vegetation Map 2023", "distribution": [ { "@type": "dcat:Distribution", "downloadURL": "https://ndownloader.figshare.com/files/45839475", "format": "tfw", "mediaType": "text/plain", "title": "JohnstonDrawVegetationMap2023.tfw" }, { "@type": "dcat:Distribution", "downloadURL": "https://ndownloader.figshare.com/files/45839478", "format": "tif", "mediaType": "image/tiff", "title": "JohnstonDrawVegetationMap2023.tif" }, { "@type": "dcat:Distribution", "downloadURL": "https://ndownloader.figshare.com/files/45839481", "format": "xml", "mediaType": "text/plain", "title": "JohnstonDrawVegetationMap2023.tif.aux.xml" }, { "@type": "dcat:Distribution", "downloadURL": "https://ndownloader.figshare.com/files/45839484", "format": "ovr", "mediaType": "image/tiff", "title": "JohnstonDrawVegetationMap2023.tif.ovr" }, { "@type": "dcat:Distribution", "downloadURL": "https://ndownloader.figshare.com/files/45839487", "format": "cpg", "mediaType": "text/plain", "title": "JohnstonDrawVegetationMap2023.tif.vat.cpg" }, { "@type": "dcat:Distribution", "downloadURL": "https://ndownloader.figshare.com/files/45839490", "format": "dbf", "mediaType": "application/x-dbf", "title": "JohnstonDrawVegetationMap2023.tif.vat.dbf" }, { "accessURL": "https://geodata.nal.usda.gov/geonetwork/srv/api/records/d125cfee-7df5-47a9-8fd6-14186a9f9ac6/formatters/xml", "@type": "dcat:Distribution", "format": "xml", "mediaType": "text/xml", "conformsTo": "http://www.isotc211.org/2005/gmd", "title": "Geodata ISO 19139 metadata" } ], "license": "https://creativecommons.org/licenses/by/4.0/", "bureauCode": [ "005:18" ], "modified": "2024-05-29", "publisher": { "@type": "org:Organization", "name": "Agricultural Research Service" }, "accrualPeriodicity": "irregular", "theme": [ "geospatial" ], "keyword": [ "RANGELANDS", "Vegetation mapping", "Random Forest", "High Resolution", "Remote Sensing", "Juniper Treatment", "Prescribed fire" ], "spatial": "{\"type\": \"Polygon\", \"coordinates\": [[[-116.8034633, 43.1345622], [-116.8036544, 43.1195483], [-116.7739607, 43.1193418], [-116.7737624, 43.1343556], [-116.8034633, 43.1345622]]]}" }, { "identifier": "10.6073/pasta/ce02b69b87ac78b088ec6bb1df64e536", "accessLevel": "public", "contactPoint": { "hasEmail": "mailto:jornada.data@nmsu.edu", "fn": "Data Manager" }, "programCode": [ "005:040" ], "description": "This data package contains hourly air temperature, relative humidity, wind speed, and wind direction summary data from Jornada Basin LTER Cross Scale Interactions Study (CSIS) Block-1 met station. Air temperature, relative humidity, wind speed and wind direction are measured and calculated at an automated meteorological station connected to a 900 MHz spread spectrum wireless network. Wind speed is measured at 37cm, 75 cm, 150 cm, and 300 cm, wind direction at approximately 3m, and air temperature and relative humidity at approximate 2.5m. Measurements are aggregated at intervals of 5, 30, 60 minutes and daily, with precipitation additionally provided with 1 second aggregation during precipitation events. Precipitation is not measured at Block 1 and Block 12 because of proximity to Block 2 and Block 13, respectively . This is an ONGOING dataset.
Resource Title: Website Pointer to html file.
File Name: Web Page, url: https://portal.edirepository.org/nis/mapbrowse?scope=knb-lter-jrn&identifier=210548031
Webpage with information and links to data files for download
30-minute Soil Moisture data at 10 cm at CSIS Block-1. Collection of soil volumetric water content data at Jornada LTER Cross-scale Interactions Study (CSIS) blocks, New Mexico, supports the environmental monitoring objectives of the Jornada LTER monitoring program that look at plant-soil water dynamics. Soil volumetric water content is measured at 10 cm depth at 3 locations at each of the 4 plots per block. The locations in each plot are under bare soil, under perennial grass, and under shrub. Volumetric water content, bulk electrical conductivity, soil temperature, and bulk dielectric permittivity are recorded every 30 minutes at an automated meteorological station installed at Jornada LTER CSIS Block-1 site. This is an ONGOING dataset.
Resource Title: Website Pointer to html file.
File Name: Web Page, url: https://portal.edirepository.org/nis/mapbrowse?scope=knb-lter-jrn&identifier=210548061
Webpage with information and links to data files for download
This data package contains 30-minute air temperature, relative humidity, and wind summary data from Jornada Basin LTER Cross Scale Interactions Study (CSIS) Block-1 met station. Average air temperature, relative humidity, wind speed and wind direction are measured and calculated at an automated meteorological station connected to a 900 MHz spread spectrum wireless network. Wind speed is measured at 37cm, 75 cm, 150 cm, and 300 cm, wind direction at approximately 3m, and air temperature and relative humidity at approximate 2.5m. Measurements are aggregated at intervals of 5, 30, 60 minutes and daily, with precipitation additionally provided with 1 second aggregation during precipitation events. The met station variables measured include air temperature, precipitation, relative humidity, wind direction, wind speed. Precipitation is not measured at Block 1 and Block 12 because of proximity to Block 2 and Block 13, respectively. This is an ONGOING dataset.
Resource Title: Website Pointer to html file.
File Name: Web Page, url: https://portal.edirepository.org/nis/mapbrowse?scope=knb-lter-jrn&identifier=210548016
Webpage with information and links to data files for download
This data package contains 5-minute air temperature and wind summary data from Jornada Basin LTER Cross Scale Interactions Study (CSIS) Block-1 met station. Average air temperature, wind speed, and wind direction are measured and calculated at an automated meteorological station connected to a 900 MHz spread spectrum wireless network. Wind speed is measured at 37cm, 75 cm, 150 cm, and 300 cm, wind direction at approximately 3m, and air temperature and relative humidity at approximate 2.5m. This is a subset of baseline weather data collected at the 15 Jornada Basin LTER CSIS study blocks, New Mexico. Measurements are aggregated at intervals of 5, 30, 60 minutes and daily, with precipitation additionally provided with 1 second aggregation during precipitation events. The met station variables measured include air temperature, precipitation, relative humidity, wind direction, wind speed. Precipitation is not measured at Block 1 and Block 12 because of proximity to Block 2 and Block 13, respectively . This is an ONGOING dataset.
Resource Title: Website Pointer to html file.
File Name: Web Page, url: https://portal.edirepository.org/nis/mapbrowse?scope=knb-lter-jrn&identifier=210548001
Webpage with information and links to data files for download
Daily Average of 30-minute Soil Volumetric Water Content data at 10 cm at CSIS Block-1. Collection of soil water content data at Jornada LTER Cross-scale Interactions Study (CSIS) blocks, New Mexico, supports the environmental monitoring objectives of the Jornada LTER monitoring program that look at plant-soil water dynamics. Soil volumetric water content is measured every 30 minutes at 10 cm depth at 3 locations at each of the 4 plots per block and averaged for the daily value. The locations in each plot are under bare soil, under perennial grass, and under shrub. Volumetric water content, bulk electrical conductivity, soil temperature, and bulk dielectric permittivity are recorded at an automated meteorological station installed at Jornada LTER CSIS Block-1 site. This is an ONGOING dataset.
Resource Title: Website Pointer to html file.
File Name: Web Page, url: https://portal.edirepository.org/nis/mapbrowse?scope=knb-lter-jrn&identifier=210548076
Webpage with information and links to data files for download
This data package contains hourly air temperature, relative humidity, wind speed, wind direction, and precipitation summary data from Jornada Basin LTER Cross Scale Interactions Study (CSIS) Block-1 met station. Air temperature, relative humidity, wind speed and wind direction are measured and calculated at an automated meteorological station connected to a 900 MHz spread spectrum wireless network. Wind speed is measured at 37cm, 75 cm, 150 cm, and 300 cm, wind direction at approximately 3m, and air temperature and relative humidity at approximate 2.5m. Measurements are aggregated at intervals of 5, 30, 60 minutes and daily, with precipitation additionally provided with 1 second aggregation during precipitation events. The met station variables measured include air temperature, precipitation, relative humidity, wind direction, wind speed. Precipitation is not measured at Block 1 and Block 12 because of proximity to Block 2 and Block 13, respectively . This is an ONGOING dataset.
Resource Title: Website Pointer to html file.
File Name: Web Page, url: https://portal.edirepository.org/nis/mapbrowse?scope=knb-lter-jrn&identifier=210548046
Webpage with information and links to data files for download
This data package contains hourly air temperature, relative humidity, wind speed, wind direction, and precipitation summary data from Jornada Basin LTER Cross Scale Interactions Study (CSIS) Block-10 met station. Air temperature, relative humidity, wind speed, wind direction, and precipitation are measured and calculated at an automated meteorological station connected to a 900 MHz spread spectrum wireless network. Wind speed is measured at 37cm, 75 cm, 150 cm, and 300 cm, wind direction at approximately 3m, and air temperature and relative humidity at approximate 2.5m. Measurements are aggregated at intervals of 5, 30, 60 minutes and daily, with precipitation additionally provided with 1 second aggregation during precipitation events. Precipitation is not measured at Block 1 and Block 12 because of proximity to Block 2 and Block 13, respectively . This is an ONGOING dataset.
Resource Title: Website Pointer to html file.
File Name: Web Page, url: https://portal.edirepository.org/nis/mapbrowse?scope=knb-lter-jrn&identifier=210548040
Webpage with information and links to data files for download
1-second summary precipitation data at CSIS Block-10 met station. Total precipitation per second is recorded only if there is measurable precipitation. This is recorded at an automated meteorological station installed at Jornada LTER CSIS Block-10 site.. This climate station is operated by the Jornada LTER Program. This is an ONGOING dataset. IMPORTANT: Rainfall is only recorded when a bucket tip occurs on the tipping bucket rain gauge. If there is missing data due to equipment or other problems, there will be no indication of this within this dataset. The user needs to review precipitation values in the 30 minute or hourly summary datasets to determine if there are missing data in this 1 second detailed precipitation dataset.
Resource Title: Website Pointer to html file.
File Name: Web Page, url: https://portal.edirepository.org/nis/mapbrowse?scope=knb-lter-jrn&identifier=210548099
Webpage with information and links to data files for download
30-minute Soil Moisture data at 10 cm at CSIS Block-10. Collection of soil volumetric water content data at Jornada LTER Cross-scale Interactions Study (CSIS) blocks, New Mexico, supports the environmental monitoring objectives of the Jornada LTER monitoring program that look at plant-soil water dynamics. Soil volumetric water content is measured at 10 cm depth at 3 locations at each of the 4 plots per block. The locations in each plot are under bare soil, under perennial grass, and under shrub. Volumetric water content, bulk electrical conductivity, soil temperature, and bulk dielectric permittivity are recorded every 30 minutes at an automated meteorological station installed at Jornada LTER CSIS Block-10 site. This is an ONGOING dataset.
Resource Title: Website Pointer to html file.
File Name: Web Page, url: https://portal.edirepository.org/nis/mapbrowse?scope=knb-lter-jrn&identifier=210548070
Webpage with information and links to data files for download
This data package contains 30-minute air temperature, relative humidity, and wind summary data from Jornada Basin LTER Cross Scale Interactions Study (CSIS) Block-1 met station. Average air temperature, relative humidity, wind speed, wind direction, and precipitation are measured and calculated at an automated meteorological station connected to a 900 MHz spread spectrum wireless network. Wind speed is measured at 37cm, 75 cm, 150 cm, and 300 cm, wind direction at approximately 3m, and air temperature and relative humidity at approximate 2.5m. Measurements are aggregated at intervals of 5, 30, 60 minutes and daily, with precipitation additionally provided with 1 second aggregation during precipitation events. The met station variables measured include air temperature, precipitation, relative humidity, wind direction, wind speed. Precipitation is not measured at Block 1 and Block 12 because of proximity to Block 2 and Block 13, respectively. This is an ONGOING dataset.
Resource Title: Website Pointer to html file.
File Name: Web Page, url: https://portal.edirepository.org/nis/mapbrowse?scope=knb-lter-jrn&identifier=210548025
Webpage with information and links to data files for download
This data package contains 5-minute air temperature and wind summary data from Jornada Basin LTER Cross Scale Interactions Study (CSIS) Block-10 met station. Average air temperature, wind speed, and wind direction are measured and calculated at an automated meteorological station connected to a 900 MHz spread spectrum wireless network. Wind speed is measured at 37cm, 75 cm, 150 cm, and 300 cm, wind direction at approximately 3m, and air temperature and relative humidity at approximate 2.5m. This is a subset of baseline weather data collected at the 15 Jornada Basin LTER CSIS study blocks, New Mexico. Measurements are aggregated at intervals of 5, 30, 60 minutes and daily, with precipitation additionally provided with 1 second aggregation during precipitation events. The met station variables measured include air temperature, precipitation, relative humidity, wind direction, wind speed. Precipitation is not measured at Block 1 and Block 12 because of proximity to Block 2 and Block 13, respectively . This is an ONGOING dataset.
Resource Title: Website Pointer to html file.
File Name: Web Page, url: https://portal.edirepository.org/nis/mapbrowse?scope=knb-lter-jrn&identifier=210548010
Webpage with information and links to data files for download
Daily Average of 30-minute Soil Volumetric Water Content data at 10 cm at CSIS Block-10. Collection of soil water content data at Jornada LTER Cross-scale Interactions Study (CSIS) blocks, New Mexico, supports the environmental monitoring objectives of the Jornada LTER monitoring program that look at plant-soil water dynamics. Soil volumetric water content is measured every 30 minutes at 10 cm depth at 3 locations at each of the 4 plots per block and averaged for the daily value. The locations in each plot are under bare soil, under perennial grass, and under shrub. Volumetric water content, bulk electrical conductivity, soil temperature, and bulk dielectric permittivity are recorded at an automated meteorological station installed at Jornada LTER CSIS Block-10 site. This is an ONGOING dataset.
Resource Title: Website Pointer to html file.
File Name: Web Page, url: https://portal.edirepository.org/nis/mapbrowse?scope=knb-lter-jrn&identifier=210548085
Webpage with information and links to data files for download
This data package contains hourly air temperature, relative humidity, wind speed, wind direction, and precipitation summary data from Jornada Basin LTER Cross Scale Interactions Study (CSIS) Block-10 met station. Air temperature, relative humidity, wind speed, wind direction, and precipitation are measured and calculated at an automated meteorological station connected to a 900 MHz spread spectrum wireless network. Wind speed is measured at 37cm, 75 cm, 150 cm, and 300 cm, wind direction at approximately 3m, and air temperature and relative humidity at approximate 2.5m. Measurements are aggregated at intervals of 5, 30, 60 minutes and daily, with precipitation additionally provided with 1 second aggregation during precipitation events. The met station variables measured include air temperature, precipitation, relative humidity, wind direction, wind speed. Precipitation is not measured at Block 1 and Block 12 because of proximity to Block 2 and Block 13, respectively . This is an ONGOING dataset.
Resource Title: Website Pointer to html file.
File Name: Web Page, url: https://portal.edirepository.org/nis/mapbrowse?scope=knb-lter-jrn&identifier=210548055
Webpage with information and links to data files for download
This data package contains hourly air temperature, relative humidity, wind speed, wind direction, and precipitation summary data from Jornada Basin LTER Cross Scale Interactions Study (CSIS) Block-11 met station. Air temperature, relative humidity, wind speed, wind direction, and precipitation are measured and calculated at an automated meteorological station connected to a 900 MHz spread spectrum wireless network. Wind speed is measured at 37cm, 75 cm, 150 cm, and 300 cm, wind direction at approximately 3m, and air temperature and relative humidity at approximate 2.5m. Measurements are aggregated at intervals of 5, 30, 60 minutes and daily, with precipitation additionally provided with 1 second aggregation during precipitation events. Precipitation is not measured at Block 1 and Block 12 because of proximity to Block 2 and Block 13, respectively . This is an ONGOING dataset.
Resource Title: Website Pointer to html file.
File Name: Web Page, url: https://portal.edirepository.org/nis/mapbrowse?scope=knb-lter-jrn&identifier=210548041
Webpage with information and links to data files for download
1-second summary precipitation data at CSIS Block-11 met station. Total precipitation per second is recorded only if there is measurable precipitation. This is recorded at an automated meteorological station installed at Jornada LTER CSIS Block-11 site.. This climate station is operated by the Jornada LTER Program. This is an ONGOING dataset. IMPORTANT: Rainfall is only recorded when a bucket tip occurs on the tipping bucket rain gauge. If there is missing data due to equipment or other problems, there will be no indication of this within this dataset. The user needs to review precipitation values in the 30 minute or hourly summary datasets to determine if there are missing data in this 1 second detailed precipitation dataset.
Resource Title: Website Pointer to html file.
File Name: Web Page, url: https://portal.edirepository.org/nis/mapbrowse?scope=knb-lter-jrn&identifier=210548100
Webpage with information and links to data files for download
30-minute Soil Moisture data at 10 cm at CSIS Block-11. Collection of soil volumetric water content data at Jornada LTER Cross-scale Interactions Study (CSIS) blocks, New Mexico, supports the environmental monitoring objectives of the Jornada LTER monitoring program that look at plant-soil water dynamics. Soil volumetric water content is measured at 10 cm depth at 3 locations at each of the 4 plots per block. The locations in each plot are under bare soil, under perennial grass, and under shrub. Volumetric water content, bulk electrical conductivity, soil temperature, and bulk dielectric permittivity are recorded every 30 minutes at an automated meteorological station installed at Jornada LTER CSIS Block-11 site. This is an ONGOING dataset.
Resource Title: Website Pointer to html file.
File Name: Web Page, url: https://portal.edirepository.org/nis/mapbrowse?scope=knb-lter-jrn&identifier=210548071
Webpage with information and links to data files for download
This data package contains 30-minute air temperature, relative humidity, and wind summary data from Jornada Basin LTER Cross Scale Interactions Study (CSIS) Block-1 met station. Average air temperature, relative humidity, wind speed, wind direction, and precipitation are measured and calculated at an automated meteorological station connected to a 900 MHz spread spectrum wireless network. Wind speed is measured at 37cm, 75 cm, 150 cm, and 300 cm, wind direction at approximately 3m, and air temperature and relative humidity at approximate 2.5m. Measurements are aggregated at intervals of 5, 30, 60 minutes and daily, with precipitation additionally provided with 1 second aggregation during precipitation events. The met station variables measured include air temperature, precipitation, relative humidity, wind direction, wind speed. Precipitation is not measured at Block 1 and Block 12 because of proximity to Block 2 and Block 13, respectively. This is an ONGOING dataset.
Resource Title: Website Pointer to html file.
File Name: Web Page, url: https://portal.edirepository.org/nis/mapbrowse?scope=knb-lter-jrn&identifier=210548026
Webpage with information and links to data files for download
This data package contains 5-minute air temperature and wind summary data from Jornada Basin LTER Cross Scale Interactions Study (CSIS) Block-11 met station. Average air temperature, wind speed, and wind direction are measured and calculated at an automated meteorological station connected to a 900 MHz spread spectrum wireless network. Wind speed is measured at 37cm, 75 cm, 150 cm, and 300 cm, wind direction at approximately 3m, and air temperature and relative humidity at approximate 2.5m. This is a subset of baseline weather data collected at the 15 Jornada Basin LTER CSIS study blocks, New Mexico. Measurements are aggregated at intervals of 5, 30, 60 minutes and daily, with precipitation additionally provided with 1 second aggregation during precipitation events. The met station variables measured include air temperature, precipitation, relative humidity, wind direction, wind speed. Precipitation is not measured at Block 1 and Block 12 because of proximity to Block 2 and Block 13, respectively . This is an ONGOING dataset.
Resource Title: Website Pointer to html file.
File Name: Web Page, url: https://portal.edirepository.org/nis/mapbrowse?scope=knb-lter-jrn&identifier=210548011
Webpage with information and links to data files for download
Daily Average of 30-minute Soil Volumetric Water Content data at 10 cm at CSIS Block-11. Collection of soil water content data at Jornada LTER Cross-scale Interactions Study (CSIS) blocks, New Mexico, supports the environmental monitoring objectives of the Jornada LTER monitoring program that look at plant-soil water dynamics. Soil volumetric water content is measured every 30 minutes at 10 cm depth at 3 locations at each of the 4 plots per block and averaged for the daily value. The locations in each plot are under bare soil, under perennial grass, and under shrub. Volumetric water content, bulk electrical conductivity, soil temperature, and bulk dielectric permittivity are recorded at an automated meteorological station installed at Jornada LTER CSIS Block-11 site. This is an ONGOING dataset.
Resource Title: Website Pointer to html file.
File Name: Web Page, url: https://portal.edirepository.org/nis/mapbrowse?scope=knb-lter-jrn&identifier=210548086
Webpage with information and links to data files for download
This data package contains hourly air temperature, relative humidity, wind speed, wind direction, and precipitation summary data from Jornada Basin LTER Cross Scale Interactions Study (CSIS) Block-11 met station. Air temperature, relative humidity, wind speed, wind direction, and precipitation are measured and calculated at an automated meteorological station connected to a 900 MHz spread spectrum wireless network. Wind speed is measured at 37cm, 75 cm, 150 cm, and 300 cm, wind direction at approximately 3m, and air temperature and relative humidity at approximate 2.5m. Measurements are aggregated at intervals of 5, 30, 60 minutes and daily, with precipitation additionally provided with 1 second aggregation during precipitation events. The met station variables measured include air temperature, precipitation, relative humidity, wind direction, wind speed. Precipitation is not measured at Block 1 and Block 12 because of proximity to Block 2 and Block 13, respectively . This is an ONGOING dataset.
Resource Title: Website Pointer to html file.
File Name: Web Page, url: https://portal.edirepository.org/nis/mapbrowse?scope=knb-lter-jrn&identifier=210548056
Webpage with information and links to data files for download
This data package contains hourly air temperature, relative humidity, wind speed, wind direction, and precipitation summary data from Jornada Basin LTER Cross Scale Interactions Study (CSIS) Block-12 met station. Air temperature, relative humidity, wind speed, wind direction, and precipitation are measured and calculated at an automated meteorological station connected to a 900 MHz spread spectrum wireless network. Wind speed is measured at 37cm, 75 cm, 150 cm, and 300 cm, wind direction at approximately 3m, and air temperature and relative humidity at approximate 2.5m. Measurements are aggregated at intervals of 5, 30, 60 minutes and daily, with precipitation additionally provided with 1 second aggregation during precipitation events. Precipitation is not measured at Block 1 and Block 12 because of proximity to Block 2 and Block 13, respectively . This is an ONGOING dataset.
Resource Title: Website Pointer to html file.
File Name: Web Page, url: https://portal.edirepository.org/nis/mapbrowse?scope=knb-lter-jrn&identifier=210548042
Webpage with information and links to data files for download
30-minute Soil Moisture data at 10 cm at CSIS Block-12. Collection of soil volumetric water content data at Jornada LTER Cross-scale Interactions Study (CSIS) blocks, New Mexico, supports the environmental monitoring objectives of the Jornada LTER monitoring program that look at plant-soil water dynamics. Soil volumetric water content is measured at 10 cm depth at 3 locations at each of the 4 plots per block. The locations in each plot are under bare soil, under perennial grass, and under shrub. Volumetric water content, bulk electrical conductivity, soil temperature, and bulk dielectric permittivity are recorded every 30 minutes at an automated meteorological station installed at Jornada LTER CSIS Block-12 site. This is an ONGOING dataset.
Resource Title: Website Pointer to html file.
File Name: Web Page, url: https://portal.edirepository.org/nis/mapbrowse?scope=knb-lter-jrn&identifier=210548072
Webpage with information and links to data files for download
This data package contains 30-minute air temperature, relative humidity, and wind summary data from Jornada Basin LTER Cross Scale Interactions Study (CSIS) Block-1 met station. Average air temperature, relative humidity, wind speed and wind direction are measured and calculated at an automated meteorological station connected to a 900 MHz spread spectrum wireless network. Wind speed is measured at 37cm, 75 cm, 150 cm, and 300 cm, wind direction at approximately 3m, and air temperature and relative humidity at approximate 2.5m. Measurements are aggregated at intervals of 5, 30, 60 minutes and daily, with precipitation additionally provided with 1 second aggregation during precipitation events. The met station variables measured include air temperature, precipitation, relative humidity, wind direction, wind speed. Precipitation is not measured at Block 1 and Block 12 because of proximity to Block 2 and Block 13, respectively. This is an ONGOING dataset.
Resource Title: Website Pointer to html file.
File Name: Web Page, url: https://portal.edirepository.org/nis/mapbrowse?scope=knb-lter-jrn&identifier=210548027
Webpage with information and links to data files for download
This data package contains 5-minute air temperature and wind summary data from Jornada Basin LTER Cross Scale Interactions Study (CSIS) Block-12 met station. Average air temperature, wind speed, and wind direction are measured and calculated at an automated meteorological station connected to a 900 MHz spread spectrum wireless network. Wind speed is measured at 37cm, 75 cm, 150 cm, and 300 cm, wind direction at approximately 3m, and air temperature and relative humidity at approximate 2.5m. This is a subset of baseline weather data collected at the 15 Jornada Basin LTER CSIS study blocks, New Mexico. Measurements are aggregated at intervals of 5, 30, 60 minutes and daily, with precipitation additionally provided with 1 second aggregation during precipitation events. The met station variables measured include air temperature, precipitation, relative humidity, wind direction, wind speed. Precipitation is not measured at Block 1 and Block 12 because of proximity to Block 2 and Block 13, respectively . This is an ONGOING dataset.
Resource Title: Website Pointer to html file.
File Name: Web Page, url: https://portal.edirepository.org/nis/mapbrowse?scope=knb-lter-jrn&identifier=210548012
Webpage with information and links to data files for download
Daily Average of 30-minute Soil Volumetric Water Content data at 10 cm at CSIS Block-12. Collection of soil water content data at Jornada LTER Cross-scale Interactions Study (CSIS) blocks, New Mexico, supports the environmental monitoring objectives of the Jornada LTER monitoring program that look at plant-soil water dynamics. Soil volumetric water content is measured every 30 minutes at 10 cm depth at 3 locations at each of the 4 plots per block and averaged for the daily value. The locations in each plot are under bare soil, under perennial grass, and under shrub. Volumetric water content, bulk electrical conductivity, soil temperature, and bulk dielectric permittivity are recorded at an automated meteorological station installed at Jornada LTER CSIS Block-12 site. This is an ONGOING dataset.
Resource Title: Website Pointer to html file.
File Name: Web Page, url: https://portal.edirepository.org/nis/mapbrowse?scope=knb-lter-jrn&identifier=210548087
Webpage with information and links to data files for download
This data package contains hourly air temperature, relative humidity, wind speed, wind direction, and precipitation summary data from Jornada Basin LTER Cross Scale Interactions Study (CSIS) Block-12 met station. Air temperature, relative humidity, wind speed, wind direction, and precipitation are measured and calculated at an automated meteorological station connected to a 900 MHz spread spectrum wireless network. Wind speed is measured at 37cm, 75 cm, 150 cm, and 300 cm, wind direction at approximately 3m, and air temperature and relative humidity at approximate 2.5m. Measurements are aggregated at intervals of 5, 30, 60 minutes and daily, with precipitation additionally provided with 1 second aggregation during precipitation events. The met station variables measured include air temperature, precipitation, relative humidity, wind direction, wind speed. Precipitation is not measured at Block 1 and Block 12 because of proximity to Block 2 and Block 13, respectively . This is an ONGOING dataset.
Resource Title: Website Pointer to html file.
File Name: Web Page, url: https://portal.edirepository.org/nis/mapbrowse?scope=knb-lter-jrn&identifier=210548057
Webpage with information and links to data files for download
This data package contains hourly air temperature, relative humidity, wind speed, wind direction, and precipitation summary data from Jornada Basin LTER Cross Scale Interactions Study (CSIS) Block-13 met station. Air temperature, relative humidity, wind speed, wind direction, and precipitation are measured and calculated at an automated meteorological station connected to a 900 MHz spread spectrum wireless network. Wind speed is measured at 37cm, 75 cm, 150 cm, and 300 cm, wind direction at approximately 3m, and air temperature and relative humidity at approximate 2.5m. Measurements are aggregated at intervals of 5, 30, 60 minutes and daily, with precipitation additionally provided with 1 second aggregation during precipitation events. Precipitation is not measured at Block 1 and Block 12 because of proximity to Block 2 and Block 13, respectively . This is an ONGOING dataset.
Resource Title: Website Pointer to html file.
File Name: Web Page, url: https://portal.edirepository.org/nis/mapbrowse?scope=knb-lter-jrn&identifier=210548043
Webpage with information and links to data files for download
1-second summary precipitation data at CSIS Block-13 met station. Total precipitation per second is recorded only if there is measurable precipitation. This is recorded at an automated meteorological station installed at Jornada LTER CSIS Block-13 site.. This climate station is operated by the Jornada LTER Program. This is an ONGOING dataset. IMPORTANT: Rainfall is only recorded when a bucket tip occurs on the tipping bucket rain gauge. If there is missing data due to equipment or other problems, there will be no indication of this within this dataset. The user needs to review precipitation values in the 30 minute or hourly summary datasets to determine if there are missing data in this 1 second detailed precipitation dataset.
Resource Title: Website Pointer to html file.
File Name: Web Page, url: https://portal.edirepository.org/nis/mapbrowse?scope=knb-lter-jrn&identifier=210548101
Webpage with information and links to data files for download
30-minute Soil Moisture data at 10 cm at CSIS Block-13. Collection of soil volumetric water content data at Jornada LTER Cross-scale Interactions Study (CSIS) blocks, New Mexico, supports the environmental monitoring objectives of the Jornada LTER monitoring program that look at plant-soil water dynamics. Soil volumetric water content is measured at 10 cm depth at 3 locations at each of the 4 plots per block. The locations in each plot are under bare soil, under perennial grass, and under shrub. Volumetric water content, bulk electrical conductivity, soil temperature, and bulk dielectric permittivity are recorded every 30 minutes at an automated meteorological station installed at Jornada LTER CSIS Block-13 site. This is an ONGOING dataset.
Resource Title: Website Pointer to html file.
File Name: Web Page, url: https://portal.edirepository.org/nis/mapbrowse?scope=knb-lter-jrn&identifier=210548073
Webpage with information and links to data files for download
This data package contains 30-minute air temperature, relative humidity, and wind summary data from Jornada Basin LTER Cross Scale Interactions Study (CSIS) Block-1 met station. Average air temperature, relative humidity, wind speed, wind direction, and precipitation are measured and calculated at an automated meteorological station connected to a 900 MHz spread spectrum wireless network. Wind speed is measured at 37cm, 75 cm, 150 cm, and 300 cm, wind direction at approximately 3m, and air temperature and relative humidity at approximate 2.5m. Measurements are aggregated at intervals of 5, 30, 60 minutes and daily, with precipitation additionally provided with 1 second aggregation during precipitation events. The met station variables measured include air temperature, precipitation, relative humidity, wind direction, wind speed. Precipitation is not measured at Block 1 and Block 12 because of proximity to Block 2 and Block 13, respectively. This is an ONGOING dataset.
Resource Title: Website Pointer to html file.
File Name: Web Page, url: https://portal.edirepository.org/nis/mapbrowse?scope=knb-lter-jrn&identifier=210548028
Webpage with information and links to data files for download
This data package contains 5-minute air temperature and wind summary data from Jornada Basin LTER Cross Scale Interactions Study (CSIS) Block-13 met station. Average air temperature, wind speed, and wind direction are measured and calculated at an automated meteorological station connected to a 900 MHz spread spectrum wireless network. Wind speed is measured at 37cm, 75 cm, 150 cm, and 300 cm, wind direction at approximately 3m, and air temperature and relative humidity at approximate 2.5m. This is a subset of baseline weather data collected at the 15 Jornada Basin LTER CSIS study blocks, New Mexico. Measurements are aggregated at intervals of 5, 30, 60 minutes and daily, with precipitation additionally provided with 1 second aggregation during precipitation events. The met station variables measured include air temperature, precipitation, relative humidity, wind direction, wind speed. Precipitation is not measured at Block 1 and Block 12 because of proximity to Block 2 and Block 13, respectively . This is an ONGOING dataset.
Resource Title: Website Pointer to html file.
File Name: Web Page, url: https://portal.edirepository.org/nis/mapbrowse?scope=knb-lter-jrn&identifier=210548013
Webpage with information and links to data files for download
Daily Average of 30-minute Soil Volumetric Water Content data at 10 cm at CSIS Block-13. Collection of soil water content data at Jornada LTER Cross-scale Interactions Study (CSIS) blocks, New Mexico, supports the environmental monitoring objectives of the Jornada LTER monitoring program that look at plant-soil water dynamics. Soil volumetric water content is measured every 30 minutes at 10 cm depth at 3 locations at each of the 4 plots per block and averaged for the daily value. The locations in each plot are under bare soil, under perennial grass, and under shrub. Volumetric water content, bulk electrical conductivity, soil temperature, and bulk dielectric permittivity are recorded at an automated meteorological station installed at Jornada LTER CSIS Block-13 site. This is an ONGOING dataset.
Resource Title: Website Pointer to html file.
File Name: Web Page, url: https://portal.edirepository.org/nis/mapbrowse?scope=knb-lter-jrn&identifier=210548088
Webpage with information and links to data files for download
This data package contains hourly air temperature, relative humidity, wind speed, wind direction, and precipitation summary data from Jornada Basin LTER Cross Scale Interactions Study (CSIS) Block-13 met station. Air temperature, relative humidity, wind speed, wind direction, and precipitation are measured and calculated at an automated meteorological station connected to a 900 MHz spread spectrum wireless network. Wind speed is measured at 37cm, 75 cm, 150 cm, and 300 cm, wind direction at approximately 3m, and air temperature and relative humidity at approximate 2.5m. Measurements are aggregated at intervals of 5, 30, 60 minutes and daily, with precipitation additionally provided with 1 second aggregation during precipitation events. The met station variables measured include air temperature, precipitation, relative humidity, wind direction, wind speed. Precipitation is not measured at Block 1 and Block 12 because of proximity to Block 2 and Block 13, respectively . This is an ONGOING dataset.
Resource Title: Website Pointer to html file.
File Name: Web Page, url: https://portal.edirepository.org/nis/mapbrowse?scope=knb-lter-jrn&identifier=210548058
Webpage with information and links to data files for download
This data package contains hourly air temperature, relative humidity, wind speed, wind direction, and precipitation summary data from Jornada Basin LTER Cross Scale Interactions Study (CSIS) Block-14 met station. Air temperature, relative humidity, wind speed, wind direction, and precipitation are measured and calculated at an automated meteorological station connected to a 900 MHz spread spectrum wireless network. Wind speed is measured at 37cm, 75 cm, 150 cm, and 300 cm, wind direction at approximately 3m, and air temperature and relative humidity at approximate 2.5m. Measurements are aggregated at intervals of 5, 30, 60 minutes and daily, with precipitation additionally provided with 1 second aggregation during precipitation events. Precipitation is not measured at Block 1 and Block 12 because of proximity to Block 2 and Block 13, respectively . This is an ONGOING dataset.
Resource Title: Website Pointer to html file.
File Name: Web Page, url: https://portal.edirepository.org/nis/mapbrowse?scope=knb-lter-jrn&identifier=210548044
Webpage with information and links to data files for download
1-second summary precipitation data at CSIS Block-14 met station. Total precipitation per second is recorded only if there is measurable precipitation. This is recorded at an automated meteorological station installed at Jornada LTER CSIS Block-14 site.. This climate station is operated by the Jornada LTER Program. This is an ONGOING dataset. IMPORTANT: Rainfall is only recorded when a bucket tip occurs on the tipping bucket rain gauge. If there is missing data due to equipment or other problems, there will be no indication of this within this dataset. The user needs to review precipitation values in the 30 minute or hourly summary datasets to determine if there are missing data in this 1 second detailed precipitation dataset.
Resource Title: Website Pointer to html file.
File Name: Web Page, url: https://portal.edirepository.org/nis/mapbrowse?scope=knb-lter-jrn&identifier=210548102
Webpage with information and links to data files for download
30-minute Soil Moisture data at 10 cm at CSIS Block-14. Collection of soil volumetric water content data at Jornada LTER Cross-scale Interactions Study (CSIS) blocks, New Mexico, supports the environmental monitoring objectives of the Jornada LTER monitoring program that look at plant-soil water dynamics. Soil volumetric water content is measured at 10 cm depth at 3 locations at each of the 4 plots per block. The locations in each plot are under bare soil, under perennial grass, and under shrub. Volumetric water content, bulk electrical conductivity, soil temperature, and bulk dielectric permittivity are recorded every 30 minutes at an automated meteorological station installed at Jornada LTER CSIS Block-14 site. This is an ONGOING dataset.
Resource Title: Website Pointer to html file.
File Name: Web Page, url: https://portal.edirepository.org/nis/mapbrowse?scope=knb-lter-jrn&identifier=210548074
Webpage with information and links to data files for download
This data package contains 30-minute air temperature, relative humidity, and wind summary data from Jornada Basin LTER Cross Scale Interactions Study (CSIS) Block-1 met station. Average air temperature, relative humidity, wind speed, wind direction, and precipitation are measured and calculated at an automated meteorological station connected to a 900 MHz spread spectrum wireless network. Wind speed is measured at 37cm, 75 cm, 150 cm, and 300 cm, wind direction at approximately 3m, and air temperature and relative humidity at approximate 2.5m. Measurements are aggregated at intervals of 5, 30, 60 minutes and daily, with precipitation additionally provided with 1 second aggregation during precipitation events. The met station variables measured include air temperature, precipitation, relative humidity, wind direction, wind speed. Precipitation is not measured at Block 1 and Block 12 because of proximity to Block 2 and Block 13, respectively. This is an ONGOING dataset.
Resource Title: Website Pointer to html file.
File Name: Web Page, url: https://portal.edirepository.org/nis/mapbrowse?scope=knb-lter-jrn&identifier=210548029
Webpage with information and links to data files for download
This data package contains 5-minute air temperature and wind summary data from Jornada Basin LTER Cross Scale Interactions Study (CSIS) Block-14 met station. Average air temperature, wind speed, and wind direction are measured and calculated at an automated meteorological station connected to a 900 MHz spread spectrum wireless network. Wind speed is measured at 37cm, 75 cm, 150 cm, and 300 cm, wind direction at approximately 3m, and air temperature and relative humidity at approximate 2.5m. This is a subset of baseline weather data collected at the 15 Jornada Basin LTER CSIS study blocks, New Mexico. Measurements are aggregated at intervals of 5, 30, 60 minutes and daily, with precipitation additionally provided with 1 second aggregation during precipitation events. The met station variables measured include air temperature, precipitation, relative humidity, wind direction, wind speed. Precipitation is not measured at Block 1 and Block 12 because of proximity to Block 2 and Block 13, respectively . This is an ONGOING dataset.
Resource Title: Website Pointer to html file.
File Name: Web Page, url: https://portal.edirepository.org/nis/mapbrowse?scope=knb-lter-jrn&identifier=210548014
Webpage with information and links to data files for download
Daily Average of 30-minute Soil Volumetric Water Content data at 10 cm at CSIS Block-14. Collection of soil water content data at Jornada LTER Cross-scale Interactions Study (CSIS) blocks, New Mexico, supports the environmental monitoring objectives of the Jornada LTER monitoring program that look at plant-soil water dynamics. Soil volumetric water content is measured every 30 minutes at 10 cm depth at 3 locations at each of the 4 plots per block and averaged for the daily value. The locations in each plot are under bare soil, under perennial grass, and under shrub. Volumetric water content, bulk electrical conductivity, soil temperature, and bulk dielectric permittivity are recorded at an automated meteorological station installed at Jornada LTER CSIS Block-14 site. This is an ONGOING dataset.
Resource Title: Website Pointer to html file.
File Name: Web Page, url: https://portal.edirepository.org/nis/mapbrowse?scope=knb-lter-jrn&identifier=210548089
Webpage with information and links to data files for download
This data package contains hourly air temperature, relative humidity, wind speed, wind direction, and precipitation summary data from Jornada Basin LTER Cross Scale Interactions Study (CSIS) Block-14 met station. Air temperature, relative humidity, wind speed, wind direction, and precipitation are measured and calculated at an automated meteorological station connected to a 900 MHz spread spectrum wireless network. Wind speed is measured at 37cm, 75 cm, 150 cm, and 300 cm, wind direction at approximately 3m, and air temperature and relative humidity at approximate 2.5m. Measurements are aggregated at intervals of 5, 30, 60 minutes and daily, with precipitation additionally provided with 1 second aggregation during precipitation events. The met station variables measured include air temperature, precipitation, relative humidity, wind direction, wind speed. Precipitation is not measured at Block 1 and Block 12 because of proximity to Block 2 and Block 13, respectively . This is an ONGOING dataset.
Resource Title: Website Pointer to html file.
File Name: Web Page, url: https://portal.edirepository.org/nis/mapbrowse?scope=knb-lter-jrn&identifier=210548059
Webpage with information and links to data files for download
This data package contains hourly air temperature, relative humidity, wind speed, wind direction, and precipitation summary data from Jornada Basin LTER Cross Scale Interactions Study (CSIS) Block-15 met station. Air temperature, relative humidity, wind speed, wind direction, and precipitation are measured and calculated at an automated meteorological station connected to a 900 MHz spread spectrum wireless network. Wind speed is measured at 37cm, 75 cm, 150 cm, and 300 cm, wind direction at approximately 3m, and air temperature and relative humidity at approximate 2.5m. Measurements are aggregated at intervals of 5, 30, 60 minutes and daily, with precipitation additionally provided with 1 second aggregation during precipitation events. Precipitation is not measured at Block 1 and Block 12 because of proximity to Block 2 and Block 13, respectively . This is an ONGOING dataset.
Resource Title: Website Pointer to html file.
File Name: Web Page, url: https://portal.edirepository.org/nis/mapbrowse?scope=knb-lter-jrn&identifier=210548045
Webpage with information and links to data files for download
1-second summary precipitation data at CSIS Block-15 met station. Total precipitation per second is recorded only if there is measurable precipitation. This is recorded at an automated meteorological station installed at Jornada LTER CSIS Block-15 site.. This climate station is operated by the Jornada LTER Program. This is an ONGOING dataset. IMPORTANT: Rainfall is only recorded when a bucket tip occurs on the tipping bucket rain gauge. If there is missing data due to equipment or other problems, there will be no indication of this within this dataset. The user needs to review precipitation values in the 30 minute or hourly summary datasets to determine if there are missing data in this 1 second detailed precipitation dataset.
Resource Title: Website Pointer to html file.
File Name: Web Page, url: https://portal.edirepository.org/nis/mapbrowse?scope=knb-lter-jrn&identifier=210548103
Webpage with information and links to data files for download
30-minute Soil Moisture data at 10 cm at CSIS Block-15. Collection of soil volumetric water content data at Jornada LTER Cross-scale Interactions Study (CSIS) blocks, New Mexico, supports the environmental monitoring objectives of the Jornada LTER monitoring program that look at plant-soil water dynamics. Soil volumetric water content is measured at 10 cm depth at 3 locations at each of the 4 plots per block. The locations in each plot are under bare soil, under perennial grass, and under shrub. Volumetric water content, bulk electrical conductivity, soil temperature, and bulk dielectric permittivity are recorded every 30 minutes at an automated meteorological station installed at Jornada LTER CSIS Block-15 site. This is an ONGOING dataset.
Resource Title: Website Pointer to html file.
File Name: Web Page, url: https://portal.edirepository.org/nis/mapbrowse?scope=knb-lter-jrn&identifier=210548075
Webpage with information and links to data files for download
This data package contains 30-minute air temperature, relative humidity, and wind summary data from Jornada Basin LTER Cross Scale Interactions Study (CSIS) Block-1 met station. Average air temperature, relative humidity, wind speed, wind direction, and precipitation are measured and calculated at an automated meteorological station connected to a 900 MHz spread spectrum wireless network. Wind speed is measured at 37cm, 75 cm, 150 cm, and 300 cm, wind direction at approximately 3m, and air temperature and relative humidity at approximate 2.5m. Measurements are aggregated at intervals of 5, 30, 60 minutes and daily, with precipitation additionally provided with 1 second aggregation during precipitation events. The met station variables measured include air temperature, precipitation, relative humidity, wind direction, wind speed. Precipitation is not measured at Block 1 and Block 12 because of proximity to Block 2 and Block 13, respectively. This is an ONGOING dataset.
Resource Title: Website Pointer to html file.
File Name: Web Page, url: https://portal.edirepository.org/nis/mapbrowse?scope=knb-lter-jrn&identifier=210548030
Webpage with information and links to data files for download
This data package contains 5-minute air temperature and wind summary data from Jornada Basin LTER Cross Scale Interactions Study (CSIS) Block-15 met station. Average air temperature, wind speed, and wind direction are measured and calculated at an automated meteorological station connected to a 900 MHz spread spectrum wireless network. Wind speed is measured at 37cm, 75 cm, 150 cm, and 300 cm, wind direction at approximately 3m, and air temperature and relative humidity at approximate 2.5m. This is a subset of baseline weather data collected at the 15 Jornada Basin LTER CSIS study blocks, New Mexico. Measurements are aggregated at intervals of 5, 30, 60 minutes and daily, with precipitation additionally provided with 1 second aggregation during precipitation events. The met station variables measured include air temperature, precipitation, relative humidity, wind direction, wind speed. Precipitation is not measured at Block 1 and Block 12 because of proximity to Block 2 and Block 13, respectively . This is an ONGOING dataset.
Resource Title: Website Pointer to html file.
File Name: Web Page, url: https://portal.edirepository.org/nis/mapbrowse?scope=knb-lter-jrn&identifier=210548015
Webpage with information and links to data files for download
Daily Average of 30-minute Soil Volumetric Water Content data at 10 cm at CSIS Block-15. Collection of soil water content data at Jornada LTER Cross-scale Interactions Study (CSIS) blocks, New Mexico, supports the environmental monitoring objectives of the Jornada LTER monitoring program that look at plant-soil water dynamics. Soil volumetric water content is measured every 30 minutes at 10 cm depth at 3 locations at each of the 4 plots per block and averaged for the daily value. The locations in each plot are under bare soil, under perennial grass, and under shrub. Volumetric water content, bulk electrical conductivity, soil temperature, and bulk dielectric permittivity are recorded at an automated meteorological station installed at Jornada LTER CSIS Block-15 site. This is an ONGOING dataset.
Resource Title: Website Pointer to html file.
File Name: Web Page, url: https://portal.edirepository.org/nis/mapbrowse?scope=knb-lter-jrn&identifier=210548090
Webpage with information and links to data files for download
This data package contains hourly air temperature, relative humidity, wind speed, wind direction, and precipitation summary data from Jornada Basin LTER Cross Scale Interactions Study (CSIS) Block-15 met station. Air temperature, relative humidity, wind speed, wind direction, and precipitation are measured and calculated at an automated meteorological station connected to a 900 MHz spread spectrum wireless network. Wind speed is measured at 37cm, 75 cm, 150 cm, and 300 cm, wind direction at approximately 3m, and air temperature and relative humidity at approximate 2.5m. Measurements are aggregated at intervals of 5, 30, 60 minutes and daily, with precipitation additionally provided with 1 second aggregation during precipitation events. The met station variables measured include air temperature, precipitation, relative humidity, wind direction, wind speed. Precipitation is not measured at Block 1 and Block 12 because of proximity to Block 2 and Block 13, respectively . This is an ONGOING dataset.
Resource Title: Website Pointer to html file.
File Name: Web Page, url: https://portal.edirepository.org/nis/mapbrowse?scope=knb-lter-jrn&identifier=210548060
Webpage with information and links to data files for download
This data package contains hourly air temperature, relative humidity, wind speed, wind direction, and precipitation summary data from Jornada Basin LTER Cross Scale Interactions Study (CSIS) Block-2 met station. Air temperature, relative humidity, wind speed, wind direction, and precipitation are measured and calculated at an automated meteorological station connected to a 900 MHz spread spectrum wireless network. Wind speed is measured at 37cm, 75 cm, 150 cm, and 300 cm, wind direction at approximately 3m, and air temperature and relative humidity at approximate 2.5m. Measurements are aggregated at intervals of 5, 30, 60 minutes and daily, with precipitation additionally provided with 1 second aggregation during precipitation events. Precipitation is not measured at Block 1 and Block 12 because of proximity to Block 2 and Block 13, respectively . This is an ONGOING dataset.
Resource Title: Website Pointer to html file.
File Name: Web Page, url: https://portal.edirepository.org/nis/mapbrowse?scope=knb-lter-jrn&identifier=210548032
Webpage with information and links to data files for download
1-second summary precipitation data at CSIS Block-2 met station. Total precipitation per second is recorded only if there is measurable precipitation. This is recorded at an automated meteorological station installed at Jornada LTER CSIS Block-2 site.. This climate station is operated by the Jornada LTER Program. This is an ONGOING dataset. IMPORTANT: Rainfall is only recorded when a bucket tip occurs on the tipping bucket rain gauge. If there is missing data due to equipment or other problems, there will be no indication of this within this dataset. The user needs to review precipitation values in the 30 minute or hourly summary datasets to determine if there are missing data in this 1 second detailed precipitation dataset.
Resource Title: Website Pointer to html file.
File Name: Web Page, url: https://portal.edirepository.org/nis/mapbrowse?scope=knb-lter-jrn&identifier=210548091
Webpage with information and links to data files for download
30-minute Soil Moisture data at 10 cm at CSIS Block-2. Collection of soil volumetric water content data at Jornada LTER Cross-scale Interactions Study (CSIS) blocks, New Mexico, supports the environmental monitoring objectives of the Jornada LTER monitoring program that look at plant-soil water dynamics. Soil volumetric water content is measured at 10 cm depth at 3 locations at each of the 4 plots per block. The locations in each plot are under bare soil, under perennial grass, and under shrub. Volumetric water content, bulk electrical conductivity, soil temperature, and bulk dielectric permittivity are recorded every 30 minutes at an automated meteorological station installed at Jornada LTER CSIS Block-2 site. This is an ONGOING dataset.
Resource Title: Website Pointer to html file.
File Name: Web Page, url: https://portal.edirepository.org/nis/mapbrowse?scope=knb-lter-jrn&identifier=210548062
Webpage with information and links to data files for download
This data package contains 30-minute air temperature, relative humidity, and wind summary data from Jornada Basin LTER Cross Scale Interactions Study (CSIS) Block-1 met station. Average air temperature, relative humidity, wind speed, wind direction, and precipitation are measured and calculated at an automated meteorological station connected to a 900 MHz spread spectrum wireless network. Wind speed is measured at 37cm, 75 cm, 150 cm, and 300 cm, wind direction at approximately 3m, and air temperature and relative humidity at approximate 2.5m. Measurements are aggregated at intervals of 5, 30, 60 minutes and daily, with precipitation additionally provided with 1 second aggregation during precipitation events. The met station variables measured include air temperature, precipitation, relative humidity, wind direction, wind speed. Precipitation is not measured at Block 1 and Block 12 because of proximity to Block 2 and Block 13, respectively. This is an ONGOING dataset.
Resource Title: Website Pointer to html file.
File Name: Web Page, url: https://portal.edirepository.org/nis/mapbrowse?scope=knb-lter-jrn&identifier=210548017
Webpage with information and links to data files for download
This data package contains 5-minute air temperature and wind summary data from Jornada Basin LTER Cross Scale Interactions Study (CSIS) Block-2 met station. Average air temperature, wind speed, and wind direction are measured and calculated at an automated meteorological station connected to a 900 MHz spread spectrum wireless network. Wind speed is measured at 37cm, 75 cm, 150 cm, and 300 cm, wind direction at approximately 3m, and air temperature and relative humidity at approximate 2.5m. This is a subset of baseline weather data collected at the 15 Jornada Basin LTER CSIS study blocks, New Mexico. Measurements are aggregated at intervals of 5, 30, 60 minutes and daily, with precipitation additionally provided with 1 second aggregation during precipitation events. The met station variables measured include air temperature, precipitation, relative humidity, wind direction, wind speed. Precipitation is not measured at Block 1 and Block 12 because of proximity to Block 2 and Block 13, respectively . This is an ONGOING dataset.
Resource Title: Website Pointer to html file.
File Name: Web Page, url: https://portal.edirepository.org/nis/mapbrowse?scope=knb-lter-jrn&identifier=210548002
Webpage with information and links to data files for download
Daily Average of 30-minute Soil Volumetric Water Content data at 10 cm at CSIS Block-2. Collection of soil water content data at Jornada LTER Cross-scale Interactions Study (CSIS) blocks, New Mexico, supports the environmental monitoring objectives of the Jornada LTER monitoring program that look at plant-soil water dynamics. Soil volumetric water content is measured every 30 minutes at 10 cm depth at 3 locations at each of the 4 plots per block and averaged for the daily value. The locations in each plot are under bare soil, under perennial grass, and under shrub. Volumetric water content, bulk electrical conductivity, soil temperature, and bulk dielectric permittivity are recorded at an automated meteorological station installed at Jornada LTER CSIS Block-2 site. This is an ONGOING dataset.
Resource Title: Website Pointer to html file.
File Name: Web Page, url: https://portal.edirepository.org/nis/mapbrowse?scope=knb-lter-jrn&identifier=210548077
Webpage with information and links to data files for download
This data package contains hourly air temperature, relative humidity, wind speed, wind direction, and precipitation summary data from Jornada Basin LTER Cross Scale Interactions Study (CSIS) Block-2 met station. Air temperature, relative humidity, wind speed, wind direction, and precipitation are measured and calculated at an automated meteorological station connected to a 900 MHz spread spectrum wireless network. Wind speed is measured at 37cm, 75 cm, 150 cm, and 300 cm, wind direction at approximately 3m, and air temperature and relative humidity at approximate 2.5m. Measurements are aggregated at intervals of 5, 30, 60 minutes and daily, with precipitation additionally provided with 1 second aggregation during precipitation events. The met station variables measured include air temperature, precipitation, relative humidity, wind direction, wind speed. Precipitation is not measured at Block 1 and Block 12 because of proximity to Block 2 and Block 13, respectively . This is an ONGOING dataset.
Resource Title: Website Pointer to html file.
File Name: Web Page, url: https://portal.edirepository.org/nis/mapbrowse?scope=knb-lter-jrn&identifier=210548047
Webpage with information and links to data files for download
This data package contains hourly air temperature, relative humidity, wind speed, wind direction, and precipitation summary data from Jornada Basin LTER Cross Scale Interactions Study (CSIS) Block-3 met station. Air temperature, relative humidity, wind speed, wind direction, and precipitation are measured and calculated at an automated meteorological station connected to a 900 MHz spread spectrum wireless network. Wind speed is measured at 37cm, 75 cm, 150 cm, and 300 cm, wind direction at approximately 3m, and air temperature and relative humidity at approximate 2.5m. Measurements are aggregated at intervals of 5, 30, 60 minutes and daily, with precipitation additionally provided with 1 second aggregation during precipitation events. Precipitation is not measured at Block 1 and Block 12 because of proximity to Block 2 and Block 13, respectively . This is an ONGOING dataset.
Resource Title: Website Pointer to html file.
File Name: Web Page, url: https://portal.edirepository.org/nis/mapbrowse?scope=knb-lter-jrn&identifier=210548033
Webpage with information and links to data files for download
1-second summary precipitation data at CSIS Block-3 met station. Total precipitation per second is recorded only if there is measurable precipitation. This is recorded at an automated meteorological station installed at Jornada LTER CSIS Block-3 site.. This climate station is operated by the Jornada LTER Program. This is an ONGOING dataset. IMPORTANT: Rainfall is only recorded when a bucket tip occurs on the tipping bucket rain gauge. If there is missing data due to equipment or other problems, there will be no indication of this within this dataset. The user needs to review precipitation values in the 30 minute or hourly summary datasets to determine if there are missing data in this 1 second detailed precipitation dataset.
Resource Title: Website Pointer to html file.
File Name: Web Page, url: https://portal.edirepository.org/nis/mapbrowse?scope=knb-lter-jrn&identifier=210548092
Webpage with information and links to data files for download
30-minute Soil Moisture data at 10 cm at CSIS Block-3. Collection of soil volumetric water content data at Jornada LTER Cross-scale Interactions Study (CSIS) blocks, New Mexico, supports the environmental monitoring objectives of the Jornada LTER monitoring program that look at plant-soil water dynamics. Soil volumetric water content is measured at 10 cm depth at 3 locations at each of the 4 plots per block. The locations in each plot are under bare soil, under perennial grass, and under shrub. Volumetric water content, bulk electrical conductivity, soil temperature, and bulk dielectric permittivity are recorded every 30 minutes at an automated meteorological station installed at Jornada LTER CSIS Block-3 site. This is an ONGOING dataset.
Resource Title: Website Pointer to html file.
File Name: Web Page, url: https://portal.edirepository.org/nis/mapbrowse?scope=knb-lter-jrn&identifier=210548063
Webpage with information and links to data files for download
This data package contains 30-minute air temperature, relative humidity, and wind summary data from Jornada Basin LTER Cross Scale Interactions Study (CSIS) Block-1 met station. Average air temperature, relative humidity, wind speed, wind direction, and precipitation are measured and calculated at an automated meteorological station connected to a 900 MHz spread spectrum wireless network. Wind speed is measured at 37cm, 75 cm, 150 cm, and 300 cm, wind direction at approximately 3m, and air temperature and relative humidity at approximate 2.5m. Measurements are aggregated at intervals of 5, 30, 60 minutes and daily, with precipitation additionally provided with 1 second aggregation during precipitation events. The met station variables measured include air temperature, precipitation, relative humidity, wind direction, wind speed. Precipitation is not measured at Block 1 and Block 12 because of proximity to Block 2 and Block 13, respectively. This is an ONGOING dataset.
Resource Title: Website Pointer to html file.
File Name: Web Page, url: https://portal.edirepository.org/nis/mapbrowse?scope=knb-lter-jrn&identifier=210548018
Webpage with information and links to data files for download
This data package contains 5-minute air temperature and wind summary data from Jornada Basin LTER Cross Scale Interactions Study (CSIS) Block-3 met station. Average air temperature, wind speed, and wind direction are measured and calculated at an automated meteorological station connected to a 900 MHz spread spectrum wireless network. Wind speed is measured at 37cm, 75 cm, 150 cm, and 300 cm, wind direction at approximately 3m, and air temperature and relative humidity at approximate 2.5m. This is a subset of baseline weather data collected at the 15 Jornada Basin LTER CSIS study blocks, New Mexico. Measurements are aggregated at intervals of 5, 30, 60 minutes and daily, with precipitation additionally provided with 1 second aggregation during precipitation events. The met station variables measured include air temperature, precipitation, relative humidity, wind direction, wind speed. Precipitation is not measured at Block 1 and Block 12 because of proximity to Block 2 and Block 13, respectively . This is an ONGOING dataset.
Resource Title: Website Pointer to html file.
File Name: Web Page, url: https://portal.edirepository.org/nis/mapbrowse?scope=knb-lter-jrn&identifier=210548003
Webpage with information and links to data files for download
Daily Average of 30-minute Soil Volumetric Water Content data at 10 cm at CSIS Block-3. Collection of soil water content data at Jornada LTER Cross-scale Interactions Study (CSIS) blocks, New Mexico, supports the environmental monitoring objectives of the Jornada LTER monitoring program that look at plant-soil water dynamics. Soil volumetric water content is measured every 30 minutes at 10 cm depth at 3 locations at each of the 4 plots per block and averaged for the daily value. The locations in each plot are under bare soil, under perennial grass, and under shrub. Volumetric water content, bulk electrical conductivity, soil temperature, and bulk dielectric permittivity are recorded at an automated meteorological station installed at Jornada LTER CSIS Block-3 site. This is an ONGOING dataset.
Resource Title: Website Pointer to html file.
File Name: Web Page, url: https://portal.edirepository.org/nis/mapbrowse?scope=knb-lter-jrn&identifier=210548078
Webpage with information and links to data files for download
This data package contains hourly air temperature, relative humidity, wind speed, wind direction, and precipitation summary data from Jornada Basin LTER Cross Scale Interactions Study (CSIS) Block-3 met station. Air temperature, relative humidity, wind speed, wind direction, and precipitation are measured and calculated at an automated meteorological station connected to a 900 MHz spread spectrum wireless network. Wind speed is measured at 37cm, 75 cm, 150 cm, and 300 cm, wind direction at approximately 3m, and air temperature and relative humidity at approximate 2.5m. Measurements are aggregated at intervals of 5, 30, 60 minutes and daily, with precipitation additionally provided with 1 second aggregation during precipitation events. The met station variables measured include air temperature, precipitation, relative humidity, wind direction, wind speed. Precipitation is not measured at Block 1 and Block 12 because of proximity to Block 2 and Block 13, respectively . This is an ONGOING dataset.
Resource Title: Website Pointer to html file.
File Name: Web Page, url: https://portal.edirepository.org/nis/mapbrowse?scope=knb-lter-jrn&identifier=210548048
Webpage with information and links to data files for download
This data package contains hourly air temperature, relative humidity, wind speed, wind direction, and precipitation summary data from Jornada Basin LTER Cross Scale Interactions Study (CSIS) Block-4 met station. Air temperature, relative humidity, wind speed, wind direction, and precipitation are measured and calculated at an automated meteorological station connected to a 900 MHz spread spectrum wireless network. Wind speed is measured at 37cm, 75 cm, 150 cm, and 300 cm, wind direction at approximately 3m, and air temperature and relative humidity at approximate 2.5m. Measurements are aggregated at intervals of 5, 30, 60 minutes and daily, with precipitation additionally provided with 1 second aggregation during precipitation events. Precipitation is not measured at Block 1 and Block 12 because of proximity to Block 2 and Block 13, respectively . This is an ONGOING dataset.
Resource Title: Website Pointer to html file.
File Name: Web Page, url: https://portal.edirepository.org/nis/mapbrowse?scope=knb-lter-jrn&identifier=210548034
Webpage with information and links to data files for download
1-second summary precipitation data at CSIS Block-4 met station. Total precipitation per second is recorded only if there is measurable precipitation. This is recorded at an automated meteorological station installed at Jornada LTER CSIS Block-4 site.. This climate station is operated by the Jornada LTER Program. This is an ONGOING dataset. IMPORTANT: Rainfall is only recorded when a bucket tip occurs on the tipping bucket rain gauge. If there is missing data due to equipment or other problems, there will be no indication of this within this dataset. The user needs to review precipitation values in the 30 minute or hourly summary datasets to determine if there are missing data in this 1 second detailed precipitation dataset.
Resource Title: Website Pointer to html file.
File Name: Web Page, url: https://portal.edirepository.org/nis/mapbrowse?scope=knb-lter-jrn&identifier=210548093
Webpage with information and links to data files for download
30-minute Soil Moisture data at 10 cm at CSIS Block-4. Collection of soil volumetric water content data at Jornada LTER Cross-scale Interactions Study (CSIS) blocks, New Mexico, supports the environmental monitoring objectives of the Jornada LTER monitoring program that look at plant-soil water dynamics. Soil volumetric water content is measured at 10 cm depth at 3 locations at each of the 4 plots per block. The locations in each plot are under bare soil, under perennial grass, and under shrub. Volumetric water content, bulk electrical conductivity, soil temperature, and bulk dielectric permittivity are recorded every 30 minutes at an automated meteorological station installed at Jornada LTER CSIS Block-4 site. This is an ONGOING dataset.
Resource Title: Website Pointer to html file.
File Name: Web Page, url: https://portal.edirepository.org/nis/mapbrowse?scope=knb-lter-jrn&identifier=210548064
Webpage with information and links to data files for download
This data package contains 30-minute air temperature, relative humidity, and wind summary data from Jornada Basin LTER Cross Scale Interactions Study (CSIS) Block-1 met station. Average air temperature, relative humidity, wind speed, wind direction, and precipitation are measured and calculated at an automated meteorological station connected to a 900 MHz spread spectrum wireless network. Wind speed is measured at 37cm, 75 cm, 150 cm, and 300 cm, wind direction at approximately 3m, and air temperature and relative humidity at approximate 2.5m. Measurements are aggregated at intervals of 5, 30, 60 minutes and daily, with precipitation additionally provided with 1 second aggregation during precipitation events. The met station variables measured include air temperature, precipitation, relative humidity, wind direction, wind speed. Precipitation is not measured at Block 1 and Block 12 because of proximity to Block 2 and Block 13, respectively. This is an ONGOING dataset.
Resource Title: Website Pointer to html file.
File Name: Web Page, url: https://portal.edirepository.org/nis/mapbrowse?scope=knb-lter-jrn&identifier=210548019
Webpage with information and links to data files for download
This data package contains 5-minute air temperature and wind summary data from Jornada Basin LTER Cross Scale Interactions Study (CSIS) Block-4 met station. Average air temperature, wind speed, and wind direction are measured and calculated at an automated meteorological station connected to a 900 MHz spread spectrum wireless network. Wind speed is measured at 37cm, 75 cm, 150 cm, and 300 cm, wind direction at approximately 3m, and air temperature and relative humidity at approximate 2.5m. This is a subset of baseline weather data collected at the 15 Jornada Basin LTER CSIS study blocks, New Mexico. Measurements are aggregated at intervals of 5, 30, 60 minutes and daily, with precipitation additionally provided with 1 second aggregation during precipitation events. The met station variables measured include air temperature, precipitation, relative humidity, wind direction, wind speed. Precipitation is not measured at Block 1 and Block 12 because of proximity to Block 2 and Block 13, respectively . This is an ONGOING dataset.
Resource Title: Website Pointer to html file.
File Name: Web Page, url: https://portal.edirepository.org/nis/mapbrowse?scope=knb-lter-jrn&identifier=210548004
Webpage with information and links to data files for download
Daily Average of 30-minute Soil Volumetric Water Content data at 10 cm at CSIS Block-4. Collection of soil water content data at Jornada LTER Cross-scale Interactions Study (CSIS) blocks, New Mexico, supports the environmental monitoring objectives of the Jornada LTER monitoring program that look at plant-soil water dynamics. Soil volumetric water content is measured every 30 minutes at 10 cm depth at 3 locations at each of the 4 plots per block and averaged for the daily value. The locations in each plot are under bare soil, under perennial grass, and under shrub. Volumetric water content, bulk electrical conductivity, soil temperature, and bulk dielectric permittivity are recorded at an automated meteorological station installed at Jornada LTER CSIS Block-4 site. This is an ONGOING dataset.
Resource Title: Website Pointer to html file.
File Name: Web Page, url: https://portal.edirepository.org/nis/mapbrowse?scope=knb-lter-jrn&identifier=210548079
Webpage with information and links to data files for download
This data package contains hourly air temperature, relative humidity, wind speed, wind direction, and precipitation summary data from Jornada Basin LTER Cross Scale Interactions Study (CSIS) Block-4 met station. Air temperature, relative humidity, wind speed, wind direction, and precipitation are measured and calculated at an automated meteorological station connected to a 900 MHz spread spectrum wireless network. Wind speed is measured at 37cm, 75 cm, 150 cm, and 300 cm, wind direction at approximately 3m, and air temperature and relative humidity at approximate 2.5m. Measurements are aggregated at intervals of 5, 30, 60 minutes and daily, with precipitation additionally provided with 1 second aggregation during precipitation events. The met station variables measured include air temperature, precipitation, relative humidity, wind direction, wind speed. Precipitation is not measured at Block 1 and Block 12 because of proximity to Block 2 and Block 13, respectively . This is an ONGOING dataset.
Resource Title: Website Pointer to html file.
File Name: Web Page, url: https://portal.edirepository.org/nis/mapbrowse?scope=knb-lter-jrn&identifier=210548049
Webpage with information and links to data files for download
This data package contains hourly air temperature, relative humidity, wind speed, wind direction, and precipitation summary data from Jornada Basin LTER Cross Scale Interactions Study (CSIS) Block-5 met station. Air temperature, relative humidity, wind speed, wind direction, and precipitation are measured and calculated at an automated meteorological station connected to a 900 MHz spread spectrum wireless network. Wind speed is measured at 37cm, 75 cm, 150 cm, and 300 cm, wind direction at approximately 3m, and air temperature and relative humidity at approximate 2.5m. Measurements are aggregated at intervals of 5, 30, 60 minutes and daily, with precipitation additionally provided with 1 second aggregation during precipitation events. Precipitation is not measured at Block 1 and Block 12 because of proximity to Block 2 and Block 13, respectively . This is an ONGOING dataset.
Resource Title: Website Pointer to html file.
File Name: Web Page, url: https://portal.edirepository.org/nis/mapbrowse?scope=knb-lter-jrn&identifier=210548035
Webpage with information and links to data files for download
1-second summary precipitation data at CSIS Block-5 met station. Total precipitation per second is recorded only if there is measurable precipitation. This is recorded at an automated meteorological station installed at Jornada LTER CSIS Block-5 site.. This climate station is operated by the Jornada LTER Program. This is an ONGOING dataset. IMPORTANT: Rainfall is only recorded when a bucket tip occurs on the tipping bucket rain gauge. If there is missing data due to equipment or other problems, there will be no indication of this within this dataset. The user needs to review precipitation values in the 30 minute or hourly summary datasets to determine if there are missing data in this 1 second detailed precipitation dataset.
Resource Title: Website Pointer to html file.
File Name: Web Page, url: https://portal.edirepository.org/nis/mapbrowse?scope=knb-lter-jrn&identifier=210548094
Webpage with information and links to data files for download
30-minute Soil Moisture data at 10 cm at CSIS Block-5. Collection of soil volumetric water content data at Jornada LTER Cross-scale Interactions Study (CSIS) blocks, New Mexico, supports the environmental monitoring objectives of the Jornada LTER monitoring program that look at plant-soil water dynamics. Soil volumetric water content is measured at 10 cm depth at 3 locations at each of the 4 plots per block. The locations in each plot are under bare soil, under perennial grass, and under shrub. Volumetric water content, bulk electrical conductivity, soil temperature, and bulk dielectric permittivity are recorded every 30 minutes at an automated meteorological station installed at Jornada LTER CSIS Block-5 site. This is an ONGOING dataset.
Resource Title: Website Pointer to html file.
File Name: Web Page, url: https://portal.edirepository.org/nis/mapbrowse?scope=knb-lter-jrn&identifier=210548065
Webpage with information and links to data files for download
This data package contains 30-minute air temperature, relative humidity, and wind summary data from Jornada Basin LTER Cross Scale Interactions Study (CSIS) Block-1 met station. Average air temperature, relative humidity, wind speed, wind direction, and precipitation are measured and calculated at an automated meteorological station connected to a 900 MHz spread spectrum wireless network. Wind speed is measured at 37cm, 75 cm, 150 cm, and 300 cm, wind direction at approximately 3m, and air temperature and relative humidity at approximate 2.5m. Measurements are aggregated at intervals of 5, 30, 60 minutes and daily, with precipitation additionally provided with 1 second aggregation during precipitation events. The met station variables measured include air temperature, precipitation, relative humidity, wind direction, wind speed. Precipitation is not measured at Block 1 and Block 12 because of proximity to Block 2 and Block 13, respectively. This is an ONGOING dataset.
Resource Title: Website Pointer to html file.
File Name: Web Page, url: https://portal.edirepository.org/nis/mapbrowse?scope=knb-lter-jrn&identifier=210548020
Webpage with information and links to data files for download
This data package contains 5-minute air temperature and wind summary data from Jornada Basin LTER Cross Scale Interactions Study (CSIS) Block-5 met station. Average air temperature, wind speed, and wind direction are measured and calculated at an automated meteorological station connected to a 900 MHz spread spectrum wireless network. Wind speed is measured at 37cm, 75 cm, 150 cm, and 300 cm, wind direction at approximately 3m, and air temperature and relative humidity at approximate 2.5m. This is a subset of baseline weather data collected at the 15 Jornada Basin LTER CSIS study blocks, New Mexico. Measurements are aggregated at intervals of 5, 30, 60 minutes and daily, with precipitation additionally provided with 1 second aggregation during precipitation events. The met station variables measured include air temperature, precipitation, relative humidity, wind direction, wind speed. Precipitation is not measured at Block 1 and Block 12 because of proximity to Block 2 and Block 13, respectively . This is an ONGOING dataset.
Resource Title: Website Pointer to html file.
File Name: Web Page, url: https://portal.edirepository.org/nis/mapbrowse?scope=knb-lter-jrn&identifier=210548005
Webpage with information and links to data files for download
Daily Average of 30-minute Soil Volumetric Water Content data at 10 cm at CSIS Block-5. Collection of soil water content data at Jornada LTER Cross-scale Interactions Study (CSIS) blocks, New Mexico, supports the environmental monitoring objectives of the Jornada LTER monitoring program that look at plant-soil water dynamics. Soil volumetric water content is measured every 30 minutes at 10 cm depth at 3 locations at each of the 4 plots per block and averaged for the daily value. The locations in each plot are under bare soil, under perennial grass, and under shrub. Volumetric water content, bulk electrical conductivity, soil temperature, and bulk dielectric permittivity are recorded at an automated meteorological station installed at Jornada LTER CSIS Block-5 site. This is an ONGOING dataset.
Resource Title: Website Pointer to html file.
File Name: Web Page, url: https://portal.edirepository.org/nis/mapbrowse?scope=knb-lter-jrn&identifier=210548080
Webpage with information and links to data files for download
This data package contains hourly air temperature, relative humidity, wind speed, wind direction, and precipitation summary data from Jornada Basin LTER Cross Scale Interactions Study (CSIS) Block-5 met station. Air temperature, relative humidity, wind speed, wind direction, and precipitation are measured and calculated at an automated meteorological station connected to a 900 MHz spread spectrum wireless network. Wind speed is measured at 37cm, 75 cm, 150 cm, and 300 cm, wind direction at approximately 3m, and air temperature and relative humidity at approximate 2.5m. Measurements are aggregated at intervals of 5, 30, 60 minutes and daily, with precipitation additionally provided with 1 second aggregation during precipitation events. The met station variables measured include air temperature, precipitation, relative humidity, wind direction, wind speed. Precipitation is not measured at Block 1 and Block 12 because of proximity to Block 2 and Block 13, respectively . This is an ONGOING dataset.
Resource Title: Website Pointer to html file.
File Name: Web Page, url: https://portal.edirepository.org/nis/mapbrowse?scope=knb-lter-jrn&identifier=210548050
Webpage with information and links to data files for download
This data package contains hourly air temperature, relative humidity, wind speed, wind direction, and precipitation summary data from Jornada Basin LTER Cross Scale Interactions Study (CSIS) Block-6 met station. Air temperature, relative humidity, wind speed, wind direction, and precipitation are measured and calculated at an automated meteorological station connected to a 900 MHz spread spectrum wireless network. Wind speed is measured at 37cm, 75 cm, 150 cm, and 300 cm, wind direction at approximately 3m, and air temperature and relative humidity at approximate 2.5m. Measurements are aggregated at intervals of 5, 30, 60 minutes and daily, with precipitation additionally provided with 1 second aggregation during precipitation events. Precipitation is not measured at Block 1 and Block 12 because of proximity to Block 2 and Block 13, respectively . This is an ONGOING dataset.
Resource Title: Website Pointer to html file.
File Name: Web Page, url: https://portal.edirepository.org/nis/mapbrowse?scope=knb-lter-jrn&identifier=210548036
Webpage with information and links to data files for download
1-second summary precipitation data at CSIS Block-6 met station. Total precipitation per second is recorded only if there is measurable precipitation. This is recorded at an automated meteorological station installed at Jornada LTER CSIS Block-6 site.. This climate station is operated by the Jornada LTER Program. This is an ONGOING dataset. IMPORTANT: Rainfall is only recorded when a bucket tip occurs on the tipping bucket rain gauge. If there is missing data due to equipment or other problems, there will be no indication of this within this dataset. The user needs to review precipitation values in the 30 minute or hourly summary datasets to determine if there are missing data in this 1 second detailed precipitation dataset.
Resource Title: Website Pointer to html file.
File Name: Web Page, url: https://portal.edirepository.org/nis/mapbrowse?scope=knb-lter-jrn&identifier=210548095
Webpage with information and links to data files for download
30-minute Soil Moisture data at 10 cm at CSIS Block-6. Collection of soil volumetric water content data at Jornada LTER Cross-scale Interactions Study (CSIS) blocks, New Mexico, supports the environmental monitoring objectives of the Jornada LTER monitoring program that look at plant-soil water dynamics. Soil volumetric water content is measured at 10 cm depth at 3 locations at each of the 4 plots per block. The locations in each plot are under bare soil, under perennial grass, and under shrub. Volumetric water content, bulk electrical conductivity, soil temperature, and bulk dielectric permittivity are recorded every 30 minutes at an automated meteorological station installed at Jornada LTER CSIS Block-6 site. This is an ONGOING dataset.
Resource Title: Website Pointer to html file.
File Name: Web Page, url: https://portal.edirepository.org/nis/mapbrowse?scope=knb-lter-jrn&identifier=210548066
Webpage with information and links to data files for download
This data package contains 30-minute air temperature, relative humidity, and wind summary data from Jornada Basin LTER Cross Scale Interactions Study (CSIS) Block-1 met station. Average air temperature, relative humidity, wind speed, wind direction, and precipitation are measured and calculated at an automated meteorological station connected to a 900 MHz spread spectrum wireless network. Wind speed is measured at 37cm, 75 cm, 150 cm, and 300 cm, wind direction at approximately 3m, and air temperature and relative humidity at approximate 2.5m. Measurements are aggregated at intervals of 5, 30, 60 minutes and daily, with precipitation additionally provided with 1 second aggregation during precipitation events. The met station variables measured include air temperature, precipitation, relative humidity, wind direction, wind speed. Precipitation is not measured at Block 1 and Block 12 because of proximity to Block 2 and Block 13, respectively. This is an ONGOING dataset.
Resource Title: Website Pointer to html file.
File Name: Web Page, url: https://portal.edirepository.org/nis/mapbrowse?scope=knb-lter-jrn&identifier=210548021
Webpage with information and links to data files for download
This data package contains 5-minute air temperature and wind summary data from Jornada Basin LTER Cross Scale Interactions Study (CSIS) Block-6 met station. Average air temperature, wind speed, and wind direction are measured and calculated at an automated meteorological station connected to a 900 MHz spread spectrum wireless network. Wind speed is measured at 37cm, 75 cm, 150 cm, and 300 cm, wind direction at approximately 3m, and air temperature and relative humidity at approximate 2.5m. This is a subset of baseline weather data collected at the 15 Jornada Basin LTER CSIS study blocks, New Mexico. Measurements are aggregated at intervals of 5, 30, 60 minutes and daily, with precipitation additionally provided with 1 second aggregation during precipitation events. The met station variables measured include air temperature, precipitation, relative humidity, wind direction, wind speed. Precipitation is not measured at Block 1 and Block 12 because of proximity to Block 2 and Block 13, respectively . This is an ONGOING dataset.
Resource Title: Website Pointer to html file.
File Name: Web Page, url: https://portal.edirepository.org/nis/mapbrowse?scope=knb-lter-jrn&identifier=210548006
Webpage with information and links to data files for download
Daily Average of 30-minute Soil Volumetric Water Content data at 10 cm at CSIS Block-6. Collection of soil water content data at Jornada LTER Cross-scale Interactions Study (CSIS) blocks, New Mexico, supports the environmental monitoring objectives of the Jornada LTER monitoring program that look at plant-soil water dynamics. Soil volumetric water content is measured every 30 minutes at 10 cm depth at 3 locations at each of the 4 plots per block and averaged for the daily value. The locations in each plot are under bare soil, under perennial grass, and under shrub. Volumetric water content, bulk electrical conductivity, soil temperature, and bulk dielectric permittivity are recorded at an automated meteorological station installed at Jornada LTER CSIS Block-6 site. This is an ONGOING dataset.
Resource Title: Website Pointer to html file.
File Name: Web Page, url: https://portal.edirepository.org/nis/mapbrowse?scope=knb-lter-jrn&identifier=210548081
Webpage with information and links to data files for download
This data package contains hourly air temperature, relative humidity, wind speed, wind direction, and precipitation summary data from Jornada Basin LTER Cross Scale Interactions Study (CSIS) Block-6 met station. Air temperature, relative humidity, wind speed, wind direction, and precipitation are measured and calculated at an automated meteorological station connected to a 900 MHz spread spectrum wireless network. Wind speed is measured at 37cm, 75 cm, 150 cm, and 300 cm, wind direction at approximately 3m, and air temperature and relative humidity at approximate 2.5m. Measurements are aggregated at intervals of 5, 30, 60 minutes and daily, with precipitation additionally provided with 1 second aggregation during precipitation events. The met station variables measured include air temperature, precipitation, relative humidity, wind direction, wind speed. Precipitation is not measured at Block 1 and Block 12 because of proximity to Block 2 and Block 13, respectively . This is an ONGOING dataset.
Resource Title: Website Pointer to html file.
File Name: Web Page, url: https://portal.edirepository.org/nis/mapbrowse?scope=knb-lter-jrn&identifier=210548051
Webpage with information and links to data files for download
This data package contains hourly air temperature, relative humidity, wind speed, wind direction, and precipitation summary data from Jornada Basin LTER Cross Scale Interactions Study (CSIS) Block-7 met station. Air temperature, relative humidity, wind speed, wind direction, and precipitation are measured and calculated at an automated meteorological station connected to a 900 MHz spread spectrum wireless network. Wind speed is measured at 37cm, 75 cm, 150 cm, and 300 cm, wind direction at approximately 3m, and air temperature and relative humidity at approximate 2.5m. Measurements are aggregated at intervals of 5, 30, 60 minutes and daily, with precipitation additionally provided with 1 second aggregation during precipitation events. Precipitation is not measured at Block 1 and Block 12 because of proximity to Block 2 and Block 13, respectively . This is an ONGOING dataset.
Resource Title: Website Pointer to html file.
File Name: Web Page, url: https://portal.edirepository.org/nis/mapbrowse?scope=knb-lter-jrn&identifier=210548037
Webpage with information and links to data files for download
1-second summary precipitation data at CSIS Block-7 met station. Total precipitation per second is recorded only if there is measurable precipitation. This is recorded at an automated meteorological station installed at Jornada LTER CSIS Block-7 site.. This climate station is operated by the Jornada LTER Program. This is an ONGOING dataset. IMPORTANT: Rainfall is only recorded when a bucket tip occurs on the tipping bucket rain gauge. If there is missing data due to equipment or other problems, there will be no indication of this within this dataset. The user needs to review precipitation values in the 30 minute or hourly summary datasets to determine if there are missing data in this 1 second detailed precipitation dataset.
Resource Title: Website Pointer to html file.
File Name: Web Page, url: https://portal.edirepository.org/nis/mapbrowse?scope=knb-lter-jrn&identifier=210548096
Webpage with information and links to data files for download
30-minute Soil Moisture data at 10 cm at CSIS Block-7. Collection of soil volumetric water content data at Jornada LTER Cross-scale Interactions Study (CSIS) blocks, New Mexico, supports the environmental monitoring objectives of the Jornada LTER monitoring program that look at plant-soil water dynamics. Soil volumetric water content is measured at 10 cm depth at 3 locations at each of the 4 plots per block. The locations in each plot are under bare soil, under perennial grass, and under shrub. Volumetric water content, bulk electrical conductivity, soil temperature, and bulk dielectric permittivity are recorded every 30 minutes at an automated meteorological station installed at Jornada LTER CSIS Block-7 site. This is an ONGOING dataset.
Resource Title: Website Pointer to html file.
File Name: Web Page, url: https://portal.edirepository.org/nis/mapbrowse?scope=knb-lter-jrn&identifier=210548067
Webpage with information and links to data files for download
This data package contains 30-minute air temperature, relative humidity, and wind summary data from Jornada Basin LTER Cross Scale Interactions Study (CSIS) Block-1 met station. Average air temperature, relative humidity, wind speed, wind direction, and precipitation are measured and calculated at an automated meteorological station connected to a 900 MHz spread spectrum wireless network. Wind speed is measured at 37cm, 75 cm, 150 cm, and 300 cm, wind direction at approximately 3m, and air temperature and relative humidity at approximate 2.5m. Measurements are aggregated at intervals of 5, 30, 60 minutes and daily, with precipitation additionally provided with 1 second aggregation during precipitation events. The met station variables measured include air temperature, precipitation, relative humidity, wind direction, wind speed. Precipitation is not measured at Block 1 and Block 12 because of proximity to Block 2 and Block 13, respectively. This is an ONGOING dataset.
Resource Title: Website Pointer to html file.
File Name: Web Page, url: https://portal.edirepository.org/nis/mapbrowse?scope=knb-lter-jrn&identifier=210548022
Webpage with information and links to data files for download
This data package contains 5-minute air temperature and wind summary data from Jornada Basin LTER Cross Scale Interactions Study (CSIS) Block-7 met station. Average air temperature, wind speed, and wind direction are measured and calculated at an automated meteorological station connected to a 900 MHz spread spectrum wireless network. Wind speed is measured at 37cm, 75 cm, 150 cm, and 300 cm, wind direction at approximately 3m, and air temperature and relative humidity at approximate 2.5m. This is a subset of baseline weather data collected at the 15 Jornada Basin LTER CSIS study blocks, New Mexico. Measurements are aggregated at intervals of 5, 30, 60 minutes and daily, with precipitation additionally provided with 1 second aggregation during precipitation events. The met station variables measured include air temperature, precipitation, relative humidity, wind direction, wind speed. Precipitation is not measured at Block 1 and Block 12 because of proximity to Block 2 and Block 13, respectively . This is an ONGOING dataset.
Resource Title: Website Pointer to html file.
File Name: Web Page, url: https://portal.edirepository.org/nis/mapbrowse?scope=knb-lter-jrn&identifier=210548007
Webpage with information and links to data files for download
Daily Average of 30-minute Soil Volumetric Water Content data at 10 cm at CSIS Block-7. Collection of soil water content data at Jornada LTER Cross-scale Interactions Study (CSIS) blocks, New Mexico, supports the environmental monitoring objectives of the Jornada LTER monitoring program that look at plant-soil water dynamics. Soil volumetric water content is measured every 30 minutes at 10 cm depth at 3 locations at each of the 4 plots per block and averaged for the daily value. The locations in each plot are under bare soil, under perennial grass, and under shrub. Volumetric water content, bulk electrical conductivity, soil temperature, and bulk dielectric permittivity are recorded at an automated meteorological station installed at Jornada LTER CSIS Block-7 site. This is an ONGOING dataset.
Resource Title: Website Pointer to html file.
File Name: Web Page, url: https://portal.edirepository.org/nis/mapbrowse?scope=knb-lter-jrn&identifier=210548082
Webpage with information and links to data files for download
This data package contains hourly air temperature, relative humidity, wind speed, wind direction, and precipitation summary data from Jornada Basin LTER Cross Scale Interactions Study (CSIS) Block-7 met station. Air temperature, relative humidity, wind speed, wind direction, and precipitation are measured and calculated at an automated meteorological station connected to a 900 MHz spread spectrum wireless network. Wind speed is measured at 37cm, 75 cm, 150 cm, and 300 cm, wind direction at approximately 3m, and air temperature and relative humidity at approximate 2.5m. Measurements are aggregated at intervals of 5, 30, 60 minutes and daily, with precipitation additionally provided with 1 second aggregation during precipitation events. The met station variables measured include air temperature, precipitation, relative humidity, wind direction, wind speed. Precipitation is not measured at Block 1 and Block 12 because of proximity to Block 2 and Block 13, respectively . This is an ONGOING dataset.
Resource Title: Website Pointer to html file.
File Name: Web Page, url: https://portal.edirepository.org/nis/mapbrowse?scope=knb-lter-jrn&identifier=210548052
Webpage with information and links to data files for download
This data package contains hourly air temperature, relative humidity, wind speed, wind direction, and precipitation summary data from Jornada Basin LTER Cross Scale Interactions Study (CSIS) Block-8 met station. Air temperature, relative humidity, wind speed, wind direction, and precipitation are measured and calculated at an automated meteorological station connected to a 900 MHz spread spectrum wireless network. Wind speed is measured at 37cm, 75 cm, 150 cm, and 300 cm, wind direction at approximately 3m, and air temperature and relative humidity at approximate 2.5m. Measurements are aggregated at intervals of 5, 30, 60 minutes and daily, with precipitation additionally provided with 1 second aggregation during precipitation events. Precipitation is not measured at Block 1 and Block 12 because of proximity to Block 2 and Block 13, respectively . This is an ONGOING dataset.
Resource Title: Website Pointer to html file.
File Name: Web Page, url: https://portal.edirepository.org/nis/mapbrowse?scope=knb-lter-jrn&identifier=210548038
Webpage with information and links to data files for download
1-second summary precipitation data at CSIS Block-8 met station. Total precipitation per second is recorded only if there is measurable precipitation. This is recorded at an automated meteorological station installed at Jornada LTER CSIS Block-8 site.. This climate station is operated by the Jornada LTER Program. This is an ONGOING dataset. IMPORTANT: Rainfall is only recorded when a bucket tip occurs on the tipping bucket rain gauge. If there is missing data due to equipment or other problems, there will be no indication of this within this dataset. The user needs to review precipitation values in the 30 minute or hourly summary datasets to determine if there are missing data in this 1 second detailed precipitation dataset.
Resource Title: Website Pointer to html file.
File Name: Web Page, url: https://portal.edirepository.org/nis/mapbrowse?scope=knb-lter-jrn&identifier=210548097
Webpage with information and links to data files for download
30-minute Soil Moisture data at 10 cm at CSIS Block-8. Collection of soil volumetric water content data at Jornada LTER Cross-scale Interactions Study (CSIS) blocks, New Mexico, supports the environmental monitoring objectives of the Jornada LTER monitoring program that look at plant-soil water dynamics. Soil volumetric water content is measured at 10 cm depth at 3 locations at each of the 4 plots per block. The locations in each plot are under bare soil, under perennial grass, and under shrub. Volumetric water content, bulk electrical conductivity, soil temperature, and bulk dielectric permittivity are recorded every 30 minutes at an automated meteorological station installed at Jornada LTER CSIS Block-8 site. This is an ONGOING dataset.
Resource Title: Website Pointer to html file.
File Name: Web Page, url: https://portal.edirepository.org/nis/mapbrowse?scope=knb-lter-jrn&identifier=210548068
Webpage with information and links to data files for download
This data package contains 30-minute air temperature, relative humidity, and wind summary data from Jornada Basin LTER Cross Scale Interactions Study (CSIS) Block-1 met station. Average air temperature, relative humidity, wind speed, wind direction, and precipitation are measured and calculated at an automated meteorological station connected to a 900 MHz spread spectrum wireless network. Wind speed is measured at 37cm, 75 cm, 150 cm, and 300 cm, wind direction at approximately 3m, and air temperature and relative humidity at approximate 2.5m. Measurements are aggregated at intervals of 5, 30, 60 minutes and daily, with precipitation additionally provided with 1 second aggregation during precipitation events. The met station variables measured include air temperature, precipitation, relative humidity, wind direction, wind speed. Precipitation is not measured at Block 1 and Block 12 because of proximity to Block 2 and Block 13, respectively. This is an ONGOING dataset.
Resource Title: Website Pointer to html file.
File Name: Web Page, url: https://portal.edirepository.org/nis/mapbrowse?scope=knb-lter-jrn&identifier=210548023
Webpage with information and links to data files for download
This data package contains 5-minute air temperature and wind summary data from Jornada Basin LTER Cross Scale Interactions Study (CSIS) Block-8 met station. Average air temperature, wind speed, and wind direction are measured and calculated at an automated meteorological station connected to a 900 MHz spread spectrum wireless network. Wind speed is measured at 37cm, 75 cm, 150 cm, and 300 cm, wind direction at approximately 3m, and air temperature and relative humidity at approximate 2.5m. This is a subset of baseline weather data collected at the 15 Jornada Basin LTER CSIS study blocks, New Mexico. Measurements are aggregated at intervals of 5, 30, 60 minutes and daily, with precipitation additionally provided with 1 second aggregation during precipitation events. The met station variables measured include air temperature, precipitation, relative humidity, wind direction, wind speed. Precipitation is not measured at Block 1 and Block 12 because of proximity to Block 2 and Block 13, respectively . This is an ONGOING dataset.
Resource Title: Website Pointer to html file.
File Name: Web Page, url: https://portal.edirepository.org/nis/mapbrowse?scope=knb-lter-jrn&identifier=210548008
Webpage with information and links to data files for download
Daily Average of 30-minute Soil Volumetric Water Content data at 10 cm at CSIS Block-8. Collection of soil water content data at Jornada LTER Cross-scale Interactions Study (CSIS) blocks, New Mexico, supports the environmental monitoring objectives of the Jornada LTER monitoring program that look at plant-soil water dynamics. Soil volumetric water content is measured every 30 minutes at 10 cm depth at 3 locations at each of the 4 plots per block and averaged for the daily value. The locations in each plot are under bare soil, under perennial grass, and under shrub. Volumetric water content, bulk electrical conductivity, soil temperature, and bulk dielectric permittivity are recorded at an automated meteorological station installed at Jornada LTER CSIS Block-8 site. This is an ONGOING dataset.
Resource Title: Website Pointer to html file.
File Name: Web Page, url: https://portal.edirepository.org/nis/mapbrowse?scope=knb-lter-jrn&identifier=210548083
Webpage with information and links to data files for download
This data package contains hourly air temperature, relative humidity, wind speed, wind direction, and precipitation summary data from Jornada Basin LTER Cross Scale Interactions Study (CSIS) Block-8 met station. Air temperature, relative humidity, wind speed, wind direction, and precipitation are measured and calculated at an automated meteorological station connected to a 900 MHz spread spectrum wireless network. Wind speed is measured at 37cm, 75 cm, 150 cm, and 300 cm, wind direction at approximately 3m, and air temperature and relative humidity at approximate 2.5m. Measurements are aggregated at intervals of 5, 30, 60 minutes and daily, with precipitation additionally provided with 1 second aggregation during precipitation events. The met station variables measured include air temperature, precipitation, relative humidity, wind direction, wind speed. Precipitation is not measured at Block 1 and Block 12 because of proximity to Block 2 and Block 13, respectively . This is an ONGOING dataset.
Resource Title: Website Pointer to html file.
File Name: Web Page, url: https://portal.edirepository.org/nis/mapbrowse?scope=knb-lter-jrn&identifier=210548053
Webpage with information and links to data files for download
This data package contains hourly air temperature, relative humidity, wind speed, wind direction, and precipitation summary data from Jornada Basin LTER Cross Scale Interactions Study (CSIS) Block-9 met station. Air temperature, relative humidity, wind speed, wind direction, and precipitation are measured and calculated at an automated meteorological station connected to a 900 MHz spread spectrum wireless network. Wind speed is measured at 37cm, 75 cm, 150 cm, and 300 cm, wind direction at approximately 3m, and air temperature and relative humidity at approximate 2.5m. Measurements are aggregated at intervals of 5, 30, 60 minutes and daily, with precipitation additionally provided with 1 second aggregation during precipitation events. Precipitation is not measured at Block 1 and Block 12 because of proximity to Block 2 and Block 13, respectively . This is an ONGOING dataset.
Resource Title: Website Pointer to html file.
File Name: Web Page, url: https://portal.edirepository.org/nis/mapbrowse?scope=knb-lter-jrn&identifier=210548039
Webpage with information and links to data files for download
1-second summary precipitation data at CSIS Block-9 met station. Total precipitation per second is recorded only if there is measurable precipitation. This is recorded at an automated meteorological station installed at Jornada LTER CSIS Block-9 site.. This climate station is operated by the Jornada LTER Program. This is an ONGOING dataset. IMPORTANT: Rainfall is only recorded when a bucket tip occurs on the tipping bucket rain gauge. If there is missing data due to equipment or other problems, there will be no indication of this within this dataset. The user needs to review precipitation values in the 30 minute or hourly summary datasets to determine if there are missing data in this 1 second detailed precipitation dataset.
Resource Title: Website Pointer to html file.
File Name: Web Page, url: https://portal.edirepository.org/nis/mapbrowse?scope=knb-lter-jrn&identifier=210548098
Webpage with information and links to data files for download
30-minute Soil Moisture data at 10 cm at CSIS Block-9. Collection of soil volumetric water content data at Jornada LTER Cross-scale Interactions Study (CSIS) blocks, New Mexico, supports the environmental monitoring objectives of the Jornada LTER monitoring program that look at plant-soil water dynamics. Soil volumetric water content is measured at 10 cm depth at 3 locations at each of the 4 plots per block. The locations in each plot are under bare soil, under perennial grass, and under shrub. Volumetric water content, bulk electrical conductivity, soil temperature, and bulk dielectric permittivity are recorded every 30 minutes at an automated meteorological station installed at Jornada LTER CSIS Block-9 site. This is an ONGOING dataset.
Resource Title: Website Pointer to html file.
File Name: Web Page, url: https://portal.edirepository.org/nis/mapbrowse?scope=knb-lter-jrn&identifier=210548069
Webpage with information and links to data files for download
This data package contains 30-minute air temperature, relative humidity, and wind summary data from Jornada Basin LTER Cross Scale Interactions Study (CSIS) Block-1 met station. Average air temperature, relative humidity, wind speed, wind direction, and precipitation are measured and calculated at an automated meteorological station connected to a 900 MHz spread spectrum wireless network. Wind speed is measured at 37cm, 75 cm, 150 cm, and 300 cm, wind direction at approximately 3m, and air temperature and relative humidity at approximate 2.5m. Measurements are aggregated at intervals of 5, 30, 60 minutes and daily, with precipitation additionally provided with 1 second aggregation during precipitation events. The met station variables measured include air temperature, precipitation, relative humidity, wind direction, wind speed. Precipitation is not measured at Block 1 and Block 12 because of proximity to Block 2 and Block 13, respectively. This is an ONGOING dataset.
Resource Title: Website Pointer to html file.
File Name: Web Page, url: https://portal.edirepository.org/nis/mapbrowse?scope=knb-lter-jrn&identifier=210548024
Webpage with information and links to data files for download
This data package contains 5-minute air temperature and wind summary data from Jornada Basin LTER Cross Scale Interactions Study (CSIS) Block-9 met station. Average air temperature, wind speed, and wind direction are measured and calculated at an automated meteorological station connected to a 900 MHz spread spectrum wireless network. Wind speed is measured at 37cm, 75 cm, 150 cm, and 300 cm, wind direction at approximately 3m, and air temperature and relative humidity at approximate 2.5m. This is a subset of baseline weather data collected at the 15 Jornada Basin LTER CSIS study blocks, New Mexico. Measurements are aggregated at intervals of 5, 30, 60 minutes and daily, with precipitation additionally provided with 1 second aggregation during precipitation events. The met station variables measured include air temperature, precipitation, relative humidity, wind direction, wind speed. Precipitation is not measured at Block 1 and Block 12 because of proximity to Block 2 and Block 13, respectively . This is an ONGOING dataset.
Resource Title: Website Pointer to html file.
File Name: Web Page, url: https://portal.edirepository.org/nis/mapbrowse?scope=knb-lter-jrn&identifier=210548009
Webpage with information and links to data files for download
Daily Average of 30-minute Soil Volumetric Water Content data at 10 cm at CSIS Block-9. Collection of soil water content data at Jornada LTER Cross-scale Interactions Study (CSIS) blocks, New Mexico, supports the environmental monitoring objectives of the Jornada LTER monitoring program that look at plant-soil water dynamics. Soil volumetric water content is measured every 30 minutes at 10 cm depth at 3 locations at each of the 4 plots per block and averaged for the daily value. The locations in each plot are under bare soil, under perennial grass, and under shrub. Volumetric water content, bulk electrical conductivity, soil temperature, and bulk dielectric permittivity are recorded at an automated meteorological station installed at Jornada LTER CSIS Block-9 site. This is an ONGOING dataset.
Resource Title: Website Pointer to html file.
File Name: Web Page, url: https://portal.edirepository.org/nis/mapbrowse?scope=knb-lter-jrn&identifier=210548084
Webpage with information and links to data files for download
This data package contains hourly air temperature, relative humidity, wind speed, wind direction, and precipitation summary data from Jornada Basin LTER Cross Scale Interactions Study (CSIS) Block-9 met station. Air temperature, relative humidity, wind speed, wind direction, and precipitation are measured and calculated at an automated meteorological station connected to a 900 MHz spread spectrum wireless network. Wind speed is measured at 37cm, 75 cm, 150 cm, and 300 cm, wind direction at approximately 3m, and air temperature and relative humidity at approximate 2.5m. Measurements are aggregated at intervals of 5, 30, 60 minutes and daily, with precipitation additionally provided with 1 second aggregation during precipitation events. The met station variables measured include air temperature, precipitation, relative humidity, wind direction, wind speed. Precipitation is not measured at Block 1 and Block 12 because of proximity to Block 2 and Block 13, respectively . This is an ONGOING dataset.
Resource Title: Website Pointer to html file.
File Name: Web Page, url: https://portal.edirepository.org/nis/mapbrowse?scope=knb-lter-jrn&identifier=210548054
Webpage with information and links to data files for download
Hourly summary data at NPP C-CALI met station. Average/maximum/minimum air temperature; average relative humidity and wind direction; average/maximum wind speed. These are measured and calculated based on 1-second scan rate of all sensors located at an automated meteorological station installed at Jornada LTER NPP C-CALI site. Wind speed is measured at 75 cm, 150 cm, and 300 cm, wind direction at approximately 3m, and air temperature and relative humidity at approximate 2.5m. This climate station is operated by the Jornada LTER Program. This is an ONGOING dataset.
Resource Title: Website Pointer to html file.
File Name: Web Page, url: https://portal.edirepository.org/nis/mapbrowse?scope=knb-lter-jrn&identifier=210437031
Webpage with information and links to data files for download
1-second summary precipitation data at NPP C-CALI met station. Total precipitation per second is recorded only if there is measurable precipitation. This is recorded at an automated meteorological station installed at Jornada LTER NPP C-CALI site.. This climate station is operated by the Jornada LTER Program. IMPORTANT: Rainfall is only recorded when a bucket tip occurs on the tipping bucket rain gauge. If there is missing data due to equipment or other problems, there will be no indication of this within this dataset. The user needs to review precipitation values in the 30 minute, hourly, or data summary datasets to determine if there are missing periods in this 1 second detailed precipitation dataset. Reference the package i.d.'s knb-lter-jrn.210437016, knb-lter-jrn.210437031, and knb-lter-jrn.210437046 for the NPP C-CALI met station 30 minute, hourly, and daily summary datasets, respectively. This is an ONGOING dataset.
Resource Title: Website Pointer to html file.
File Name: Web Page, url: https://portal.edirepository.org/nis/mapbrowse?scope=knb-lter-jrn&identifier=210437061
Webpage with information and links to data files for download
30-minute Soil Moisture data at NPP C-CALI met station. Collection of soil volumetric water content data at Jornada LTER NPP sites, New Mexico, supports the environmental monitoring objectives of the Jornada LTER monitoring program that look at plant-soil water dynamics. Volumetric water content, bulk electrical conductivity, soil temperature, and bulk dielectric permittivity are measured every 30 minutes at an automated meteorological station installed at Jornada LTER NPP C-CALI site. Measurements are made every 30 minutes at 10 cm, 20 cm, and 30 cm soil depths. This is an ONGOING dataset.
Resource Title: Website Pointer to html file.
File Name: Web Page, url: https://portal.edirepository.org/nis/mapbrowse?scope=knb-lter-jrn&identifier=210437076
Webpage with information and links to data files for download
30-minute summary data at NPP C-CALI met station. Average air temperature, relative humidity, wind speed and wind direction are measured and calculated based on 1-second scan rate of all sensors located at an automated meteorological station installed at Jornada LTER NPP C-CALI site. Wind speed is measured at 75 cm, 150 cm, and 300 cm, wind direction at approximately 3m, and air temperature and relative humidity at approximate 2.5m. This climate station is operated by the Jornada LTER Program. This is an ONGOING dataset.
Resource Title: Website Pointer to html file.
File Name: Web Page, url: https://portal.edirepository.org/nis/mapbrowse?scope=knb-lter-jrn&identifier=210437016
Webpage with information and links to data files for download
5-minute summary data at NPP C-CALI met station. Average air temperature, wind speed and wind direction are measured and calculated based on 1-second scan rate of all sensors located at an automated meteorological station installed at Jornada LTER NPP C-CALI site. Wind speed is measured at 75 cm, 150 cm, and 300 cm, wind direction at approximately 3m, and air temperature at approximate 2.5m. This climate station is operated by the Jornada LTER Program. This is an ONGOING dataset.
Resource Title: Website Pointer to html file.
File Name: Web Page, url: https://portal.edirepository.org/nis/mapbrowse?scope=knb-lter-jrn&identifier=210437001
Webpage with information and links to data files for download
Daily average of 30-minute Volumetric Water Content at NPP C-CALI met station. Collection of soil volumetric water content data at Jornada LTER NPP sites, New Mexico, supports the environmental monitoring objectives of the Jornada LTER monitoring program that look at plant-soil water dynamics. Volumetric water content, bulk electrical conductivity, soil temperature, and bulk dielectric permittivity are measured and calculated at an automated meteorological station installed at Jornada LTER NPP C-CALI site. The daily average at 3 soil depths is calculated from measurements made every 30 minutes at 10 cm, 20 cm, and 30 cm. This is an ONGOING dataset.
Resource Title: Website Pointer to html file.
File Name: Web Page, url: https://portal.edirepository.org/nis/mapbrowse?scope=knb-lter-jrn&identifier=210437091
Webpage with information and links to data files for download
Daily summary data at NPP C-CALI met station. Average/maximum/minimum air temperature; average/maximum relative humidity and wind speed and average wind direction. These are measured and calculated based on 1-second scan rate of all sensors located at an automated meteorological station installed at Jornada LTER NPP C-CALI site. Wind speed is measured at 75 cm, 150 cm, and 300 cm, wind direction at approximately 3m, and air temperature and relative humidity at approximate 2.5m. This climate station is operated by the Jornada LTER Program. This is an ONGOING dataset.
Resource Title: Website Pointer to html file.
File Name: Web Page, url: https://portal.edirepository.org/nis/mapbrowse?scope=knb-lter-jrn&identifier=210437046
Webpage with information and links to data files for download
Hourly summary data at NPP C-GRAV met station. Average/maximum/minimum air temperature; average relative humidity and wind direction; average/maximum wind speed. These are measured and calculated based on 1-second scan rate of all sensors located at an automated meteorological station installed at Jornada LTER NPP C-GRAV site. Wind speed is measured at 75 cm, 150 cm, and 300 cm, wind direction at approximately 3m, and air temperature and relative humidity at approximate 2.5m. This climate station is operated by the Jornada LTER Program. This is an ONGOING dataset.
Resource Title: Website Pointer to html file.
File Name: Web Page, url: https://portal.edirepository.org/nis/mapbrowse?scope=knb-lter-jrn&identifier=210437032
Webpage with information and links to data files for download
1-second summary precipitation data at NPP C-GRAV met station. Total precipitation per second is recorded only if there is measurable precipitation. This is recorded at an automated meteorological station installed at Jornada LTER NPP C-GRAV site.. This climate station is operated by the Jornada LTER Program. IMPORTANT: Rainfall is only recorded when a bucket tip occurs on the tipping bucket rain gauge. If there is missing data due to equipment or other problems, there will be no indication of this within this dataset. The user needs to review precipitation values in the 30 minute or hourly summary datasets to determine if there are missing data in this 1 second detailed precipitation dataset. Reference the package i.d.'s knb-lter-jrn.210437017, knb-lter-jrn.210437032, and knb-lter-jrn.210437047 for the NPP C-GRAV met station 30 minute, hourly, and daily summary datasets, respectively. This is an ONGOING dataset.
Resource Title: Website Pointer to html file.
File Name: Web Page, url: https://portal.edirepository.org/nis/mapbrowse?scope=knb-lter-jrn&identifier=210437062
Webpage with information and links to data files for download
30-minute Soil Moisture data at NPP C-GRAV met station. Collection of soil volumetric water content data at Jornada LTER NPP sites, New Mexico, supports the environmental monitoring objectives of the Jornada LTER monitoring program that look at plant-soil water dynamics. Volumetric water content, bulk electrical conductivity, soil temperature, and bulk dielectric permittivity are measured every 30 minutes at an automated meteorological station installed at Jornada LTER NPP C-GRAV site. Measurements are made every 30 minutes at 10 cm, 20 cm, and 30 cm soil depths. This is an ONGOING dataset.
Resource Title: Website Pointer to html file.
File Name: Web Page, url: https://portal.edirepository.org/nis/mapbrowse?scope=knb-lter-jrn&identifier=210437077
Webpage with information and links to data files for download
30-minute summary data at NPP C-GRAV met station. Average air temperature, relative humidity, wind speed and wind direction are measured and calculated based on 1-second scan rate of all sensors located at an automated meteorological station installed at Jornada LTER NPP C-GRAV site. Wind speed is measured at 75 cm, 150 cm, and 300 cm, wind direction at approximately 3m, and air temperature and relative humidity at approximate 2.5m. This climate station is operated by the Jornada LTER Program. This is an ONGOING dataset.
Resource Title: Website Pointer to html file.
File Name: Web Page, url: https://portal.edirepository.org/nis/mapbrowse?scope=knb-lter-jrn&identifier=210437017
Webpage with information and links to data files for download
5-minute summary data at NPP C-GRAV met station. Average air temperature, wind speed and wind direction are measured and calculated based on 1-second scan rate of all sensors located at an automated meteorological station installed at Jornada LTER NPP C-GRAV site. Wind speed is measured at 75 cm, 150 cm, and 300 cm, wind direction at approximately 3m, and air temperature at approximate 2.5m. This climate station is operated by the Jornada LTER Program. This is an ONGOING dataset.
Resource Title: Website Pointer to html file.
File Name: Web Page, url: https://portal.edirepository.org/nis/mapbrowse?scope=knb-lter-jrn&identifier=210437002
Webpage with information and links to data files for download
Daily average of 30-minute Volumetric Water Content at NPP C-GRAV met station. Collection of soil volumetric water content data at Jornada LTER NPP sites, New Mexico, supports the environmental monitoring objectives of the Jornada LTER monitoring program that look at plant-soil water dynamics. Volumetric water content, bulk electrical conductivity, soil temperature, and bulk dielectric permittivity are measured and calculated at an automated meteorological station installed at Jornada LTER NPP C-GRAV site. The daily average at 3 soil depths is calculated from measurements made every 30 minutes at 10 cm, 20 cm, and 30 cm. This is an ONGOING dataset.
Resource Title: Website Pointer to html file.
File Name: Web Page, url: https://portal.edirepository.org/nis/mapbrowse?scope=knb-lter-jrn&identifier=210437092
Webpage with information and links to data files for download
Daily summary data at NPP C-GRAV met station. Average/maximum/minimum air temperature; average/maximum relative humidity and wind speed and average wind direction. These are measured and calculated based on 1-second scan rate of all sensors located at an automated meteorological station installed at Jornada LTER NPP C-GRAV site. Wind speed is measured at 75 cm, 150 cm, and 300 cm, wind direction at approximately 3m, and air temperature and relative humidity at approximate 2.5m. This climate station is operated by the Jornada LTER Program. This is an ONGOING dataset.
Resource Title: Website Pointer to html file.
File Name: Web Page, url: https://portal.edirepository.org/nis/mapbrowse?scope=knb-lter-jrn&identifier=210437047
Webpage with information and links to data files for download
Hourly summary data at NPP C-SAND met station. Average/maximum/minimum air temperature; average relative humidity and wind direction; average/maximum wind speed; solar radiation; albedo. These are measured and calculated based on 1-second scan rate of all sensors located at an automated meteorological station installed at Jornada LTER NPP C-SAND site. Wind speed is measured at 75 cm, 150 cm, and 300 cm, wind direction at approximately 3m, and air temperature and relative humidity at approximate 2.5m. Solar radiation is measured at 3m. This climate station is operated by the Jornada LTER Program. This is an ONGOING dataset.
Resource Title: Website Pointer to html file.
File Name: Web Page, url: https://portal.edirepository.org/nis/mapbrowse?scope=knb-lter-jrn&identifier=210437033
Webpage with information and links to data files for download
1-second summary precipitation data at NPP C-SAND met station. Total precipitation per second is recorded only if there is measurable precipitation. This is recorded at an automated meteorological station installed at Jornada LTER NPP C-SAND site.. This climate station is operated by the Jornada LTER Program. This is an ONGOING dataset. IMPORTANT: Rainfall is only recorded when a bucket tip occurs on the tipping bucket rain gauge. If there is missing data due to equipment or other problems, there will be no indication of this within this dataset. The user needs to review precipitation values in the 30 minute or hourly summary datasets to determine if there are missing data in this 1 second detailed precipitation dataset. Reference the package i.d.'s knb-lter-jrn.210437018, knb-lter-jrn.210437033, and knb-lter-jrn.210437048 for the NPP C-SAND met station 30 minute, hourly, and daily summary datasets, respectively.
Resource Title: Website Pointer to html file.
File Name: Web Page, url: https://portal.edirepository.org/nis/mapbrowse?scope=knb-lter-jrn&identifier=210437063
Webpage with information and links to data files for download
30-minute Soil Moisture data at NPP C-SAND met station. Collection of soil volumetric water content data at Jornada LTER NPP sites, New Mexico, supports the environmental monitoring objectives of the Jornada LTER monitoring program that look at plant-soil water dynamics. Volumetric water content, bulk electrical conductivity, soil temperature, and bulk dielectric permittivity are measured every 30 minutes at an automated meteorological station installed at Jornada LTER NPP C-SAND site. Measurements are made every 30 minutes at 10 cm, 20 cm, and 30 cm soil depths. This is an ONGOING dataset.
Resource Title: Website Pointer to html file.
File Name: Web Page, url: https://portal.edirepository.org/nis/mapbrowse?scope=knb-lter-jrn&identifier=210437078
Webpage with information and links to data files for download
30-minute summary data at NPP C-SAND met station. Average air temperature, relative humidity, wind speed, wind direction, and solar radiation are measured and calculated based on 1-second scan rate of all sensors located at an automated meteorological station installed at Jornada LTER NPP C-SAND site. Wind speed is measured at 75 cm, 150 cm, and 300 cm, wind direction at approximately 3m, and air temperature and relative humidity at approximate 2.5m. Solar radiation is measured at 3m. This climate station is operated by the Jornada LTER Program. This is an ONGOING dataset.
Resource Title: Website Pointer to html file.
File Name: Web Page, url: https://portal.edirepository.org/nis/mapbrowse?scope=knb-lter-jrn&identifier=210437018
Webpage with information and links to data files for download
5-minute summary data at NPP C-SAND met station. Average air temperature, wind speed and wind direction are measured and calculated based on 1-second scan rate of all sensors located at an automated meteorological station installed at Jornada LTER NPP C-SAND site. Wind speed is measured at 75 cm, 150 cm, and 300 cm, wind direction at approximately 3m, and air temperature at approximate 2.5m. This climate station is operated by the Jornada LTER Program. This is an ONGOING dataset.
Resource Title: Website Pointer to html file.
File Name: Web Page, url: https://portal.edirepository.org/nis/mapbrowse?scope=knb-lter-jrn&identifier=210437003
Webpage with information and links to data files for download
Daily average of 30-minute Volumetric Water Content at NPP C-SAND met station. Collection of soil volumetric water content data at Jornada LTER NPP sites, New Mexico, supports the environmental monitoring objectives of the Jornada LTER monitoring program that look at plant-soil water dynamics. Volumetric water content, bulk electrical conductivity, soil temperature, and bulk dielectric permittivity are measured and calculated at an automated meteorological station installed at Jornada LTER NPP C-SAND site. The daily average at 3 soil depths is calculated from measurements made every 30 minutes at 10 cm, 20 cm, and 30 cm. This is an ONGOING dataset.
Resource Title: Website Pointer to html file.
File Name: Web Page, url: https://portal.edirepository.org/nis/mapbrowse?scope=knb-lter-jrn&identifier=210437093
Webpage with information and links to data files for download
Daily summary data at NPP C-SAND met station. Average/maximum/minimum air temperature; average/maximum relative humidity and wind speed and average wind direction; solar radiation; albedo. These are measured and calculated based on 1-second scan rate of all sensors located at an automated meteorological station installed at Jornada LTER NPP C-SAND site. Wind speed is measured at 75 cm, 150 cm, and 300 cm, wind direction at approximately 3m, and air temperature and relative humidity at approximate 2.5m. Solar radiation is measured at 3m. This climate station is operated by the Jornada LTER Program. This is an ONGOING dataset.
Resource Title: Website Pointer to html file.
File Name: Web Page, url: https://portal.edirepository.org/nis/mapbrowse?scope=knb-lter-jrn&identifier=210437048
Webpage with information and links to data files for download
Hourly summary data at NPP G-BASN met station. Average/maximum/minimum air temperature; average relative humidity and wind direction; average/maximum wind speed. These are measured and calculated based on 1-second scan rate of all sensors located at an automated meteorological station installed at Jornada LTER NPP G-BASN site. Wind speed is measured at 75 cm, 150 cm, and 300 cm, wind direction at approximately 3m, and air temperature and relative humidity at approximate 2.5m. This climate station is operated by the Jornada LTER Program. This is an ONGOING dataset.
Resource Title: Website Pointer to html file.
File Name: Web Page, url: https://portal.edirepository.org/nis/mapbrowse?scope=knb-lter-jrn&identifier=210437034
Webpage with information and links to data files for download
1-second summary precipitation data at NPP G-BASN met station. Total precipitation per second is recorded only if there is measurable precipitation. This is recorded at an automated meteorological station installed at Jornada LTER NPP G-BASN site.. This climate station is operated by the Jornada LTER Program. IMPORTANT: Rainfall is only recorded when a bucket tip occurs on the tipping bucket rain gauge. If there is missing data due to equipment or other problems, there will be no indication of this within this dataset. The user needs to review precipitation values in the 30 minute or hourly summary datasets to determine if there are missing data in this 1 second detailed precipitation dataset. Reference the package i.d.'s knb-lter-jrn.210437019, knb-lter-jrn.210437034, and knb-lter-jrn.210437049 for the NPP G-BASN met station 30 minute, hourly, and daily summary datasets, respectively. This is an ONGOING dataset.
Resource Title: Website Pointer to html file.
File Name: Web Page, url: https://portal.edirepository.org/nis/mapbrowse?scope=knb-lter-jrn&identifier=210437064
Webpage with information and links to data files for download
30-minute Soil Moisture data at NPP G-BASN met station. Collection of soil volumetric water content data at Jornada LTER NPP sites, New Mexico, supports the environmental monitoring objectives of the Jornada LTER monitoring program that look at plant-soil water dynamics. Volumetric water content, bulk electrical conductivity, soil temperature, and bulk dielectric permittivity are measured every 30 minutes at an automated meteorological station installed at Jornada LTER NPP G-BASN site. Measurements are made every 30 minutes at 10 cm, 20 cm, and 30 cm soil depths. This is an ONGOING dataset.
Resource Title: Website Pointer to html file.
File Name: Web Page, url: https://portal.edirepository.org/nis/mapbrowse?scope=knb-lter-jrn&identifier=210437079
Webpage with information and links to data files for download
30-minute summary data at NPP G-BASN met station. Average air temperature, relative humidity, wind speed and wind direction are measured and calculated based on 1-second scan rate of all sensors located at an automated meteorological station installed at Jornada LTER NPP G-BASN site. Wind speed is measured at 75 cm, 150 cm, and 300 cm, wind direction at approximately 3m, and air temperature and relative humidity at approximate 2.5m. This climate station is operated by the Jornada LTER Program. This is an ONGOING dataset.
Resource Title: Website Pointer to html file.
File Name: Web Page, url: https://portal.edirepository.org/nis/mapbrowse?scope=knb-lter-jrn&identifier=210437019
Webpage with information and links to data files for download
5-minute summary data at NPP G-BASN met station. Average air temperature, wind speed and wind direction are measured and calculated based on 1-second scan rate of all sensors located at an automated meteorological station installed at Jornada LTER NPP G-BASN site. Wind speed is measured at 75 cm, 150 cm, and 300 cm, wind direction at approximately 3m, and air temperature at approximate 2.5m. This climate station is operated by the Jornada LTER Program. This is an ONGOING dataset.
Resource Title: Website Pointer to html file.
File Name: Web Page, url: https://portal.edirepository.org/nis/mapbrowse?scope=knb-lter-jrn&identifier=210437004
Webpage with information and links to data files for download
Daily average of 30-minute Volumetric Water Content at NPP G-BASN met station. Collection of soil volumetric water content data at Jornada LTER NPP sites, New Mexico, supports the environmental monitoring objectives of the Jornada LTER monitoring program that look at plant-soil water dynamics. Volumetric water content, bulk electrical conductivity, soil temperature, and bulk dielectric permittivity are measured and calculated at an automated meteorological station installed at Jornada LTER NPP G-BASN site. The daily average at 3 soil depths is calculated from measurements made every 30 minutes at 10 cm, 20 cm, and 30 cm. This is an ONGOING dataset.
Resource Title: Website Pointer to html file.
File Name: Web Page, url: https://portal.edirepository.org/nis/mapbrowse?scope=knb-lter-jrn&identifier=210437094
Webpage with information and links to data files for download
Daily summary data at NPP G-BASN met station. Average/maximum/minimum air temperature; average/maximum relative humidity and wind speed and average wind direction. These are measured and calculated based on 1-second scan rate of all sensors located at an automated meteorological station installed at Jornada LTER NPP G-BASN site. Wind speed is measured at 75 cm, 150 cm, and 300 cm, wind direction at approximately 3m, and air temperature and relative humidity at approximate 2.5m. This climate station is operated by the Jornada LTER Program. This is an ONGOING dataset.
Resource Title: Website Pointer to html file.
File Name: Web Page, url: https://portal.edirepository.org/nis/mapbrowse?scope=knb-lter-jrn&identifier=210437049
Webpage with information and links to data files for download
Hourly summary data at NPP G-IBPE met station. Average/maximum/minimum air temperature; average relative humidity and wind direction; average/maximum wind speed. These are measured and calculated based on 1-second scan rate of all sensors located at an automated meteorological station installed at Jornada LTER NPP G-IBPE site. Wind speed is measured at 75 cm, 150 cm, and 300 cm, wind direction at approximately 3m, and air temperature and relative humidity at approximate 2.5m. This climate station is operated by the Jornada LTER Program. This is an ONGOING dataset.
Resource Title: Website Pointer to html file.
File Name: Web Page, url: https://portal.edirepository.org/nis/mapbrowse?scope=knb-lter-jrn&identifier=210437035
Webpage with information and links to data files for download
1-second summary precipitation data at NPP G-IBPE met station. Total precipitation per second is recorded only if there is measurable precipitation. This is recorded at an automated meteorological station installed at Jornada LTER NPP G-IBPE site.. This climate station is operated by the Jornada LTER Program. IMPORTANT: Rainfall is only recorded when a bucket tip occurs on the tipping bucket rain gauge. If there is missing data due to equipment or other problems, there will be no indication of this within this dataset. The user needs to review precipitation values in the 30 minute or hourly summary datasets to determine if there are missing data in this 1 second detailed precipitation dataset. Reference the package i.d.'s knb-lter-jrn.210437020, knb-lter-jrn.210437035, and knb-lter-jrn.210437050 for the NPP G-IBPE met station 30 minute, hourly, and daily summary datasets, respectively. This is an ONGOING dataset.
Resource Title: Website Pointer to html file.
File Name: Web Page, url: https://portal.edirepository.org/nis/mapbrowse?scope=knb-lter-jrn&identifier=210437065
Webpage with information and links to data files for download
30-minute Soil Moisture data at NPP G-IBPE met station. Collection of soil volumetric water content data at Jornada LTER NPP sites, New Mexico, supports the environmental monitoring objectives of the Jornada LTER monitoring program that look at plant-soil water dynamics. Volumetric water content, bulk electrical conductivity, soil temperature, and bulk dielectric permittivity are measured every 30 minutes at an automated meteorological station installed at Jornada LTER NPP G-IBPE site. Measurements are made every 30 minutes at 10 cm, 20 cm, and 30 cm soil depths. This is an ONGOING dataset.
Resource Title: Website Pointer to html file.
File Name: Web Page, url: https://portal.edirepository.org/nis/mapbrowse?scope=knb-lter-jrn&identifier=210437080
Webpage with information and links to data files for download
30-minute summary data at NPP G-IBPE met station. Average air temperature, relative humidity, wind speed and wind direction are measured and calculated based on 1-second scan rate of all sensors located at an automated meteorological station installed at Jornada LTER NPP G-IBPE site. Wind speed is measured at 75 cm, 150 cm, and 300 cm, wind direction at approximately 3m, and air temperature and relative humidity at approximate 2.5m. This climate station is operated by the Jornada LTER Program. This is an ONGOING dataset.
Resource Title: Website Pointer to html file.
File Name: Web Page, url: https://portal.edirepository.org/nis/mapbrowse?scope=knb-lter-jrn&identifier=210437020
Webpage with information and links to data files for download
5-minute summary data at NPP G-IBPE met station. Average air temperature, wind speed and wind direction are measured and calculated based on 1-second scan rate of all sensors located at an automated meteorological station installed at Jornada LTER NPP G-IBPE site. Wind speed is measured at 75 cm, 150 cm, and 300 cm, wind direction at approximately 3m, and air temperature at approximate 2.5m. This climate station is operated by the Jornada LTER Program. This is an ONGOING dataset.
Resource Title: Website Pointer to html file.
File Name: Web Page, url: https://portal.edirepository.org/nis/mapbrowse?scope=knb-lter-jrn&identifier=210437005
Webpage with information and links to data files for download
Daily average of 30-minute Volumetric Water Content at NPP G-IBPE met station. Collection of soil volumetric water content data at Jornada LTER NPP sites, New Mexico, supports the environmental monitoring objectives of the Jornada LTER monitoring program that look at plant-soil water dynamics. Volumetric water content, bulk electrical conductivity, soil temperature, and bulk dielectric permittivity are measured and calculated at an automated meteorological station installed at Jornada LTER NPP G-IBPE site. The daily average at 3 soil depths is calculated from measurements made every 30 minutes at 10 cm, 20 cm, and 30 cm. This is an ONGOING dataset.
Resource Title: Website Pointer to html file.
File Name: Web Page, url: https://portal.edirepository.org/nis/mapbrowse?scope=knb-lter-jrn&identifier=210437095
Webpage with information and links to data files for download
Daily summary data at NPP G-IBPE met station. Average/maximum/minimum air temperature; average/maximum relative humidity and wind speed and average wind direction. These are measured and calculated based on 1-second scan rate of all sensors located at an automated meteorological station installed at Jornada LTER NPP G-IBPE site. Wind speed is measured at 75 cm, 150 cm, and 300 cm, wind direction at approximately 3m, and air temperature and relative humidity at approximate 2.5m. This climate station is operated by the Jornada LTER Program. This is an ONGOING dataset.
Resource Title: Website Pointer to html file.
File Name: Web Page, url: https://portal.edirepository.org/nis/mapbrowse?scope=knb-lter-jrn&identifier=210437050
Webpage with information and links to data files for download
Hourly summary data at NPP G-SUMM met station. Average/maximum/minimum air temperature; average relative humidity and wind direction; average/maximum wind speed; solar radiation; albedo. These are measured and calculated based on 1-second scan rate of all sensors located at an automated meteorological station installed at Jornada LTER NPP G-SUMM site. Wind speed is measured at 75 cm, 150 cm, and 300 cm, wind direction at approximately 3m, and air temperature and relative humidity at approximate 2.5m. Solar radiation is measured at 3m. This climate station is operated by the Jornada LTER Program. This is an ONGOING dataset.
Resource Title: Website Pointer to html file.
File Name: Web Page, url: https://portal.edirepository.org/nis/mapbrowse?scope=knb-lter-jrn&identifier=210437036
Webpage with information and links to data files for download
1-second summary precipitation data at NPP G-SUMM met station. Total precipitation per second is recorded only if there is measurable precipitation. This is recorded at an automated meteorological station installed at Jornada LTER NPP G-SUMM site.. This climate station is operated by the Jornada LTER Program. IMPORTANT: Rainfall is only recorded when a bucket tip occurs on the tipping bucket rain gauge. If there is missing data due to equipment or other problems, there will be no indication of this within this dataset. The user needs to review precipitation values in the 30 minute or hourly summary datasets to determine if there are missing data in this 1 second detailed precipitation dataset. Reference the package i.d.'s knb-lter-jrn.210437021, knb-lter-jrn.210437036, and knb-lter-jrn.210437051 for the NPP G-SUMM met station 30 minute, hourly, and daily summary datasets, respectively. This is an ONGOING dataset.
Resource Title: Website Pointer to html file.
File Name: Web Page, url: https://portal.edirepository.org/nis/mapbrowse?scope=knb-lter-jrn&identifier=210437066
Webpage with information and links to data files for download
30-minute Soil Moisture data at NPP G-SUMM met station. Collection of soil volumetric water content data at Jornada LTER NPP sites, New Mexico, supports the environmental monitoring objectives of the Jornada LTER monitoring program that look at plant-soil water dynamics. Volumetric water content, bulk electrical conductivity, soil temperature, and bulk dielectric permittivity are measured every 30 minutes at an automated meteorological station installed at Jornada LTER NPP G-SUMM site. Measurements are made every 30 minutes at 10 cm, 20 cm, and 30 cm soil depths. This is an ONGOING dataset.
Resource Title: Website Pointer to html file.
File Name: Web Page, url: https://portal.edirepository.org/nis/mapbrowse?scope=knb-lter-jrn&identifier=210437081
Webpage with information and links to data files for download
30-minute summary data at NPP G-SUMM met station. Average air temperature, relative humidity, wind speed, wind direction, and solar radiation are measured and calculated based on 1-second scan rate of all sensors located at an automated meteorological station installed at Jornada LTER NPP G-SUMM site. Wind speed is measured at 75 cm, 150 cm, and 300 cm, wind direction at approximately 3m, and air temperature and relative humidity at approximate 2.5m. Solar radiation is measured at 3m. This climate station is operated by the Jornada LTER Program. This is an ONGOING dataset.
Resource Title: Website Pointer to html file.
File Name: Web Page, url: https://portal.edirepository.org/nis/mapbrowse?scope=knb-lter-jrn&identifier=210437021
Webpage with information and links to data files for download
5-minute summary data at NPP G-SUMM met station. Average air temperature, wind speed and wind direction are measured and calculated based on 1-second scan rate of all sensors located at an automated meteorological station installed at Jornada LTER NPP G-SUMM site. Wind speed is measured at 75 cm, 150 cm, and 300 cm, wind direction at approximately 3m, and air temperature at approximate 2.5m. This climate station is operated by the Jornada LTER Program. This is an ONGOING dataset.
Resource Title: Website Pointer to html file.
File Name: Web Page, url: https://portal.edirepository.org/nis/mapbrowse?scope=knb-lter-jrn&identifier=210437006
Webpage with information and links to data files for download
Daily average of 30-minute Volumetric Water Content at NPP G-SUMM met station. Collection of soil volumetric water content data at Jornada LTER NPP sites, New Mexico, supports the environmental monitoring objectives of the Jornada LTER monitoring program that look at plant-soil water dynamics. Volumetric water content, bulk electrical conductivity, soil temperature, and bulk dielectric permittivity are measured and calculated at an automated meteorological station installed at Jornada LTER NPP G-SUMM site. The daily average at 3 soil depths is calculated from measurements made every 30 minutes at 10 cm, 20 cm, and 30 cm. This is an ONGOING dataset.
Resource Title: Website Pointer to html file.
File Name: Web Page, url: https://portal.edirepository.org/nis/mapbrowse?scope=knb-lter-jrn&identifier=210437096
Webpage with information and links to data files for download
Daily summary data at NPP G-SUMM met station. Average/maximum/minimum air temperature; average/maximum relative humidity and wind speed and average wind direction; solar radiation; albedo. These are measured and calculated based on 1-second scan rate of all sensors located at an automated meteorological station installed at Jornada LTER NPP G-SUMM site. Wind speed is measured at 75 cm, 150 cm, and 300 cm, wind direction at approximately 3m, and air temperature and relative humidity at approximate 2.5m. Solar radiation is measured at 3m. This climate station is operated by the Jornada LTER Program. This is an ONGOING dataset.
Resource Title: Website Pointer to html file.
File Name: Web Page, url: https://portal.edirepository.org/nis/mapbrowse?scope=knb-lter-jrn&identifier=210437051
Webpage with information and links to data files for download
Hourly summary data at NPP M-NORT met station. Average/maximum/minimum air temperature; average relative humidity. These are measured and calculated based on 1-second scan rate of all sensors located at an automated meteorological station installed at Jornada LTER NPP M-NORT site. Air temperature and relative humidity are measured at approximately 2.5m. This climate station is operated by the Jornada LTER Program. This is an ONGOING dataset.
Resource Title: Website Pointer to html file.
File Name: Web Page, url: https://portal.edirepository.org/nis/mapbrowse?scope=knb-lter-jrn&identifier=210437037
Webpage with information and links to data files for download
1-second summary precipitation data at NPP M-NORT met station. Total precipitation per second is recorded only if there is measurable precipitation. This is recorded at an automated meteorological station installed at Jornada LTER NPP M-NORT site.. This climate station is operated by the Jornada LTER Program. IMPORTANT: Rainfall is only recorded when a bucket tip occurs on the tipping bucket rain gauge. If there is missing data due to equipment or other problems, there will be no indication of this within this dataset. The user needs to review precipitation values in the 30 minute or hourly summary datasets to determine if there are missing data in this 1 second detailed precipitation dataset. Reference the package i.d.'s knb-lter-jrn.210437022, knb-lter-jrn.210437037, and knb-lter-jrn.210437052 for the NPP M-NORT met station 30 minute, hourly, and daily summary datasets, respectively. This is an ONGOING dataset.
Resource Title: Website Pointer to html file.
File Name: Web Page, url: https://portal.edirepository.org/nis/mapbrowse?scope=knb-lter-jrn&identifier=210437067
Webpage with information and links to data files for download
30-minute Soil Moisture data at NPP M-NORT met station. Collection of soil volumetric water content data at Jornada LTER NPP sites, New Mexico, supports the environmental monitoring objectives of the Jornada LTER monitoring program that look at plant-soil water dynamics. Volumetric water content, bulk electrical conductivity, soil temperature, and bulk dielectric permittivity are measured every 30 minutes at an automated meteorological station installed at Jornada LTER NPP M-NORT site. Measurements are made every 30 minutes at 10 cm, 20 cm, and 30 cm soil depths. This is an ONGOING dataset.
Resource Title: Website Pointer to html file.
File Name: Web Page, url: https://portal.edirepository.org/nis/mapbrowse?scope=knb-lter-jrn&identifier=210437082
Webpage with information and links to data files for download
30-minute summary data at NPP M-NORT met station. Average air temperature and relative humidity are measured and calculated based on 1-second scan rate of all sensors located at an automated meteorological station installed at Jornada LTER NPP G-SUMM site. Air temperature and relative humidity are measured at approximate 2.5m. This climate station is operated by the Jornada LTER Program. This is an ONGOING dataset.
Resource Title: Website Pointer to html file.
File Name: Web Page, url: https://portal.edirepository.org/nis/mapbrowse?scope=knb-lter-jrn&identifier=210437022
Webpage with information and links to data files for download
5-minute summary data at NPP M-NORT met station. Average air temperature measured and calculated based on 1-second scan rate of all sensors located at an automated meteorological station installed at Jornada LTER NPP M-NORT site. Air temperature is measured at approximate 2.5m. This climate station is operated by the Jornada LTER Program. This is an ONGOING dataset.
Resource Title: Website Pointer to html file.
File Name: Web Page, url: https://portal.edirepository.org/nis/mapbrowse?scope=knb-lter-jrn&identifier=210437007
Webpage with information and links to data files for download
Daily average of 30-minute Volumetric Water Content at NPP M-NORT met station. Collection of soil volumetric water content data at Jornada LTER NPP sites, New Mexico, supports the environmental monitoring objectives of the Jornada LTER monitoring program that look at plant-soil water dynamics. Volumetric water content, bulk electrical conductivity, soil temperature, and bulk dielectric permittivity are measured and calculated at an automated meteorological station installed at Jornada LTER NPP M-NORT site. The daily average at 3 soil depths is calculated from measurements made every 30 minutes at 10 cm, 20 cm, and 30 cm. This is an ONGOING dataset.
Resource Title: Website Pointer to html file.
File Name: Web Page, url: https://portal.edirepository.org/nis/mapbrowse?scope=knb-lter-jrn&identifier=210437097
Webpage with information and links to data files for download
Daily summary data at NPP M-NORT met station. Average/maximum/minimum air temperature; average/maximum relative humidity. These are measured and calculated based on 1-second scan rate of all sensors located at an automated meteorological station installed at Jornada LTER NPP M-NORT site. Air temperature and relative humidity are measured at approximately 2.5m. This climate station is operated by the Jornada LTER Program. This is an ONGOING dataset.
Resource Title: Website Pointer to html file.
File Name: Web Page, url: https://portal.edirepository.org/nis/mapbrowse?scope=knb-lter-jrn&identifier=210437052
Webpage with information and links to data files for download
Hourly summary data at NPP M-RABB met station. Average/maximum/minimum air temperature; average relative humidity and wind direction; average/maximum wind speed; solar radiation; albedo. These are measured and calculated based on 1-second scan rate of all sensors located at an automated meteorological station installed at Jornada LTER NPP M-RABB site. Wind speed is measured at 75 cm, 150 cm, and 300 cm, wind direction at approximately 3m, and air temperature and relative humidity at approximate 2.5m. Solar radiation is measured at 3m. This climate station is operated by the Jornada LTER Program. This is an ONGOING dataset.
Resource Title: Website Pointer to html file.
File Name: Web Page, url: https://portal.edirepository.org/nis/mapbrowse?scope=knb-lter-jrn&identifier=210437038
Webpage with information and links to data files for download
1-second summary precipitation data at NPP M-RABB met station. Total precipitation per second is recorded only if there is measurable precipitation. This is recorded at an automated meteorological station installed at Jornada LTER NPP M-RABB site.. This climate station is operated by the Jornada LTER Program. IMPORTANT: Rainfall is only recorded when a bucket tip occurs on the tipping bucket rain gauge. If there is missing data due to equipment or other problems, there will be no indication of this within this dataset. The user needs to review precipitation values in the 30 minute or hourly summary datasets to determine if there are missing data in this 1 second detailed precipitation dataset. Reference the package i.d.'s knb-lter-jrn.210437023, knb-lter-jrn.210437038, and knb-lter-jrn.210437053 for the NPP M-RABB met station 30 minute, hourly, and daily summary datasets, respectively. This is an ONGOING dataset.
Resource Title: Website Pointer to html file.
File Name: Web Page, url: https://portal.edirepository.org/nis/mapbrowse?scope=knb-lter-jrn&identifier=210437068
Webpage with information and links to data files for download
30-minute Soil Moisture data at NPP M-RABB met station. Collection of soil volumetric water content data at Jornada LTER NPP sites, New Mexico, supports the environmental monitoring objectives of the Jornada LTER monitoring program that look at plant-soil water dynamics. Volumetric water content, bulk electrical conductivity, soil temperature, and bulk dielectric permittivity are measured every 30 minutes at an automated meteorological station installed at Jornada LTER NPP M-RABB site. Measurements are made every 30 minutes at 10 cm, 20 cm, and 30 cm soil depths. This is an ONGOING dataset.
Resource Title: Website Pointer to html file.
File Name: Web Page, url: https://portal.edirepository.org/nis/mapbrowse?scope=knb-lter-jrn&identifier=210437083
Webpage with information and links to data files for download
30-minute summary data at NPP M-RABB met station. Average air temperature, relative humidity, wind speed, wind direction, and solar radiation are measured and calculated based on 1-second scan rate of all sensors located at an automated meteorological station installed at Jornada LTER NPP M-RABB site. Wind speed is measured at 75 cm, 150 cm, and 300 cm, wind direction at approximately 3m, and air temperature and relative humidity at approximate 2.5m. Solar radiation is measured at 3m. This climate station is operated by the Jornada LTER Program. This is an ONGOING dataset.
Resource Title: Website Pointer to html file.
File Name: Web Page, url: https://portal.edirepository.org/nis/mapbrowse?scope=knb-lter-jrn&identifier=210437023
Webpage with information and links to data files for download
5-minute summary data at NPP M-RABB met station. Average air temperature, wind speed and wind direction are measured and calculated based on 1-second scan rate of all sensors located at an automated meteorological station installed at Jornada LTER NPP M-NORT site. Wind speed is measured at 75 cm, 150 cm, and 300 cm, wind direction at approximately 3m, and air temperature at approximate 2.5m. This climate station is operated by the Jornada LTER Program. This is an ONGOING dataset.
Resource Title: Website Pointer to html file.
File Name: Web Page, url: https://portal.edirepository.org/nis/mapbrowse?scope=knb-lter-jrn&identifier=210437008
Webpage with information and links to data files for download
Daily average of 30-minute Volumetric Water Content at NPP M-RABB met station. Collection of soil volumetric water content data at Jornada LTER NPP sites, New Mexico, supports the environmental monitoring objectives of the Jornada LTER monitoring program that look at plant-soil water dynamics. Volumetric water content, bulk electrical conductivity, soil temperature, and bulk dielectric permittivity are measured and calculated at an automated meteorological station installed at Jornada LTER NPP M-RABB site. The daily average at 3 soil depths is calculated from measurements made every 30 minutes at 10 cm, 20 cm, and 30 cm. This is an ONGOING dataset.
Resource Title: Website Pointer to html file.
File Name: Web Page, url: https://portal.edirepository.org/nis/mapbrowse?scope=knb-lter-jrn&identifier=210437098
Webpage with information and links to data files for download
Daily summary data at NPP M-RABB met station. Average/maximum/minimum air temperature; average/maximum relative humidity and wind speed and average wind direction; solar radiation; albedo. These are measured and calculated based on 1-second scan rate of all sensors located at an automated meteorological station installed at Jornada LTER NPP M-RABB site. Wind speed is measured at 75 cm, 150 cm, and 300 cm, wind direction at approximately 3m, and air temperature and relative humidity at approximate 2.5m. Solar radiation is measured at 3m. This climate station is operated by the Jornada LTER Program. This is an ONGOING dataset.
Resource Title: Website Pointer to html file.
File Name: Web Page, url: https://portal.edirepository.org/nis/mapbrowse?scope=knb-lter-jrn&identifier=210437053
Webpage with information and links to data files for download
Hourly summary data at NPP M-WELL met station. Average/maximum/minimum air temperature; average relative humidity and wind direction; average/maximum wind speed. These are measured and calculated based on 1-second scan rate of all sensors located at an automated meteorological station installed at Jornada LTER NPP M-WELL site. Wind speed is measured at 75 cm, 150 cm, and 300 cm, wind direction at approximately 3m, and air temperature and relative humidity at approximate 2.5m. This climate station is operated by the Jornada LTER Program. This is an ONGOING dataset.
Resource Title: Website Pointer to html file.
File Name: Web Page, url: https://portal.edirepository.org/nis/mapbrowse?scope=knb-lter-jrn&identifier=210437039
Webpage with information and links to data files for download
1-second summary precipitation data at NPP M-WELL met station. Total precipitation per second is recorded only if there is measurable precipitation. This is recorded at an automated meteorological station installed at Jornada LTER NPP M-WELL site.. This climate station is operated by the Jornada LTER Program. IMPORTANT: Rainfall is only recorded when a bucket tip occurs on the tipping bucket rain gauge. If there is missing data due to equipment or other problems, there will be no indication of this within this dataset. The user needs to review precipitation values in the 30 minute or hourly summary datasets to determine if there are missing data in this 1 second detailed precipitation dataset. Reference the package i.d.'s knb-lter-jrn.210437024, knb-lter-jrn.210437039, and knb-lter-jrn.210437054 for the NPP M-WELL met station 30 minute, hourly, and daily summary datasets, respectively. This is an ONGOING dataset.
Resource Title: Website Pointer to html file.
File Name: Web Page, url: https://portal.edirepository.org/nis/mapbrowse?scope=knb-lter-jrn&identifier=210437069
Webpage with information and links to data files for download
30-minute Soil Moisture data at NPP M-WELL met station. Collection of soil volumetric water content data at Jornada LTER NPP sites, New Mexico, supports the environmental monitoring objectives of the Jornada LTER monitoring program that look at plant-soil water dynamics. Volumetric water content, bulk electrical conductivity, soil temperature, and bulk dielectric permittivity are measured every 30 minutes at an automated meteorological station installed at Jornada LTER NPP M-WELL site. Measurements are made every 30 minutes at 10 cm, 20 cm, and 30 cm soil depths. This is an ONGOING dataset.
Resource Title: Website Pointer to html file.
File Name: Web Page, url: https://portal.edirepository.org/nis/mapbrowse?scope=knb-lter-jrn&identifier=210437084
Webpage with information and links to data files for download
30-minute summary data at NPP M-WELL met station. Average air temperature, relative humidity, wind speed and wind direction are measured and calculated based on 1-second scan rate of all sensors located at an automated meteorological station installed at Jornada LTER NPP M-WELL site. Wind speed is measured at 75 cm, 150 cm, and 300 cm, wind direction at approximately 3m, and air temperature and relative humidity at approximate 2.5m. This climate station is operated by the Jornada LTER Program. This is an ONGOING dataset.
Resource Title: Website Pointer to html file.
File Name: Web Page, url: https://portal.edirepository.org/nis/mapbrowse?scope=knb-lter-jrn&identifier=210437024
Webpage with information and links to data files for download
5-minute summary data at NPP M-WELL met station. Average air temperature, wind speed and wind direction are measured and calculated based on 1-second scan rate of all sensors located at an automated meteorological station installed at Jornada LTER NPP M-WELL site. Wind speed is measured at 75 cm, 150 cm, and 300 cm, wind direction at approximately 3m, and air temperature at approximate 2.5m. This climate station is operated by the Jornada LTER Program. This is an ONGOING dataset.
Resource Title: Website Pointer to html file.
File Name: Web Page, url: https://portal.edirepository.org/nis/mapbrowse?scope=knb-lter-jrn&identifier=210437009
Webpage with information and links to data files for download
Daily average of 30-minute Volumetric Water Content at NPP M-WELL met station. Collection of soil volumetric water content data at Jornada LTER NPP sites, New Mexico, supports the environmental monitoring objectives of the Jornada LTER monitoring program that look at plant-soil water dynamics. Volumetric water content, bulk electrical conductivity, soil temperature, and bulk dielectric permittivity are measured and calculated at an automated meteorological station installed at Jornada LTER NPP M-WELL site. The daily average at 3 soil depths is calculated from measurements made every 30 minutes at 10 cm, 20 cm, and 30 cm. This is an ONGOING dataset.
Resource Title: Website Pointer to html file.
File Name: Web Page, url: https://portal.edirepository.org/nis/mapbrowse?scope=knb-lter-jrn&identifier=210437099
Webpage with information and links to data files for download
Daily summary data at NPP M-WELL met station. Average/maximum/minimum air temperature; average/maximum relative humidity and wind speed and average wind direction. These are measured and calculated based on 1-second scan rate of all sensors located at an automated meteorological station installed at Jornada LTER NPP M-WELL site. Wind speed is measured at 75 cm, 150 cm, and 300 cm, wind direction at approximately 3m, and air temperature and relative humidity at approximate 2.5m. This climate station is operated by the Jornada LTER Program. This is an ONGOING dataset.
Resource Title: Website Pointer to html file.
File Name: Web Page, url: https://portal.edirepository.org/nis/mapbrowse?scope=knb-lter-jrn&identifier=210437054
Webpage with information and links to data files for download
Hourly summary data at NPP P-COLL met station. Average/maximum/minimum air temperature; average relative humidity and wind direction; average/maximum wind speed. These are measured and calculated based on 1-second scan rate of all sensors located at an automated meteorological station installed at Jornada LTER NPP P-COLL site. Wind speed is measured at 75 cm, 150 cm, and 300 cm, wind direction at approximately 3m, and air temperature and relative humidity at approximate 2.5m. This climate station is operated by the Jornada LTER Program. This is an ONGOING dataset.
Resource Title: Website Pointer to html file.
File Name: Web Page, url: https://portal.edirepository.org/nis/mapbrowse?scope=knb-lter-jrn&identifier=210437040
Webpage with information and links to data files for download
1-second summary precipitation data at NPP P-COLL met station. Total precipitation per second is recorded only if there is measurable precipitation. This is recorded at an automated meteorological station installed at Jornada LTER NPP P-COLL site.. This climate station is operated by the Jornada LTER Program. IMPORTANT: Rainfall is only recorded when a bucket tip occurs on the tipping bucket rain gauge. If there is missing data due to equipment or other problems, there will be no indication of this within this dataset. The user needs to review precipitation values in the 30 minute or hourly summary datasets to determine if there are missing data in this 1 second detailed precipitation dataset. Reference the package i.d.'s knb-lter-jrn.210437025, knb-lter-jrn.210437040, and knb-lter-jrn.210437055 for the NPP P-COLL met station 30 minute, hourly, and daily summary datasets, respectively. This is an ONGOING dataset.
Resource Title: Website Pointer to html file.
File Name: Web Page, url: https://portal.edirepository.org/nis/mapbrowse?scope=knb-lter-jrn&identifier=210437070
Webpage with information and links to data files for download
30-minute Soil Moisture data at NPP P-COLL met station. Collection of soil volumetric water content data at Jornada LTER NPP sites, New Mexico, supports the environmental monitoring objectives of the Jornada LTER monitoring program that look at plant-soil water dynamics. Volumetric water content, bulk electrical conductivity, soil temperature, and bulk dielectric permittivity are measured every 30 minutes at an automated meteorological station installed at Jornada LTER NPP P-COLL site. Measurements are made every 30 minutes at 10 cm, 20 cm, and 30 cm soil depths. This is an ONGOING dataset.
Resource Title: Website Pointer to html file.
File Name: Web Page, url: https://portal.edirepository.org/nis/mapbrowse?scope=knb-lter-jrn&identifier=210437085
Webpage with information and links to data files for download
30-minute summary data at NPP P-COLL met station. Average air temperature, relative humidity, wind speed and wind direction are measured and calculated based on 1-second scan rate of all sensors located at an automated meteorological station installed at Jornada LTER NPP P-COLL site. Wind speed is measured at 75 cm, 150 cm, and 300 cm, wind direction at approximately 3m, and air temperature and relative humidity at approximate 2.5m. This climate station is operated by the Jornada LTER Program. This is an ONGOING dataset.
Resource Title: Website Pointer to html file.
File Name: Web Page, url: https://portal.edirepository.org/nis/mapbrowse?scope=knb-lter-jrn&identifier=210437025
Webpage with information and links to data files for download
5-minute summary data at NPP P-COLL met station. Average air temperature, wind speed and wind direction are measured and calculated based on 1-second scan rate of all sensors located at an automated meteorological station installed at Jornada LTER NPP P-COLL site. Wind speed is measured at 75 cm, 150 cm, and 300 cm, wind direction at approximately 3m, and air temperature at approximate 2.5m. This climate station is operated by the Jornada LTER Program. This is an ONGOING dataset.
Resource Title: Website Pointer to html file.
File Name: Web Page, url: https://portal.edirepository.org/nis/mapbrowse?scope=knb-lter-jrn&identifier=210437010
Webpage with information and links to data files for download
Daily average of 30-minute Volumetric Water Content at NPP P-COLL met station. Collection of soil volumetric water content data at Jornada LTER NPP sites, New Mexico, supports the environmental monitoring objectives of the Jornada LTER monitoring program that look at plant-soil water dynamics. Volumetric water content, bulk electrical conductivity, soil temperature, and bulk dielectric permittivity are measured and calculated at an automated meteorological station installed at Jornada LTER NPP P-COLL site. The daily average at 3 soil depths is calculated from measurements made every 30 minutes at 10 cm, 20 cm, and 30 cm. This is an ONGOING dataset.
Resource Title: Website Pointer to html file.
File Name: Web Page, url: https://portal.edirepository.org/nis/mapbrowse?scope=knb-lter-jrn&identifier=210437100
Webpage with information and links to data files for download
Daily summary data at NPP P-COLL met station. Average/maximum/minimum air temperature; average/maximum relative humidity and wind speed and average wind direction. These are measured and calculated based on 1-second scan rate of all sensors located at an automated meteorological station installed at Jornada LTER NPP P-COLL site. Wind speed is measured at 75 cm, 150 cm, and 300 cm, wind direction at approximately 3m, and air temperature and relative humidity at approximate 2.5m. This climate station is operated by the Jornada LTER Program. This is an ONGOING dataset.
Resource Title: Website Pointer to html file.
File Name: Web Page, url: https://portal.edirepository.org/nis/mapbrowse?scope=knb-lter-jrn&identifier=210437055
Webpage with information and links to data files for download
Hourly summary data at NPP P-SMAL met station. Average/maximum/minimum air temperature; average relative humidity and wind direction; average/maximum wind speed. These are measured and calculated based on 1-second scan rate of all sensors located at an automated meteorological station installed at Jornada LTER NPP P-SMAL site. Wind speed is measured at 75 cm, 150 cm, and 300 cm, wind direction at approximately 3m, and air temperature and relative humidity at approximate 2.5m. This climate station is operated by the Jornada LTER Program. This is an ONGOING dataset.
Resource Title: Website Pointer to html file.
File Name: Web Page, url: https://portal.edirepository.org/nis/mapbrowse?scope=knb-lter-jrn&identifier=210437041
Webpage with information and links to data files for download
1-second summary precipitation data at NPP P-SMAL met station. Total precipitation per second is recorded only if there is measurable precipitation. This is recorded at an automated meteorological station installed at Jornada LTER NPP P-SMAL site.. This climate station is operated by the Jornada LTER Program. IMPORTANT: Rainfall is only recorded when a bucket tip occurs on the tipping bucket rain gauge. If there is missing data due to equipment or other problems, there will be no indication of this within this dataset. The user needs to review precipitation values in the 30 minute or hourly summary datasets to determine if there are missing data in this 1 second detailed precipitation dataset. Reference the package i.d.'s knb-lter-jrn.210437026, knb-lter-jrn.210437041, and knb-lter-jrn.210437056 for the NPP P-SMAL met station 30 minute, hourly, and daily summary datasets, respectively. This is an ONGOING dataset.
Resource Title: Website Pointer to html file.
File Name: Web Page, url: https://portal.edirepository.org/nis/mapbrowse?scope=knb-lter-jrn&identifier=210437071
Webpage with information and links to data files for download
30-minute Soil Moisture data at NPP P-SMAL met station. Collection of soil volumetric water content data at Jornada LTER NPP sites, New Mexico, supports the environmental monitoring objectives of the Jornada LTER monitoring program that look at plant-soil water dynamics. Volumetric water content, bulk electrical conductivity, soil temperature, and bulk dielectric permittivity are measured every 30 minutes at an automated meteorological station installed at Jornada LTER NPP P-SMAL site. Measurements are made every 30 minutes at 10 cm, 20 cm, and 30 cm soil depths. This is an ONGOING dataset.
Resource Title: Website Pointer to html file.
File Name: Web Page, url: https://portal.edirepository.org/nis/mapbrowse?scope=knb-lter-jrn&identifier=210437086
Webpage with information and links to data files for download
30-minute summary data at NPP P-SMAL met station. Average air temperature, relative humidity, wind speed and wind direction are measured and calculated based on 1-second scan rate of all sensors located at an automated meteorological station installed at Jornada LTER NPP P-SMAL site. Wind speed is measured at 75 cm, 150 cm, and 300 cm, wind direction at approximately 3m, and air temperature and relative humidity at approximate 2.5m. This climate station is operated by the Jornada LTER Program. This is an ONGOING dataset.
Resource Title: Website Pointer to html file.
File Name: Web Page, url: https://portal.edirepository.org/nis/mapbrowse?scope=knb-lter-jrn&identifier=210437026
Webpage with information and links to data files for download
5-minute summary data at NPP P-SMAL met station. Average air temperature, wind speed and wind direction are measured and calculated based on 1-second scan rate of all sensors located at an automated meteorological station installed at Jornada LTER NPP P-SMAL site. Wind speed is measured at 75 cm, 150 cm, and 300 cm, wind direction at approximately 3m, and air temperature at approximate 2.5m. This climate station is operated by the Jornada LTER Program. This is an ONGOING dataset.
Resource Title: Website Pointer to html file.
File Name: Web Page, url: https://portal.edirepository.org/nis/mapbrowse?scope=knb-lter-jrn&identifier=210437011
Webpage with information and links to data files for download
Daily average of 30-minute Volumetric Water Content at NPP P-SMAL met station. Collection of soil volumetric water content data at Jornada LTER NPP sites, New Mexico, supports the environmental monitoring objectives of the Jornada LTER monitoring program that look at plant-soil water dynamics. Volumetric water content, bulk electrical conductivity, soil temperature, and bulk dielectric permittivity are measured and calculated at an automated meteorological station installed at Jornada LTER NPP P-SMAL site. The daily average at 3 soil depths is calculated from measurements made every 30 minutes at 10 cm, 20 cm, and 30 cm. This is an ONGOING dataset.
Resource Title: Website Pointer to html file.
File Name: Web Page, url: https://portal.edirepository.org/nis/mapbrowse?scope=knb-lter-jrn&identifier=210437101
Webpage with information and links to data files for download
Daily summary data at NPP P-SMAL met station. Average/maximum/minimum air temperature; average/maximum relative humidity and wind speed and average wind direction. These are measured and calculated based on 1-second scan rate of all sensors located at an automated meteorological station installed at Jornada LTER NPP P-SMAL site. Wind speed is measured at 75 cm, 150 cm, and 300 cm, wind direction at approximately 3m, and air temperature and relative humidity at approximate 2.5m. This climate station is operated by the Jornada LTER Program. This is an ONGOING dataset.
Resource Title: Website Pointer to html file.
File Name: Web Page, url: https://portal.edirepository.org/nis/mapbrowse?scope=knb-lter-jrn&identifier=210437056
Webpage with information and links to data files for download
Hourly summary data at NPP P-TOBO met station. Average/maximum/minimum air temperature; average relative humidity and wind direction; average/maximum wind speed; solar radiation; albedo. These are measured and calculated based on 1-second scan rate of all sensors located at an automated meteorological station installed at Jornada LTER NPP P-TOBO site. Wind speed is measured at 75 cm, 150 cm, and 300 cm, wind direction at approximately 3m, and air temperature and relative humidity at approximate 2.5m. Solar radiation is measured at 3m. This climate station is operated by the Jornada LTER Program. This is an ONGOING dataset.
Resource Title: Website Pointer to html file.
File Name: Web Page, url: https://portal.edirepository.org/nis/mapbrowse?scope=knb-lter-jrn&identifier=210437042
Webpage with information and links to data files for download
1-second summary precipitation data at NPP P-TOBO met station. Total precipitation per second is recorded only if there is measurable precipitation. This is recorded at an automated meteorological station installed at Jornada LTER NPP P-TOBO site.. This climate station is operated by the Jornada LTER Program. IMPORTANT: Rainfall is only recorded when a bucket tip occurs on the tipping bucket rain gauge. If there is missing data due to equipment or other problems, there will be no indication of this within this dataset. The user needs to review precipitation values in the 30 minute or hourly summary datasets to determine if there are missing data in this 1 second detailed precipitation dataset. Reference the package i.d.'s knb-lter-jrn.210437027, knb-lter-jrn.210437042, and knb-lter-jrn.210437057 for the NPP P-TOBO met station 30 minute, hourly, and daily summary datasets, respectively. This is an ONGOING dataset.
Resource Title: Website Pointer to html file.
File Name: Web Page, url: https://portal.edirepository.org/nis/mapbrowse?scope=knb-lter-jrn&identifier=210437072
Webpage with information and links to data files for download
30-minute Soil Moisture data at NPP P-TOBO met station. Collection of soil volumetric water content data at Jornada LTER NPP sites, New Mexico, supports the environmental monitoring objectives of the Jornada LTER monitoring program that look at plant-soil water dynamics. Volumetric water content, bulk electrical conductivity, soil temperature, and bulk dielectric permittivity are measured every 30 minutes at an automated meteorological station installed at Jornada LTER NPP P-TOBO site. Measurements are made every 30 minutes at 10 cm, 20 cm, and 30 cm soil depths. This is an ONGOING dataset.
Resource Title: Website Pointer to html file.
File Name: Web Page, url: https://portal.edirepository.org/nis/mapbrowse?scope=knb-lter-jrn&identifier=210437087
Webpage with information and links to data files for download
5-minute summary data at NPP P-TOBO met station. Average air temperature, wind speed and wind direction are measured and calculated based on 1-second scan rate of all sensors located at an automated meteorological station installed at Jornada LTER NPP P-TOBO site. Wind speed is measured at 75 cm, 150 cm, and 300 cm, wind direction at approximately 3m, and air temperature at approximate 2.5m. This climate station is operated by the Jornada LTER Program. This is an ONGOING dataset.
Resource Title: Website Pointer to html file.
File Name: Web Page, url: https://portal.edirepository.org/nis/mapbrowse?scope=knb-lter-jrn&identifier=210437012
Webpage with information and links to data files for download
Daily average of 30-minute Volumetric Water Content at NPP P-TOBO met station. Collection of soil volumetric water content data at Jornada LTER NPP sites, New Mexico, supports the environmental monitoring objectives of the Jornada LTER monitoring program that look at plant-soil water dynamics. Volumetric water content, bulk electrical conductivity, soil temperature, and bulk dielectric permittivity are measured and calculated at an automated meteorological station installed at Jornada LTER NPP P-TOBO site. The daily average at 3 soil depths is calculated from measurements made every 30 minutes at 10 cm, 20 cm, and 30 cm. This is an ONGOING dataset.
Resource Title: Website Pointer to html file.
File Name: Web Page, url: https://portal.edirepository.org/nis/mapbrowse?scope=knb-lter-jrn&identifier=210437102
Webpage with information and links to data files for download
Daily summary data at NPP P-TOBO met station. Average/maximum/minimum air temperature; average/maximum relative humidity and wind speed and average wind direction; solar radiation; albedo. These are measured and calculated based on 1-second scan rate of all sensors located at an automated meteorological station installed at Jornada LTER NPP P-TOBO site. Wind speed is measured at 75 cm, 150 cm, and 300 cm, wind direction at approximately 3m, and air temperature and relative humidity at approximate 2.5m. Solar radiation is measured at 3m. This climate station is operated by the Jornada LTER Program. This is an ONGOING dataset.
Resource Title: Website Pointer to html file.
File Name: Web Page, url: https://portal.edirepository.org/nis/mapbrowse?scope=knb-lter-jrn&identifier=210437057
Webpage with information and links to data files for download
Hourly summary data at NPP T-EAST met station. Average/maximum/minimum air temperature; average relative humidity and wind direction; average/maximum wind speed; solar radiation; albedo. These are measured and calculated based on 1-second scan rate of all sensors located at an automated meteorological station installed at Jornada LTER NPP T-EAST site. Wind speed is measured at 75 cm, 150 cm, and 300 cm, wind direction at approximately 3m, and air temperature and relative humidity at approximate 2.5m. Solar radiation is measured at 3m. This climate station is operated by the Jornada LTER Program. This is an ONGOING dataset.
Resource Title: Website Pointer to html file.
File Name: Web Page, url: https://portal.edirepository.org/nis/mapbrowse?scope=knb-lter-jrn&identifier=210437043
Webpage with information and links to data files for download
1-second summary precipitation data at NPP T-EAST met station. Total precipitation per second is recorded only if there is measurable precipitation. This is recorded at an automated meteorological station installed at Jornada LTER NPP T-EAST site.. This climate station is operated by the Jornada LTER Program. IMPORTANT: Rainfall is only recorded when a bucket tip occurs on the tipping bucket rain gauge. If there is missing data due to equipment or other problems, there will be no indication of this within this dataset. The user needs to review precipitation values in the 30 minute or hourly summary datasets to determine if there are missing data in this 1 second detailed precipitation dataset. Reference the package i.d.'s knb-lter-jrn.210437028, knb-lter-jrn.210437043, and knb-lter-jrn.210437058 for the NPP T-EAST met station 30 minute, hourly, and daily summary datasets, respectively. This is an ONGOING dataset.
Resource Title: Website Pointer to html file.
File Name: Web Page, url: https://portal.edirepository.org/nis/mapbrowse?scope=knb-lter-jrn&identifier=210437073
Webpage with information and links to data files for download
30-minute Soil Moisture data at NPP T-EAST met station. Collection of soil volumetric water content data at Jornada LTER NPP sites, New Mexico, supports the environmental monitoring objectives of the Jornada LTER monitoring program that look at plant-soil water dynamics. Volumetric water content, bulk electrical conductivity, soil temperature, and bulk dielectric permittivity are measured every 30 minutes at an automated meteorological station installed at Jornada LTER NPP T-EAST site. Measurements are made every 30 minutes at 10 cm, 20 cm, and 30 cm soil depths. This is an ONGOING dataset.
Resource Title: Website Pointer to html file.
File Name: Web Page, url: https://portal.edirepository.org/nis/mapbrowse?scope=knb-lter-jrn&identifier=210437088
Webpage with information and links to data files for download
30-minute summary data at NPP P-TOBO met station. Average air temperature, relative humidity, wind speed, wind direction, and solar radiation are measured and calculated based on 1-second scan rate of all sensors located at an automated meteorological station installed at Jornada LTER NPP P-TOBO site. Wind speed is measured at 75 cm, 150 cm, and 300 cm, wind direction at approximately 3m, and air temperature and relative humidity at approximate 2.5m. Solar radiation is measured at 3m. This climate station is operated by the Jornada LTER Program. This is an ONGOING dataset.
Resource Title: Website Pointer to html file.
File Name: Web Page, url: https://portal.edirepository.org/nis/mapbrowse?scope=knb-lter-jrn&identifier=210437027
Webpage with information and links to data files for download
30-minute summary data at NPP T-EAST met station. Average air temperature, relative humidity, wind speed, wind direction, and solar radiation are measured and calculated based on 1-second scan rate of all sensors located at an automated meteorological station installed at Jornada LTER NPP T-EAST site. Wind speed is measured at 75 cm, 150 cm, and 300 cm, wind direction at approximately 3m, and air temperature and relative humidity at approximate 2.5m. Solar radiation is measured at 3m. This climate station is operated by the Jornada LTER Program. This is an ONGOING dataset.
Resource Title: Website Pointer to html file.
File Name: Web Page, url: https://portal.edirepository.org/nis/mapbrowse?scope=knb-lter-jrn&identifier=210437028
Webpage with information and links to data files for download
5-minute summary data at NPP T-EAST met station. Average air temperature, wind speed and wind direction are measured and calculated based on 1-second scan rate of all sensors located at an automated meteorological station installed at Jornada LTER NPP T-EAST site. Wind speed is measured at 75 cm, 150 cm, and 300 cm, wind direction at approximately 3m, and air temperature at approximate 2.5m. This climate station is operated by the Jornada LTER Program. This is an ONGOING dataset.
Resource Title: Website Pointer to html file.
File Name: Web Page, url: https://portal.edirepository.org/nis/mapbrowse?scope=knb-lter-jrn&identifier=210437013
Webpage with information and links to data files for download
Daily average of 30-minute Volumetric Water Content at NPP T-EAST met station. Collection of soil volumetric water content data at Jornada LTER NPP sites, New Mexico, supports the environmental monitoring objectives of the Jornada LTER monitoring program that look at plant-soil water dynamics. Volumetric water content, bulk electrical conductivity, soil temperature, and bulk dielectric permittivity are measured and calculated at an automated meteorological station installed at Jornada LTER NPP T-EAST site. The daily average at 3 soil depths is calculated from measurements made every 30 minutes at 10 cm, 20 cm, and 30 cm. This is an ONGOING dataset.
Resource Title: Website Pointer to html file.
File Name: Web Page, url: https://portal.edirepository.org/nis/mapbrowse?scope=knb-lter-jrn&identifier=210437103
Webpage with information and links to data files for download
Daily summary data at NPP T-EAST met station. Average/maximum/minimum air temperature; average/maximum relative humidity and wind speed and average wind direction; solar radiation; albedo. These are measured and calculated based on 1-second scan rate of all sensors located at an automated meteorological station installed at Jornada LTER NPP T-EAST site. Wind speed is measured at 75 cm, 150 cm, and 300 cm, wind direction at approximately 3m, and air temperature and relative humidity at approximate 2.5m. Solar radiation is measured at 3m. This climate station is operated by the Jornada LTER Program. This is an ONGOING dataset.
Resource Title: Website Pointer to html file.
File Name: Web Page, url: https://portal.edirepository.org/nis/mapbrowse?scope=knb-lter-jrn&identifier=210437058
Webpage with information and links to data files for download
Hourly summary data at NPP T-TAYL met station. Average/maximum/minimum air temperature; average relative humidity and wind direction; average/maximum wind speed. These are measured and calculated based on 1-second scan rate of all sensors located at an automated meteorological station installed at Jornada LTER NPP T-TAYL site. Wind speed is measured at 75 cm, 150 cm, and 300 cm, wind direction at approximately 3m, and air temperature and relative humidity at approximate 2.5m. This climate station is operated by the Jornada LTER Program. This is an ONGOING dataset.
Resource Title: Website Pointer to html file.
File Name: Web Page, url: https://portal.edirepository.org/nis/mapbrowse?scope=knb-lter-jrn&identifier=210437044
Webpage with information and links to data files for download
1-second summary precipitation data at NPP T-TAYL met station. Total precipitation per second is recorded only if there is measurable precipitation. This is recorded at an automated meteorological station installed at Jornada LTER NPP T-TAYL site.. This climate station is operated by the Jornada LTER Program. IMPORTANT: Rainfall is only recorded when a bucket tip occurs on the tipping bucket rain gauge. If there is missing data due to equipment or other problems, there will be no indication of this within this dataset. The user needs to review precipitation values in the 30 minute or hourly summary datasets to determine if there are missing data in this 1 second detailed precipitation dataset. Reference the package i.d.'s knb-lter-jrn.210437029, knb-lter-jrn.210437044, and knb-lter-jrn.210437059 for the NPP T-TAYL met station 30 minute, hourly, and daily summary datasets, respectively. This is an ONGOING dataset.
Resource Title: Website Pointer to html file.
File Name: Web Page, url: https://portal.edirepository.org/nis/mapbrowse?scope=knb-lter-jrn&identifier=210437074
Webpage with information and links to data files for download
30-minute Soil Moisture data at NPP T-TAYL met station. Collection of soil volumetric water content data at Jornada LTER NPP sites, New Mexico, supports the environmental monitoring objectives of the Jornada LTER monitoring program that look at plant-soil water dynamics. Volumetric water content, bulk electrical conductivity, soil temperature, and bulk dielectric permittivity are measured every 30 minutes at an automated meteorological station installed at Jornada LTER NPP T-TAYL site. Measurements are made every 30 minutes at 10 cm, 20 cm, and 30 cm soil depths. This is an ONGOING dataset.
Resource Title: Website Pointer to html file.
File Name: Web Page, url: https://portal.edirepository.org/nis/mapbrowse?scope=knb-lter-jrn&identifier=210437089
Webpage with information and links to data files for download
30-minute summary data at NPP T-TAYL met station. Average air temperature, relative humidity, wind speed and wind direction are measured and calculated based on 1-second scan rate of all sensors located at an automated meteorological station installed at Jornada LTER NPP T-TAYL site. Wind speed is measured at 75 cm, 150 cm, and 300 cm, wind direction at approximately 3m, and air temperature and relative humidity at approximate 2.5m. This climate station is operated by the Jornada LTER Program. This is an ONGOING dataset.
Resource Title: Website Pointer to html file.
File Name: Web Page, url: https://portal.edirepository.org/nis/mapbrowse?scope=knb-lter-jrn&identifier=210437029
Webpage with information and links to data files for download
5-minute summary data at NPP T-TAYL met station. Average air temperature, wind speed and wind direction are measured and calculated based on 1-second scan rate of all sensors located at an automated meteorological station installed at Jornada LTER NPP T-TAYL site. Wind speed is measured at 75 cm, 150 cm, and 300 cm, wind direction at approximately 3m, and air temperature at approximate 2.5m. This climate station is operated by the Jornada LTER Program. This is an ONGOING dataset.
Resource Title: Website Pointer to html file.
File Name: Web Page, url: https://portal.edirepository.org/nis/mapbrowse?scope=knb-lter-jrn&identifier=210437014
Webpage with information and links to data files for download
Daily average of 30-minute Volumetric Water Content at NPP T-TAYL met station. Collection of soil volumetric water content data at Jornada LTER NPP sites, New Mexico, supports the environmental monitoring objectives of the Jornada LTER monitoring program that look at plant-soil water dynamics. Volumetric water content, bulk electrical conductivity, soil temperature, and bulk dielectric permittivity are measured and calculated at an automated meteorological station installed at Jornada LTER NPP T-TAYL site. The daily average at 3 soil depths is calculated from measurements made every 30 minutes at 10 cm, 20 cm, and 30 cm. This is an ONGOING dataset.
Resource Title: Website Pointer to html file.
File Name: Web Page, url: https://portal.edirepository.org/nis/mapbrowse?scope=knb-lter-jrn&identifier=210437104
Webpage with information and links to data files for download
Daily summary data at NPP T-TAYL met station. Average/maximum/minimum air temperature; average/maximum relative humidity and wind speed and average wind direction. These are measured and calculated based on 1-second scan rate of all sensors located at an automated meteorological station installed at Jornada LTER NPP T-TAYL site. Wind speed is measured at 75 cm, 150 cm, and 300 cm, wind direction at approximately 3m, and air temperature and relative humidity at approximate 2.5m. This climate station is operated by the Jornada LTER Program. This is an ONGOING dataset.
Resource Title: Website Pointer to html file.
File Name: Web Page, url: https://portal.edirepository.org/nis/mapbrowse?scope=knb-lter-jrn&identifier=210437059
Webpage with information and links to data files for download
Hourly summary data at NPP T-WEST met station. Average/maximum/minimum air temperature; average relative humidity and wind direction; average/maximum wind speed. These are measured and calculated based on 1-second scan rate of all sensors located at an automated meteorological station installed at Jornada LTER NPP T-WEST site. Wind speed is measured at 75 cm, 150 cm, and 300 cm, wind direction at approximately 3m, and air temperature and relative humidity at approximate 2.5m. This climate station is operated by the Jornada LTER Program. This is an ONGOING dataset.
Resource Title: Website Pointer to html file.
File Name: Web Page, url: https://portal.edirepository.org/nis/mapbrowse?scope=knb-lter-jrn&identifier=210437045
Webpage with information and links to data files for download
1-second summary precipitation data at NPP T-WEST met station. Total precipitation per second is recorded only if there is measurable precipitation. This is recorded at an automated meteorological station installed at Jornada LTER NPP T-WEST site.. This climate station is operated by the Jornada LTER Program. IMPORTANT: Rainfall is only recorded when a bucket tip occurs on the tipping bucket rain gauge. If there is missing data due to equipment or other problems, there will be no indication of this within this dataset. The user needs to review precipitation values in the 30 minute or hourly summary datasets to determine if there are missing data in this 1 second detailed precipitation dataset. Reference the package i.d.'s knb-lter-jrn.210437030, knb-lter-jrn.210437045, and knb-lter-jrn.210437060 for the NPP T-WEST met station 30 minute, hourly, and daily summary datasets, respectively. This is an ONGOING dataset.
Resource Title: Website Pointer to html file.
File Name: Web Page, url: https://portal.edirepository.org/nis/mapbrowse?scope=knb-lter-jrn&identifier=210437075
Webpage with information and links to data files for download
30-minute Soil Moisture data at NPP T-WEST met station. Collection of soil volumetric water content data at Jornada LTER NPP sites, New Mexico, supports the environmental monitoring objectives of the Jornada LTER monitoring program that look at plant-soil water dynamics. Volumetric water content, bulk electrical conductivity, soil temperature, and bulk dielectric permittivity are measured every 30 minutes at an automated meteorological station installed at Jornada LTER NPP T-WEST site. Measurements are made every 30 minutes at 10 cm, 20 cm, and 30 cm soil depths. This is an ONGOING dataset.
Resource Title: Website Pointer to html file.
File Name: Web Page, url: https://portal.edirepository.org/nis/mapbrowse?scope=knb-lter-jrn&identifier=210437090
Webpage with information and links to data files for download
30-minute summary data at NPP T-WEST met station. Average air temperature, relative humidity, wind speed and wind direction are measured and calculated based on 1-second scan rate of all sensors located at an automated meteorological station installed at Jornada LTER NPP T-WEST site. Wind speed is measured at 75 cm, 150 cm, and 300 cm, wind direction at approximately 3m, and air temperature and relative humidity at approximate 2.5m. This climate station is operated by the Jornada LTER Program. This is an ONGOING dataset.
Resource Title: Website Pointer to html file.
File Name: Web Page, url: https://portal.edirepository.org/nis/mapbrowse?scope=knb-lter-jrn&identifier=210437030
Webpage with information and links to data files for download
5-minute summary data at NPP T-WEST met station. Average air temperature, wind speed and wind direction are measured and calculated based on 1-second scan rate of all sensors located at an automated meteorological station installed at Jornada LTER NPP T-TAYL site. Wind speed is measured at 75 cm, 150 cm, and 300 cm, wind direction at T-WEST 3m, and air temperature at approximate 2.5m. This climate station is operated by the Jornada LTER Program. This is an ONGOING dataset.
Resource Title: Website Pointer to html file.
File Name: Web Page, url: https://portal.edirepository.org/nis/mapbrowse?scope=knb-lter-jrn&identifier=210437015
Webpage with information and links to data files for download
Daily average of 30-minute Volumetric Water Content at NPP T-WEST met station. Collection of soil volumetric water content data at Jornada LTER NPP sites, New Mexico, supports the environmental monitoring objectives of the Jornada LTER monitoring program that look at plant-soil water dynamics. Volumetric water content, bulk electrical conductivity, soil temperature, and bulk dielectric permittivity are measured and calculated at an automated meteorological station installed at Jornada LTER NPP T-WEST site. The daily average at 3 soil depths is calculated from measurements made every 30 minutes at 10 cm, 20 cm, and 30 cm. This is an ONGOING dataset.
Resource Title: Website Pointer to html file.
File Name: Web Page, url: https://portal.edirepository.org/nis/mapbrowse?scope=knb-lter-jrn&identifier=210437105
Webpage with information and links to data files for download
Daily summary data at NPP T-WEST met station. Average/maximum/minimum air temperature; average/maximum relative humidity and wind speed and average wind direction. These are measured and calculated based on 1-second scan rate of all sensors located at an automated meteorological station installed at Jornada LTER NPP T-WEST site. Wind speed is measured at 75 cm, 150 cm, and 300 cm, wind direction at approximately 3m, and air temperature and relative humidity at approximate 2.5m. This climate station is operated by the Jornada LTER Program. This is an ONGOING dataset.
Resource Title: Website Pointer to html file.
File Name: Web Page, url: https://portal.edirepository.org/nis/mapbrowse?scope=knb-lter-jrn&identifier=210437060
Webpage with information and links to data files for download
30-minute Soil Moisture data is measured at 10cm, 20 cm, and 30 cm soil depths at the NPP T-WEST substation located in center of 70m x 70m Jornada LTER NPP T-WEST site. Collection of soil volumetric water content data at Jornada LTER NPP sites, New Mexico, supports the environmental monitoring objectives of the Jornada LTER monitoring program that look at plant-soil water dynamics. Volumetric water content, bulk electrical conductivity, soil temperature, and bulk dielectric permittivity are measured every 30 minutes. This is an ONGOING dataset.
Resource Title: Website Pointer to html file.
File Name: Web Page, url: https://portal.edirepository.org/nis/mapbrowse?scope=knb-lter-jrn&identifier=210437107
Webpage with information and links to data files for download
30-minute Soil Moisture data is measured at 10cm, 20 cm, and 30 cm soil depths at the NPP C-GRAV substation located in center of 70m x 70m Jornada LTER NPP C-GRAV site. Collection of soil volumetric water content data at Jornada LTER NPP sites, New Mexico, supports the environmental monitoring objectives of the Jornada LTER monitoring program that look at plant-soil water dynamics. Volumetric water content, bulk electrical conductivity, soil temperature, and bulk dielectric permittivity are measured every 30 minutes. This is an ONGOING dataset.
Resource Title: Website Pointer to html file.
File Name: Web Page, url: https://portal.edirepository.org/nis/mapbrowse?scope=knb-lter-jrn&identifier=210437108
Webpage with information and links to data files for download
30-minute Soil Moisture data is measured at 10cm, 20 cm, and 30 cm soil depths at the NPP C-SAND substation located in center of 70m x 70m Jornada LTER NPP C-SAND site. Collection of soil volumetric water content data at Jornada LTER NPP sites, New Mexico, supports the environmental monitoring objectives of the Jornada LTER monitoring program that look at plant-soil water dynamics. Volumetric water content, bulk electrical conductivity, soil temperature, and bulk dielectric permittivity are measured every 30 minutes. This is an ONGOING dataset.
Resource Title: Website Pointer to html file.
File Name: Web Page, url: https://portal.edirepository.org/nis/mapbrowse?scope=knb-lter-jrn&identifier=210437109
Webpage with information and links to data files for download
30-minute Soil Moisture data is measured at 10cm, 20 cm, and 30 cm soil depths at the NPP G-BASN substation located in center of 70m x 70m Jornada LTER NPP G-BASN site. Collection of soil volumetric water content data at Jornada LTER NPP sites, New Mexico, supports the environmental monitoring objectives of the Jornada LTER monitoring program that look at plant-soil water dynamics. Volumetric water content, bulk electrical conductivity, soil temperature, and bulk dielectric permittivity are measured every 30 minutes. This is an ONGOING dataset.
Resource Title: Website Pointer to html file.
File Name: Web Page, url: https://portal.edirepository.org/nis/mapbrowse?scope=knb-lter-jrn&identifier=210437110
Webpage with information and links to data files for download
30-minute Soil Moisture data is measured at 10cm, 20 cm, and 30 cm soil depths at the NPP G-IBPE substation located in center of 70m x 70m Jornada LTER NPP G-IBPE site. Collection of soil volumetric water content data at Jornada LTER NPP sites, New Mexico, supports the environmental monitoring objectives of the Jornada LTER monitoring program that look at plant-soil water dynamics. Volumetric water content, bulk electrical conductivity, soil temperature, and bulk dielectric permittivity are measured every 30 minutes. This is an ONGOING dataset.
Resource Title: Website Pointer to html file.
File Name: Web Page, url: https://portal.edirepository.org/nis/mapbrowse?scope=knb-lter-jrn&identifier=210437111
Webpage with information and links to data files for download
30-minute Soil Moisture data is measured at 10cm, 20 cm, and 30 cm soil depths at the NPP G-SUMM substation located in center of 70m x 70m Jornada LTER NPP G-SUMM site. Collection of soil volumetric water content data at Jornada LTER NPP sites, New Mexico, supports the environmental monitoring objectives of the Jornada LTER monitoring program that look at plant-soil water dynamics. Volumetric water content, bulk electrical conductivity, soil temperature, and bulk dielectric permittivity are measured every 30 minutes. This is an ONGOING dataset.
Resource Title: Website Pointer to html file.
File Name: Web Page, url: https://portal.edirepository.org/nis/mapbrowse?scope=knb-lter-jrn&identifier=210437112
Webpage with information and links to data files for download
30-minute Soil Moisture data is measured at 10cm, 20 cm, and 30 cm soil depths at the NPP M-NORT substation located in center of 70m x 70m Jornada LTER NPP M-NORT site. Collection of soil volumetric water content data at Jornada LTER NPP sites, New Mexico, supports the environmental monitoring objectives of the Jornada LTER monitoring program that look at plant-soil water dynamics. Volumetric water content, bulk electrical conductivity, soil temperature, and bulk dielectric permittivity are measured every 30 minutes. This is an ONGOING dataset.
Resource Title: Website Pointer to html file.
File Name: Web Page, url: https://portal.edirepository.org/nis/mapbrowse?scope=knb-lter-jrn&identifier=210437113
Webpage with information and links to data files for download
30-minute Soil Moisture data is measured at 10cm, 20 cm, and 30 cm soil depths at the NPP M-RABB substation located in center of 70m x 70m Jornada LTER NPP M-RABB site. Collection of soil volumetric water content data at Jornada LTER NPP sites, New Mexico, supports the environmental monitoring objectives of the Jornada LTER monitoring program that look at plant-soil water dynamics. Volumetric water content, bulk electrical conductivity, soil temperature, and bulk dielectric permittivity are measured every 30 minutes. This is an ONGOING dataset.
Resource Title: Website Pointer to html file.
File Name: Web Page, url: https://portal.edirepository.org/nis/mapbrowse?scope=knb-lter-jrn&identifier=210437114
Webpage with information and links to data files for download
30-minute Soil Moisture data is measured at 10cm, 20 cm, and 30 cm soil depths at the NPP M-WELL substation located in center of 70m x 70m Jornada LTER NPP M-WELL site. Collection of soil volumetric water content data at Jornada LTER NPP sites, New Mexico, supports the environmental monitoring objectives of the Jornada LTER monitoring program that look at plant-soil water dynamics. Volumetric water content, bulk electrical conductivity, soil temperature, and bulk dielectric permittivity are measured every 30 minutes. This is an ONGOING dataset.
Resource Title: Website Pointer to html file.
File Name: Web Page, url: https://portal.edirepository.org/nis/mapbrowse?scope=knb-lter-jrn&identifier=210437115
Webpage with information and links to data files for download
30-minute Soil Moisture data is measured at 10cm, 20 cm, and 30 cm soil depths at the NPP P-SMAL substation located in center of 70m x 70m Jornada LTER NPP P-SMAL site. Collection of soil volumetric water content data at Jornada LTER NPP sites, New Mexico, supports the environmental monitoring objectives of the Jornada LTER monitoring program that look at plant-soil water dynamics. Volumetric water content, bulk electrical conductivity, soil temperature, and bulk dielectric permittivity are measured every 30 minutes. This is an ONGOING dataset.
Resource Title: Website Pointer to html file.
File Name: Web Page, url: https://portal.edirepository.org/nis/mapbrowse?scope=knb-lter-jrn&identifier=210437116
Webpage with information and links to data files for download
30-minute Soil Moisture data is measured at 10cm, 20 cm, and 30 cm soil depths at the NPP P-TOBO substation located in center of 70m x 70m Jornada LTER NPP P-TOBO site. Collection of soil volumetric water content data at Jornada LTER NPP sites, New Mexico, supports the environmental monitoring objectives of the Jornada LTER monitoring program that look at plant-soil water dynamics. Volumetric water content, bulk electrical conductivity, soil temperature, and bulk dielectric permittivity are measured every 30 minutes. This is an ONGOING dataset.
Resource Title: Website Pointer to html file.
File Name: Web Page, url: https://portal.edirepository.org/nis/mapbrowse?scope=knb-lter-jrn&identifier=210437117
Webpage with information and links to data files for download
30-minute Soil Moisture data is measured at 10cm, 20 cm, and 30 cm soil depths at the NPP T-EAST substation located in center of 70m x 70m Jornada LTER NPP T-EAST site. Collection of soil volumetric water content data at Jornada LTER NPP sites, New Mexico, supports the environmental monitoring objectives of the Jornada LTER monitoring program that look at plant-soil water dynamics. Volumetric water content, bulk electrical conductivity, soil temperature, and bulk dielectric permittivity are measured every 30 minutes. This is an ONGOING dataset.
Resource Title: Website Pointer to html file.
File Name: Web Page, url: https://portal.edirepository.org/nis/mapbrowse?scope=knb-lter-jrn&identifier=210437118
Webpage with information and links to data files for download
30-minute Soil Moisture data is measured at 10cm, 20 cm, and 30 cm soil depths at the NPP T-TAYL substation located in center of 70m x 70m Jornada LTER NPP T-TAYL site. Collection of soil volumetric water content data at Jornada LTER NPP sites, New Mexico, supports the environmental monitoring objectives of the Jornada LTER monitoring program that look at plant-soil water dynamics. Volumetric water content, bulk electrical conductivity, soil temperature, and bulk dielectric permittivity are measured every 30 minutes. This is an ONGOING dataset.
Resource Title: Website Pointer to html file.
File Name: Web Page, url: https://portal.edirepository.org/nis/mapbrowse?scope=knb-lter-jrn&identifier=210437119
Webpage with information and links to data files for download
30-minute Soil Moisture data is measured at 10cm, 20 cm, and 30 cm soil depths at the NPP T-WEST substation located in center of 70m x 70m Jornada LTER NPP T-WEST site. Collection of soil volumetric water content data at Jornada LTER NPP sites, New Mexico, supports the environmental monitoring objectives of the Jornada LTER monitoring program that look at plant-soil water dynamics. Volumetric water content, bulk electrical conductivity, soil temperature, and bulk dielectric permittivity are measured every 30 minutes. This is an ONGOING dataset.
Resource Title: Website Pointer to html file.
File Name: Web Page, url: https://portal.edirepository.org/nis/mapbrowse?scope=knb-lter-jrn&identifier=210437120
Webpage with information and links to data files for download
This data package contains data on stocking rates for cattle, horses, and sheep on all pastures of the USDA-ARS Jornada Experimental Range beginning in 1916. Grazing goats were infrequent and are therefore included as part of the sheep category. Stocking rates are expressed in animal unit month (AUM), which is based on metabolic weight and average amount of forage needed by each animal unit per month. Total AUM is calculated for each year for each animal unit. This study was completed in 2001 and will not be updated.NOTE: The USDA-ARS discontinued regular updates to this dataset after 2002 because of de-stocking.
Resource Title: Website Pointer to html file.
File Name: Web Page, url: https://portal.edirepository.org/nis/mapbrowse?scope=knb-lter-jrn&identifier=210412001
Webpage with information and links to data files for download
The kinematic runoff and erosion model KINEROS is an event oriented, physically based model describing the processes of interception, infiltration, surface runoff and erosion from small agricultural and urban watersheds. The watershed is represented by a cascade of planes and channels; the partial differential equations describing overland flow, channel flow, erosion and sediment transport are solved by finite difference techniques. The spatial variation of rainfall, infiltration, runoff, and erosion parameters can be accomodated. KINEROS may be used to determine the effects of various artificial features such as urban developments, small detention reservoirs, or lined channels on flood hydrographs and sediment yield.
Resource Title: KINEROS2.
File Name: Web Page, url: https://www.tucson.ars.ag.gov/kineros/
Main web site, including links to documentation and downloads for the model.
Dataset describes Kentucky bluegrass production and height throughout two growing seasons in a rangeland system in the northern Great Plains. One year of sampling was during a drought year and one year had average precipitation. 2017 was a drought year and 2018 was an average precipitation year. Dataset also includes the nutritive value of Kentucky bluegrass throughout the season. Dataset can be used for modeling or for grazing planning. Some plots were mowed before the growing season to simulate early defoliation.
\nSampling occurred at the USDA Northern Great Plains Research Laboratory near Mandan, ND (46.7673 N, 100.9184 W) The 6-hectare pasture is at an altitude of 502 m above sea level and is within the temperate steppe ecoregion of the United States. This region is characterized by long, cold winters and short, hot summers. Predominant soil types include Temvik-Wilton silt loams (fine-silty, mixed, superactive, frigid Typic and Pachic Haplustolls). The pasture is on a loamy ecological site (site ID 054XY030ND) and is managed as a native grassland with no fertilization or irrigation. The average soil texture is a clay loam (31% clay, 49% silt, and 20% sand). Average soil chemical characteristics were: pH (H2O) = 6.4; OM = 7.4% LOI; Na (ppm) = 8.25; K (ppm) = 362.4; Ca (ppm) = 1925.4; Mg (mmolc/dm3) = 417.6; CEC (me/100 g) = 17.5; S (ppm) = 8.3; Cu (ppm) = 0.74; Fe (ppm) = 33.7; Mn (ppm) = 18.5; and Zn (ppm) = 9.7.
\nData can be used for planning of animal grazing or for modeling grazing systems in the northern Great Plains of the USA.
", "title": "Kentucky bluegrass growth curves and nutritive values", "distribution": [ { "@type": "dcat:Distribution", "downloadURL": "https://doi.org/10.17632/khksjzsbjm.2", "mediaType": "text/html", "title": "https://doi.org/10.17632/khksjzsbjm.2" } ], "license": "https://www.usa.gov/publicdomain/label/1.0/", "bureauCode": [ "005:18" ], "modified": "2024-02-16", "publisher": { "@type": "org:Organization", "name": "Agricultural Research Service" }, "accrualPeriodicity": "irregular", "keyword": [ "Kentucky bluegrass", "grass productivity", "nutritive value", "growth curve", "poa pratensis", "NP216", "data.gov", "ARS" ], "spatial": "{\"type\": \"Polygon\", \"coordinates\": [[[-100.91996467905, 46.763822142185], [-100.91996467905, 46.771081596613], [-100.91206579353, 46.771081596613], [-100.91206579353, 46.763822142185], [-100.91996467905, 46.763822142185]]]}" }, { "identifier": "10.15482/USDA.ADC/1408781", "accessLevel": "public", "contactPoint": { "hasEmail": "mailto:Pamela.Pehrsson@ARS.USDA.GOV", "fn": "Pehrsson, Pamela" }, "programCode": [ "005:040" ], "description": "The Nutrient Data Laboratory is responsible for developing authoritative nutrient databases that contain a wide range of food composition values of the nation's food supply. This requires updating and revising the USDA Nutrient Database for Standard Reference (SR) and developing various special interest databases. However, with over 7,000 food items in SR and a complete nutrient profile costing approximately $2,000 for one sample, analyzing every food item for every nutrient and meeting all user requirements is impossible. Consequently, priorities must be determined. Procedures using food consumption data and nutrient values for developing the Key Foods list are explained. Key Foods have been identified as those food items that contribute up to 75% of any one nutrient to the dietary intake of the US population. These Key Foods will be used to set priorities for nutrient analyses under the National Food and Nutrient Analysis Program. The tables describe key foods based on Continuing Survey Of Food Intakes By Individuals (CSFII, 1989-) and WWEIA-NHANES (What We Eat In America - National Health and Nutrition Examination Survey 2001-) survey data.
Resource Title: List of Key Foods based on CSFII 1989-91.
File Name: KeyFoods_key_ls91.txt
Resource Description: Key Foods based on CSFII 1989-91
\nhttps://www.ars.usda.gov/ARSUserFiles/80400525/Data/KeyFoods/key_ls91.txt
Resource Title: List of Key Foods based on CSFII 1994-96 .
File Name: KeyFoods_key_ls9496.txt
Resource Description: List of Key Foods based on CSFII 1994-96
\nhttps://www.ars.usda.gov/ARSUserFiles/80400525/Data/KeyFoods/key_ls9496.txt
Resource Title: List of Key Foods based on WWEIA-NHANES 2001-02.
File Name: KeyFoods_key_ls0102.txt
Resource Description: List of Key Foods based on WWEIA-NHANES 2001-02
\nhttps://www.ars.usda.gov/ARSUserFiles/80400525/Data/KeyFoods/key_ls0102.txt
Resource Title: List of Key Foods based on WWEIA-NHANES 2003-04 .
File Name: KeyFoods_key_ls0304.txt
Resource Description: https://www.ars.usda.gov/ARSUserFiles/80400525/Data/KeyFoods/key_ls0304.txt
Resource Title: List of Key Foods based on WWEIA-NHANES 2007-08.
File Name: Keyfoods_0708.xlsx
Resource Description: List of Key Foods based on WWEIA-NHANES 2007-08
\nhttps://www.ars.usda.gov/ARSUserFiles/80400525/Data/KeyFoods/Keyfoods_0708.xlsx
Resource Title: List of Key Foods based on WWEIA-NHANES 2009-10.
File Name: Keyfoods_0910.xlsx
Resource Description: List of Key Foods based on WWEIA-NHANES 2009-10
\nhttps://www.ars.usda.gov/ARSUserFiles/80400525/Data/KeyFoods/Keyfoods_0910.xlsx
Resource Title: List of Key Foodsbased on WWEIA-NHANES 2011-12.
File Name: Keyfoods_1112.xlsx
Resource Description: List of Key Foodsbased on WWEIA-NHANES 2011-12
\nhttps://www.ars.usda.gov/ARSUserFiles/80400525/Data/KeyFoods/Keyfoods_1112.xlsx
This excel workbook is a compilation of the major metadata schemas for life cycle assessment.
Resource Title: LCADomain_MetadataSchema_Inventory_v1_0_2.
File Name: LCADomain_MetadataSchema_Inventory_v1_0_2.xlsm
USDA-ARS Northwest Sustainable Agroecosystems Research (NSAR) and Washington State University (WSU) established a long-term meteorological and eddy covariance tower in 2017.
Resource Title: GeoData catalog record.
File Name: Web Page, url: https://geodata.nal.usda.gov/geonetwork/srv/eng/catalog.search#/metadata/ba0fb201-dd3f-439b-be57-25b090730dc7
\n
The Southwest Watershed Research Center (SWRC) operates the Walnut Gulch Experimental Watershed (WGEW) in southeastern Arizona as an outdoor laboratory for studying semiarid rangeland hydrologic, ecosystem, climate, and erosion processes.
Resource Title: GeoData catalog record.
File Name: Web Page, url: https://geodata.nal.usda.gov/geonetwork/srv/eng/catalog.search#/metadata/2f6d09cc-4097-494a-b57a-19bc9ecfba66
Near-real time weather records collected at the Wyoming Big sagebrush meteorological site of the Great Basin LTAR. The station data is composited from a meteorological station and a nearby Eddy Covariance station. This site is also the primary meteorological station for the Nancy Gulch sub-watershed of the Reynolds Creek Experimental Watershed and the Wyoming Big sagebrush vegetation zone of the Reynolds Creek Critical Zone Observatory. The site includes precipitation, incoming solar radiation, air temperature, relative humidity, wind speed and direction, snow depth, soil moisture, soil temperature. The records have had preliminary quality assurance filters applied and are considered raw field measurements.
Resource Title: GeoData catalog record.
File Name: Web Page, url: https://geodata.nal.usda.gov/geonetwork/srv/eng/catalog.search#/metadata/044dff2b-7c03-4980-b4fe-7286b3217adb
\n
A Year-round stationary camera from a fixed position overlooking sagebrush rangeland dominated by Wyoming Big sagebrush (Artemisia tridentata ssp. Wyomingensis). Color and infrared images are taken every 30 minutes between 10 am and 2 pm Mountain Standard Time. The camera points north and incorporates a view of the Nancy Gulch watershed weir house and meteorology station. The camera is part of the instrumentation suite for the LTAR \"common experiment\" comparing agricultural and environmental results from \"business as usual\" and \"aspirational best practices.\"
Resource Title: GeoData catalog record.
File Name: Web Page, url: https://geodata.nal.usda.gov/geonetwork/srv/eng/catalog.search#/metadata/1ea5610e-e4f1-4c67-b218-496f691ebab1
Phenocam images overlooking row crop field.
Resource Title: GeoData catalog record.
File Name: Web Page, url: https://geodata.nal.usda.gov/geonetwork/srv/eng/catalog.search#/metadata/59bdc8a9-0fe6-43d5-8d18-f445e819c9bf
Phenocam images overlooking miscanthus field.
Resource Title: GeoData catalog record.
File Name: Web Page, url: https://geodata.nal.usda.gov/geonetwork/srv/eng/catalog.search#/metadata/ced278ad-baf3-4546-ad7b-4a623cc831d3
Surface agronomic P budgets for 61 cropping systems using field-scale P flux data across 24 research sites in the United States and Canada. Data are representative of P inputs and outputs associated with the production of each crop in a respective rotation year, ranging from 1 to 10 rotation years. This dataset provides a comparison of field-scale soil surface P fluxes and phosphorus budgets across sites and cropping systems.
Resource Title: LTAR Phosphorus Budget Summary Data Sources and References.
File Name: DataSourcesAndReferences.csv
Resource Description: This file includes data sources and references relevant to calculated P budgets. Affiliated numerical data can be found in the LTAR Phosphorus Budget Summary Data file.
Resource Title: LTAR Phosphorus Budget Summary Data.
File Name: PBudgetData.csv
Resource Description: Agronomic annual and system data for calculated P budgets for cropping systems throughout the United States and Canada.
The PhenoCam network is collecting color and near infrared images year-round using cameras in fixed positions on agricultural lands including a site located on the Swan Lake Research Farm. The network effort was initiated in 2015 at this long-term, plot-scale research site. The camera at the research farm on focused a plot-scale, replicated research study that was established in 1997 to assess the long-term impacts of various tillage management options on soil organic carbon. Initially the study included eight tillage treatments: no-tillage, moldboard + disk tillage, chisel tillage, and fall and spring residue management, with or without strip-tillage and strip-tillage + sub-soiling. In 2004, the number of treatments were reduced to no-tillage, moldboard tillage, and fall and spring residue management without strip-tillage. All tillage treatments also had an early or late planting date. In 2008, the strip-tillage plots were modified to explore alternative strategies for supporting cellulosic bioenergy feedstock production, including planting of cellulosic feedstock. The modification included adding perennials grasses into an extended 6-year rotation, winter cereal rye cover crops in a corn-soybean rotation, and an alternative Sorghum-Sudan grass hybrid forage system. Detailed soil and crop properties data have been collected from this site. This site is designated to be continued as part of the LTAR \"common experiment\" comparing agricultural and environmental results from \"business as usual\" and \"aspirational best practices.
Resource Title: GeoData catalog record.
File Name: Web Page, url: https://geodata.nal.usda.gov/geonetwork/srv/eng/catalog.search#/metadata/da7457b6-633e-4564-8bb0-2b7d5adbe35d
A stationary camera used to track vegetation phenology overlooking a row crop field that is in an aspirational cropping system (corn/soybean rotation with a living much - Kura Clover). This site is located at the Rosemount Research and Outreach Center in Rosemount, Minnesota. Images are taken every 30 minutes.\n\nA link to the Phenocam's network FAQ: https://phenocam.sr.unh.edu/webcam/faq
Resource Title: GeoData catalog record.
File Name: Web Page, url: https://geodata.nal.usda.gov/geonetwork/srv/eng/catalog.search#/metadata/e1ca41fc-9593-4b88-8052-7b0ad206781f
A stationary camera used to track vegetation phenology overlooking a row crop field that is in a conventional cropping system (corn/soybean rotation). This site is located at the Rosemount Research and Outreach Center in Rosemount, Minnesota. Images are taken every 30 minutes.\n\nA link to the Phenocam's network FAQ: https://phenocam.sr.unh.edu/webcam/faq
Resource Title: GeoData catalog record.
File Name: Web Page, url: https://geodata.nal.usda.gov/geonetwork/srv/eng/catalog.search#/metadata/8e42c940-3fa7-4eca-a3e2-81620ff9b995
A stationary camera used to track vegetation phenology overlooking a restored native prairie. This site is located at the Rosemount Research and Outreach Center in Rosemount, Minnesota. Images are taken every 30 minutes.\n\nA link to the Phenocam's network FAQ: https://phenocam.sr.unh.edu/webcam/faq
Resource Title: GeoData catalog record.
File Name: Web Page, url: https://geodata.nal.usda.gov/geonetwork/srv/eng/catalog.search#/metadata/7fe0227e-5eeb-43bb-b2e3-1949c0d59f50
The USDA-ARS Southwest Watershed Research Center (SWRC) operates the Walnut Gulch Experimental Watershed (WGEW) in southeastern Arizona as an outdoor laboratory for studying semiarid rangeland hydrologic, ecosystem, climate, and erosion processes.\n\nSince its establishment in 1953, the SWRC in Tucson, Arizona, has collected, processed, managed, and disseminated high-resolution, spatially distributed hydrologic data in support of the center’s mission. Data management at the SWRC has evolved through time in response to new computing, storage, and data access technologies. In 1996, the SWRC initiated a multiyear project to upgrade rainfall and runoff sensors and convert analog systems to digital electronic systems supported by data loggers. This conversion was coupled with radio telemetry to remotely transmit recorded data to a central computer, thus greatly reducing operational overhead by reducing labor, maintenance, and data processing time. A concurrent effort was initiated to improve access to SWRC data by creating a system based on a relational database supporting access to the data via the Internet. An SWRC team made up of scientists, IT specialists, programmers, hydrologic technicians, and instrumentation specialists was formed. This effort is termed the Southwest Watershed Research Center Data Access Project (DAP).\n\nThe goal of the SWRC DAP is to efficiently disseminate data to researchers; land owners, users, and managers; and to the public. Primary access to the data is provided through a Web-based user interface. In addition, data can be accessed directly from within the SWRC network. The first priority for the DAP was to assimilate and make available rainfall and runoff data collected from two instrumented field sites, the WGEW near Tombstone, Arizona, and the Santa Rita Experimental Range (SRER) south of Tucson, Arizona.\n\nThis web map describes the associated GIS layers.
Resource Title: GeoData catalog record.
File Name: Web Page, url: https://geodata.nal.usda.gov/geonetwork/srv/eng/catalog.search#/metadata/fe4ac74f13484a169899b166159e0bb5
A stationary camera overlooking the Kendall sub-watershed in the Walnut Gulch Experimental Watershed used to track vegetation phenology (RGB and IR imagery). Images are taken every 30 minutes between 4:00am and 10:30pm local standard time. \n\nA link to the Phenocam's network FAQ: https://phenocam.sr.unh.edu/webcam/faq
Resource Title: GeoData catalog record.
File Name: Web Page, url: https://geodata.nal.usda.gov/geonetwork/srv/eng/catalog.search#/metadata/8bab3971-4125-4480-8616-9303f8418378
A stationary camera overlooking the Lucky Hills sub-watershed in the Walnut Gulch Experimental Watershed used to track vegetation phenology (RGB and IR imagery). Images are taken every 30 minutes between 4:00am and 10:30pm local standard time. \n\nA link to the Phenocam's network FAQ: https://phenocam.sr.unh.edu/webcam/faq
Resource Title: GeoData catalog record.
File Name: Web Page, url: https://geodata.nal.usda.gov/geonetwork/srv/eng/catalog.search#/metadata/77d59ee9-6b19-4fe6-9599-ca784c2497a2
The Landscape Data Commons is an inter-agency monitoring data repository and portal, led by the USDA-ARS at the Jornada Experimental Range, that connects standardized monitoring data to analysis tools to support land management and research. The Landscape Data Commons aggregates and harmonizes core methods data collected across agencies and monitoring programs (e.g., Bureau of Land Management Assessment, Inventory and Monitoring Program, the Natural Resources Conservation Service National Resources Inventory Grazing land On-Site program, the National Wind Erosion Research Network, smaller research and monitoring efforts). With these aggregated data, the Landscape Data Commons supports natural-resource management, modeling, and research.
", "title": "Landscape Data Commons", "distribution": [ { "@type": "dcat:Distribution", "downloadURL": "https://landscapedatacommons.org/", "mediaType": "text/html", "title": "https://landscapedatacommons.org/" } ], "license": "https://www.usa.gov/publicdomain/label/1.0/", "bureauCode": [ "005:18" ], "modified": "2023-12-18", "publisher": { "@type": "org:Organization", "name": "Agricultural Research Service" }, "keyword": [ "agricultural monitoring", "core methods", "line-point intercept", "gap intercept", "plant height", "soil stability", "geoscientificinformation", "Agroecosystems & Environment", "canopy", "basal cover", "Aeolian", "dust emission", "wind erosion", "dry deposition", "wet deposition", "dust deposition", "climatologyMeteorologyAtmosphere", "woody plants", "herbaceous", "cover", "composition", "surface stability", "species inventory", "plant species", "NP216", "data.gov", "ARS" ], "spatial": "{\"type\": \"Polygon\", \"coordinates\": [[[-162.77343213558, 12.829658852677], [-162.77343213558, 70.706003477448], [-50.742174983025, 70.706003477448], [-50.742174983025, 12.829658852677], [-162.77343213558, 12.829658852677]]]}" }, { "identifier": "10.6073/pasta/b22a6bdd36f6490f6732b18c2fa1362f", "accessLevel": "public", "contactPoint": { "hasEmail": "mailto:jornada.data@nmsu.edu", "fn": "Data Manager" }, "programCode": [ "005:040" ], "description": "This data package contains leaf litter cover data from plots with various levels of herbivore exclusion on the Jornada Experimental Range. Study sites were established in 1995; one in black grama grassland and the other in creosotebush shrubland to compare the impact of herbivores on ecosystem processes between these vegetation types. Parallel studies were established at the Sevilleta LTER site (New Mexico, USA) and Mapimi Biosphere Reserve (Durango, Mexico). Each study site is 1 km by 0.5 km in area. Four replicate experimental blocks were randomly located at the grassland study site to measure vegetation responses using exclusion treatments including a) all mammalian herbivores, including cattle, lagomorphs, and rodents, b) lagomorphs and cattle only, c) cattle only, and d) control accessible to all herbivores. Because grazing cattle are excluded from the entire creosote site, only three replicate experimental blocks were randomly located there including a) all mammalian herbivores, including lagomorphs, and rodents, b) lagomorphs only, and c) control accessible to all herbivores. Thirty-six sampling points were positioned at 5.8-meter intervals on a systematically located 6 by 6 point grid within each plot. A permanent one-meter by one-meter vegetation measurement quadrat is located at each of the 36 points. Each year in spring and fall from 1995-2005, the total percent cover of leaf litter in each quadrat was estimated by summing the percent of each 10 cm square within a quadrat (including 100 10-cm squares) containing leaf litter (See methods for a detailed explanation). After 2005, sampling frequency changed to every 5 years. This study is ongoing.
Resource Title: Website Pointer to html file.
File Name: Web Page, url: https://portal.edirepository.org/nis/mapbrowse?scope=knb-lter-jrn&identifier=210086004
Webpage with information and links to data files for download
This is an identification key to genera for seeds and fruits of the legume family. The coverage is world wide, and for each genus there are descriptions of the seeds and fruits, distribution data, and images. The interactive software system INTKEY is used for accessing the data and images. The key can be used for identifying to genus unknown legume samples or for querying the data and images for legume genera, and is designed for seed analysts, technicians, port inspectors, weed scientists, ecologists, botanists, and researchers who need to identify isolated legume fruits and seeds. Procedures relating to preparation, collection, and authentication of data are provided in the 'Procedures' resource file. In order to utilize the identification key the entire folder needs to be downloaded and extracted with all internal structure unmodified.
Resource Title: Legume (Fabaceae) Fruits and Seeds Version 2.
File Name: Fabaceae.zip
Resource Description: This electronic database contains the following:
\nResource Title: Accepted legume genera information files.
File Name: info.zip
Resource Description: 685 accepted legume genera with accepted scientific name and author(s) for each genus. No synonyms are given; for synonyms, refer to Polhill and Raven (1981), Gunn et al. (1992), and Mabberley (1997).
\nThis information is also contained in the Legume (Fabaceae) Fruits and Seeds Version 2 database files resource
\nText documents contain scientific name, subfamily, phylogenetic number, tribe, species in genus / species studied, fruit description, seed description, distribution, generic notes, and tribal notes.
\nResource Title: Character and generic images.
File Name: images.zip
Resource Description: 205 character and 1,379 generic images. When adequate materials were available, fruit and seed photographs and/or drawings, testa SEMs at 50 and 1,000 magnifications, and embryo and cotyledon drawings are given. The character images, whenever possible, were prepared from the generic images. For some characters, schematic drawings are presented.
\nThis information is also contained in the Legume (Fabaceae) Fruits and Seeds Version 2 database files resource
\nGIF images
\nResource Title: Procedures - Legume (Fabaceae) Fruits and Seeds v2.
File Name: procs.rtf
Resource Description: Procedures relating to preparation, collection, and authentication of data
\nResource Title: Version History - Legume (Fabaceae) Fruits and Seeds.
File Name: verhist.rtf
Resource Description: This information is also contained in the Legume (Fabaceae) Fruits and Seeds Version 2 database files resource
The Legume Information System (legumeinfo.org) is the USDA-ARS genetics and genomics database for legume crops and relatives. Researchers can also submit their data directly. LIS houses data for more than a dozen species such as common bean and chickpea, peanut, and soybean, with genome sequences, genes and predicted functions, families of related genes, views of evolutionary relationships between genomic regions, genetic maps, markers, and links to germplasm resources.
Resource Title: Legume Information System.
File Name: Web Page, url: https://legumeinfo.org
Website pointer for Legume Information System
The Leptinotarsa decemlineata genome was recently sequenced and annotated as part of the i5k pilot project by the Baylor College of Medicine. The L. decemlineata research community has manually reviewed and curated the computational gene predictions and generated an official gene set, OGSv1.2. OGSv1.1 is an integration of automatic gene predictions from Maker (performed by Dan Hughes at Baylor College of Medicine) with manual annotations by the research community (done via the Apollo manual annotation software). The coordinates of OGSv1.1 were converted to the latest genome assembly, GCF_000500325.1, using coordinates_conversion and remap-gff3, to generate OGSv1.2.
\nIf you wish to use this dataset, please follow the Baylor College of Medicine's conditions for data use: https://www.hgsc.bcm.edu/bcm-hgsc-conditions-use
\nResource Title: Leptinotarsa decemlineata Official Gene Set OGSv1.2.
File Name: lepdec_OGSv1-2.tar.gz
Resource Description: The attached tar.gz archive (lepdec_OGSv1-2.tar.gz) contains the following files:\n\n* lepdec_OGSv1.2_GCF_000500325.1_cds.fa - CDS sequences for OGSv1.2 \n* lepdec_OGSv1.2_GCF_000500325.1_pep.fa - protein sequences for OGSv1.2\n* lepdec_OGSv1.2_GCF_000500325.1_trans.fa - transcript sequences for OGSv1.2\n* lepdec_OGSv1.2_GCF_000500325.1.gff3 - GFF3 file for OGSv1.2\n* lepdec_OGSv1.2_GCF_000500325.1_removed-features.tsv - a list of features removed between OGSv1.1 and OGSv1.2. The list includes feature type, ID, Name, and owner.\n* lepdec_OGSv1.2_GCF_000500325.1_update-summary.tsv - summary statistics of the features removed between OGSv1.1 and OGSv1.2 \n
The Leptinotarsa decemlineata genome was recently sequenced and annotated as part of the i5k pilot project by the Baylor College of Medicine. This dataset presents the Leptinotarsa decemlineata gene set BCM_v_0.5.3, which was generated computationally. RNA-Seq data was used with additional protein homology data for a MAKER automated annotation of the Leptinotarsa decemlineata genome assembly 1.0. Further annotation method details will be available in a forthcoming publication.
\nNOTE: This gene set is an unstable pre-release (v0.5.3), and was provided to facilitate manual curation and analyses before the official gene set is released. Gene identifiers from this gene set will likely not be maintained.
\nIf you wish to use this dataset, please follow the Baylor College of Medicine's conditions for data use: https://www.hgsc.bcm.edu/bcm-hgsc-conditions-use
\nResource Title: Leptinotarsa decemlineata genome annotations v0.5.3 for genome assembly v1.0.
File Name: Ldec_genome_annotations_BCM_version_0.5.3.tar.gz
Resource Description:
The attached tar.gz archive (Ldec_genome_annotations_BCM_version_0.5.3.tar.gz) contains the following files:
\n\nLDEC.Analysis.gff3.gz. This file contains evidence gff3 format underlying the final gene predictions.
\n\nLDEC.CDS.fna.gz. CDS sequences of Leptinotarsa decemlineata genome annotations v0.5.3.
\n\nLDEC.faa.gz Amino acid sequences of Leptinotarsa decemlineata genome annotations v0.5.3.
\n\nLDEC.fna.gz cDNA sequences of Leptinotarsa decemlineata genome annotations v0.5.3.
\n\nLDEC.Models.gff3.gz Gff3 of all gene predictions of Leptinotarsa decemlineata genome annotations v0.5.3, modified by the National Agricultural Library to be compliant with gff3 specifications.
\nThe Baylor College of Medicine recently sequenced and annotated the Leptinotarsa decemlineata genome as part of the i5k pilot project. This dataset presents the Leptinotarsa decemlineata genome v1.0. This assembly version is the pre-release version, prior to filtering and quality control by the National Center for Biotechnology Information's GenBank resource. Assembly method details will be available in a forthcoming publication.
\nThe Colorado potato beetle is considered the economically most significant defoliator of potato in northern latitudes worldwide. The range of this insect is continuing to expand, and it is likely to eventually colonize all potato-producing areas with temperate climate. Within it's native habitat, the beetle feeds on native solanaceous plants, S. angustifolium, S. elaeagnifolium, and buffalo bur, S. rostratum. However, it has adapted to potatoes and other solanaceous crops after its range expansion.
\nDue to the lack of any natural enemies that have been able to evolve seasonal adaptations, the cornerstone of Colorado potato beetle management has been the use of insecticides. However, the beetle has shown a remarkable ability to develop resistance to most insecticides used for its control. The mechanism(s) of insecticide resistance is yet unknown and genomic sequencing will lead to major advances in managing this pest in commercial plant production.
\nIf you wish to use this dataset, please follow the Baylor College of Medicine's conditions for data use: https://www.hgsc.bcm.edu/bcm-hgsc-conditions-use
\nResource Title: Leptinotarsa decemlineata genome assembly v1.0 fasta and agp files for contigs and scaffolds.
File Name: Ldec_genome_assembly_v1.0.tar.gz
Resource Description:
The attached tar.gz archive (Ldec_genome_assembly_v1.0.tar.gz ) contains the following files:
\n\nLdec.contigs.10062013.fa. This file contains the sequence information of the contigs of the Leptinotarsa decemlineata 1.0 assembly.
\n\nLdec.genome.10062013.fa. This file contains the sequence information of the scaffolds of the Leptinotarsa decemlineata 1.0 assembly.
\n\nLdec.genome.10062013.agp. This file contains information linking the contigs and scaffolds for this assembly. A description of the agp format is available here: http://www.ncbi.nlm.nih.gov/projects/genome/assembly/agp/AGP_Specificati....
\nOver the past five decades, the United States Department of Agriculture-Agricultural Research Service (USDA-ARS) and the United States Geological Survey (USGS) have collected stream flow, reservoir, and groundwater data in the Fort Cobb Reservoir Experimental Watershed (FCREW) and Southern Great Plains Research Watershed (SGPRW), which includes the Little Washita River Experimental Watershed (LWREW) in central Oklahoma. The climate in these watersheds is subhumid, with average annual rainfall of 800 mm (1971-2000 average for Caddo County; Oklahoma Climatology Survey, 2005). The drainage area of the SGPRW is 2927 km2 and includes the LWREW. The LWREW covers an area of 610 km2 and consists of mixed agricultural land use, mainly pasture and rangeland that covers 68% of the total area. The topography is rolling with a maximum relief of 180 m and sandy to loamy soils. Of the 13 USGS stream gauges in the LWREW, two of them, ARS 522 and ARS 526, were initially managed by the USDA-ARS but decommissioned in 1985. Gauge ARS 522 was colocated with the USGS stream gauge ID 7327490, and data from this gauge were used when ARS 522 was discontinued. In 1992, the USGS installed the stream gauge ID 7327447 at the same location (Little Washita River near Cement, OK) where ARS 526 existed. For the stream gauges ID 522 and 526 installed by the ARS, stream stage data were obtained using a Hg manometer bubble gauge and a continuous stage recorder. Periodic stream discharge measurements were made during rain events and low-flow periods to define the relationship between flow discharge and stage. Discharge data by time increments were computed from the stage charts by the stage shift method (Corbett, 1943; Brakensiek et al., 1979). The directly measured data are the stage, which is then used to estimate discharge using stage-discharge relationships. All measurements made at USGS gaging stations are quality assured and quality controlled. The equipment used to make the measurements is securely housed and regularly checked for calibration and drift. Current meters are spin tested before use and checked after use if the measured value is deemed questionable.
Resource Title: GeoData catalog record.
File Name: Web Page, url: https://geodata.nal.usda.gov/geonetwork/srv/eng/catalog.search#/metadata/WashitaFlow_jjm_2015-03-26_1409
Provisional 15- minute Meteorological data collected on the Central Plains Experimental Range according to concept of operations created for the LTAR Network, NP215
Resource Title: GeoData Catalog record.
File Name: Web Page, url: https://geodata.nal.usda.gov/geonetwork/srv/eng/catalog.search#/metadata/1ff14e72-313b-4fcc-83d5-3141d5ca9610
The LTAR network maintains stations for standard meteorological measurements including, generally, air temperature and humidity, shortwave (solar) irradiance, longwave (thermal) radiation, wind speed and direction, barometric pressure, and precipitation. Many sites also have extensive comparable legacy datasets. The LTAR scientific community decided that these needed to be made available to the public using a single web source in a consistent manner. To that purpose, each site sent data on a regular schedule, as frequently as hourly, to the National Agricultural Library, which has developed a web service to provide the data to the public in tabular or graphical form.
\nThis archive of the LTAR legacy database exports contains meteorological data through April 30, 2021. For current meteorological data, visit the GeoEvent Meteorology Resources page, which provides tools and dashboards to view and access data from the 18 LTAR sites across the United States.
Resource Title: Meteorological data.
File Name: ltar_archive_DB.zip
Resource Description: This is an export of the meteorological data collected by LTAR sites and ingested by the NAL LTAR application. This export consists of an SQL schema definition file for creating database tables and the data itself.
\nThe data is provided in two formats: SQL insert statements (.sql) and CSV files (.csv). Please use the format most convenient for you. Note that the SQL insert statements take much longer to run since each row is an individual insert.
\nDescription of zip files
\nThe ltararchive*.zip files contain database exports. The schema is a .sql file; the data is exported as both SQL inserts and CSV for convenience.\nThere is a README in markdown and PDF in the zips.
\nContains the database export of the schema and data for the site, site_station, and met tables as SQL insert statements.
\nltar_archive_db_sql_export_20201231.zip --> has data until 2020-12-31\nltar_archive_db_sql_export_20210430.zip --> has data until 2021-04-30
\nContains the database export of the schema and data for the site, site_station, and met tables as CSV.
\nltar_archive_db_csv_export_20201231.zip --> has data until 2020-12-31\nltar_archive_db_csv_export_20210430.zip --> has data until 2021-04-30
\nContains the raw CSV files that were sent to NAL from the LTAR sites/stations.
\nltar_rawcsv_archive.zip --> has data until 2021-04-30
The USDA-ARS Pasture Systems and Watershed Management Research Unit established a meteorological station in 2015 as part of the Upper Chesapeake Bay (UCB) site in the Long-Term Agroecosystem Research (LTAR) network (est. 2012). Measurements include air temperature and humidity, shortwave (solar) irradiance, longwave (thermal) radiation, wind speed and direction, barometric pressure, and rainfall. Data are recorded at 15-minute intervals.
Resource Title: GeoData catalog record.
File Name: Web Page, url: https://geodata.nal.usda.gov/geonetwork/srv/eng/catalog.search#/metadata/387f5875-fdcc-49a4-80db-d2c4538df41b
The USDA-ARS Pasture Systems and Watershed Management Research Unit established a meteorological station in 2015 as part of the Upper Chesapeake Bay (UCB) site in the Long-Term Agroecosystem Research (LTAR) network (est. 2012). Measurements include air temperature and humidity, shortwave (solar) irradiance, longwave (thermal) radiation, wind speed and direction, barometric pressure, and rainfall. Data are recorded at 15-minute intervals.
Resource Title: GeoData catalog record.
File Name: Web Page, url: https://geodata.nal.usda.gov/geonetwork/srv/eng/catalog.search#/metadata/5beaa9db-5772-43b1-87ae-7148602d4619
The United States Department of Agriculture - Agricultural Research Service (USDA-ARS) Soil and Water Management Research Unit established a meteorological data collection system at the Rosemount Research and Outreach Center in 2003. In 2015 the site became part of the Long-Term Agroecosystem Research (LTAR) network. The site is located in Dakota County Minnesota in the Upper Mississippi River Basin (UMRB) watershed. Data are recorded at 15-minute intervals.
Resource Title: GeoData catalog record.
File Name: Web Page, url: https://geodata.nal.usda.gov/geonetwork/srv/eng/catalog.search#/metadata/2ada200e-9095-4264-8b24-196004bae0a8
\n
A stationary camera overlooking the Hawbecker farm in the Spring Creek watershed in Centre County, Pennsylvania, used to track vegetation phenology (RGB and IR imagery). Images are taken every 30 minutes between 4:00am and 10:30pm local standard time. A link to the Phenocam's network FAQ: https://phenocam.sr.unh.edu/webcam/faq
Resource Title: GeoData catalog record.
File Name: Web Page, url: https://geodata.nal.usda.gov/geonetwork/srv/eng/catalog.search#/metadata/a1d3e1c7-3d17-49e9-bb46-2e4ec84b71a7
Information and analysis provided by the PhenoCam network
The Long-Term Agroecosystem Research Network, consisting of 18+ research locations, is conducting research on the sustainable intensification of agroecosystems. To enable coordinated network level research, a spatial framework is required to facilitate analysis. However, no suitable spatial framework currently exists to meet the needs for the LTAR Network. To develop a framework for analysis the LTAR Network initiated the Regionalization Project. Goals also included providing a standardized spatial footprint for LTAR cross-site investigations, estimating the confidence with which results from research plots and fields could reasonably be extrapolated to \"represented regions\", informing decisions about where additional research sites should be prioritized and facilitating public outreach of the LTAR Network. To address these goals a workshop was held in 2018 resulting in the production of three sets of regional boundaries in a geographic information system (GIS). These GIS datasets are intended to be used for mapping the\nnetwork and for summarizing spatial data relevant to domains of sustainable intensification corresponding with agricultural production, environmental impact, and rural prosperity. This resulted in a geodatabase of three new maps describing regional boundaries for the LTAR Network titled \"Long-Term Agroecosystem Research Network regions, 2018 version\", archived in the USDA National Agricultural Library's Ag Data Commons repository.
Resource Title: LTAR_Regions_v2018.
File Name: LTAR_Regionsv2018.gdb.zip
Resource Description: Geodatabase of the regions pertaining to the Long-Term Agroecosystem Research Network. There are three data layers describing regions associated with indicators of sustainable intensification corresponding with agricultural production (LTAR_Production_v2018), environmental impacts (LTAR_Environment_v2018), and rural prosperity (LTAR_RuralProsp_v2018). These date were produced by the LTAR Regionalization Project as an outcome from the 2018 LTAR Regionalization Project workshop held in March 2018, Tifton, GA.
Resource Software Recommended: ArcGIS Pro,url: www.esri.com
Foodborne pathogens are a significant cause of illness and infection with Shiga toxin-producing Escherichia coli (STEC) has the potential to produce life-threatening complications. The current methods to identify STEC in meat involve culture-based, molecular, and proteomic assays and take at least four days to complete. This time could be reduced by using long-read whole genome sequencing to identify foodborne pathogens. Therefore, the goal of this project was to evaluate using long-read sequencing to detect STEC in ground beef. The objectives of the project included: establishing optimal sequencing parameters, determining the limit of detection of all STEC virulence genes of interest in pure cultures and spiked ground beef, and evaluating selective sequencing to enhance STEC detection in ground beef. Sequencing libraries were run on Oxford Nanopore Technologies’ MinION sequencer. Optimal sequencing output was obtained using the default parameters in MinKNOW, except for setting the minimum read length to 1 kb. All genes of interest (eae, stx1, stx2, fliC, wzx, wzy, rrsC) were detected in DNA extracted from STEC pure cultures within 1 hour of sequencing, and 30X coverage was obtained within 2 hours. All virulence genes were confidently detected in STEC DNA quantities as low as 12.5 ng. In STEC inoculated ground beef, software-controlled selective sequencing improved virulence gene detection; however, several virulence genes were not detected due to high bovine DNA concentrations in the samples. Growth enrichment of inoculated meat samples in mTSB resulted in a 100-fold increase in virulence gene detection as compared to the unenriched samples. The results of this project suggest that further development of long-read sequencing protocols may result in a faster, less labor-intensive method to detect STEC in ground beef. The sequencing data from this project has been uploaded.
", "title": "Long-read sequencing data from pure cultures of Escherichia coli O157:H7 and ground beef inoculated with E. coli O157:H7", "distribution": [ { "@type": "dcat:Distribution", "downloadURL": "https://ndownloader.figshare.com/files/44455496", "format": "gz", "mediaType": "application/gzip", "title": "FAR81978_pass_e892fe42_0.fastq.gz" }, { "@type": "dcat:Distribution", "downloadURL": "https://ndownloader.figshare.com/files/44455535", "format": "gz", "mediaType": "application/gzip", "title": "FAR81978_pass_5402ba3b_1.fastq.gz" }, { "@type": "dcat:Distribution", "downloadURL": "https://ndownloader.figshare.com/files/44455538", "format": "gz", "mediaType": "application/gzip", "title": "FAR81978_pass_5402ba3b_0.fastq.gz" }, { "@type": "dcat:Distribution", "downloadURL": "https://ndownloader.figshare.com/files/44455547", "format": "gz", "mediaType": "application/gzip", "title": "FAR81978_pass_b44cb184_2.fastq.gz" }, { "@type": "dcat:Distribution", "downloadURL": "https://ndownloader.figshare.com/files/44455550", "format": "gz", "mediaType": "application/gzip", "title": "FAR81978_pass_b44cb184_0.fastq.gz" }, { "@type": "dcat:Distribution", "downloadURL": "https://ndownloader.figshare.com/files/44455553", "format": "gz", "mediaType": "application/gzip", "title": "FAR81978_pass_b44cb184_1.fastq.gz" }, { "@type": "dcat:Distribution", "downloadURL": "https://ndownloader.figshare.com/files/44455574", "format": "gz", "mediaType": "application/gzip", "title": "FAR81978_pass_84baf920_3.fastq.gz" }, { "@type": "dcat:Distribution", "downloadURL": "https://ndownloader.figshare.com/files/44455577", "format": "gz", "mediaType": "application/gzip", "title": "FAR81978_pass_84baf920_4.fastq.gz" }, { "@type": "dcat:Distribution", "downloadURL": "https://ndownloader.figshare.com/files/44455583", "format": "gz", "mediaType": "application/gzip", "title": "FAR81978_pass_84baf920_5.fastq.gz" }, { "@type": "dcat:Distribution", "downloadURL": "https://ndownloader.figshare.com/files/44455586", "format": "gz", "mediaType": "application/gzip", "title": "FAR81978_pass_84baf920_6.fastq.gz" }, { "@type": "dcat:Distribution", "downloadURL": "https://ndownloader.figshare.com/files/44455592", "format": "gz", "mediaType": "application/gzip", "title": "FAR81978_pass_84baf920_7.fastq.gz" }, { "@type": "dcat:Distribution", "downloadURL": "https://ndownloader.figshare.com/files/44455595", "format": "gz", "mediaType": "application/gzip", "title": "FAR81978_pass_84baf920_8.fastq.gz" }, { "@type": "dcat:Distribution", "downloadURL": "https://ndownloader.figshare.com/files/44455601", "format": "gz", "mediaType": "application/gzip", "title": "FAR81978_pass_84baf920_9.fastq.gz" }, { "@type": "dcat:Distribution", "downloadURL": "https://ndownloader.figshare.com/files/44455589", "format": "gz", "mediaType": "application/gzip", "title": "FAR81978_pass_84baf920_10.fastq.gz" }, { "@type": "dcat:Distribution", "downloadURL": "https://ndownloader.figshare.com/files/44455607", "format": "gz", "mediaType": "application/gzip", "title": "FAR81978_pass_84baf920_11.fastq.gz" }, { "@type": "dcat:Distribution", "downloadURL": "https://ndownloader.figshare.com/files/44455598", "format": "gz", "mediaType": "application/gzip", "title": "FAR81978_pass_84baf920_12.fastq.gz" }, { "@type": "dcat:Distribution", "downloadURL": "https://ndownloader.figshare.com/files/44455580", "format": "gz", "mediaType": "application/gzip", "title": "FAR81978_pass_84baf920_13.fastq.gz" }, { "@type": "dcat:Distribution", "downloadURL": "https://ndownloader.figshare.com/files/44455610", "format": "gz", "mediaType": "application/gzip", "title": "FAR81978_pass_84baf920_0.fastq.gz" }, { "@type": "dcat:Distribution", "downloadURL": "https://ndownloader.figshare.com/files/44455613", "format": "gz", "mediaType": "application/gzip", "title": "FAR81978_pass_84baf920_1.fastq.gz" }, { "@type": "dcat:Distribution", "downloadURL": "https://ndownloader.figshare.com/files/44455616", "format": "gz", "mediaType": "application/gzip", "title": "FAR81978_pass_84baf920_2.fastq.gz" }, { "@type": "dcat:Distribution", "downloadURL": "https://ndownloader.figshare.com/files/44456165", "format": "gz", "mediaType": "application/gzip", "title": "FAR86482_pass_37cdb555_0.fastq.gz" }, { "@type": "dcat:Distribution", "downloadURL": "https://ndownloader.figshare.com/files/44456186", "format": "gz", "mediaType": "application/gzip", "title": "FAR86482_pass_38932954_0.fastq.gz" }, { "@type": "dcat:Distribution", "downloadURL": "https://ndownloader.figshare.com/files/44456210", "format": "gz", "mediaType": "application/gzip", "title": "FAR86482_pass_1571f29b_1.fastq.gz" }, { "@type": "dcat:Distribution", "downloadURL": "https://ndownloader.figshare.com/files/44456213", "format": "gz", "mediaType": "application/gzip", "title": "FAR86482_pass_1571f29b_0.fastq.gz" }, { "@type": "dcat:Distribution", "downloadURL": "https://ndownloader.figshare.com/files/44456243", "format": "gz", "mediaType": "application/gzip", "title": "FAT22149_pass_0ac38064_1.fastq.gz" }, { "@type": "dcat:Distribution", "downloadURL": "https://ndownloader.figshare.com/files/44456246", "format": "gz", "mediaType": "application/gzip", "title": "FAT22149_pass_0ac38064_0.fastq.gz" }, { "@type": "dcat:Distribution", "downloadURL": "https://ndownloader.figshare.com/files/44456267", "format": "gz", "mediaType": "application/gzip", "title": "FAT22149_pass_21565e02_1.fastq.gz" }, { "@type": "dcat:Distribution", "downloadURL": "https://ndownloader.figshare.com/files/44456270", "format": "gz", "mediaType": "application/gzip", "title": "FAT22149_pass_21565e02_0.fastq.gz" }, { "@type": "dcat:Distribution", "downloadURL": "https://ndownloader.figshare.com/files/44456279", "format": "gz", "mediaType": "application/gzip", "title": "FAT22149_pass_4064850c_2.fastq.gz" }, { "@type": "dcat:Distribution", "downloadURL": "https://ndownloader.figshare.com/files/44456282", "format": "gz", "mediaType": "application/gzip", "title": "FAT22149_pass_4064850c_0.fastq.gz" }, { "@type": "dcat:Distribution", "downloadURL": "https://ndownloader.figshare.com/files/44456285", "format": "gz", "mediaType": "application/gzip", "title": "FAT22149_pass_4064850c_1.fastq.gz" }, { "@type": "dcat:Distribution", "downloadURL": "https://ndownloader.figshare.com/files/44456297", "format": "gz", "mediaType": "application/gzip", "title": "FAT22149_pass_0dfa4b56_2.fastq.gz" }, { "@type": "dcat:Distribution", "downloadURL": "https://ndownloader.figshare.com/files/44456303", "format": "gz", "mediaType": "application/gzip", "title": "FAT22149_pass_0dfa4b56_3.fastq.gz" }, { "@type": "dcat:Distribution", "downloadURL": "https://ndownloader.figshare.com/files/44456306", "format": "gz", "mediaType": "application/gzip", "title": "FAT22149_pass_0dfa4b56_4.fastq.gz" }, { "@type": "dcat:Distribution", "downloadURL": "https://ndownloader.figshare.com/files/44456309", "format": "gz", "mediaType": "application/gzip", "title": "FAT22149_pass_0dfa4b56_5.fastq.gz" }, { "@type": "dcat:Distribution", "downloadURL": "https://ndownloader.figshare.com/files/44456300", "format": "gz", "mediaType": "application/gzip", "title": "FAT22149_pass_0dfa4b56_6.fastq.gz" }, { "@type": "dcat:Distribution", "downloadURL": "https://ndownloader.figshare.com/files/44456312", "format": "gz", "mediaType": "application/gzip", "title": "FAT22149_pass_0dfa4b56_0.fastq.gz" }, { "@type": "dcat:Distribution", "downloadURL": "https://ndownloader.figshare.com/files/44456315", "format": "gz", "mediaType": "application/gzip", "title": "FAT22149_pass_0dfa4b56_1.fastq.gz" }, { "@type": "dcat:Distribution", "downloadURL": "https://ndownloader.figshare.com/files/44456351", "format": "gz", "mediaType": "application/gzip", "title": "FAW74667_pass_b18bb362_12.fastq.gz" }, { "@type": "dcat:Distribution", "downloadURL": "https://ndownloader.figshare.com/files/44456354", "format": "gz", "mediaType": "application/gzip", "title": "FAW74667_pass_b18bb362_10.fastq.gz" }, { "@type": "dcat:Distribution", "downloadURL": "https://ndownloader.figshare.com/files/44456369", "format": "gz", "mediaType": "application/gzip", "title": "FAS70711_pass_0b36d9ab_8a582aa2_5.fastq.gz" }, { "@type": "dcat:Distribution", "downloadURL": "https://ndownloader.figshare.com/files/44456372", "format": "gz", "mediaType": "application/gzip", "title": "FAS70711_pass_0b36d9ab_8a582aa2_6.fastq.gz" }, { "@type": "dcat:Distribution", "downloadURL": "https://ndownloader.figshare.com/files/44456366", "format": "gz", "mediaType": "application/gzip", "title": "FAS70711_pass_0b36d9ab_8a582aa2_7.fastq.gz" }, { "@type": "dcat:Distribution", "downloadURL": "https://ndownloader.figshare.com/files/44456381", "format": "gz", "mediaType": "application/gzip", "title": "FAS70711_pass_0b36d9ab_8a582aa2_8.fastq.gz" }, { "@type": "dcat:Distribution", "downloadURL": "https://ndownloader.figshare.com/files/44456378", "format": "gz", "mediaType": "application/gzip", "title": "FAS70711_pass_0b36d9ab_8a582aa2_9.fastq.gz" }, { "@type": "dcat:Distribution", "downloadURL": "https://ndownloader.figshare.com/files/44456363", "format": "gz", "mediaType": "application/gzip", "title": "FAS70711_pass_0b36d9ab_8a582aa2_10.fastq.gz" }, { "@type": "dcat:Distribution", "downloadURL": "https://ndownloader.figshare.com/files/44456375", "format": "gz", "mediaType": "application/gzip", "title": "FAS70711_pass_0b36d9ab_8a582aa2_11.fastq.gz" }, { "@type": "dcat:Distribution", "downloadURL": "https://ndownloader.figshare.com/files/44456384", "format": "gz", "mediaType": "application/gzip", "title": "FAS70711_pass_0b36d9ab_8a582aa2_12.fastq.gz" }, { "@type": "dcat:Distribution", "downloadURL": "https://ndownloader.figshare.com/files/44456387", "format": "gz", "mediaType": "application/gzip", "title": "FAS70711_pass_0b36d9ab_8a582aa2_13.fastq.gz" }, { "@type": "dcat:Distribution", "downloadURL": "https://ndownloader.figshare.com/files/44456396", "format": "gz", "mediaType": "application/gzip", "title": "FAS70711_pass_0b36d9ab_8a582aa2_0.fastq.gz" }, { "@type": "dcat:Distribution", "downloadURL": "https://ndownloader.figshare.com/files/44456390", "format": "gz", "mediaType": "application/gzip", "title": "FAS70711_pass_0b36d9ab_8a582aa2_1.fastq.gz" }, { "@type": "dcat:Distribution", "downloadURL": "https://ndownloader.figshare.com/files/44456393", "format": "gz", "mediaType": "application/gzip", "title": "FAS70711_pass_0b36d9ab_8a582aa2_2.fastq.gz" }, { "@type": "dcat:Distribution", "downloadURL": "https://ndownloader.figshare.com/files/44456399", "format": "gz", "mediaType": "application/gzip", "title": "FAS70711_pass_0b36d9ab_8a582aa2_3.fastq.gz" }, { "@type": "dcat:Distribution", "downloadURL": "https://ndownloader.figshare.com/files/44456402", "format": "gz", "mediaType": "application/gzip", "title": "FAS70711_pass_0b36d9ab_8a582aa2_4.fastq.gz" }, { "@type": "dcat:Distribution", "downloadURL": "https://ndownloader.figshare.com/files/44456405", "format": "gz", "mediaType": "application/gzip", "title": "FAW41188_pass_30faa5ff_a8ac6031_0.fastq.gz" }, { "@type": "dcat:Distribution", "downloadURL": "https://ndownloader.figshare.com/files/44456525", "format": "gz", "mediaType": "application/gzip", "title": "FAW41222_pass_8a6acd45_89b9b639_3.fastq.gz" }, { "@type": "dcat:Distribution", "downloadURL": "https://ndownloader.figshare.com/files/44456435", "format": "gz", "mediaType": "application/gzip", "title": "FAW41222_pass_8a6acd45_89b9b639_4.fastq.gz" }, { "@type": "dcat:Distribution", "downloadURL": "https://ndownloader.figshare.com/files/44456504", "format": "gz", "mediaType": "application/gzip", "title": "FAW41222_pass_8a6acd45_89b9b639_5.fastq.gz" }, { "@type": "dcat:Distribution", "downloadURL": "https://ndownloader.figshare.com/files/44456438", "format": "gz", "mediaType": "application/gzip", "title": "FAW41222_pass_8a6acd45_89b9b639_6.fastq.gz" }, { "@type": "dcat:Distribution", "downloadURL": "https://ndownloader.figshare.com/files/44456495", "format": "gz", "mediaType": "application/gzip", "title": "FAW41222_pass_8a6acd45_89b9b639_7.fastq.gz" }, { "@type": "dcat:Distribution", "downloadURL": "https://ndownloader.figshare.com/files/44456528", "format": "gz", "mediaType": "application/gzip", "title": "FAW41222_pass_8a6acd45_89b9b639_8.fastq.gz" }, { "@type": "dcat:Distribution", "downloadURL": "https://ndownloader.figshare.com/files/44456477", "format": "gz", "mediaType": "application/gzip", "title": "FAW41222_pass_8a6acd45_89b9b639_9.fastq.gz" }, { "@type": "dcat:Distribution", "downloadURL": "https://ndownloader.figshare.com/files/44456465", "format": "gz", "mediaType": "application/gzip", "title": "FAW41222_pass_8a6acd45_89b9b639_10.fastq.gz" }, { "@type": "dcat:Distribution", "downloadURL": "https://ndownloader.figshare.com/files/44456453", "format": "gz", "mediaType": "application/gzip", "title": "FAW41222_pass_8a6acd45_89b9b639_11.fastq.gz" }, { "@type": "dcat:Distribution", "downloadURL": "https://ndownloader.figshare.com/files/44456429", "format": "gz", "mediaType": "application/gzip", "title": "FAW41222_pass_8a6acd45_89b9b639_12.fastq.gz" }, { "@type": "dcat:Distribution", "downloadURL": "https://ndownloader.figshare.com/files/44456456", "format": "gz", "mediaType": "application/gzip", "title": "FAW41222_pass_8a6acd45_89b9b639_13.fastq.gz" }, { "@type": "dcat:Distribution", "downloadURL": "https://ndownloader.figshare.com/files/44456624", "format": "gz", "mediaType": "application/gzip", "title": "FAW41222_pass_8a6acd45_89b9b639_14.fastq.gz" }, { "@type": "dcat:Distribution", "downloadURL": "https://ndownloader.figshare.com/files/44456564", "format": "gz", "mediaType": "application/gzip", "title": "FAW41222_pass_8a6acd45_89b9b639_15.fastq.gz" }, { "@type": "dcat:Distribution", "downloadURL": "https://ndownloader.figshare.com/files/44456489", "format": "gz", "mediaType": "application/gzip", "title": "FAW41222_pass_8a6acd45_89b9b639_16.fastq.gz" }, { "@type": "dcat:Distribution", "downloadURL": "https://ndownloader.figshare.com/files/44456444", "format": "gz", "mediaType": "application/gzip", "title": "FAW41222_pass_8a6acd45_89b9b639_17.fastq.gz" }, { "@type": "dcat:Distribution", "downloadURL": "https://ndownloader.figshare.com/files/44456609", "format": "gz", "mediaType": "application/gzip", "title": "FAW41222_pass_8a6acd45_89b9b639_18.fastq.gz" }, { "@type": "dcat:Distribution", "downloadURL": "https://ndownloader.figshare.com/files/44456531", "format": "gz", "mediaType": "application/gzip", "title": "FAW41222_pass_8a6acd45_89b9b639_19.fastq.gz" }, { "@type": "dcat:Distribution", "downloadURL": "https://ndownloader.figshare.com/files/44456468", "format": "gz", "mediaType": "application/gzip", "title": "FAW41222_pass_8a6acd45_89b9b639_20.fastq.gz" }, { "@type": "dcat:Distribution", "downloadURL": "https://ndownloader.figshare.com/files/44456588", "format": "gz", "mediaType": "application/gzip", "title": "FAW41222_pass_8a6acd45_89b9b639_21.fastq.gz" }, { "@type": "dcat:Distribution", "downloadURL": "https://ndownloader.figshare.com/files/44456471", "format": "gz", "mediaType": "application/gzip", "title": "FAW41222_pass_8a6acd45_89b9b639_22.fastq.gz" }, { "@type": "dcat:Distribution", "downloadURL": "https://ndownloader.figshare.com/files/44456600", "format": "gz", "mediaType": "application/gzip", "title": "FAW41222_pass_8a6acd45_89b9b639_23.fastq.gz" }, { "@type": "dcat:Distribution", "downloadURL": "https://ndownloader.figshare.com/files/44456462", "format": "gz", "mediaType": "application/gzip", "title": "FAW41222_pass_8a6acd45_89b9b639_24.fastq.gz" }, { "@type": "dcat:Distribution", "downloadURL": "https://ndownloader.figshare.com/files/44456552", "format": "gz", "mediaType": "application/gzip", "title": "FAW41222_pass_8a6acd45_89b9b639_25.fastq.gz" }, { "@type": "dcat:Distribution", "downloadURL": "https://ndownloader.figshare.com/files/44456492", "format": "gz", "mediaType": "application/gzip", "title": "FAW41222_pass_8a6acd45_89b9b639_26.fastq.gz" }, { "@type": "dcat:Distribution", "downloadURL": "https://ndownloader.figshare.com/files/44456483", "format": "gz", "mediaType": "application/gzip", "title": "FAW41222_pass_8a6acd45_89b9b639_27.fastq.gz" }, { "@type": "dcat:Distribution", "downloadURL": "https://ndownloader.figshare.com/files/44456558", "format": "gz", "mediaType": "application/gzip", "title": "FAW41222_pass_8a6acd45_89b9b639_28.fastq.gz" }, { "@type": "dcat:Distribution", "downloadURL": "https://ndownloader.figshare.com/files/44456474", "format": "gz", "mediaType": "application/gzip", "title": "FAW41222_pass_8a6acd45_89b9b639_29.fastq.gz" }, { "@type": "dcat:Distribution", "downloadURL": "https://ndownloader.figshare.com/files/44456513", "format": "gz", "mediaType": "application/gzip", "title": "FAW41222_pass_8a6acd45_89b9b639_30.fastq.gz" }, { "@type": "dcat:Distribution", "downloadURL": "https://ndownloader.figshare.com/files/44456516", "format": "gz", "mediaType": "application/gzip", "title": "FAW41222_pass_8a6acd45_89b9b639_31.fastq.gz" }, { "@type": "dcat:Distribution", "downloadURL": "https://ndownloader.figshare.com/files/44456441", "format": "gz", "mediaType": "application/gzip", "title": "FAW41222_pass_8a6acd45_89b9b639_32.fastq.gz" }, { "@type": "dcat:Distribution", "downloadURL": "https://ndownloader.figshare.com/files/44456594", "format": "gz", "mediaType": "application/gzip", "title": "FAW41222_pass_8a6acd45_89b9b639_33.fastq.gz" }, { "@type": "dcat:Distribution", "downloadURL": "https://ndownloader.figshare.com/files/44456510", "format": "gz", "mediaType": "application/gzip", "title": "FAW41222_pass_8a6acd45_89b9b639_34.fastq.gz" }, { "@type": "dcat:Distribution", "downloadURL": "https://ndownloader.figshare.com/files/44456459", "format": "gz", "mediaType": "application/gzip", "title": "FAW41222_pass_8a6acd45_89b9b639_35.fastq.gz" }, { "@type": "dcat:Distribution", "downloadURL": "https://ndownloader.figshare.com/files/44456432", "format": "gz", "mediaType": "application/gzip", "title": "FAW41222_pass_8a6acd45_89b9b639_36.fastq.gz" }, { "@type": "dcat:Distribution", "downloadURL": "https://ndownloader.figshare.com/files/44456543", "format": "gz", "mediaType": "application/gzip", "title": "FAW41222_pass_8a6acd45_89b9b639_37.fastq.gz" }, { "@type": "dcat:Distribution", "downloadURL": "https://ndownloader.figshare.com/files/44456621", "format": "gz", "mediaType": "application/gzip", "title": "FAW41222_pass_8a6acd45_89b9b639_38.fastq.gz" }, { "@type": "dcat:Distribution", "downloadURL": "https://ndownloader.figshare.com/files/44456450", "format": "gz", "mediaType": "application/gzip", "title": "FAW41222_pass_8a6acd45_89b9b639_39.fastq.gz" }, { "@type": "dcat:Distribution", "downloadURL": "https://ndownloader.figshare.com/files/44456651", "format": "gz", "mediaType": "application/gzip", "title": "FAW41222_pass_8a6acd45_89b9b639_40.fastq.gz" }, { "@type": "dcat:Distribution", "downloadURL": "https://ndownloader.figshare.com/files/44456519", "format": "gz", "mediaType": "application/gzip", "title": "FAW41222_pass_8a6acd45_89b9b639_41.fastq.gz" }, { "@type": "dcat:Distribution", "downloadURL": "https://ndownloader.figshare.com/files/44456486", "format": "gz", "mediaType": "application/gzip", "title": "FAW41222_pass_8a6acd45_89b9b639_42.fastq.gz" }, { "@type": "dcat:Distribution", "downloadURL": "https://ndownloader.figshare.com/files/44456546", "format": "gz", "mediaType": "application/gzip", "title": "FAW41222_pass_8a6acd45_89b9b639_43.fastq.gz" }, { "@type": "dcat:Distribution", "downloadURL": "https://ndownloader.figshare.com/files/44456645", "format": "gz", "mediaType": "application/gzip", "title": "FAW41222_pass_8a6acd45_89b9b639_44.fastq.gz" }, { "@type": "dcat:Distribution", "downloadURL": "https://ndownloader.figshare.com/files/44456675", "format": "gz", "mediaType": "application/gzip", "title": "FAW41222_pass_8a6acd45_89b9b639_45.fastq.gz" }, { "@type": "dcat:Distribution", "downloadURL": "https://ndownloader.figshare.com/files/44456522", "format": "gz", "mediaType": "application/gzip", "title": "FAW41222_pass_8a6acd45_89b9b639_46.fastq.gz" }, { "@type": "dcat:Distribution", "downloadURL": "https://ndownloader.figshare.com/files/44456570", "format": "gz", "mediaType": "application/gzip", "title": "FAW41222_pass_8a6acd45_89b9b639_47.fastq.gz" }, { "@type": "dcat:Distribution", "downloadURL": "https://ndownloader.figshare.com/files/44456636", "format": "gz", "mediaType": "application/gzip", "title": "FAW41222_pass_8a6acd45_89b9b639_48.fastq.gz" }, { "@type": "dcat:Distribution", "downloadURL": "https://ndownloader.figshare.com/files/44456642", "format": "gz", "mediaType": "application/gzip", "title": "FAW41222_pass_8a6acd45_89b9b639_49.fastq.gz" }, { "@type": "dcat:Distribution", "downloadURL": "https://ndownloader.figshare.com/files/44456480", "format": "gz", "mediaType": "application/gzip", "title": "FAW41222_pass_8a6acd45_89b9b639_50.fastq.gz" }, { "@type": "dcat:Distribution", "downloadURL": "https://ndownloader.figshare.com/files/44456498", "format": "gz", "mediaType": "application/gzip", "title": "FAW41222_pass_8a6acd45_89b9b639_51.fastq.gz" }, { "@type": "dcat:Distribution", "downloadURL": "https://ndownloader.figshare.com/files/44456507", "format": "gz", "mediaType": "application/gzip", "title": "FAW41222_pass_8a6acd45_89b9b639_52.fastq.gz" }, { "@type": "dcat:Distribution", "downloadURL": "https://ndownloader.figshare.com/files/44456447", "format": "gz", "mediaType": "application/gzip", "title": "FAW41222_pass_8a6acd45_89b9b639_53.fastq.gz" }, { "@type": "dcat:Distribution", "downloadURL": "https://ndownloader.figshare.com/files/44456537", "format": "gz", "mediaType": "application/gzip", "title": "FAW41222_pass_8a6acd45_89b9b639_54.fastq.gz" }, { "@type": "dcat:Distribution", "downloadURL": "https://ndownloader.figshare.com/files/44456555", "format": "gz", "mediaType": "application/gzip", "title": "FAW41222_pass_8a6acd45_89b9b639_55.fastq.gz" }, { "@type": "dcat:Distribution", "downloadURL": "https://ndownloader.figshare.com/files/44456597", "format": "gz", "mediaType": "application/gzip", "title": "FAW41222_pass_8a6acd45_89b9b639_56.fastq.gz" }, { "@type": "dcat:Distribution", "downloadURL": "https://ndownloader.figshare.com/files/44456615", "format": "gz", "mediaType": "application/gzip", "title": "FAW41222_pass_8a6acd45_89b9b639_57.fastq.gz" }, { "@type": "dcat:Distribution", "downloadURL": "https://ndownloader.figshare.com/files/44456603", "format": "gz", "mediaType": "application/gzip", "title": "FAW41222_pass_8a6acd45_89b9b639_58.fastq.gz" }, { "@type": "dcat:Distribution", "downloadURL": "https://ndownloader.figshare.com/files/44456633", "format": "gz", "mediaType": "application/gzip", "title": "FAW41222_pass_8a6acd45_89b9b639_59.fastq.gz" }, { "@type": "dcat:Distribution", "downloadURL": "https://ndownloader.figshare.com/files/44456534", "format": "gz", "mediaType": "application/gzip", "title": "FAW41222_pass_8a6acd45_89b9b639_60.fastq.gz" }, { "@type": "dcat:Distribution", "downloadURL": "https://ndownloader.figshare.com/files/44456573", "format": "gz", "mediaType": "application/gzip", "title": "FAW41222_pass_8a6acd45_89b9b639_61.fastq.gz" }, { "@type": "dcat:Distribution", "downloadURL": "https://ndownloader.figshare.com/files/44456591", "format": "gz", "mediaType": "application/gzip", "title": "FAW41222_pass_8a6acd45_89b9b639_62.fastq.gz" }, { "@type": "dcat:Distribution", "downloadURL": "https://ndownloader.figshare.com/files/44456576", "format": "gz", "mediaType": "application/gzip", "title": "FAW41222_pass_8a6acd45_89b9b639_63.fastq.gz" }, { "@type": "dcat:Distribution", "downloadURL": "https://ndownloader.figshare.com/files/44456585", "format": "gz", "mediaType": "application/gzip", "title": "FAW41222_pass_8a6acd45_89b9b639_64.fastq.gz" }, { "@type": "dcat:Distribution", "downloadURL": "https://ndownloader.figshare.com/files/44456540", "format": "gz", "mediaType": "application/gzip", "title": "FAW41222_pass_8a6acd45_89b9b639_65.fastq.gz" }, { "@type": "dcat:Distribution", "downloadURL": "https://ndownloader.figshare.com/files/44456702", "format": "gz", "mediaType": "application/gzip", "title": "FAW41222_pass_8a6acd45_89b9b639_66.fastq.gz" }, { "@type": "dcat:Distribution", "downloadURL": "https://ndownloader.figshare.com/files/44456696", "format": "gz", "mediaType": "application/gzip", "title": "FAW41222_pass_8a6acd45_89b9b639_67.fastq.gz" }, { "@type": "dcat:Distribution", "downloadURL": "https://ndownloader.figshare.com/files/44456711", "format": "gz", "mediaType": "application/gzip", "title": "FAW41222_pass_8a6acd45_89b9b639_68.fastq.gz" }, { "@type": "dcat:Distribution", "downloadURL": "https://ndownloader.figshare.com/files/44456501", "format": "gz", "mediaType": "application/gzip", "title": "FAW41222_pass_8a6acd45_89b9b639_69.fastq.gz" }, { "@type": "dcat:Distribution", "downloadURL": "https://ndownloader.figshare.com/files/44456579", "format": "gz", "mediaType": "application/gzip", "title": "FAW41222_pass_8a6acd45_89b9b639_70.fastq.gz" }, { "@type": "dcat:Distribution", "downloadURL": "https://ndownloader.figshare.com/files/44456708", "format": "gz", "mediaType": "application/gzip", "title": "FAW41222_pass_8a6acd45_89b9b639_71.fastq.gz" }, { "@type": "dcat:Distribution", "downloadURL": "https://ndownloader.figshare.com/files/44456714", "format": "gz", "mediaType": "application/gzip", "title": "FAW41222_pass_8a6acd45_89b9b639_72.fastq.gz" }, { "@type": "dcat:Distribution", "downloadURL": "https://ndownloader.figshare.com/files/44456705", "format": "gz", "mediaType": "application/gzip", "title": "FAW41222_pass_8a6acd45_89b9b639_73.fastq.gz" }, { "@type": "dcat:Distribution", "downloadURL": "https://ndownloader.figshare.com/files/44456666", "format": "gz", "mediaType": "application/gzip", "title": "FAW41222_pass_8a6acd45_89b9b639_74.fastq.gz" }, { "@type": "dcat:Distribution", "downloadURL": "https://ndownloader.figshare.com/files/44456687", "format": "gz", "mediaType": "application/gzip", "title": "FAW41222_pass_8a6acd45_89b9b639_75.fastq.gz" }, { "@type": "dcat:Distribution", "downloadURL": "https://ndownloader.figshare.com/files/44456678", "format": "gz", "mediaType": "application/gzip", "title": "FAW41222_pass_8a6acd45_89b9b639_76.fastq.gz" }, { "@type": "dcat:Distribution", "downloadURL": "https://ndownloader.figshare.com/files/44456618", "format": "gz", "mediaType": "application/gzip", "title": "FAW41222_pass_8a6acd45_89b9b639_77.fastq.gz" }, { "@type": "dcat:Distribution", "downloadURL": "https://ndownloader.figshare.com/files/44456582", "format": "gz", "mediaType": "application/gzip", "title": "FAW41222_pass_8a6acd45_89b9b639_78.fastq.gz" }, { "@type": "dcat:Distribution", "downloadURL": "https://ndownloader.figshare.com/files/44456606", "format": "gz", "mediaType": "application/gzip", "title": "FAW41222_pass_8a6acd45_89b9b639_79.fastq.gz" }, { "@type": "dcat:Distribution", "downloadURL": "https://ndownloader.figshare.com/files/44456690", "format": "gz", "mediaType": "application/gzip", "title": "FAW41222_pass_8a6acd45_89b9b639_80.fastq.gz" }, { "@type": "dcat:Distribution", "downloadURL": "https://ndownloader.figshare.com/files/44456672", "format": "gz", "mediaType": "application/gzip", "title": "FAW41222_pass_8a6acd45_89b9b639_81.fastq.gz" }, { "@type": "dcat:Distribution", "downloadURL": "https://ndownloader.figshare.com/files/44456612", "format": "gz", "mediaType": "application/gzip", "title": "FAW41222_pass_8a6acd45_89b9b639_82.fastq.gz" }, { "@type": "dcat:Distribution", "downloadURL": "https://ndownloader.figshare.com/files/44456549", "format": "gz", "mediaType": "application/gzip", "title": "FAW41222_pass_8a6acd45_89b9b639_83.fastq.gz" }, { "@type": "dcat:Distribution", "downloadURL": "https://ndownloader.figshare.com/files/44456630", "format": "gz", "mediaType": "application/gzip", "title": "FAW41222_pass_8a6acd45_89b9b639_84.fastq.gz" }, { "@type": "dcat:Distribution", "downloadURL": "https://ndownloader.figshare.com/files/44456561", "format": "gz", "mediaType": "application/gzip", "title": "FAW41222_pass_8a6acd45_89b9b639_85.fastq.gz" }, { "@type": "dcat:Distribution", "downloadURL": "https://ndownloader.figshare.com/files/44456681", "format": "gz", "mediaType": "application/gzip", "title": "FAW41222_pass_8a6acd45_89b9b639_86.fastq.gz" }, { "@type": "dcat:Distribution", "downloadURL": "https://ndownloader.figshare.com/files/44456654", "format": "gz", "mediaType": "application/gzip", "title": "FAW41222_pass_8a6acd45_89b9b639_87.fastq.gz" }, { "@type": "dcat:Distribution", "downloadURL": "https://ndownloader.figshare.com/files/44456627", "format": "gz", "mediaType": "application/gzip", "title": "FAW41222_pass_8a6acd45_89b9b639_88.fastq.gz" }, { "@type": "dcat:Distribution", "downloadURL": "https://ndownloader.figshare.com/files/44456567", "format": "gz", "mediaType": "application/gzip", "title": "FAW41222_pass_8a6acd45_89b9b639_89.fastq.gz" }, { "@type": "dcat:Distribution", "downloadURL": "https://ndownloader.figshare.com/files/44456699", "format": "gz", "mediaType": "application/gzip", "title": "FAW41222_pass_8a6acd45_89b9b639_90.fastq.gz" }, { "@type": "dcat:Distribution", "downloadURL": "https://ndownloader.figshare.com/files/44456639", "format": "gz", "mediaType": "application/gzip", "title": "FAW41222_pass_8a6acd45_89b9b639_91.fastq.gz" }, { "@type": "dcat:Distribution", "downloadURL": "https://ndownloader.figshare.com/files/44456657", "format": "gz", "mediaType": "application/gzip", "title": "FAW41222_pass_8a6acd45_89b9b639_92.fastq.gz" }, { "@type": "dcat:Distribution", "downloadURL": "https://ndownloader.figshare.com/files/44456660", "format": "gz", "mediaType": "application/gzip", "title": "FAW41222_pass_8a6acd45_89b9b639_93.fastq.gz" }, { "@type": "dcat:Distribution", "downloadURL": "https://ndownloader.figshare.com/files/44456663", "format": "gz", "mediaType": "application/gzip", "title": "FAW41222_pass_8a6acd45_89b9b639_94.fastq.gz" }, { "@type": "dcat:Distribution", "downloadURL": "https://ndownloader.figshare.com/files/44456684", "format": "gz", "mediaType": "application/gzip", "title": "FAW41222_pass_8a6acd45_89b9b639_95.fastq.gz" }, { "@type": "dcat:Distribution", "downloadURL": "https://ndownloader.figshare.com/files/44456648", "format": "gz", "mediaType": "application/gzip", "title": "FAW41222_pass_8a6acd45_89b9b639_96.fastq.gz" }, { "@type": "dcat:Distribution", "downloadURL": "https://ndownloader.figshare.com/files/44456669", "format": "gz", "mediaType": "application/gzip", "title": "FAW41222_pass_8a6acd45_89b9b639_97.fastq.gz" }, { "@type": "dcat:Distribution", "downloadURL": "https://ndownloader.figshare.com/files/44456723", "format": "gz", "mediaType": "application/gzip", "title": "FAW41222_pass_8a6acd45_89b9b639_98.fastq.gz" }, { "@type": "dcat:Distribution", "downloadURL": "https://ndownloader.figshare.com/files/44456717", "format": "gz", "mediaType": "application/gzip", "title": "FAW41222_pass_8a6acd45_89b9b639_99.fastq.gz" }, { "@type": "dcat:Distribution", "downloadURL": "https://ndownloader.figshare.com/files/44456744", "format": "gz", "mediaType": "application/gzip", "title": "FAW41222_pass_8a6acd45_89b9b639_100.fastq.gz" }, { "@type": "dcat:Distribution", "downloadURL": "https://ndownloader.figshare.com/files/44456747", "format": "gz", "mediaType": "application/gzip", "title": "FAW41222_pass_8a6acd45_89b9b639_101.fastq.gz" }, { "@type": "dcat:Distribution", "downloadURL": "https://ndownloader.figshare.com/files/44456738", "format": "gz", "mediaType": "application/gzip", "title": "FAW41222_pass_8a6acd45_89b9b639_102.fastq.gz" }, { "@type": "dcat:Distribution", "downloadURL": "https://ndownloader.figshare.com/files/44456729", "format": "gz", "mediaType": "application/gzip", "title": "FAW41222_pass_8a6acd45_89b9b639_103.fastq.gz" }, { "@type": "dcat:Distribution", "downloadURL": "https://ndownloader.figshare.com/files/44456720", "format": "gz", "mediaType": "application/gzip", "title": "FAW41222_pass_8a6acd45_89b9b639_104.fastq.gz" }, { "@type": "dcat:Distribution", "downloadURL": "https://ndownloader.figshare.com/files/44456693", "format": "gz", "mediaType": "application/gzip", "title": "FAW41222_pass_8a6acd45_89b9b639_105.fastq.gz" }, { "@type": "dcat:Distribution", "downloadURL": "https://ndownloader.figshare.com/files/44456762", "format": "gz", "mediaType": "application/gzip", "title": "FAW41222_pass_8a6acd45_89b9b639_106.fastq.gz" }, { "@type": "dcat:Distribution", "downloadURL": "https://ndownloader.figshare.com/files/44456741", "format": "gz", "mediaType": "application/gzip", "title": "FAW41222_pass_8a6acd45_89b9b639_107.fastq.gz" }, { "@type": "dcat:Distribution", "downloadURL": "https://ndownloader.figshare.com/files/44456750", "format": "gz", "mediaType": "application/gzip", "title": "FAW41222_pass_8a6acd45_89b9b639_108.fastq.gz" }, { "@type": "dcat:Distribution", "downloadURL": "https://ndownloader.figshare.com/files/44456753", "format": "gz", "mediaType": "application/gzip", "title": "FAW41222_pass_8a6acd45_89b9b639_109.fastq.gz" }, { "@type": "dcat:Distribution", "downloadURL": "https://ndownloader.figshare.com/files/44456735", "format": "gz", "mediaType": "application/gzip", "title": "FAW41222_pass_8a6acd45_89b9b639_110.fastq.gz" }, { "@type": "dcat:Distribution", "downloadURL": "https://ndownloader.figshare.com/files/44456726", "format": "gz", "mediaType": "application/gzip", "title": "FAW41222_pass_8a6acd45_89b9b639_111.fastq.gz" }, { "@type": "dcat:Distribution", "downloadURL": "https://ndownloader.figshare.com/files/44456732", "format": "gz", "mediaType": "application/gzip", "title": "FAW41222_pass_8a6acd45_89b9b639_112.fastq.gz" }, { "@type": "dcat:Distribution", "downloadURL": "https://ndownloader.figshare.com/files/44456768", "format": "gz", "mediaType": "application/gzip", "title": "FAW41222_pass_8a6acd45_89b9b639_113.fastq.gz" }, { "@type": "dcat:Distribution", "downloadURL": "https://ndownloader.figshare.com/files/44456783", "format": "gz", "mediaType": "application/gzip", "title": "FAW41222_pass_8a6acd45_89b9b639_114.fastq.gz" }, { "@type": "dcat:Distribution", "downloadURL": "https://ndownloader.figshare.com/files/44456780", "format": "gz", "mediaType": "application/gzip", "title": "FAW41222_pass_8a6acd45_89b9b639_115.fastq.gz" }, { "@type": "dcat:Distribution", "downloadURL": "https://ndownloader.figshare.com/files/44456786", "format": "gz", "mediaType": "application/gzip", "title": "FAW41222_pass_8a6acd45_89b9b639_116.fastq.gz" }, { "@type": "dcat:Distribution", "downloadURL": "https://ndownloader.figshare.com/files/44456759", "format": "gz", "mediaType": "application/gzip", "title": "FAW41222_pass_8a6acd45_89b9b639_117.fastq.gz" }, { "@type": "dcat:Distribution", "downloadURL": "https://ndownloader.figshare.com/files/44456798", "format": "gz", "mediaType": "application/gzip", "title": "FAW41222_pass_8a6acd45_89b9b639_118.fastq.gz" }, { "@type": "dcat:Distribution", "downloadURL": "https://ndownloader.figshare.com/files/44456801", "format": "gz", "mediaType": "application/gzip", "title": "FAW41222_pass_8a6acd45_89b9b639_119.fastq.gz" }, { "@type": "dcat:Distribution", "downloadURL": "https://ndownloader.figshare.com/files/44456789", "format": "gz", "mediaType": "application/gzip", "title": "FAW41222_pass_8a6acd45_89b9b639_120.fastq.gz" }, { "@type": "dcat:Distribution", "downloadURL": "https://ndownloader.figshare.com/files/44456765", "format": "gz", "mediaType": "application/gzip", "title": "FAW41222_pass_8a6acd45_89b9b639_121.fastq.gz" }, { "@type": "dcat:Distribution", "downloadURL": "https://ndownloader.figshare.com/files/44456792", "format": "gz", "mediaType": "application/gzip", "title": "FAW41222_pass_8a6acd45_89b9b639_122.fastq.gz" }, { "@type": "dcat:Distribution", "downloadURL": "https://ndownloader.figshare.com/files/44456777", "format": "gz", "mediaType": "application/gzip", "title": "FAW41222_pass_8a6acd45_89b9b639_123.fastq.gz" }, { "@type": "dcat:Distribution", "downloadURL": "https://ndownloader.figshare.com/files/44456807", "format": "gz", "mediaType": "application/gzip", "title": "FAW41222_pass_8a6acd45_89b9b639_124.fastq.gz" }, { "@type": "dcat:Distribution", "downloadURL": "https://ndownloader.figshare.com/files/44456795", "format": "gz", "mediaType": "application/gzip", "title": "FAW41222_pass_8a6acd45_89b9b639_125.fastq.gz" }, { "@type": "dcat:Distribution", "downloadURL": "https://ndownloader.figshare.com/files/44456813", "format": "gz", "mediaType": "application/gzip", "title": "FAW41222_pass_8a6acd45_89b9b639_126.fastq.gz" }, { "@type": "dcat:Distribution", "downloadURL": "https://ndownloader.figshare.com/files/44456819", "format": "gz", "mediaType": "application/gzip", "title": "FAW41222_pass_8a6acd45_89b9b639_127.fastq.gz" }, { "@type": "dcat:Distribution", "downloadURL": "https://ndownloader.figshare.com/files/44456837", "format": "gz", "mediaType": "application/gzip", "title": "FAW41222_pass_8a6acd45_89b9b639_128.fastq.gz" }, { "@type": "dcat:Distribution", "downloadURL": "https://ndownloader.figshare.com/files/44456774", "format": "gz", "mediaType": "application/gzip", "title": "FAW41222_pass_8a6acd45_89b9b639_129.fastq.gz" }, { "@type": "dcat:Distribution", "downloadURL": "https://ndownloader.figshare.com/files/44456756", "format": "gz", "mediaType": "application/gzip", "title": "FAW41222_pass_8a6acd45_89b9b639_130.fastq.gz" }, { "@type": "dcat:Distribution", "downloadURL": "https://ndownloader.figshare.com/files/44456828", "format": "gz", "mediaType": "application/gzip", "title": "FAW41222_pass_8a6acd45_89b9b639_131.fastq.gz" }, { "@type": "dcat:Distribution", "downloadURL": "https://ndownloader.figshare.com/files/44456771", "format": "gz", "mediaType": "application/gzip", "title": "FAW41222_pass_8a6acd45_89b9b639_132.fastq.gz" }, { "@type": "dcat:Distribution", "downloadURL": "https://ndownloader.figshare.com/files/44456855", "format": "gz", "mediaType": "application/gzip", "title": "FAW41222_pass_8a6acd45_89b9b639_133.fastq.gz" }, { "@type": "dcat:Distribution", "downloadURL": "https://ndownloader.figshare.com/files/44456804", "format": "gz", "mediaType": "application/gzip", "title": "FAW41222_pass_8a6acd45_89b9b639_134.fastq.gz" }, { "@type": "dcat:Distribution", "downloadURL": "https://ndownloader.figshare.com/files/44456864", "format": "gz", "mediaType": "application/gzip", "title": "FAW41222_pass_8a6acd45_89b9b639_135.fastq.gz" }, { "@type": "dcat:Distribution", "downloadURL": "https://ndownloader.figshare.com/files/44456810", "format": "gz", "mediaType": "application/gzip", "title": "FAW41222_pass_8a6acd45_89b9b639_136.fastq.gz" }, { "@type": "dcat:Distribution", "downloadURL": "https://ndownloader.figshare.com/files/44456816", "format": "gz", "mediaType": "application/gzip", "title": "FAW41222_pass_8a6acd45_89b9b639_137.fastq.gz" }, { "@type": "dcat:Distribution", "downloadURL": "https://ndownloader.figshare.com/files/44456840", "format": "gz", "mediaType": "application/gzip", "title": "FAW41222_pass_8a6acd45_89b9b639_138.fastq.gz" }, { "@type": "dcat:Distribution", "downloadURL": "https://ndownloader.figshare.com/files/44456873", "format": "gz", "mediaType": "application/gzip", "title": "FAW41222_pass_8a6acd45_89b9b639_139.fastq.gz" }, { "@type": "dcat:Distribution", "downloadURL": "https://ndownloader.figshare.com/files/44456852", "format": "gz", "mediaType": "application/gzip", "title": "FAW41222_pass_8a6acd45_89b9b639_140.fastq.gz" }, { "@type": "dcat:Distribution", "downloadURL": "https://ndownloader.figshare.com/files/44456876", "format": "gz", "mediaType": "application/gzip", "title": "FAW41222_pass_8a6acd45_89b9b639_141.fastq.gz" }, { "@type": "dcat:Distribution", "downloadURL": "https://ndownloader.figshare.com/files/44456885", "format": "gz", "mediaType": "application/gzip", "title": "FAW41222_pass_8a6acd45_89b9b639_142.fastq.gz" }, { "@type": "dcat:Distribution", "downloadURL": "https://ndownloader.figshare.com/files/44456834", "format": "gz", "mediaType": "application/gzip", "title": "FAW41222_pass_8a6acd45_89b9b639_143.fastq.gz" }, { "@type": "dcat:Distribution", "downloadURL": "https://ndownloader.figshare.com/files/44456867", "format": "gz", "mediaType": "application/gzip", "title": "FAW41222_pass_8a6acd45_89b9b639_144.fastq.gz" }, { "@type": "dcat:Distribution", "downloadURL": "https://ndownloader.figshare.com/files/44456879", "format": "gz", "mediaType": "application/gzip", "title": "FAW41222_pass_8a6acd45_89b9b639_145.fastq.gz" }, { "@type": "dcat:Distribution", "downloadURL": "https://ndownloader.figshare.com/files/44456825", "format": "gz", "mediaType": "application/gzip", "title": "FAW41222_pass_8a6acd45_89b9b639_146.fastq.gz" }, { "@type": "dcat:Distribution", "downloadURL": "https://ndownloader.figshare.com/files/44456849", "format": "gz", "mediaType": "application/gzip", "title": "FAW41222_pass_8a6acd45_89b9b639_147.fastq.gz" }, { "@type": "dcat:Distribution", "downloadURL": "https://ndownloader.figshare.com/files/44456882", "format": "gz", "mediaType": "application/gzip", "title": "FAW41222_pass_8a6acd45_89b9b639_148.fastq.gz" }, { "@type": "dcat:Distribution", "downloadURL": "https://ndownloader.figshare.com/files/44456888", "format": "gz", "mediaType": "application/gzip", "title": "FAW41222_pass_8a6acd45_89b9b639_149.fastq.gz" }, { "@type": "dcat:Distribution", "downloadURL": "https://ndownloader.figshare.com/files/44456822", "format": "gz", "mediaType": "application/gzip", "title": "FAW41222_pass_8a6acd45_89b9b639_150.fastq.gz" }, { "@type": "dcat:Distribution", "downloadURL": "https://ndownloader.figshare.com/files/44456831", "format": "gz", "mediaType": "application/gzip", "title": "FAW41222_pass_8a6acd45_89b9b639_151.fastq.gz" }, { "@type": "dcat:Distribution", "downloadURL": "https://ndownloader.figshare.com/files/44456846", "format": "gz", "mediaType": "application/gzip", "title": "FAW41222_pass_8a6acd45_89b9b639_152.fastq.gz" }, { "@type": "dcat:Distribution", "downloadURL": "https://ndownloader.figshare.com/files/44456858", "format": "gz", "mediaType": "application/gzip", "title": "FAW41222_pass_8a6acd45_89b9b639_153.fastq.gz" }, { "@type": "dcat:Distribution", "downloadURL": "https://ndownloader.figshare.com/files/44456843", "format": "gz", "mediaType": "application/gzip", "title": "FAW41222_pass_8a6acd45_89b9b639_154.fastq.gz" }, { "@type": "dcat:Distribution", "downloadURL": "https://ndownloader.figshare.com/files/44456861", "format": "gz", "mediaType": "application/gzip", "title": "FAW41222_pass_8a6acd45_89b9b639_155.fastq.gz" }, { "@type": "dcat:Distribution", "downloadURL": "https://ndownloader.figshare.com/files/44456870", "format": "gz", "mediaType": "application/gzip", "title": "FAW41222_pass_8a6acd45_89b9b639_156.fastq.gz" }, { "@type": "dcat:Distribution", "downloadURL": "https://ndownloader.figshare.com/files/44456906", "format": "gz", "mediaType": "application/gzip", "title": "FAW41222_pass_8a6acd45_89b9b639_157.fastq.gz" }, { "@type": "dcat:Distribution", "downloadURL": "https://ndownloader.figshare.com/files/44456894", "format": "gz", "mediaType": "application/gzip", "title": "FAW41222_pass_8a6acd45_89b9b639_158.fastq.gz" }, { "@type": "dcat:Distribution", "downloadURL": "https://ndownloader.figshare.com/files/44456903", "format": "gz", "mediaType": "application/gzip", "title": "FAW41222_pass_8a6acd45_89b9b639_159.fastq.gz" }, { "@type": "dcat:Distribution", "downloadURL": "https://ndownloader.figshare.com/files/44456897", "format": "gz", "mediaType": "application/gzip", "title": "FAW41222_pass_8a6acd45_89b9b639_160.fastq.gz" }, { "@type": "dcat:Distribution", "downloadURL": "https://ndownloader.figshare.com/files/44456918", "format": "gz", "mediaType": "application/gzip", "title": "FAW41222_pass_8a6acd45_89b9b639_161.fastq.gz" }, { "@type": "dcat:Distribution", "downloadURL": "https://ndownloader.figshare.com/files/44456915", "format": "gz", "mediaType": "application/gzip", "title": "FAW41222_pass_8a6acd45_89b9b639_162.fastq.gz" }, { "@type": "dcat:Distribution", "downloadURL": "https://ndownloader.figshare.com/files/44456909", "format": "gz", "mediaType": "application/gzip", "title": "FAW41222_pass_8a6acd45_89b9b639_163.fastq.gz" }, { "@type": "dcat:Distribution", "downloadURL": "https://ndownloader.figshare.com/files/44456921", "format": "gz", "mediaType": "application/gzip", "title": "FAW41222_pass_8a6acd45_89b9b639_164.fastq.gz" }, { "@type": "dcat:Distribution", "downloadURL": "https://ndownloader.figshare.com/files/44456891", "format": "gz", "mediaType": "application/gzip", "title": "FAW41222_pass_8a6acd45_89b9b639_165.fastq.gz" }, { "@type": "dcat:Distribution", "downloadURL": "https://ndownloader.figshare.com/files/44456924", "format": "gz", "mediaType": "application/gzip", "title": "FAW41222_pass_8a6acd45_89b9b639_166.fastq.gz" }, { "@type": "dcat:Distribution", "downloadURL": "https://ndownloader.figshare.com/files/44456930", "format": "gz", "mediaType": "application/gzip", "title": "FAW41222_pass_8a6acd45_89b9b639_167.fastq.gz" }, { "@type": "dcat:Distribution", "downloadURL": "https://ndownloader.figshare.com/files/44456900", "format": "gz", "mediaType": "application/gzip", "title": "FAW41222_pass_8a6acd45_89b9b639_168.fastq.gz" }, { "@type": "dcat:Distribution", "downloadURL": "https://ndownloader.figshare.com/files/44456927", "format": "gz", "mediaType": "application/gzip", "title": "FAW41222_pass_8a6acd45_89b9b639_169.fastq.gz" }, { "@type": "dcat:Distribution", "downloadURL": "https://ndownloader.figshare.com/files/44456912", "format": "gz", "mediaType": "application/gzip", "title": "FAW41222_pass_8a6acd45_89b9b639_170.fastq.gz" }, { "@type": "dcat:Distribution", "downloadURL": "https://ndownloader.figshare.com/files/44456933", "format": "gz", "mediaType": "application/gzip", "title": "FAW41222_pass_8a6acd45_89b9b639_171.fastq.gz" }, { "@type": "dcat:Distribution", "downloadURL": "https://ndownloader.figshare.com/files/44456939", "format": "gz", "mediaType": "application/gzip", "title": "FAW41222_pass_8a6acd45_89b9b639_172.fastq.gz" }, { "@type": "dcat:Distribution", "downloadURL": "https://ndownloader.figshare.com/files/44456936", "format": "gz", "mediaType": "application/gzip", "title": "FAW41222_pass_8a6acd45_89b9b639_173.fastq.gz" }, { "@type": "dcat:Distribution", "downloadURL": "https://ndownloader.figshare.com/files/44456426", "format": "gz", "mediaType": "application/gzip", "title": "FAW41222_pass_8a6acd45_89b9b639_174.fastq.gz" }, { "@type": "dcat:Distribution", "downloadURL": "https://ndownloader.figshare.com/files/44456942", "format": "gz", "mediaType": "application/gzip", "title": "FAW41222_pass_8a6acd45_89b9b639_0.fastq.gz" }, { "@type": "dcat:Distribution", "downloadURL": "https://ndownloader.figshare.com/files/44456948", "format": "gz", "mediaType": "application/gzip", "title": "FAW41222_pass_8a6acd45_89b9b639_1.fastq.gz" }, { "@type": "dcat:Distribution", "downloadURL": "https://ndownloader.figshare.com/files/44456945", "format": "gz", "mediaType": "application/gzip", "title": "FAW41222_pass_8a6acd45_89b9b639_2.fastq.gz" } ], "license": "https://www.usa.gov/publicdomain/label/1.0/", "bureauCode": [ "005:18" ], "modified": "2024-03-21", "publisher": { "@type": "org:Organization", "name": "Agricultural Research Service" }, "keyword": [ "long-read sequencing", "Escherichia coli O157:H7", "food safety", "food testing", "meat" ] }, { "identifier": "10113/AA24933", "accessLevel": "public", "contactPoint": { "hasEmail": "mailto:Virginia.Jin@ars.usda.gov", "fn": "Jin, Virginia" }, "programCode": [ "005:040" ], "description": "Long-term Crop Rotation Study for Greenhouse gas Reduction through Agricultural Carbon Enhancement network in Lincoln, Nebraska\nLincoln NE Long-term Crop Rotation Project Overview of NEMLTCRS: Long-term Crop Rotation Study (Ithaca, NE) Crop rotation and fertilizer N management are common practices that affect productivity and input use efficiency. Evaluating these practices in a long-term setting provides the opportunity to assess their influence across a wide range of growing conditions and to determine their effect on yield stability (performance across a wide range of environmental conditions). Previous publications from this experiment have evaluated the response of corn, soybean, and sorghum production to these treatments under conventional tillage during an earlier time period (e.g., Peterson and Varvel, 1989a,b,c; Varvel, 2000), concluding that diversified crop rotations generally enhance grain production. Following conversion to no-till, yield trends from 2007 to 2013 indicate that: • Diversified 2- and 4-yr crop rotations increased corn and grain sorghum yields. • Corn and grain sorghum grain yields in 2- and 4-yr rotations were more resilient to variable growing conditions.• Soybean was less sensitive than corn and grain sorghum to crop rotation. Excerpted from: Sindelar et al., 2016 (Agron. J. 108: 1592-1602) viewed as an unfassirable management practice in soybean because it can inhibit nodular:ion (Salvagiotti et aL. 2008). However. responses to early-season fertilizer N are inconsistent. For example. Varvd and Peterson (1992) reported a decrease with fertilizer N input. yet Osborne and Riedell (2006) reported a grain yield increase with fertilizer N addition. Therefore. additional work is needed to clarify this particular response of soybean to early-season N fenilization. Crop rotation and fertilizer N management arc common practices that affect productivity and input use efficiency. Evaluating these practices in a long-term setting provides the opportunity to assess their influence across a wide range of growing conditions and to determine their effect on yield stability (performance across a wide range of environmental conditions). Previous publications from this experiment have evaluated the response acorn. soybean. and sorghum produc-tion to these treatments under conventional tillage during an earlier time period (e.g.. Peterson and VarveL 1989a.b.c: Varvel. 2000). concluding that diversified crop rotations gener-ally enhance grain production. Information has not yet been reported from this study naluacing the treatments under no-till (2007-2013). To our knowledge. no studies have simul-taneously evaluated the stability of continuous and diversified rotations of corn. grain sorghum. and soybean. The objective of this study was to evaluate long-term yield performance. yield stability. and fertilizer N of corn. grain sorghum. and soybean as affected by crop rotation and fertilizer N under no-till in the western Corn Belt. MATERIALS AND METHODS A field experiment was established in 1972 on a Yuan silty clay loam-Tomek salt barn compkx (fine-silty. mired. supaac-tire. mesic Mollie Hapkidalfs and fine. smecutic. mimic Pachic Argiudolls. resik.l.didy) near Ithaca. NE (31•10'N. 96'25'W). Elevation of the site is 366 rn. and mean annual temperature and precipitation arc 10.5*C and 765 mm. respectively. In-season air temperature. soil temperature. precipitation. and open pan evaporation measured on-site during this time period arc shown in Tabk I. The experiment was a randomized complete block design in a split plot arrangement with five replications. Crop rotation was the main ploc, and fertilizer N rate was the split plot. Crop rotations included continuous crops (continuous corn (CC). continuous grain sorghum IGGI. and continuous soybean (SS]). 2-yr (CS and OS) and 4-yr crop rotations (corn-soybean-grain sorghum-ad/clover vocation ((:5C01 and corn-cut/clover - grain sorghum-soybean rotation (COGS]). Continuous rota-tions that also included a fallow treatment were established in 1972 (with three replications). In 1983. the 2- and 4-yr rotation treatments were added. fallow treaunenrs were dropped. and the experiment was expanded to five replications. For the 4-yr rota-tions, all crops were present in the roudon, but the sequences differed. Each phase of every crop rotation was present each year. Fertilizer N treatments were initiated in 1984 and included 0. 90. and 180 kg N ha-1 for corn and grain sorghum and 0.34. and 69 kg N ha-I for soybean and oat/clover. Split plots were 9 m wide (76-an nivrs.n = 12) and 10 m king. The study was annu-ally disked mice in the spring from 1983 until 2006. In 2007. the study was converted to no-till.Agronomy Journal • Volume 108. Issue 4 • 2016 1593.
Resource Title: GeoData catalog record.
File Name: Web Page, url: https://geodata.nal.usda.gov/geonetwork/srv/eng/catalog.search#/metadata/aff301fc-8105-4248-ab72-8add051a222e
See the record in the GeoData catalog for additional materials and methods about this dataset, as well as links to data files:\nhttps://geodata.nal.usda.gov/geonetwork/srv/eng/catalog.search#/metadata/7685b3e7-5006-4c9c-a0ff-3562aa837985
", "title": "Long-term Crop Rotation Study for Greenhouse gas Reduction through Agricultural Carbon Enhancement network in Lubbock, Texas", "distribution": [ { "@type": "dcat:Distribution", "downloadURL": "https://geodata.nal.usda.gov/geonetwork/srv/eng/catalog.search#/metadata/7685b3e7-5006-4c9c-a0ff-3562aa837985", "mediaType": "text/html", "title": "https://geodata.nal.usda.gov/geonetwork/srv/eng/catalog.search#/metadata/7685b3e7-5006-4c9c-a0ff-3562aa837985" } ], "license": "https://www.usa.gov/publicdomain/label/1.0/", "bureauCode": [ "005:18" ], "modified": "2023-11-30", "publisher": { "@type": "org:Organization", "name": "Agricultural Research Service" }, "accrualPeriodicity": "irregular", "keyword": [ "farming", "NP212", "crop rotation", "carbon enhancement network", "greenhouse gas reduction", "long term agriculture study", "agricultural carbon", "data.gov", "ARS" ], "spatial": "{\"type\": \"Polygon\", \"coordinates\": [[[-101.769359, 33.6849], [-101.767286, 33.6849], [-101.767286, 33.683784], [-101.769359, 33.683784], [-101.769359, 33.6849]]]}" }, { "identifier": "10.15482/USDA.ADC/1503991", "accessLevel": "public", "contactPoint": { "hasEmail": "mailto:Virginia.Jin@ars.usda.gov", "fn": "Jin, Virginia" }, "programCode": [ "005:040" ], "description": "Long-term tillage and cropping system experiment for Greenhouse gas Reduction through Agricultural Carbon Enhancement network and Nutrient Use and Outcome Network in Lincoln, Nebraska\nLincoln NE Long-term Tillage Project Overview of NELITCSE: Long-term Tillage and Cropping System Experiment (Lincoln, NE) The objectives of this experiment is to evaluate the agronomic and environmental impacts of long-term tillage and crop rotation practices in a rainfed agroecosystem. This experiment was initiated in 1981 with continuous corn only under six tillage practices (chisel, tandem disk, moldboard plow, no-till, ridge-tillage, and subsoil tillage). In 1985, the experimental design was modified to include 3 crop rotation systems (continuous corn, corn-soybean, and continuous soybean) under 6 tillage practices. Each year, both the corn phase and soybean phase of the two-year rotation system are present. In 2015, all tillage practices were converted to no-till to evaluate the magnitude, direction, and rate of agronomic and soil changes to this management shift. In addition, the continuous soybean system was converted to continuous corn with a 3-species winter cover crop (hairy vetch, purple-topped radish, and cereal rye). Prepared 13 Sep 2016 (V. Jin)
Resource Title: Lincoln, NE Long-term tillage and cropping system experiment (NELITCSE) CSV data.
File Name: NELITCSE_csv_data.zip
Resource Description: CSV format data on Experimental Units, Field Sites, Nutrient Efficiency, Residue Management, Soil Chemistry, Soil Physics, Amendments, Planting, Tillage, Persons, Treatments, Weather Daily, Weather Station.
Part of the Animal Improvement Program, The MTDFREML programs are distributed in a text form sent as a set of attachments. Two different versions are currently supported, with the primary difference being the timing routines. The \"PC\" version uses the timing routines from the Microsoft Powerstation Fortran compiler. These routines are supported in the Digital/Compaq \"upgrade\" to that compiler, the Visual Fortran compiler. The other version has timing routines disabled. Please specify which version you would like when requesting the software.
\nThe sparse routines are a modified and reduced version of the Sparspak routines developed and modified by Alan George at University of Waterloo This modification included dealing with singular matrices, adapting the developments that Steve Kachman implemented in the original version. These new routines for use only with the MTDFREML programs. Please make sure to let us know if you are using the program. This can be done in several ways. Fill out the user information form on the world wide web home page or to FTP, complete, and mail or e-mail the userinfo.txt file.
\nIn order to keep track of researchers using MTDFREML programs are e-mailed on request. This allows us to contact users in the case of bugs or upgrades. Please send an e-mail to Dale Van Vleck requesting a copy of the software.
Resource Title: MTDFREML.
File Name: Web Page, url: https://aipl.arsusda.gov/software/mtdfreml/mtdfreml.html
download and information page
A set of FORTRAN programs to implement a multiple-trait Gibbs sampling algorithm for (co)variance component inference in animal models (MTGSAM) was developed. The MTGSAM programs are available to the public. The programs support models with correlated genetic effects and arbitrary numbers of covariates, fixed effects, and independent random effects for each trait. Any combination of missing traits is allowed. The programs were used to estimate variance components for 50 replicates of simulated data. Each replicate consisted of 50 animals of each sex in each of four generations, for 400 animals in each replicate for two traits. For MTGSAM, informative prior distributions for variance components were inverted Wishart random variables with 10 df and means equal to the simulation parameters. A total of 15,000 Gibbs sampling rounds were completed for each replicate, with 2,000 rounds discarded for burn-in. For multiple-trait derivative free restricted maximum likelihood (MTDFREML), starting values for the variance components were the simulation parameters. Averages of posterior mean of variance components estimated using MTGSAM with informative and flat prior distributions for variance components and REML estimates obtained using MTDFREML indicated that all three methods were empirically unbiased. Correlations between estimates from MTGSAM using flat priors and MTDFREML all exceeded .99.
Resource Title: MTGSAM: Multiple-Trait Gibbs Sampler for Animal Models.
File Name: Web Page, url: https://aipl.arsusda.gov/software/mtgsam/mtdgsam.html
download and information page
The ‘Management Strategies for Soil Quality’ study was established in 1993 by Dr. Don Tanaka (USDA-ARS-NGPRL) to evaluate long-term impacts of minimum and no-till cropping systems on crop yield, precipitation use, and soil properties. The study was designed with six crop sequences (whole plot) each split by tillage type (split plot). All phases of each crop sequence are present every year, and treatments are replicated three times.
\nSee record in the GeoData catalog at https://geodata.nal.usda.gov/geonetwork/srv/eng/catalog.search#/metadata/dda43934-b75f-46da-b48e-81be1317b79b for more information and links to the data resources.
", "title": "MaLi Fallow Study for Greenhouse gas Reduction through Agricultural Carbon Enhancement network in Mandan, North Dakota", "distribution": [ { "@type": "dcat:Distribution", "downloadURL": "https://geodata.nal.usda.gov/geonetwork/srv/eng/catalog.search#/metadata/dda43934-b75f-46da-b48e-81be1317b79b", "mediaType": "text/html", "title": "https://geodata.nal.usda.gov/geonetwork/srv/eng/catalog.search#/metadata/dda43934-b75f-46da-b48e-81be1317b79b" } ], "license": "https://www.usa.gov/publicdomain/label/1.0/", "bureauCode": [ "005:18" ], "modified": "2024-02-13", "publisher": { "@type": "org:Organization", "name": "Agricultural Research Service" }, "accrualPeriodicity": "irregular", "keyword": [ "farming", "NP212", "soil quality", "greenhouse gases", "agricultural carbon", "no-till cropping system", "crop yield", "Precipitation", "Soil", "crop sequences", "soil organic carbon", "carbon sequestration", "global warming", "soil respiration", "gas emissions", "Grasslands", "carbon dioxide", "livestock production", "pastures", "Agropyron desertorum", "cattle", "botanical composition", "grazing management", "nitrogen fertilizers", "nitrous oxide", "Rangelands", "pasture plants", "methane", "grazing intensity", "indigenous species", "North Dakota", "data.gov", "ARS" ], "spatial": "{\"type\": \"Polygon\", \"coordinates\": [[[-100.94999, 46.772343], [-100.948473, 46.772343], [-100.948473, 46.77038], [-100.94999, 46.77038], [-100.94999, 46.772343]]]}" }, { "identifier": "10113/AA13285", "accessLevel": "public", "contactPoint": { "hasEmail": "mailto:carson.andorf@ars.usda.gov", "fn": "Andorf, Carson" }, "programCode": [ "005:040" ], "description": "The Maize Genetics Cooperation Stock Center is operated by USDA/ARS, located at the University of Illinois, Urbana/Champaign, and integrated with the National Plant Germplasm System (NPGS). The center serves the maize research community by collecting, maintaining and distributing seeds of maize genetic stocks, and providing information about maize stocks and the mutations they carry through the Maize Genetics and Genomics Database (MaizeGDB). Users can browse to obtain detailed information about the following stocks:
\nStock records include information on availability, annotations, related records (genotypic variations, phenotypes), GRIN (Germplasm Resources Information Network) information, and offsite resources.
\nResource Title: Maize Genetics Cooperation Stock Center Catalog of Stocks web link.
File Name: Web Page, url: https://www.maizegdb.org/stock_catalog
A tool in the MaizeGDB system.
MaizeGDB is a community-oriented, long-term, federally funded informatics service to researchers focused on the crop plant and model organism Zea mays. Genomic, genetic, sequence, germplasm, gene product, metabolic pathways, functional characterization, literature reference, diversity, and expression are among the datatypes stored at MaizeGDB. At the project's website are custom interfaces enabling researchers to browse data and to seek out specific information matching explicit search criteria. First released in 1991 with the name MaizeDB, the Maize Genetics and Genomics Database, now MaizeGDB (since 2003), is funded, developed, and hosted by the USDA-ARS located at Ames, Iowa.
Resource Title: MaizeGDB, the community database for maize genetics and genomics..
File Name: Web Page, url: https://maizegdb.org/
MaizeGDB is a community-oriented, long-term, federally funded informatics service to researchers focused on the crop plant and model organism Zea mays. Established as a USDA-ARS resource in 2003, MaizeGDB supplies data and resources related to maize. The types of data include genomic, genetic, sequence, germplasm, gene product, metabolic pathways, functional characterization, literature reference, diversity, and expression.
\n
Management Zone Analyst (MZA) is a decision-aid for creating within-field management zones based on quantitative field information. It mathematically breaks up a field into natural clusters or zones based on the classification parameters and number of zones you specify.
\nFertilizing crops more than they need increases the risk of nutrient contamination of water resources. Because many crop production fields are spatially variable in both soil nutrients and crop nutrient need, conventional uniform fertilizer rates often exceed requirements for some field areas. To better match applications to needs and improve nutrient use efficiency, cost-effective and efficient methods are needed to delineate sub-field management zones within which crop fertilizer needs are more uniform. In field-scale studies, we found that densely-spaced measurements of apparent soil electrical conductivity and GPSdetermined elevation were the most useful data for creating management zones related to potential crop productivity and nutrient need for claypan and claypan-like soils in the U.S. Midwest. Zones created from these sources were much more strongly related to yield map data than were traditional soil surveys. In response to requests from farmers and consultants, we developed a decision aid, Management Zone Analyst (MZA), to help them quickly process map information into management zones for variable-rate nutrient applications. The MZA software uses quantitative, georeferenced field information to mathematically divide a field into natural clusters or zones and also helps determine the optimum number of management zones for each field. Our approaches and software are widely used by researchers, commodity organization representatives, and agricultural consultants from at least 39 states and 35 foreign countries.
\nResource Title: Management Zone Analyst Version 1.0 Software.
File Name: Web Page, url: https://www.ars.usda.gov/research/software/download/?softwareid=24&modecode=50-70-10-00
download page
This dataset contains manual annotations from Rhyzopertha dominica community curators, based on genome assembly RdoDt3_Drdd8_decomES.fasta.gz. These annotations are direct exports from Apollo 2.6 (https://doi.org/10.5281/zenodo.5015109), hosted by the i5k Workspace@NAL (https://i5k.nal.usda.gov/). Manual annotations are temporary and will be reviewed by the i5k Workspace@NAL and submitted to NCBI's GenBank database after review.
Resource Title: Manual annotations of Rhyzopertha dominica genome assembly RdoDt3_Drdd8_decomES.
File Name: Rhyzopertha-dominica-manual-annotations-presubmission.tar.gz
Resource Description: The files contained within this directory are manual annotations from the Rhyzopertha dominica genome assembly RdoDt3_Drdd8_decomES.fasta.gz. These annotations are direct exports from Apollo 2.6, hosted by the i5k Workspace@NAL. Manual annotations are temporary and will be reviewed by the i5k Workspace@NAL and submitted to NCBI's GenBank database after review.
\nNutrient recycling is fundamental to sustainable agricultural systems, but few mechanisms exist to ensure that surplus manure nutrients from animal feeding operations are transported for use on nutrient-deficient croplands. As a result, manure nutrients concentrate in locations where they can threaten environmental health and devalue manure as a fertilizer resource. This data set is from a study advances the concept of the “manureshed” – the lands surrounding animal feeding operations onto which manure nutrients can be redistributed to meet environmental, production, and economic goals. Manuresheds can be managed at multiple scales, for example, on farms with both animals and crops, among animal farms and crop farms within a county, or even among animal farms and crop farms in distant counties. With a focus on redistribution among counties, we classified the 3109 counties of the contiguous United States by their capacity to either supply manure phosphorus (P) and nitrogen (N) from confined livestock production (“sources”) or to assimilate and remove excess P and N via crops (“sinks”) [see data for N tonnes, P tonnes, N kg/ha, P kg/ha]. Manure nutrient source counties were identified in 40 of the 48 states, with a substantial concentration in the southern US. Source counties for manure P greatly outnumbered source counties for manure N (390 vs. 100), and 99 of the 100 manure N source counties were also source counties for manure P. Conversely, sink counties for manure N outnumbered sink counties for manure P (2766 vs. 2317). We used the P balances of the source and sink counties to delineate four manuresheds dominated by various combinations of confined hog, poultry, dairy, and beef industries [see data for Manuresheds (tonnes)]. The four manuresheds differed in the transport distances needed to assimilate excess manure P from their respective source areas (from 147 ± 51 km for a beef dominated manureshed to 368 ± 140 km for a poultry dominated manureshed), highlighting the need for systems-level strategies to promote manure nutrient recycling that operate across local, county, regional, and national scales.
Resource Title: Agricultural Collaborative Research Outcomes System (AgCROS) and Manureshed link.
File Name: manureshed.zip
Resource Description: AgCROS: https://agcros-usdaars.opendata.arcgis.com/
\nManureshed: https://usdaars.maps.arcgis.com/apps/MapSeries/index.html?appid=881305934d62494bbbeeb5f36b735eb9
The MANAGE (Measured Annual Nutrient loads from AGricultural Environments) database was developed to be a readily-accessible, easily-queried database of site characteristic and field-scale nutrient export data (Harmel et al., 2006). Initial funding for MANAGE was provided by USDA-ARS to support the USDA Conservation Effects Assessment Project (CEAP) and the Texas State Soil and Water Conservation Board as part of their mission to understand and mitigate agricultural impacts on water quality.
\nThe original version of MANAGE, which drew heavily from an early 1980’s compilation of nutrient export data (Reckhow et al., 1980; Beaulac, 1980; Beaulac and Reckhow, 1982), created an electronic database with nutrient load data and corresponding site characteristics from 40 studies on agricultural (cultivated and pasture/range) land uses. The first revision in 2008 added N and P load data from 15 additional studies along with N and P runoff concentration data for all 55 studies (Harmel et al., 2008). The second revision in 2016 added 30 runoff studies from forested land uses, 91 drainage water quality studies from drained land, and 12 additional runoff studies from cultivated and pasture/range (Christianson and Harmel, 2015; Harmel et al., 2016). In this expansion, fertilizer application timing, crop yield, and N and P uptake data were added to facilitate analysis of 4R Nutrient Stewardship. The latest revision (Harmel et al., 2022) added 27 studies and Level II ecoregion delineations for each of the 94 studies such that data are now available from 11 of the 50 North American Level II ecoregions, representing the major U.S. agricultural regions.
\nWith these updates, MANAGE contains data from a vast majority of published peer-reviewed N and P export studies on homogeneous cultivated, pasture/range, and forested land uses in the US under natural rainfall-runoff conditions, as well as artificially drained agricultural land. Thus MANAGE facilitates expanded spatial analyses and improved understanding of regional differences, management practice effectiveness, and impacts of land use conversions and management techniques, and it provides valuable data for modeling and decision-making related to agricultural runoff.
\nThe Manage Database v5 04-04-2018 zip file resource superseded the previously available v4 and was added to this record on May 30, 2018.
\nResource MANAGE Database v6 added Nov 17, 2022.
Resource Title: Manage Database v5 04-04-2018.
File Name: MANAGEv5 4-4-18.zip
Resource Description: Contains the MANAGE v5 Microsoft Access Database
Resource Title: MANAGE Database v6.
File Name: MANAGEv6 11-17-21.accdb
Resource Description: Contains the MANAGE v6 Microsoft Access database.
\nZip file containing Access database: managev4ag+forest+yield+drain4-1-16.accdb
Meta-data from over 100 studies that examined induction of plant phenolic compounds following colonization by insects or microbial organisms (both pathogens and beneficials). This meta-data was used in a meta-analysis to observe that both insects and microbes consistently induce phenolic production. The meta-data covers publications that range from 2008 to 2017.
Resource Title: Meta-data for Phenolic Induction by Insects and Microbes.
File Name: PhenolicInductionMetadata.xlsx
Resource Description: Meta-data of phenolic induction, including plant host induction of total phenolics, flavonoids, and hydroxycinnamic acid derivatives, in response to insect and microbe (including pathogens and beneficials) from articles ranging from 2008 to 2017
Data reported in the csv files are gridded monthly time-series used in the article “Sohoulande, C.D., Martin, J., Szogi, A. and Stone, K., 2020. Climate-Driven Prediction of Land Water Storage Anomalies: An Outlook for Water Resources Monitoring Across the Conterminous United States. Journal of Hydrology, p.125053”.
\nThe study focused on the conterminous United States (CONUS) which extends over a region of contrasting climates with an uneven distribution of freshwater resources. Under climate change, an exacerbation of the contrast between dry and wet regions is expected across the CONUS and could drastically affect local ecosystems, agriculture practices, and communities. Hence, efforts to better understand long-term spatial and temporal patterns of freshwater resources are needed to plan and anticipate responses. Since 2002, the Gravity Recovery and Climate Experiment (GRACE) and GRACE Follow-On (GRACE-FO) satellite observations provide estimates of large-scale land water storage changes with an unprecedented accuracy. However, the limited lifetime and observation gaps of the GRACE mission have sparked research interest for GRACE-like data reconstruction. The study developed a predictive modeling approach to quantify monthly land liquid water equivalence thickness anomaly (LWE) using climate variables including total precipitation (PRE), number of wet day (WET), air temperature (TMP), and potential evapotranspiration (PET). The approach builds on the achievements of the GRACE mission by determining LWE footprints using a multivariate regression on principal components model with lag signals. Methods are described in the manuscript https://doi.org/10.1016/j.jhydrol.2020.125053. Descriptions corresponding to each figure and table in the manuscript are placed in the Read Me.docx file that is included as part of the Dryad dataset.
Resource Title: Link to Climate-driven prediction of land water storage anomalies dataset at datadryad.org.
File Name: Web Page, url: https://doi.org/10.5061/dryad.qnk98sfdz
These research data are associated with the manuscript entitled “Climate-driven prediction of land water storage anomalies: An outlook for water resources monitoring across the conterminous United States” (https://doi.org/10.1016/j.jhydrol.2020.125053). The study focused on the conterminous United States (CONUS) which extends over a region of contrasting climates with an uneven distribution of freshwater resources. Under climate change, an exacerbation of the contrast between dry and wet regions is expected across the CONUS and could drastically affect local ecosystems, agriculture practices, and communities. Hence, efforts to better understand long-term spatial and temporal patterns of freshwater resources are needed to plan and anticipate responses. Since 2002, the Gravity Recovery and Climate Experiment (GRACE) and GRACE Follow-On (GRACE-FO) satellite observations provide estimates of large-scale land water storage changes with an unprecedented accuracy. However, the limited lifetime and observation gaps of the GRACE mission have sparked research interest for GRACE-like data reconstruction. This study developed a predictive modeling approach to quantify monthly land liquid water equivalence thickness anomaly (LWE) using climate variables including total precipitation (PRE), number of wet day (WET), air temperature (TMP), and potential evapotranspiration (PET). The approach builds on the achievements of the GRACE mission by determining LWE footprints using a multivariate regression on principal components model with lag signals. The performance evaluation of the model with a lag signals consideration shows 0.5 ≤ R2 ≤ 0.8 for 41.2% of the CONUS. However, the model’s predictive power is unevenly distributed. The model could be useful for predicting and monitoring freshwater resources anomalies for the locations with high model performances. The processed data used as inputs in the study are here provided including the GIS files of the different maps reported.
This is digital research data corresponding to a published manuscript in \"Comparative studies on water- and vapor-based hydrothermal carbonization: process analysis\" Energies 2020, 13, 5733. Dataset may be assessed via the included link at the Dryad data repository.
\nHydrothermal carbonization (HTC) reactor systems used to convert wet organic wastes into value-added hydrochar are generally classified in the literature as liquid water-based (HTC) or vapor-based (VTC). However, the distinction between the two is often ambiguous. In this paper, we theoretically developed models for predicting reactor pressure, volume fraction of liquid water and water distribution between phases as a function of temperature.
\nMethods are described in the manuscript http://dx.doi.org/10.3390/en13215733. Descriptions corresponding to each figure and table in the manuscript are placed on separate tabs to clarify abbreviations and summarize the data headings and units.
", "title": "Metadata for: Comparative studies on water- and vapor-based hydrothermal carbonization: process analysis", "distribution": [ { "@type": "dcat:Distribution", "downloadURL": "https://datadryad.org/stash/dataset/doi:10.5061/dryad.msbcc2g3b", "mediaType": "text/html", "title": "https://datadryad.org/stash/dataset/doi:10.5061/dryad.msbcc2g3b" } ], "license": "https://www.usa.gov/publicdomain/label/1.0/", "bureauCode": [ "005:18" ], "modified": "2024-02-22", "publisher": { "@type": "org:Organization", "name": "Agricultural Research Service" }, "keyword": [ "environmental engineering", "hydrothermal carbonization", "phase distribution of water", "process conditions", "reactor pressure", "vapothermal carbonization", "NP212", "data.gov", "ARS" ], "spatial": "{\"type\": \"Polygon\", \"coordinates\": [[[-79.813785552979, 34.241776560779], [-79.813785552979, 34.243266575285], [-79.811360836029, 34.243266575285], [-79.811360836029, 34.241776560779], [-79.813785552979, 34.241776560779]]]}" }, { "identifier": "10.5061/dryad.xpnvx0kpf", "accessLevel": "public", "contactPoint": { "hasEmail": "mailto:kyoung.ro@usda.gov", "fn": "Ro, Kyoung S" }, "programCode": [ "005:040" ], "description": "This is digital research data corresponding to a published manuscript in \"Pilot-scale H2S and swine odor removal system using commercially available biochar\" Agronomy 2021, 11, 1611. Dataset may be assessed via the included link at the Dryad data repository.
Although biochars made in laboratory seem to remove H2S and odorous compounds effectively, very few studies are available for commercial biochars. This study evaluated the efficacy of a commercial biochar (CBC) for removing H2S.
Methods are described in the manuscript https://www.mdpi.com/2073-4395/11/8/1611. Descriptions corresponding to each figure and table in the manuscript are placed on separate tabs to clarify abbreviations and summarize the data headings and units.
The data file, Table1-4Fig3-5.xslx is an Excel spreadsheet consisting of multiple sub-tabs which are associated with Tables 1, 2, 3, and 4, Figures 3, 4, and 5.
Tab “Table1” – raw data for physico-chemical characteristics of the commercial pine biochar for Table 1
Tab “Table2” – raw data for laboratory absorption column variables for Table 1. For dry or humid conditions, “Dry” or “Humid” is headed for each parameter name.
Tab “Table3” - analytical results for odorous volatile organic compounds for 21 days of operation for Table 3. To avoid the complexity, the single values are not repeated in the data. For the multiple raw data for influent and effluent concentrations of the organic compounds larger than the detection limits are presented in this worksheet.
Tab “Table4” – raw data (RH, influent and effluent concentrations) for adsorption of H2S using the pilot biochar system for Table 4. All effluent concentrations were below detection limit and not listed.
Tab “Fig 3”- raw data for observed pressure drops ratios predicted by Ergun and Classen equations, i.e.,(Ergon) /(Obs) or(Classen) /(Obs), for various gas velocities (U = 0.41, 0.025, 0.164, and 0.370 m/s) in Figure 3.
Tab “Fig4” – breakthrough sorption capacity data for two different inlet concentrations (25 and 100 ppm) used for Figure 4
Tab “Fig5” – raw data for daily sum of influent and effluent SCOAVs used for Figure 5
", "title": "Metadata for: Pilot-scale H2S and swine odor removal system using commercially available biochar", "distribution": [ { "@type": "dcat:Distribution", "downloadURL": "https://doi.org/10.5061/dryad.xpnvx0kpf", "mediaType": "text/html", "title": "https://doi.org/10.5061/dryad.xpnvx0kpf" } ], "license": "https://creativecommons.org/publicdomain/zero/1.0/", "bureauCode": [ "005:18" ], "modified": "2024-06-25", "publisher": { "@type": "org:Organization", "name": "Agricultural Research Service" }, "accrualPeriodicity": "irregular", "keyword": [ "livestock odor", "commercial biochar", "pilot-scale", "hydrogen sulfide", "odorous volatile organic compounds" ] }, { "identifier": "10.5061/dryad.8w9ghx3ps", "accessLevel": "public", "contactPoint": { "hasEmail": "mailto:eric.billman@usda.gov", "fn": "Billman, Eric" }, "programCode": [ "005:040" ], "description": "This is digital research data corresponding to a published manuscript, Breeding heat tolerant orchardgrass germplasm for summer persistence in high temperature stress environments of the southeastern United States, in Crop Science, Volume 61, p. 1915 - 1925.
\nOrchardgrass (Dactylis glomerata L.) could serve as a cool-season perennial in southeastern production systems, but often does not behave as a true perennial under high temperature stress conditions of the region. This work sought to develop heat-tolerant orchardgrass germplasm through recurrent phenotypic selection (RPS) that would both reduce secondary seed dormancy caused by high soil temperatures and improve stand persistence over summer months. Selection was conducted in a growth chamber 40/30 °C (12/12 h, light/darkness), with germinated seedlings subjected to an additional 2–3 weeks of 40/30 °C conditions. The base germplasm (Cycle 0) and selected individuals (Cycles 1–3) were transplanted into the field, then harvested for seed. Forty-degree germination tests compared mean cumulative germination, velocity of germination within 8 days (VOG8), and realized heritability. Stand persistence was assessed 1 year after transplanting.
\nMethods are described in the manuscript https://doi.org/10.1002/csc2.20492. Descriptions for each dataset corresponding to each figure and table in the text of the manuscript are found in the ReadMe.docx file or on each individual tab in the Excel file.
Resource Title: Link to dataset at Datadryad.org.
File Name: Web Page, url: https://doi.org/10.5061/dryad.8w9ghx3ps
This is digital research data corresponding to a published manuscript, Breeding heat tolerant orchardgrass germplasm for summer persistence in high temperature stress environments of the southeastern United States, in Crop Science, Volume 61, p. 1915 - 1925.
This is digital research metadata corresponding to a published manuscript in Agronomy Journal, \"Mob and rotational grazing influence pasture biomass, nutritive value, and species composition\", Vol. 112 p. 2866-2878. Dataset may be accessed via the included link at the Dryad data repository.
\nMob grazing, which uses very high stocking densities for short durations followed by a relatively long rest period, was designed to mimic bison (Bison bison) grazing in western U.S. grassland. This project assessed the suitability of mob grazing for livestock production in the Northeast. Objectives were to compare the effects of mob and rotational grazing on dry matter (DM) mass, nutritive value, and botanical composition across four grazing seasons. Eight, 0.10‐ha paddocks were established in 2014 as a randomized complete block with four replications, and seeded with alfalfa (Medicago sativa L.), white clover (Trifolium repens L.), orchardgrass (Dactylis glomerata L.), narrowleaf plantain (Plantago lanceolata L.), and tall fescue [Schedonorus arundinaceus (Schreb.) Dumort]. Mob‐grazed (MOB) paddocks were grazed by yearling beef cattle twice each year, (70–90–day interval), and rotationally grazed (ROT) paddocks were grazed four to six times each year (when sward height reached 25 cm).
\nMethods are described in the manuscript https://doi.org/10.1002/agj2.20215. Descriptions corresponding to each figure and table in the manuscript are placed on separate tabs in the Excel file to clarify abbreviations and summarize the data headings and units.
Resource Title: Link to Mob and Rotational Study dataset at Datadryad.org.
File Name: Web Page, url: https://doi.org/10.5061/dryad.79cnp5ht4
Data set one: weather data (precipitation and temperature), pasture height, forage removal, cumulative and per harvest forage mass, botanical composition, and nutritive values of forage material subjected to mob and rotational grazing over a 4-year period (2015-2018) in central Pennsylvania.
Soil microorganisms play essential roles in soil organic matter dynamics and nutrient cycling in agroecosystems and have been used as soil quality indicators. The response of soil microbial communities to land management is complex and the long-term impacts of cropping systems on soil microbes is largely unknown. Therefore, changes in soil bacterial community composition were assessed in response to cropping sequences and bio-covers at long-term no-tillage sites. Main effects of four different cropping sequences of corn (Zea mays L.), cotton (Gossypium hirsutum L.), and soybean (Glycine max L.) were rotated in four year phases for 12-yrs at two Tennessee Research and Education Centers in a randomized complete block design with split-block treatments of four winter bio-covers: hairy vetch (Vicia villosa L.), wheat (Triticum aestivum L.), poultry litter, and a fallow control. Using Illumina high-throughput sequencing of 16S rRNA genes, bacterial community composition was determined. Composition, diversity, and relative abundance of specific taxa were correlated per cropping system, bio-cover, and their interaction. We found that i) richness and diversity varied temporally and spatially, coinciding with soil carbon, pH, nutrient levels, and climatic variability; ii) community composition varied by cropping system, with continuous corn, soybean, and the corn-soybean rotation presenting a hybrid of the continuous corn and soybean communities; however, continuous cotton resulted in the most varied assemblage; iii) bio-covers asserted the greatest influence on microbial communities; specifically poultry litter treatments differed from cover crops (all of which received inorganic-N). Consequently, microbial diversity was greatest under nutrient rich bio-covers (poultry litter) and high residue producing, less pesticide-intensive cropping sequences (soybean and corn compared to cotton), suggesting a more dynamic soil ecology under these no-till cropping systems. This suggests that nutrient management (inorganic fertilizers vs. animal manure) and greater crop rotations (within 4-yr phases) may directly drive phylogenetic community structure and subsequent ecosystem services across agricultural landscapes.
Resource Title: Microbial diversity based on crop rotation, cover crop, and poultry litter after 14-years of managment .
File Name: Ashworth microbial data by PLOT.xlsx
Resource Title: Microbial diversity based on crop rotation, cover crop, and poultry litter after 14-years of managment.
File Name: Ashworth microbial data by PLOT.csv
Resource Description: CSV version of the data
Resource Title: Data Dictionary.
File Name: Ashworth-PLOT-Jul2019-data-dictionary.csv
Resource Description: Defines variables, data type, accepted values, size, if required, etc. for the tabular data.
The data presents the antimicrobial susceptibility testing results in three separate files: 1) third generation cephalosporin resistant E. coli isolates obtained on cefotaxime supplemented media; 2) extended spectrum beta-lactamase (ESBL) producing E. coli, and 3) ESBL-producing Klebsiella, Enterobacter and Citrobacter species obtained on chromogenic media. The data was generated as part of a research project that evaluated the impact of tylosin supplementation of feedlot cattle on the dynamics of antimicrobial resistant fecal bacteria. The study was a longitudinal design with periodic sampling of fecal samples from individual animals over the entire feeding period. Two publications from the project, one describing the study design in detail, and the other specifically reporting on these data, are linked to the database.
\nResources in this dataset:
\nResource Title: Third generation cephalosporin resistant E. coli\nFile Name: TYAMR-TGC Combined Data.xlsx\nResource Description: Third generation cephalosporin resistant E. coli from TyAMR project.
\nResource Title: ESBL-producing E. coli\nFile Name: TyAMR-ESBLs isolates-combined AST data.xlsx\nResource Description:
\nResource Title: ESBL-producing Klebsiella, Enterobacter and Citrobacter spp.\nFile Name: TyAMR KEC-with AST interpretation.xlsx\nResource Description: ESBL-producing Klebsiella, Enterobacter and Citrobacter obtained as part of TyAMR project.
\nThe dataset contains information collected from 122 K-12 public school food service directors in Mississippi, USA, who completed an online survey designed for Mississippi school food service directors. The survey was created using Snap Surveys Desktop software. Information includes school size (number of enrolled students), percent of students participating in free or reduced-price lunch, foods sourced locally (defined as grown or produced in Mississippi), desire to purchase more or start purchasing locally sourced foods, fresh fruit and vegetable purchasing practices, experience purchasing fruits and vegetables from farmers, challenges purchasing from farmers, and interest in other farm to school (F2S) activities. School food service directors' demographic characteristics collected include gender, age, ethnicity/race, marital status, and education level. The data were collected from October 2021 to January 2022 using an online mobile and secure survey management system called Snap Online. The data were collected to obtain updated demographic and school purchasing characteristics from school food service directors in Mississippi and to determine their current abilities, experiences, and desires to engage in F2S activities. The dataset can be used to learn about K-12 public school food service directors in Mississippi but results should not be generalized to all school food service directors in Mississippi or elsewhere in the USA.
Resource Title: Mississippi Farm to School Food Service Director Dataset.
File Name: MS F2S School Data Public.csv
Resource Description: The dataset contains information collected from 122 K-12 public school food service directors in Mississippi regarding their experience with and interest in farm to school, including purchasing local foods. It also contains demographic characteristics of the school food service directors and their fresh fruit and vegetable purchasing practices.
Resource Software Recommended: Microsoft Excel,url: https://www.microsoft.com/en-us/microsoft-365/excel
Resource Title: Mississippi Farm to School Food Service Director Data Dictionary.
File Name: MS F2S School Data Dictionary Public.csv
Resource Description: The file contains information for variables contained in the associated dataset including names, brief descriptions, types, lengths, and values.
Resource Software Recommended: Microsoft Excel,url: https://www.microsoft.com/en-us/microsoft-365/excel
Purpose
\nComputer software for estimating variance and covariance components, correlations, and predicting genetic effects.
\nSoftware Description
\nWe describe a suite of genetic software that employs mixed linear model approaches. The various components relate to three categories, viz, genetic models for diallel crosses, seed traits, and developmental traits. It can also be used to analyze regional agronomic trials.
\nThis software has several features:
\nFast computation
\nResource Title: Mixed Linear Model Approaches for Quantitative Gen.
File Name: Web Page, url: https://www.ars.usda.gov/research/software/download/?softwareid=199&modecode=60-64-05-10
download page
Insecticide Netting\nIn this study, we focused on two types of long-lasting insecticide netting (LLIN) that have been found to be effective for managing various stored product insect pests. One is an LLIN consisting of a polyethylene netting (2 × 2 mm mesh, D-Terrence, Vestergaard, Inc., Lausanne, Switzerland) with 0.4% deltamethrin active ingredient (a.i.), while the second one is Carifend® net (40 deniers with mesh size 97 knots/cm2; BASF AG, Ludwigshafen, Germany) containing 0.34% α-cypermethrin (a.i.).
\nFoundational Model\nWe used a standard Lefkovitch matrix model to project population growth for Tribolium castaneum, with four life stages (e.g., egg, larva, pupa, and adult;(Lefkovitch,1965). In equation (1), the Leftkovitch matrix L matrix (4 × 4) represents the life-stage structure of T. castaneum which has an egg, larvae, pupae, and an adult, where only the adults contribute to the fecundity, F. By multiplying L with the population vector ni(t), where t is time step (e.g., generation) and i is a life stage, we obtain the resultant vector ni(t + 1), which reveals the distribution of individuals across different life stages in the subsequent time period.\nIn equation (1), P1 represents the probability of staying in the egg stage and G1 is the probability of moving from the egg to the larval stage, P2 is the probability of staying in the larval stage, G2 is probability of moving from the larval stage to pupal stage, P3 is the probability of staying in the pupal stage, G3 is probability of moving from the pupal stage to adult, while P4 is the probability of staying in the adult stage (Figure 1).
\nModel Parameterization and Scenarios\nWe simulated population outcomes for up to 15 generations by using the life table data for T. castaneum using the R package popbio. Survivorship, fecundity, and transition information for each stage were derived from the literature (summarized in Table 1). The developmental duration of eggs, larvae, and pupae were 3.82 ± 0.005, 22.81 ± 0.67, and 6.24 ± 0.071 days (Kollros,1944). The average life duration of the adult used in this study was 221.16 days (Park et al., 1961). We used 94 offspring for fertility from the study Park et al.,(1965) and 99% rate of eclosion from pupae to adult.\nIn order to explore the sensitivity of the base model to changes in mortality and fecundity, both of these parameters were systematically varied from near zero to their maximum value given in the base model (e.g., F = 94, P4 = 0.871). The parameters were varied alone or in combination and the resulting population growth was plotted. All plots were created using ggplot2 (Wickham, 2016) in R software (R Core Team, 2022).\nThree empirical scenarios from the literature were modeled containing estimates of fecundity reduction only, survivorship reduction only, or both fecundity and survivorship reduction when using LLIN (R.V. Wilkins et al., 2021; Gerken et al., 2021;Scheff et al., 2021, Scheff et al., 2023; Table 2). An individual projection matrix was constructed for each of the three scenarios and combinations of the reductions in fecundity, survivorship, or both. Population growth and proportion in each life stage was projected for 15 generations for each case, including the base model. Overall variation and oscillation were calculated to compare trends among proportion of life stages in each case. In order to compare differences in population sizes between cases for all generations and for generation 15 only, population sizes for each generation were bootstrapped 1000 times to provide iterative replication. The bootstrapped data were then compared one case to another using proc ttest in SAS (Version 9.4) for all generations and for generation 15 only. In addition, a sensitivity analysis was performed to determine which stage should be targeted to most greatly affect the population growth after exposure to the netting. Moreover, a mortality function based on empirical data with LLIN exposure collected in the laboratory on T. castaneum was implemented.
\nThe three scenarios are derived from:\nGerken, A. R., J. F. Campbell, S. R. Abts, F. Arthur, W. R. Morrison, and D. S. Scheff. 2021. “Long-Lasting Insecticide-Treated Netting Affects Reproductive Output and Mating Behavior in Tribolium castaneum (Coleoptera: Tenebrionidae) and Trogoderma variabile (Coleoptera: Dermestidae).” Edited by Rizana Mahroof. Journal of Economic Entomology 114 (6): 2598–2609. https://doi.org/10.1093/jee/toab204.
\nScheff, D. S., A. R. Gerken, W. R. Morrison, J. F. Campbell, F. H. Arthur, and K. Y. Zhu. 2021. “Assessing Repellency, Movement, and Mortality of Three Species of Stored Product Insects after Exposure to Deltamethrin-Incorporated Long-Lasting Polyethylene Netting.” Journal of Pest Science 94 (3): 885–98. https://doi.org/10.1007/s10340-020-01326-3.
\nWilkins, R.V., J.F. Campbell, K.Y. Zhu, L.A. Starkus, T. McKay, and W.R. Morrison. 2021. “Long-Lasting Insecticide-Incorporated Netting and Interception Traps at Pilot-Scale Warehouses and Commercial Facilities Prevents Infestation by Stored Product Beetles.” Frontiers in Sustainable Food Systems 4: https://doi.org/10.3389/fsufs.2020.561820.
\nResources in this dataset:
\nSpreadsheet from the paper entitled: Revisiting a Statistical Shortcoming when Fitting the Langmuir Model to Sorption Data by C.H. Bolster, Journal of Environmental Quality, 2008, 37:1986-1992. Spreadsheet has been modified to make a correction to the calculation of E for weighted data. (3/18/2010).
\nSorption models are commonly used for describing solute and metal sorption to soils. When fitting sorption models to sorption data, however, the user must be aware that certain statistical limitations exist with both linear and nonlinear versions of the models. Ongoing research at the Animal Waste Management Research Unit of the USDA-ARS addresses the effect of these statistical limitations on fitting phosphorus sorption data with various sorption models.
\nThis research was originally part of the former USDA-ARS National Program 206: Manure and By-product Utilization.
Resource Title: Modified Langmuir Equation Spreadsheet.
File Name: Web Page, url: https://www.ars.usda.gov/research/software/download/?softwareid=205&modecode=50-40-05-00
download page
This ongoing dataset contains monthly precipitation measurements from a network of standard can rain gauges at the Jornada Experimental Range in Dona Ana County, New Mexico, USA. Precipitation physically collects within gauges during the month and is manually measured with a graduated cylinder at the end of each month. This network is maintained by USDA Agricultural Research Service personnel. This dataset includes 39 different locations but only 29 of them are current. Other precipitation data exist for this area, including event-based tipping bucket data with timestamps, but do not go as far back in time as this dataset.
Resource Title: Website Pointer to html file.
File Name: Web Page, url: https://portal.edirepository.org/nis/mapbrowse?scope=knb-lter-jrn&identifier=210380001
Webpage with information and links to data files for download
Mortality data of navel orangeworm, Amyelois transitella, in response to nitric oxide fumigation treatments, are presented.
\nThis data set is associated with the study on responses of navel orangeworm (NOW), Amyelois transitella (Walker), to nitric oxide (NO) fumigation treatments. In the study, NO fumigation was evaluated for efficacy against eggs, larvae, and pupae of NOW. Larvae and pupae were fumigated both on artificial diet and in infested walnuts. Insects were fumigated with NO at different concentrations for different durations. Numbers of dead and alive insects at each life stages were collected for each treatment. NO fumigation was conducted under ultralow oxygen (ULO) conditions. So, each test included two controls: CK (in normal atmosphere) and ULO (under ultralow oxygen condition). Mortality rates from different treatments for each life stage were compared statistically to determine efficacy of NO fumigation.
Resource Title: Data for manuscript JEN-2020-0214.
File Name: NO fumigation of NOW Original 10-7-20.xlsx
Resource Description: This data set is associated with the study on responses of navel orangeworm (NOW), Amyelois transitella (Walker), to nitric oxide (NO) fumigation treatments. In the study, NO fumigation was evaluated for efficacy against eggs, larvae, and pupae of NOW. Larvae and pupae were fumigated both on artificial diet and in infested walnuts. Insects were fumigated with NO at different concentrations for different durations. Numbers of dead and alive insects at each life stages were collected for each treatment. NO fumigation was conducted under ultralow oxygen (ULO) conditions. So, each test included two controls: CK (in normal atmosphere) and ULO (under ultralow oxygen condition). Mortality rates from different treatments for each life stage were compared statistically to determine efficacy of NO fumigation.
This research report documents the Fortran program N3DADE (Nonequilibrium 3-Dimensional Advection-Dispersion Equation) which may be used to evaluate analytical solutions described by Leij et al. [1993]. The analytical solutions pertain to selected cases of three-dimensional solute transport during steady unidirectional water flow in porous media of semi-infinite length in the longitudinal direction, and of infinite length in the transverse directions. The solutions may also be applied to one- and two-dimensional problems. Transport and flow properties of the medium are assumed to be macroscopically uniform. Nonequilibrium solute transfer can occur between two domains in either the liquid or the adsorbed phase. The transport equation contains terms for solute movement by advection and dispersion, and for solute retardation, first-order decay, and zero-order production. Solute concentrations are calculated as a function of time and space in a three-dimensional Cartesian coordinate system.
\nThis report serves as both a user manual for the program and as documentation of the general analytical solutions of the boundary, initial and production value problems involved. A comprehensive set of specific solutions is presented using Dirac, Heaviside and exponential functions to describe the initial, boundary and production profiles. A rectangular or circular inflow area is specified for the boundary value problem, while for the initial and production value problems the respective initial and production profiles are defined for parallelepipedal, cylindrical, or spherical regions of the soil. Solutions are given for volume-averaged or resident concentrations, as well as for flux-averaged or flowing concentrations.
\nThe user manual gives a detailed description of the computer program, including the subroutines used to evaluate the analytical solutions for optimizing model parameters. Input and output files for all major problems are also included.
\nThe manual provides:
\nThe source code N3DADE.FOR
\nResource Title: N3DADE download page.
File Name: Web Page, url: https://www.ars.usda.gov/research/software/download/?softwareid=99&modecode=20-36-15-00
The NAL Agricultural Thesaurus (NALT) was first released by the National Agricultural Library in 2002, with in-depth coverage of agriculture, biology, and related disciplines. It contains over 135,000 terms, including 63,000 cross references, and is arranged into 17 subject categories which are used to browse the Thesaurus in a specific discipline or subject area. NALT is updated annually each January. The subject scope of agriculture is broadly defined in the thesaurus, and includes terminology in the supporting biological, physical, and social sciences. Biological nomenclature comprises a majority of the terms in the thesaurus and is located in the \"Taxonomic Classification of Organisms\" Subject Category. Political geography is mainly described at the country level. Published since 2007, the Glossary is a collection of definitions of agricultural terms developed in conjunction with the creation of the NAL Agricultural Thesaurus. The 2018 edition of the glossary contains 5,618 terms ranging across agriculture and its many ancillary subjects. Most definitions were composed by the NAL Thesaurus Staff. Those definitions taken from government sources are indicated in the \"Definition Source\" field and are included in the bibliography. In 2010, the thesaurus was made available as Linked Open Data. Linked Open Data translates information into a form both readable and understandable by computers. This translation makes it possible for different information resources, such as Web pages, datasets and research articles, to be interconnected, creating meaningful relationships that make it easier to locate related content. In May 2007, Spanish language versions of its NAL Agricultural Thesaurus (NALT) and Glossary of Agricultural Terms were published under the Spanish language names \"Tesauro Agrícola\" and \"Glosario\". The Thesaurus and Glossary are produced cooperatively by the USDA National Agricultural Library and the Inter-American Institute for Cooperation on Agriculture (IICA), as well as other Latin American agricultural institutions belonging to the Agriculture Information and Documentation Service of the Americas (SIDALC). The Thesaurus and Glossary can be downloaded in XML, RDF-SKOS, PDF, MARC, and DOC formats.
Resource Title: NAL Thesaurus and Glossary Home.
File Name: Web Page, url: https://agclass.nal.usda.gov/agt.shtml
Website for the NAL Thesaurus (NALT) and Glossary.
The United States Department of Agriculture National Agricultural Library Geospatial Data catalog contains geographic location-based agricultural research data, imagery, research location context, and more. Users can search records representing a variety of datasets, maps and graphics, aerial and phenocam images, and other services.
Resource Title: NAL Geodata.
File Name: Web Page, url: https://geodata.nal.usda.gov/geonetwork/
This dataset is part of the common observation in the centralized repository for public access, also known as the Common Observatory Repository (CORe), of the USDA ARS Long-Term Agro-ecosystem Research (LTAR) network. This is part of the National Program 216 (NP#216): Agricultural System and Competitiveness and Sustainability. Also The National Wind Erosion Research Network was established in 2014 as a collaborative effort led by the US Department of Agriculture (USDA) Long Term Agro-Ecosystem Research (LTAR) network and the Bureau of Land Management (BLM). The research domain incorporates the diverse soils and vegetation communities in the rangelands and croplands of the western United States, with sites located in New Mexico, Texas, Oklahoma, Arizona, California, Colorado, North Dakota, Utah, Idaho and Washington. We have a tower that collects data for the North Dakota Agricultural Weather Network. Our site is part of the NEON project with a tower that is designed to collect and provide open data that characterize and quantify complex, rapidly changing ecological processes across the US. We have a National Center for Environmental Information (NOAA) tower that collects daily summaries of weather data. A Natural Resource Conservation (NRCS) National Water and Climate tower that collects snow and water data.
Resource Title: GeoData catalog record.
File Name: Web Page, url: https://geodata.nal.usda.gov/geonetwork/srv/eng/catalog.search#/metadata/51f15ad7-206a-4884-83ad-0cfe87f2ff55
NLEAP GIS 5.0 can help users identify hot spots across the landscape and identify management practices that can increase nitrogen use efficiency. A Nitrogen Trading Tool (NTT) analysis can be conducted to determine the potential benefits of implementing best management practices and the quantity of nitrogen savings that could potentially be traded in future air or water quality markets.
Resource Title: NLEAP GIS 5.0.
File Name: Web Page, url: https://www.ars.usda.gov/research/software/download/?softwareid=428&modecode=30-12-30-15
download page
NLET (National Load Estimating Tool), a component of the USDA/ARS Soil and Water Hub, is a web-based tool for estimating pollutant loads in watersheds across the contiguous United States. This tool helps visualize the effects of land use patterns, cultivated crops, and conservation practices through graphical representation. Visualizations illustrate baseline and scenario land-use, crops, conservation, runoff, sediment, nitrogen, and phosphorus, and load differences at 50th percentile.
\nNLET implements an export coefficient approach for predicting the pollutant loads. NLET also addresses the need for a user-friendly, reliable and cost-effective watershed modeling tool.
\nNLET utilizes the D3.js library for creating an open-source JavaScript and data-driven charts, as well as Mapbox and OpenStreetMap for the Leaflet library, another open-source JavaScript library used for displaying the locations of Hydrologic Unit Catalog (HUC).
Resource Title: Website Pointer to NLET - National Load Estimating Tool .
File Name: Web Page, url: https://nlet.brc.tamus.edu/
The web dashboard interface for estimating pollutant loads in watersheds across the contiguous United States.
NUOnet Vision: Efficient use of nutrients to optimize production and product quality of food for animals and humans, fuel and fiber in a sustainable manner that contributes to ecosystem services. This record contains the DET and Data Dictionary for NUOnet - the data files may be found at https://usdaars.maps.arcgis.com/apps/MapSeries/index.html?appid=e90392a99d5c427487c6c37cf6d47844
\nBest nutrient management practices are critical for maintaining profitable economic returns, sustaining higher yields, lowering environmental impacts, optimizing nutritional quality, and providing ecosystem services. Best management practices that improve nutrient use efficiencies can reduce nutrient losses from agricultural systems. However, we need to improve our understanding of biological, physical and chemical influences on nutrient processes. For instance, crop use efficiency of nitrogen (N), the primary macronutrient regulating yield and protein content, can be reduced by processes such as denitrification (N2O and N2 emission), leaching (NH4-N, NO3-N, and organic-N), ammonia (NH3-N,) volatilization, surface runoff and erosion, disease, and non-crop competition. Similarly, we need to obtain more information about biological and physical cycles of nutrients, especially phosphorus (P), including factors that influence nutrient availability from fertilizers, crop residues, cover crops, manures, and other byproducts. We need a better understanding of relationships between soil biological communities and ecosystems, including plant roots and root exudates, and availability and uptake of macro- and micro-nutrients. In addition, we need information regarding how these practices impact yields, organoleptic qualities, and the macro- and micro-nutritional composition of plants. This information will improve our ability to develop best nutrient management practices.
\nOptimal soil nutrient levels are critical for maximizing economic returns, increasing sustainable yields, lowering environmental impacts, sustaining ecosystem services and optimizing nutritional and organoleptic qualities of human and animal foods. Efficient management practices are crucial for increasing economic returns for land managers in a sustainable manner while producing high quality of food for animals and humans with reduced off-site transfer of nutrients from agricultural areas in watersheds. Optimizing N and P inputs requires more information about nutrient inputs from fertilizers, manures, composts, agricultural byproducts, cover crops, and other nutrient sources in addition to nutrient cycling within soils. This requires data from long-term nutrient management studies across a wide range of soils, crops, and environmental conditions. Land management needs are to connect nutrient management practices for crops with nutrient use efficiency; crop quality; crop chemical composition and nutritional value, quality and acceptability for animal and human health. Development of databases that enable the scientific exploration of connections among data generated from diverse research efforts such as nutrient management, fate and ecosystem service outcomes, nutritional composition of crops, and animal and human health, is needed.
\nNitrogen is a key nutrient that enhances agricultural yield and protein content, but multiple N loss pathways, as previously mentioned, reduce crop N use efficiency (NUE). Implementing proper management practices is needed to reduce N losses from agricultural systems. ARS has multidisciplinary scientific teams with expertise in soils, ecological engineering, hydrology, livestock management and nutrition, horticulture, crop breeding, human and animal nutrition, post-harvest management and processing, and other areas, and intentional collaboration among these teams offers opportunities to rapidly improve NUE and crop quality and reduce off-site N losses.
\nSimilarly, increased P use efficiencies are needed to enhance and ensure sustainable agricultural production and to reduce environmental degradation of water sources. Manure is a valuable source of P and it can be used as a soil amendment to reduce crop production costs. However, there is a need to improve our understanding of the biological and physical cycles of soil P, as well as to obtain more information about P supplies from fertilizer, crop residues, cover crops, manure, and byproducts, and livestock nutrition impacts on manure properties.
\nThere is also a need for a better understanding of soil biological communities and ecosystems, including plant roots and root exudates and how their interactions with crops and community ecology affect yield and the uptake of macro- and micro-nutrients and the ultimate nutritional composition and organoleptic qualities of the crop. Studies documenting the responses of crop-associated biological communities to management practices and genetic technologies implemented across multiple environments (e.g., soil types and chemistries, hydrologic regimes, climates) will improve our understanding of gaps in macro- and micro-nutrient management strategies.
\nA goal of the USDA-ARS is to increase agricultural production and quality while reducing environmental impacts. The Nutrient Uptake and Outcomes (NUOnet) database will be able to help establish baselines on nutrient use efficiencies; processes contributing to nutrient losses; and processes contributing to optimal crop yield, nutritional and organoleptic quality. This national database could be used to calculate many different environmental indicators from a comprehensive understanding of nutrient stocks and flows. Increasing our understanding of stocks and flows could help in the identification of knowledge gaps as well as areas where increased efficiencies can be achieved at a national level. NUOnet could also be used to develop tools to derive cost-benefit curves associated with nutrient management improvement scenarios and assess local, regional and national impacts of off-site nutrient loss. Understanding how agricultural production impacts human health is a challenge, and the database could be used to link crop management strategies to crop chemical composition to human consumption patterns and ultimately to human health outcomes. A national database will also be very important for development and evaluation of new technologies such as real-time sensing or other proximal and remote sensing technologies that enable assessment of nutrient use efficiencies, particularly at the grower level. The database could also be used to develop analyses that will contribute to the recommendation of policies for resource allocations that will most effectively fulfill the goals of the Grand Challenge. Such a national database with contributions from peers across different national programs could also enhance collaborations between ARS, universities, and extension specialists, as well as with producers, industry, and other partners.
\nSee the NUOnet Home Page for more information about this database and strategic goals.
\nResource Title: GRACEnet-NUOnet Data Dictionary.
File Name: GRACEnet-NUOnet_DD.csv
Resource Title: NUOnet Data Entry Template.
File Name: DET_NATRES_NUO.zip
Resource Description: A multi-tab worksheet for data entry. Users can customize fields to be mandatory, set minimum and maximum values, and run a validation on fields as specified by the user.\n\nhttps://gpsr.ars.usda.gov/html/NUOnet_DET/DET_NATRES_NUO.xlsm
NVND Study for Greenhouse gas Reduction through Agricultural Carbon Enhancement network in Sidney, Montana\nManagement practices, such as irrigation, tillage, cropping system, and N fertilization, may influence soil greenhouse gas (GHG) emissions. We quantified the effects of irrigation, tillage, crop rotation, and N fertilization on soil CO2, N2O, and CH4 emissions from March to November, 2008 to 2011 in a Lihen sandy loam in western North Dakota. Treatments were two irrigation practices (irrigated and non-irrigated) and five cropping systems (conventional-tilled malt barley [Hordeum vulgaris L.] with N fertilizer [CTBFN], conventional-tilled malt barley with no N fertilizer [CTBON], no-tilled malt barley-pea [Pisum sativum L.] with N fertilizer [NTB-PN], no-tilled malt barley with N fertilizer [NTBFN], and no-tilled malt barley with no N fertilizer [NTBON]). The GHG fluxes varied with date of sampling while peaking immediately after precipitation, irrigation, and/or N fertilization events during increased soil temperature. Both CO2 and N2O fluxes were greater in CTBFN under the irrigated condition but CH4 uptake was greater in NTB-PN under the non-irrigated condition than in other treatments. While tillage and N fertilization increased CO2 and N2O fluxes by 8 to 30%, N fertilization and monocropping reduced CH4 uptake by 39 to 40%. The NTB-PN, regardless of irrigation, might mitigate GHG emissions by reducing CO2 and N2O emissions and increasing CH4 uptake relative to other treatments. To account for global warming potential for such a practice, information on productions associated with CO2 emissions along with N2O and CH4 fluxes are needed.
Resource Title: GeoData catalog record.
File Name: Web Page, url: https://geodata.nal.usda.gov/geonetwork/srv/eng/catalog.search#/metadata/686b4236-9997-4d32-93b6-1bb490d3fa13
NWISRL South Farm Study for Greenhouse gas Reduction through Agricultural Carbon Enhancement network in Kimberly, Idaho\nWe report N2O emissions along with CO2 and CH4 from a silage corn (2013)–barley (2014)–alfalfa (2015) rotation under conventional tillage and sprinkler irrigation. The main study objectives were to evaluate the effectiveness of an enhanced-efficiency fertilizer (SuperU; stabilized granular urea with urease and nitrification inhibitors) to reduce N2O emissions when compared to granular urea, and determine GHG emissions from fall-applied dairy manure or composted dairy manure and spring-applied dairy manure. Nitrogen treatments were only applied during the first two years of the study. Compared to urea, SuperU plots emitted 53% less N2O during the monitoring period with corn, while no N2O emission reductions occurred in 2014 with barley. The N2O-N emission losses as a percentage of total N applied were 0.21% and 0.04% for urea and SuperU in 2013, respectively, with losses of 0.05% from both urea fertilizers in 2014. On average, N2O fluxes from fall and spring manure were statistically similar and greater than the other N treatments in 2014, and there was a lasting manure treatment effect on emissions when under alfalfa. Carbon dioxide fluxes, on average, were greatest from fall- and spring-applied manure during the first two years of study. Methane fluxes were negative on average, indicating microbial oxidation, and no differences occurred among the N treatments. Silage corn, barley grain, and alfalfa yields were statistically similar among all N treatments. This work demonstrates that SuperU can potentially reduce N2O emissions from irrigated cropping systems in the semiarid western United States while not affecting crop yields.
Resource Title: Kimberly, ID NWISRL South Farm Study (IDKM) CSV data.
File Name: IDKM_csv_data.zip
Resource Description: CSV format data on Experimental Units, Field Sites, Greenhouse Gas Flux, Residue Management, Soil Chemistry, Soil Physics, Amendments, Growth Stages, Planting, Tillage, Persons, Treatments, Weather Daily, Weather Station.
The measured and simulated data for corn and soybean yields, tileflow, N concentration, and N loading by plot, year, treatment, rotation, tillage and N application from 36 1-acre plots located on the Northeast Research and Demonstration Farm near Nashua, Iowa are presented. The measured data were analyzed with the Root Zone Water Quality Model (RZWQM) Version 1.0.2000.830 and summarized in 8 papers in a special issue of Geoderma (Volume 140, No. 3, pages 217-322). The economic returns associated with each plot year were budgeted using the EconDocs software, since improved and released as DevTreks.
Resource Title: Nashua Data Access .
File Name: Web Page, url: https://apps.tucson.ars.ag.gov/nashua/
Web site for the Nashua Project, including links to :
\nThe National Cotton Variety Test is an on-going standardized cotton research database originating in 1960 and covers the entire US Cotton Belt.
Resource Title: PDF File.
File Name: Web Page, url: https://www.ars.usda.gov/Business/Business.htm?docid=4357&modecode=64-02-15-00&page=2
Insects impact American agriculture both as destructive and beneficial organisms. Insect pests, parasites, predators, products, and pollinators are all economically important. It is critically important to distinguish between different species, races, stocks, strains, biotypes, and other genetic entities and to document their different interactions with agriculture and the environment.
\nThe goals of the National Invertebrate Genetic Resources Program include:
\nPreservation of reference specimens
\nMaintenance of genetically important germplasm
\nDocumentation of specific insect stocks
\nManagement of databases
\nDistribution of material to researchers and breeders
\nResource Title: National Invertebrate Genetic Resources.
File Name: Web Page, url: https://www.ars-grin.gov/nigrp/
The goal of the National Microbial Germplasm Program is to ensure that the genetic diversity of agriculturally important microorganisms is maintained to enhance and increase agricultural efficiency and profitability. The program collects, authenticates, and characterizes potentially useful microbial germplasm; preserves microbial genetic diversity; and facilitates distribution and utilization of microbial germplasm for research and industry.
\nThe Agricultural Research Service maintains several microbial germplasm collections including:
\nUS National Fungus Collections
\nResource Title: National Microbial Germplasm Program .
File Name: Web Page, url: https://www.ars-grin.gov/nmg/
Main web site for the National Microbial Germplasm Program with links to component databases/collections.
Global food availability and security is based on intensive agricultural production. Over the past century, this intensification has relied heavily on producing crops with increasing genetic uniformity. Although these practices have benefits, they also include the risks of increasing the vulnerability of crops to pests, diseases, and environmental stress.
\nPlant breeding and associated scientific research is essential to meet the ongoing challenges of producing plants for food, fiber, animal feeds, industrial and medicinal purposes, and for landscape and ornamental uses. It is important to collect and conserve living plant material, both to help solve immediate agricultural production problems as well as safeguard plant genetic diversity for future needs. This mission is more essential than ever because the loss of genetic diversity is accelerating with threats from many factors including global urbanization, habitat changes associated with climate, and changes in land use related to population growth and economic development.
\nThe U.S. National Plant Germplasm System (NPGS) is collaborative effort to safeguard the genetic diversity of agriculturally important plants. The NPGS is managed by the Agricultural Research Service (ARS), the in-house research agency of the United States Department of Agriculture (USDA). Funding for the NPGS comes primarily through appropriations from the U.S. Congress. However, the NPGS is a partnership between the public and private sectors. Many NPGS genebanks are located at state land-grant university sites, which contribute lab, office, greenhouse and field space for operations, as well as staff for technical and support services. The private sector is a major user of the NPGS collections and is the primary means by which new and improved plants are commercialized.
\nThe mission of the NPGS is to support agricultural production by:
\ndistributing crop germplasm
\nResource Title: National Plant Germplasm System.
File Name: Web Page, url: https://www.ars-grin.gov/Pages/Collections#bkmk-1
Nebraska Prairie Study for Agricultural Antibiotic Resistance in Lincoln, Nebraska\nThe inherent spatial heterogeneity and complexity of antibiotic resistant bacteria and antibiotic resistance (AR) genes in manureaffected soils makes it difficult to sort out resistance that can be attributed to human antibiotic use from resistance that occurs naturally in the soil. This study characterizes native Nebraska prairie soils that have not been affected by human or food-animal waste products to provide data on background levels of resistance in southeastern Nebraskan soils. Soil samples were collected from 20 sites enumerated on tetracycline and cefotaxime media; screened for tetracycline-, sulfonamide-, b-lactamase–, and macrolide-resistance genes; and characterized for soil physical and chemical parameters. All prairies contained tetracyclineand cefotaxime-resistant bacteria, and 48% of isolates collected were resistant to two or more antibiotics. Most (98%) of the soil samples and all 20 prairies had at least one tetracycline gene. Most frequently detected were tet(D), tet(A) tet(O), tet(L), and tet(B). Sulfonamide genes, which are considered a marker of human or animal activity, were detected in 91% of the samples, despite the lack of human inputs at these sites. No correlations were found between either phenotypic or genotypic resistance and soil physical or chemical parameters. Heterogeneity was observed in AR within and between prairies. Therefore, multiple samples are necessary to overcome heterogeneity and to accurately assess AR. Conclusions regarding AR depend on the gene target measured. To determine the impacts of food-animal antibiotic use on resistance, it is essential that background and/or baseline levels be considered, and where appropriate subtracted out, when evaluating AR in agroecosystems.
Resource Title: GeoData catalog record.
File Name: Web Page, url: https://geodata.nal.usda.gov/geonetwork/srv/eng/catalog.search#/metadata/196aa7cb-1880-49ad-a4a3-a220be105dbb
This dataset presents the Neodiprion Official Gene Set (OGS) v1.1. It was generated using Maker v2.31.8, followed by CrossMap re-mapping of coordinates to genome assembly Nlec1.1 (https://www.ncbi.nlm.nih.gov/assembly/GCA_001263575.2/).
\nThis dataset is now obsolete - a new genome assembly, iyNeoleco1.1 (https://www.ncbi.nlm.nih.gov/assembly/GCF_021901455.1) has been produced by the Ag100Pest project, with annotations from NCBI's RefSeq resource.
Resource Title: Neodiprion lecontei Official Gene Set v1.1.
File Name: neolec_OGSv1.1.tar.gz
Resource Description: The files in this directory are derived from Neolec OGSv1.0 (not publicly released). The gff3 file was updated to assembly GCA_001263575.2 (https://www.ncbi.nlm.nih.gov/assembly/GCA_001263575.2) using CrossMap v0.2.8 (http://crossmap.sourceforge.net/).
\nneolec_OGSv1.1.gff3: Neolec OGSv1.0, updated to GCA_001263575.2\nneolec_OGSv1.1_removed.tsv: Features from Neolec OGSv1.0 that were removed in the update\nneolec_OGSv1.1_summary.tsv: The % of individual features from Neolec OGSv1.0 that were retained in the update\nNlec_v1_transcripts_renamed_alphabetized.fasta: Transcript sequences derived from Neolec OGSv1.0\nNlec_v1_proteins_renamed_alphabetized.fasta: Protein sequences derived from Neolec OGSv1.0\n
The Nitrogen Decision Aid is a computerized program that predicts the amount of N mineralized from planting to side-dress or 5-leaf growth-stage. By applying just enough N-fertilizer to reach the critical soil nitrate concentration it is possible reduce this waste. This model is designed for Northern climates that will have some frost in the soil during the winter.
\nEach Year more than 10 billion kg of nitrogen fertilizer are applied to croplands in the United States at a cost of more that $3.5 billion (USDA Economics and Statistics System, 1998). It is estimated that the efficiency of this applied nitrogen (N) ranges from about 30% to about 70% (Pilbeam, 1998); thus, large amounts of fertilizer N are lost or wasted each year.
\nThe Nitrogen Decision Aid is a computerized program that predicts the amount of N mineralized from planting to side-dress or 5-leaf growth-stage. By applying just enough N-fertilizer to reach the critical soil nitrate concentration it is possible reduce this waste. This model is designed for Northern climates that will have some frost in the soil during the winter.
Resource Title: Nitrogen Decision Aid.
File Name: Web Page, url: https://www.ars.usda.gov/research/software/download/?softwareid=85&modecode=50-60-05-00
download page
Nitrogen Rate Study for Greenhouse gas Reduction through Agricultural Carbon Enhancement network in Fort Collins, Colorado\nNitrogen fertilization is essential for optimizing crop yields; however, it increases N2O emissions. These emissions were monitored from several irrigated cropping systems receiving N fertilizer rates ranging from 0-246 kg/ha from years 2002-2006. Cropping systems included conventional-till continuous corn and no-till continuous corn at varying N rates. Nitrous oxide fluxes were measured during four growing seasons using static, vented chambers and a gas chromatograph analyzer. This work shows that the use of no-till can potentially reduce N2O emissions from irrigated systems and increase soil carbon storage.
Resource Title: Fort Collins, CO Nitrogen Rate Study (COFOARD1) CSV data.
File Name: COFOARD1_csv_data.zip
Resource Description: CSV format data on Experimental Units, Field Sites, Greenhouse Gas Flux, Soil Chemistry, Soil Physics, Yield Nutrient Uptake, Amendments, Planting, Tillage, Persons, Treatments, Weather Daily, Weather Station.
Nitrogen Source Study for Greenhouse gas Reduction through Agricultural Carbon Enhancement network in Fort Collins, Colorado\nNitrogen fertilization is essential for optimizing crop yields; however, it increases N2O emissions. The study objective was to compare N2O emissions resulting from application of commercially available enhanced-effi ciency N fertilizers with emissions from conventional dry granular urea in irrigated cropping systems. These emissions were monitored from several irrigated cropping systems receiving N fertilizer rates ranging from 0-246 kg/ha from years 2007-2008 with intermediate rates of 157 kg/ha applied to the barley crop in corn-barley rotation and 56 kg/ha applied to the dry bens in the corn-dry bean rotation. Cropping systems included conventional-till continuous corn (CT-CC), no-till continuous corn (NT-CC), no-till corn–dry bean (NT-CDb), and no-till corn–barley (NT-CB). Nitrous oxide fluxes were measured during ten growing seasons using static, vented chambers and a gas chromatograph analyzer. This work shows that the use of no-till and enhanced-effi ciency N fertilizers can potentially reduce N2O emissions from irrigated systems.
Resource Title: Fort Collins, CO Nitrogen Source Study (COFOARD2) CSV data.
File Name: COFOARD2_csv_data.zip
Resource Description: CSV format data on Experimental Units, Field Sites, Greenhouse Gas Flux, Residue Management, Soil Biology, Soil Chemistry, Soil Physics, Amendments, Planting, Tillage, Persons, Treatments, Weather Daily, Weather Station.
Nitrogen Source Study for Greenhouse gas Reduction through Agricultural Carbon Enhancement network in Fort Collins, Colorado\nNitrogen fertilization is essential for optimizing crop yields; however, it increases N2O emissions. The study objective was to compare N2O emissions resulting from application of commercially available enhanced-effi ciency N fertilizers with emissions from conventional dry granular urea in irrigated cropping systems. These emissions were monitored from several irrigated cropping systems receiving N fertilizer rates ranging from 0-246 kg/ha from years 2007-2008 with intermediate rates of 157 kg/ha applied to the barley crop in corn-barley rotation and 56 kg/ha applied to the dry bens in the corn-dry bean rotation. Cropping systems included conventional-till continuous corn (CT-CC), no-till continuous corn (NT-CC), no-till corn–dry bean (NT-CDb), and no-till corn–barley (NT-CB). Nitrous oxide fluxes were measured during ten growing seasons using static, vented chambers and a gas chromatograph analyzer. This work shows that the use of no-till and enhanced-effi ciency N fertilizers can potentially reduce N2O emissions from irrigated systems.
Resource Title: GeoData catalog record.
File Name: Web Page, url: https://geodata.nal.usda.gov/geonetwork/srv/eng/catalog.search;jsessionid=6BDC7D66926FA0429979C09A9A3B0601?node=srv#/metadata/11aec7d7-2a2a-4b52-ae96-990001c7d994
Nitrogen Source Study for Greenhouse gas Reduction through Agricultural Carbon Enhancement network in Mandan, North Dakota\nUse of dietary amendments to reduce nitrogen (N) in excreta represents a possible strategy to decrease greenhouse gas (GHG) emissions from livestock. In this regard, ingestion of small amounts of condensed quebracho tannin has been found to reduce N concentration in livestock urine. In this study, we sought to quantify the effects of tannin-affected cattle urine, normal cattle urine, and NH4NO3 in solution on greenhouse gas flux. Carbon dioxide (CO2), methane (CH4), and nitrous oxide (N2O) flux was measured using static chamber methodology from the three N treatments and a no application control over a six-week period in a mixed grass prairie in west-central North Dakota, USA. Over the course of the study, average CO2 emission was greatest from normal urine (335 ± 8 mg C m-2 hr-1) and least from the control (229 ± 19 mg C m-2 hr-1), with intermediate fluxes for the tannin urine and NH4NO3 treatments (290 ± 27 and 286 ± 54 mg C m-2 hr-1, respectively). Methane uptake was prevalent throughout the study, as soil conditions were predominantly warm and dry. Uptake of CH4 was greatest within the control (-30 ± 2 µg C m-2 hr-1) and least in the tannin urine treatment (-12 ± 4 µg C m-2 hr-1). Uptake of CH4 was over 40% less within the tannin urine treatment as compared to normal urine, and may have been repressed by the capacity of tannin to bind monooxygenases responsible for CH4 oxidation. Average N2O emission from NH4NO3 solution was more than twice that of all other treatments. Though the tannin urine treatment possessed 34% less N than normal cattle urine, cumulative N2O emission between the treatments did not differ. Results from this study suggest the use of condensed quebracho tannin as a dietary amendment for livestock does not yield GHG mitigation benefits in the short-term.
Resource Title: GeoData catalog record.
File Name: Web Page, url: https://geodata.nal.usda.gov/geonetwork/srv/eng/catalog.search#/metadata/40cfe233-a757-4049-b1e8-eb37b1c017e0
This code is implements the nondominated sorting genetic algorithm (NSGA-II) in the R statistical programming language. The function is theoretically applicable to any number of objectives without modification. The function automatically detects the number of objectives from the population matrix used in the function call. NSGA-II has been applied in ARS research for automatic calibration of hydrolgic models (whittaker link) and economic optimization (whittaker link).
Resource Title: Non-dominated Sorting Genetic Algorithm-II.
File Name: Web Page, url: https://www.ars.usda.gov/research/software/download/?softwareid=393&modecode=20-72-05-00
download page
Northwest Weather Service, Lind Station located near Lind, WA
Resource Title: GeoData Catalog record.
File Name: Web Page, url: https://geodata.nal.usda.gov/geonetwork/srv/eng/catalog.search#/metadata/7ce58496-3fe5-4496-b102-f2df0d7cd81e
Northwest Weather Service, Palouse Conservation Field Station located at Palouse Conservation Field Station near Pullman, WA
\nDAILY DATA FOR A MONTH - daily maximum, minimum and average temperature (degrees F), average temperature departure from normal (degrees F), heating and cooling degree days (base 65), precipitation, snowfall and snow depth (inches) for all days of the selected month. Basic monthly summary statistics are also provided.
Resource Title: GeoData catalog record.
File Name: Web Page, url: https://geodata.nal.usda.gov/geonetwork/srv/eng/catalog.search#/metadata/8f831fbe-15db-443b-bb77-054a68da672e
This is growth and development data (primarily fresh and dry weight of corn, soil and plant nutrient levels, and photos) for corn growing with or without weeds that were supplemented with different levels of fertilizers.
\nResources in this dataset:
\nA hydrologic simulation model for studying the effects of management practices on movement of sediment and chemicals in response to rainfall or irrigation on small field areas. Includes models for plant growth and nutrient cycling, and operates on a continuous basis. Weather conditions and rainfall may be stochastically simulated.
Resource Title: OPUS.
File Name: Web Page, url: https://www.ars.usda.gov/research/software/download/?softwareid=421&modecode=30-12-30-20
download page
ORPEGN Study for Greenhouse gas Reduction through Agricultural Carbon Enhancement network in Pendleton, Oregon\nNone
Resource Title: GeoData catalog record.
File Name: Web Page, url: https://geodata.nal.usda.gov/geonetwork/srv/eng/catalog.search#/metadata/97ac9f4c-898e-478a-8478-6eb25b7049ab
OTUshuff is a set of tools written in Perl to identify and correct for the presence of pseudo-diversity in contrasts between microbial communities. The variably weighted Odum dissimilarity (DwOdum) allows for down-weighting the influence of either abundant or rare taxa in calculating a measure of similarity between two communities. We show that down-weighting the influence of rare taxa can be used to minimize pseudo b-diversity arising from incomplete sampling. Down-weighting the influence of abundant taxa can increase the sensitivity of hypothesis testing. OTUshuff is an associated test for identifying the presence of pseudo-diversity in pairwise community contrasts.
Resource Title: OTUshuff.
File Name: Web Page, url: https://www.ars.usda.gov/research/software/download/?softwareid=462&modecode=30-12-30-15
download page
On-Farm Residue Removal Study for Resilient Economic Agricultural Practices in Morris, Minnesota\nInterest in harvesting crop residues for energy has waxed and waned since the oil embargo of 1973. Since the at least the late 1990’s interest has been renewed due to concern of peak oil, highly volatile natural gas prices, replacing fossil fuel with renewable sources and a push for energy independence. The studies conducted on harvesting crop residues during the 1970’s and1980’s focused primarily on erosion risk and nutrient removal as a result early estimates of residue availability focused on erosion control (Perlack et al., 2005). More recently, the focus has expanded to also address harvest impacts on soil organic matter and other constraints (Wilhelm et al., 2007; Wilhelm et al., 2010). In West Central Minnesota, crop residues have been proposed a replacement for natural gas (Archer and Johnson, 2012) while nationally residues are also be considered for cellulosic ethanol production (US DOE, 2011). The objective of the on-farm study was to assess the impact of residue harvest on working farms with different management systems and soils. Indicators of erosion risk, soil organic matter, and crop productivity is response to grain plus cob, or grain plus stover compared to grain only harvest.
Resource Title: GeoData catalog record.
File Name: Web Page, url: https://geodata.nal.usda.gov/geonetwork/srv/eng/catalog.search#/metadata/fe5f312c-e9ad-4485-b5f9-7897f5bcd9f6
The Oncopeltus fasciatus genome was recently sequenced and annotated as part of the i5k pilot project by the Baylor College of Medicine. \nThe O. fasciatus research community has manually reviewed and curated the computational gene predictions and generated an official gene set, OGSv1.1.
\nOncopeltus fasciatus has been an established lab organism for over 60 years, and has been used for a wide range of studies from physiology to development and evolution. As a relatively conservative and generalized species, it affords a baseline against which other species can be compared.
\nFor example, this species has the same piercing and sucking type mouthparts as its less benign relatives, including the blood-sucking kissing bug, Rhodnius prolixus, and the brown marmorated stink bug, Halyomorpha halys, which are disease vector and agricultural pest species, respectively. Unlike the pest species, the benign, seed-feeding Oncopeltus can be functionally investigated in the lab by RNA interference (RNAi). Comparing the genomes, and conducting experimental lab work in Oncopeltus, will help to identify unique features of the pest species, and thus inform management strategies for them.
\nMore generally, Oncopeltus is a key species for comparisons across the insects. It is one of the few experimentally tractable hemimetabolous species that can ground comparisons with the completely metamorphosing species of the Holometabola (e.g., flies, beetles, wasps). Topics investigated in this framework include reproductive biology and development of the legs, wings, body segments, extraembryonic membranes, and overall establishment of the body plan.
\nThis dataset presents the Oncopeltus fasciatus gene set BCM_v_0.5.3, which was generated computationally. RNA-Seq data was used with additional protein homology data for a MAKER automated annotation of the Oncopeltus fasciatus genome assembly 1.0. Further annotation method details will be available in a forthcoming publication.
\nNOTE: This gene set is an unstable pre-release (v0.5.3), and was provided to facilitate manual curation and analyses before the official gene set is released. Gene identifiers from this gene set will likely not be maintained.
\nIf you wish to use this dataset, please follow the Baylor College of Medicine's conditions for data use: https://www.hgsc.bcm.edu/bcm-hgsc-conditions-use
\nResource Title: Oncopeltus fasciatus genome annotations v0.5.3 for genome assembly Oncopeltus fasciatus v1.0.
File Name: oncfas_BCM_version_0.5.3.tar__0.gz
Resource Description:
The attached tar.gz archive (oncfas_BCM_version_0.5.3.tar_.gz) contains the following folders:
\n\nBCM_version_0.5.3. This folder contains evidence files in gff3 format underlying the final gene predictions.
\n\nBCM_version_0.5.3/consensus_gene_set. This folder contains the following files:
\n\nOFAS.CDS.fna.gz. CDS sequences of Oncopeltus fasciatus genome annotations v0.5.3.
\n\nOFAS.faa.gz Amino acid sequences of Oncopeltus fasciatus genome annotations v0.5.3.
\n\nOFAS.fna.gz cDNA sequences of Oncopeltus fasciatus genome annotations v0.5.3.
\n\nOFAS.Models.gff3.gz Gff3 of all gene predictions of Oncopeltus fasciatus genome annotations v0.5.3.
\n\nOFAS.Models-NALmod.gff3.gz Gff3 of all gene predictions of Oncopeltus fasciatus genome annotations v0.5.3, modified by the National Agricultural Library to be compliant with gff3 specifications.
\nOrganic Amendment Study for Greenhouse gas Reduction through Agricultural Carbon Enhancement network and Nutrient Use and Outcome Network in Fort Collins, Colorado\nDairy manure is commonly used in place of inorganic N fertilizers but the impacts on trace gas flux, yields and soil N are not well understood in the semiarid western US. CO2, N2O, and CH4 were monitored using surface chamnbers from 5 N treatments to determine their effect on greenhouse gas emissions from a tilled clay loam soil under irrigated, continuous corn production for a 3 yr. time period. Treatments included (i) partially composed dairy manure (DM) (412 kg N ha -1), (ii) DM + AgrotainPlus (DM + AP), (iii) enhanced efficiency N fertilizer (SuperU, or SUPRU) (179 kg N ha-1), (iv) Urea (179 kg N ha-1), and (v) check. These results highlight the importance of best-managemnet practices such as immediate irrigation after N application and use of urease and nitrification inhibitors to minimize N losses.
Resource Title: Fort Collins, CO Organic Amendment Study (COFOARD4) CSV data.
File Name: COFOARD4_csv_data.zip
Resource Description: CSV format data on Experimental Units, Field Sites, Greenhouse Gas Flux, Harvest Fraction, Nutrient Efficiency, Residue Management, Soil Chemistry, Soil Physics, Amendments, Growth Stages, Planting, Tillage, Persons, Treatments, Weather Daily, Weather Station.
Genome was assembled from a single male, gDNA isolated from the flight muscle using the Gentra Puregene kit. PacBio S2 sequencing at 127x coverage, polished with NextSeq-500 Illumina reads at >150x coverage.
\nThe project is funded by the USDA Agricultural Research Service and North Dakota State University through a Track-2 EPSCoR grant (NSF-EPSCoR-1826834).
Resource Title: Osmia lignaria genome assembly release v1.
File Name: OligGenome-v1.zip
The P-TRAP software allows a user to design different types of phosphorus removal structures based on site conditions, phosphorus absorbing material characteristics and structure parameters. The P-TRAP software allows users to explore different designs to meet performance goals for P removal amounts and material lifetime. A database of P absorbing material characteristics is included based on previous laboratory experiments.
Resource Title: Website Pointer to P-TRAP Phosphorus Transport Reduction App .
File Name: Web Page, url: https://fargo.nserl.purdue.edu/p-trap/
The P-Trap (\"Phosphorus Transport Reduction\") software streamlines the process by asking the user to enter four basic categories of information, starting with a drop-down menu offering different design options. The program then calculates specifications for building the structure based on data the user entered, including expected water-flow rates, annual volume, dissolved phosphorus concentration in water, drainage ditch depth and slope, pipe diameter and desired phosphorus removal rate.
PAHAW Study for Greenhouse gas Reduction through Agricultural Carbon Enhancement network in University Park, Pennsylvania
\nResource Title: GeoData catalog record.
File Name: Web Page, url: https://geodata.nal.usda.gov/geonetwork/srv/eng/catalog.search#/metadata/dc740db3-833e-4570-a296-b5bed2e9d623
Please note: This software is no longer being updated or maintained, and is out of date.
\nProfit and Loss (PAL) Farm Budgeting Economic Software for Colorado Agriculture is a windows desktop software for analyzing farm operations budgets. The software was developed in cooperation with Colorado State University.
Resource Title: PAL.
File Name: Web Page, url: https://www.ars.usda.gov/research/software/download/?softwareid=243&modecode=30-12-30-25
Download page link: https://www.ars.usda.gov/research/software/download/?softwareid=243&modecode=30-12-30-25
PAUP Study for Resilient Economic Agricultural Practices in University Park, Pennsylvania
\nResource Title: GeoData catalog record.
File Name: Web Page, url: https://geodata.nal.usda.gov/geonetwork/srv/eng/catalog.search#/metadata/429040e1-69ff-4472-897d-179b23fc6258
Peanut Curing Manager (PECMAN) is a decision support system that assists drying facility managers with inventory control. It schedules sampling and removal times, estimates time remaining on dryer and current moisture content. Cooperators have reported reduced drying costs and improved peanut quality.
Resource Title: PECMAN Software.
File Name: Web Page, url: https://www.ars.usda.gov/research/software/download/?softwareid=202&modecode=60-44-05-00
download page
PHACE Study for Greenhouse gas Reduction through Agricultural Carbon Enhancement network in Cheyenne, Wyoming
\nResource Title: GeoData catalog record.
File Name: Web Page, url: https://geodata.nal.usda.gov/geonetwork/srv/eng/catalog.search#/metadata/5b4b1e8e-ab58-4bfa-a3f1-67e84ba71dd8
PIECE is a plant gene structure comparison and evolution database with 25 species. Annotated genes extracted from the species are classified based on the Pfam motif and phylogenetic trees are reconstructed for each gene category integrating exon-intron and protein motif information.
Resource Title: Web Page.
File Name: Web Page, url: https://probes.pw.usda.gov/piece/index.php
These two software programs have been developed to aid in the design and analysis of center pivot and traveling lateral sprinkler irrigation systems.
\nPIVNOZ
\nTo install the program, run SETUP.exe from the Pivnoz directory. This Windows program calculates nozzle sizes and estimates application rates for center pivot sprinkler systems and linearly traveling laterals, for commonly used sprinkler packages. It can be used to nozzle a complete pivot lateral or a section of a pivot lateral. The user must know the desired system capacity, the desired sprinkler spacing(s) along the lateral, and the nozzle pressure(s). Each of the input values can be entered in selected English or metric units as desired.
\nInitial inputs:\nSelect either pivot or linear. A linear will be nozzled uniformly.\nEnter the system capacity. This is the gross flow per unit area irrigated or the gross depth applied per day on an average daily basis. Any application efficiency estimate must be built in to this value. Select desired units (i.e., mm/day or gpm/acre).\nEnter the nozzle pressure. If you desire to use different pressures on different sections, run each section separately.
\nPivot inputs:\nEnter the beginning and end distances from the pivot of the section for which the nozzling is to be calculated.\nSelect fixed or variable nozzle spacing.\nFor fixed spacing, enter the desired nozzle spacing. For variable spacing enter the desired nozzle flow rate.
\nLinear inputs:\nEnter the desired nozzle spacing.\nEnter the length of the lateral.\nEnter the total travel distance of the lateral.\nEnter the percent downtime required for moving the supply hose, etc.
\nSprinkler package:
\nThe user may skip this section if only nozzle sizes are desired. Select a specific package by clicking on the drop down box on the right. A list of several available rotating or oscillating-plate packages will be presented. Consult Nelson or Senninger literature for more information on the specific models and plate types. Enter the total nozzle offset produced by the addition of fore and aft spray booms. Enter the mounting height above ground or above the average crop height. If a different type of sprinkler is desired, select the generic box and enter the approximate pattern width for that sprinkler.
\nOutputs:\nSelect English or Metric output.\nClick RUN to view the output on the right side of the screen.\nIf any of the inputs are changed, you must click RUN again to recalculate the output.\nNozzle sizes are given in English or metric units and equivalent numbered sizes (1/128 and 1/64 inch increments) used with most commercially available nozzle packages. The pattern width is the diameter of the spray pattern plus the nozzle offset entered above. The peak application rate is the approximate peak of the application rate pattern and not an instantaneous rate which can be much higher.\nThe output can be saved to a file or printed if desired.
\nPIPELOSS\nTo install the program, run SETUP.exe from the Pipeloss directory.\nThis Windows program calculates friction losses in individual pipe sections or laterals with multiple, uniformly spaced outlets, either uniform discharge laterals, or center pivot laterals. The program can also handle a lateral comprised of two pipe sections with different diameters and lengths. The program also supplies data on exact inside diameters and friction coefficients for most types of pipe used in irrigation. This software works with either English or Metric units. Pipeloss is installed as a popup Windows program. Additional help in running the program is available by pressing the \"readme\" button on the screen.
\nDownload each zipped program and explode in its own directory. You may also download the document file.
Resource Title: PIVNOZ-PIPELOSS web page and download form.
File Name: Web Page, url: https://www.ars.usda.gov/research/software/download/?softwareid=206&modecode=20-54-05-00
OPERATION OF THE PALOUSE, WASHINGTON 9WA240 NAPD/NTN SITE
Resource Title: Web Page.
File Name: Web Page, url: https://www.ars.usda.gov/Services/docs.htm?docid=18718
Panzea is an NSF-funded project called \"Biology of Rare Alleles in Maize and its Wild Relatives\". We are investigating the connection between phenotype (what we see) and genotype (the genes underlying the phenotype) - of complex traits in maize and its wild relative, teosinte, and specifically in how rare genetic variations contribute to overall plant function. These studies will enrich our knowledge of evolution, sustainable agriculture, and genetic diversity and conservation. Over the 10 years of the project, we have trained many new scientists at all levels and generated key resources for the public, teachers, and scientific researchers.
Resource Title: Panzea Data Sets and Genotype Search Tools.
File Name: Web Page, url: https://www.panzea.org/data
From here you can obtain the genotypic and phenotypic datasets produced by this project as flat files. You can also perform custom searches on our large genotypic data sets, to obtain smaller subsets of data for chromosomal regions or taxa subsets of interest. Two different genotype searches are available: one for GBS genotypes, and another for other types of genotypes (from maize HapMapV1 and V2, the MaizeSNP50 Bead Chip, and traditional SNPs).
Thirty-six years of aboveground net primary productivity (ANPP) data collected across a topographic sequence in the semiarid shortgrass steppe of North America to examine patterns and drivers of spatiotemporal variability in ANPP. ANPP data were collected from the 6,500 ha USDA-Central Plains Experimental Range (CPER), which is part of the Long-Term Agroecosystem Research (LTAR; 2012-present; https://ltar.ars.usda.gov/) network, a former Long-Term Ecological Research station (LTER, 1983-2012), and located in the shortgrass steppe of north-central Colorado, USA. Additional information and referenced materials about many of the long-term studies initiated on the CPER can be found: https://dx.doi.org/10.25675/10217/81141.
\nThe topography at the CPER is characterized by gently rolling hills, and the topographic positions for data collection were focused along a catena in one of the most common ecological sites on the CPER, Loamy Plains (ID: R067BY002CO; NRCS, 2020). The plant community included four herbaceous plant functional types (PFTs): 1) perennial, warm-season, C4 grasses (primarily Bouteloua gracilis [Willd. ex Kunth] Lag ex Griffiths and B. dactyloides [Nutt.] J.T. Columbus), 2) perennial, cool-season, C3 grasses (primarily Pascopyrum smithii [Rydb] A. Love and Hesperostipa comata [Trin. & Rupr.] Barkworth ssp. comata), 3) cool-season, annual grass (Vulpia octoflora [Walter] Rydb.), and 4) forbs (primarily Sphaeralcea coccinea [Nutt.] Rydb.). Shrubs, subshrubs, and cactus were present but do not represent a large component of total ANPP and were not included in this study.
\nDaily precipitation data were obtained from a long-term (1979-2018) precipitation gauge associated with the National Atmospheric Deposition program (Site ID: NTN-CO22; http://nadp.slh.wisc.edu/), located on site. Missing precipitation data were gap-filled using CPER headquarters data (1939-2018), or from the Soil Climate Analysis Network (SCAN) rain gauge (1997-2018, Site Number: 2017; https://wcc.sc.egov.usda.gov/), depending on proximity and temporal overlap. Following gap-filling, precipitation data were omitted if >10% of the time series was missing for each focal time period (e.g. fall or spring).
Resource Title: Gap filled precipitation data from the Central Plains Experimental Range, Nunn, Colorado from 1980-2018.
File Name: CPER-PPT_gapfilled_1980-2018.csv
Resource Title: Data Dictionary for Gap filled precipitation data from the Central Plains Experimental Range, Nunn, Colorado from 1980-2018.
File Name: CPER-PPT_DataDictionary.csv
Resource Title: Long-Term aboveground net primary production for functional group types on the Central Plains Experimental Range, Nunn, Colorado from 1983-2018.
File Name: CPER-LTNPP_bypft_1983-2018.csv
Resource Title: Data Dictionary for Long-Term aboveground net primary production for functional group types on the Central Plains Experimental Range, Nunn, Colorado from 1983-2018.
File Name: CPER-LTNPP_bypft_1983-2018_DataDictionary.csv
Resource Title: Dictionary of species within each functional group type in the LTNPP data collected on the Central Plains Experimental Range, Nunn, Colorado from 1983-2018.
File Name: CPER-LTNPP_bypft_1983-2018_SppInFG_DataDictionary.csv
PeanutBase (peanutbase.org) is the primary genetics and genomics database for cultivated peanut and its wild relatives. It houses information about genome sequences, genes and predicted functions, genetic maps, markers, links to germplasm resources, and maps of peanut germplasm origins.
\nThis resource is being developed for U.S. and International peanut researchers and breeders, with support from The Peanut Foundation and the many contributors that have made the Peanut Genomics Initiative possible. Funded by The Peanut Foundation as part of the Peanut Genomics Initiative. Additional support from USDA-ARS. Database developed and hosted by the USDA-ARS SoyBase and Legume Clade Database group at Ames, IA, with NCGR and other participants.
Resource Title: PeanutBase.org.
File Name: Web Page, url: https://peanutbase.org
Website pointer for PeanutBase.org - Genetic and genomic data to enable more rapid crop improvement in peanuts.
\nThe peanut genome has been sequenced and analyzed as part of the International Peanut Genomic Initiative, in order to accelerate breeding progress and get more productive, disease-resistant, stress-tolerant varieties to farmers. The two diploid progenitors have been sequenced and are available, along with predicted genes and descriptions. The genomes of the diploid progenitors will be used to help identify and assemble the similar chromosomes in cultivated peanut. Cultivated peanut, Arachis hypogaea, is an allotetraploid (2n=4x=40) that contains two complete genomes, labeled the A and B genomes. A. duranensis (2n=2x=20) has likely contributed the A genome, and A. ipaensis has likely contributed the B genome. It may be helpful to remember these two associations by using the mnemonic: \"A\" comes before \"B\" and \"duranensis\" comes before \"ipaensis\". Because of the difficulty of assembly a tetraploid genome, the two diploids, A. duranensis and A. ipaensis, have been sequenced and assembled first. Together these provide a good initial basis for the tetraploid genome. Additionally, the two will help guide assembly of the tetraploid genome. Sequencing work on the tetraploid genome is underway; stay tuned for updates in 2015.
The objective of this ongoing study is to determine the effect of cattle grazing and shrub removal on the decline and recovery of perennial grasses in a mesquite-invaded black grama grassland on sandy soils in the northern Chihuahuan Desert. The experiment was implemented as a randomized complete block with 3 levels of grazing (summer, winter, and control) and 2 levels of shrub treatment (shrub removal and control) in each of 3 replicate blocks. The 18 experimental units are 0.5 ha (70 x 70 m) exclosures constructed in a mesquite-invaded black grama grassland in the southwest portion of the Jornada Experimental Range in Dona Ana County, New Mexico, USA. Vegetation sampling was conducted with the line-point intercept method. Initial pre-treatment sampling occurred in 1996. Grazing treatments removed 65-80% of aboveground perennial grass biomass over 24-36 hour periods in each of four years from summer 1996 to winter 2000; shrub removal occurred during this time as well. No livestock grazing or shrub removal have occurred since 2000. Post-treatment sampling occurred in 2002, 2009, and 2016.
Resource Title: Website Pointer to html file.
File Name: Web Page, url: https://portal.edirepository.org/nis/mapbrowse?scope=knb-lter-jrn&identifier=210461001
Webpage with information and links to data files for download
Datasheet for the abundance of total bacteria, gram positive indicator bacteria, horizontal gene transfer indicator genes and antibiotic resistance genes in the soil measured over 3 years.
Resource Title: Beef cattle backgrounding data.
File Name: ANF data_rearranged.xlsx
Resource Description: Abundance of bacteria and antibiotic resistance genes in the soil in beef cattle backgrounding environment
Resource Title: Beef cattle backgrounding nutrient data.
File Name: ANS-nutrient data combined.xlsx
Resource Description: Physical and nutrient measurements in the soil associated with beef cattle backgrounding environment
Resource Title: Beef cattle backgrounding nutrient data.
File Name: ANS-nutrient data combined (1).csv
Resource Description: Physical and nutrient measurements in the soil associated with beef cattle backgrounding environment
Resource Title: Beef cattle backgrounding data.
File Name: ANF data_rearranged.csv
Resource Description: Abundance of bacteria and antibiotic resistance genes in the soil in beef cattle backgrounding environment
Resource Title: Data Dictionary - Persistence of antibiotic resistance genes in beef cattle backgrounding environment after cessation of operation.
File Name: DataDictionary_persistence_antibiotic_res_genes.csv
This data set consists of repeat digital imagery from a tower-mounted digital camera (hereafter, PhenoCam) maintained by the USDA-ARS Hydrology Remote Sensing Laboratory (HRSL) in the Lower Chesapeake Bay (LCB) watershed. HRSL is a member of the PhenoCam network, which has as its mission to serve as a long-term, continental-scale, phenological observatory. Imagery is uploaded to the PhenoCam server every 30 minutes. The archived images provide a permanent record that can be visually-inspected to determine the phenological state of the vegetation at any point in time. Vegetation greenness metrics (e.g., GCC) derived from the ratio of the green color band to sum of red, green, and blue color bands serve as proxies for vegetation greenness. Greenness metrics can be extracted from the images using simple image processing methods in 1-day or 3-day increments.
\nThis dataset is available to the public and may be freely downloaded. Please keep the designated Contact person informed of any plans to use the dataset. Consultation or collaboration with the original investigators is strongly encouraged. Publications and data products that make use of the dataset must include proper acknowledgement.
\nThe development of PhenoCam has been supported by multiple entities. Those include the Northeastern States Research Cooperative, NSF’s Macrosystems Biology program (award EF-1065029), DOE’s Regional and Global Climate Modeling program (award DE-SC0016011), the US National Park Service Inventory and Monitoring Program, the USA National Phenology Network (grant number G10AP00129 from the United States Geological Survey), and is currently supported by the Department of Agriculture (USDA) Agricultural Research Service.
\nThis research was a contribution from the Long-Term Agroecosystem Research (LTAR) network. LTAR is supported by the United States Department of Agriculture (USDA) Agricultural Research Service.
", "title": "PhenoCam images from ARSLTARMDCR site, Caroline County, Maryland, USA since 2017", "distribution": [ { "@type": "dcat:Distribution", "downloadURL": "https://phenocam.nau.edu/webcam/sites/arsltarmdcr/", "mediaType": "text/html", "title": "https://phenocam.nau.edu/webcam/sites/arsltarmdcr/" } ], "license": "https://www.usa.gov/publicdomain/label/1.0/", "bureauCode": [ "005:18" ], "modified": "2024-02-20", "publisher": { "@type": "org:Organization", "name": "Agricultural Research Service" }, "keyword": [ "phenology", "NP211", "NP212", "phenocam", "long-term monitoring sites", "LTAR", "Choptank River", "corn-soybean rotation", "primary productivity", "data.gov", "ARS" ], "spatial": "{\"type\": \"Point\", \"coordinates\": [-75.8513, 39.0587]}" }, { "identifier": "10113/AA758809", "accessLevel": "public", "contactPoint": { "hasEmail": "mailto:Greg.McCarty@usda.gov", "fn": "McCarty, Greg" }, "programCode": [ "005:040" ], "description": "This data set consists of repeat digital imagery from a tower-mounted digital camera (hereafter, PhenoCam) maintained by the USDA-ARS Hydrology Remote Sensing Laboratory (HRSL) in the Lower Chesapeake Bay (LCB) watershed. HRSL is a member of the PhenoCam network, which has as its mission to serve as a long-term, continental-scale, phenological observatory. Imagery is uploaded to the PhenoCam server every 30 minutes. The archived images provide a permanent record that can be visually-inspected to determine the phenological state of the vegetation at any point in time. Vegetation greenness metrics (e.g., GCC) derived from the ratio of the green color band to sum of red, green, and blue color bands serve as proxies for vegetation greenness. Greenness metrics can be extracted from the images using simple image processing methods in 1-day or 3-day increments.
\nThis dataset is available to the public and may be freely downloaded. Please keep the designated Contact person informed of any plans to use the dataset. Consultation or collaboration with the original investigators is strongly encouraged. Publications and data products that make use of the dataset must include proper acknowledgement.
\nThe development of PhenoCam has been supported by multiple entities. Those include the Northeastern States Research Cooperative, NSF’s Macrosystems Biology program (award EF-1065029), DOE’s Regional and Global Climate Modeling program (award DE-SC0016011), the US National Park Service Inventory and Monitoring Program, the USA National Phenology Network (grant number G10AP00129 from the United States Geological Survey), and is currently supported by the Department of Agriculture (USDA) Agricultural Research Service.
\nThis research was a contribution from the Long-Term Agroecosystem Research (LTAR) network. LTAR is supported by the United States Department of Agriculture (USDA) Agricultural Research Service.
", "title": "PhenoCam images from ARSLTARMDCRNATW site, Caroline County, Maryland, USA since 2019", "distribution": [ { "@type": "dcat:Distribution", "downloadURL": "https://phenocam.nau.edu/webcam/sites/arsltarmdcrnatw/", "mediaType": "text/html", "title": "https://phenocam.nau.edu/webcam/sites/arsltarmdcrnatw/" } ], "license": "https://www.usa.gov/publicdomain/label/1.0/", "bureauCode": [ "005:18" ], "modified": "2024-02-20", "publisher": { "@type": "org:Organization", "name": "Agricultural Research Service" }, "keyword": [ "phenology", "NP211", "NP212", "phenocam", "long-term monitoring sites", "LTAR", "Choptank River", "wetlands", "primary productivity", "data.gov", "ARS" ], "spatial": "{\"type\": \"Point\", \"coordinates\": [-75.7531, 39.0575]}" }, { "identifier": "10113/AA758811", "accessLevel": "public", "contactPoint": { "hasEmail": "mailto:Greg.McCarty@usda.gov", "fn": "McCarty, Greg" }, "programCode": [ "005:040" ], "description": "This data set consists of repeat digital imagery from a tower-mounted digital camera (hereafter, PhenoCam) maintained by the USDA-ARS Hydrology Remote Sensing Laboratory (HRSL) in the Lower Chesapeake Bay (LCB) watershed. HRSL is a member of the PhenoCam network, which has as its mission to serve as a long-term, continental-scale, phenological observatory. Imagery is uploaded to the PhenoCam server every 30 minutes. The archived images provide a permanent record that can be visually-inspected to determine the phenological state of the vegetation at any point in time. Vegetation greenness metrics (e.g., GCC) derived from the ratio of the green color band to sum of red, green, and blue color bands serve as proxies for vegetation greenness. Greenness metrics can be extracted from the images using simple image processing methods in 1-day or 3-day increments.
\nThis dataset is available to the public and may be freely downloaded. Please keep the designated Contact person informed of any plans to use the dataset. Consultation or collaboration with the original investigators is strongly encouraged. Publications and data products that make use of the dataset must include proper acknowledgement.
\nThe development of PhenoCam has been supported by multiple entities. Those include the Northeastern States Research Cooperative, NSF’s Macrosystems Biology program (award EF-1065029), DOE’s Regional and Global Climate Modeling program (award DE-SC0016011), the US National Park Service Inventory and Monitoring Program, the USA National Phenology Network (grant number G10AP00129 from the United States Geological Survey), and is currently supported by the Department of Agriculture (USDA) Agricultural Research Service.
\nThis research was a contribution from the Long-Term Agroecosystem Research (LTAR) network. LTAR is supported by the United States Department of Agriculture (USDA) Agricultural Research Service.
", "title": "PhenoCam images from ARSLTARMDCRPRCW site, Caroline County, Maryland, USA since 2019", "distribution": [ { "@type": "dcat:Distribution", "downloadURL": "https://phenocam.nau.edu/webcam/sites/arsltarmdcrprcw/", "mediaType": "text/html", "title": "https://phenocam.nau.edu/webcam/sites/arsltarmdcrprcw/" } ], "license": "https://www.usa.gov/publicdomain/label/1.0/", "bureauCode": [ "005:18" ], "modified": "2024-02-20", "publisher": { "@type": "org:Organization", "name": "Agricultural Research Service" }, "keyword": [ "phenology", "NP211", "NP212", "phenocam", "long-term monitoring sites", "LTAR", "Choptank River", "wetlands", "corn-soybean rotation", "primary productivity", "data.gov", "ARS" ], "spatial": "{\"type\": \"Point\", \"coordinates\": [-75.7609, 39.0667]}" }, { "identifier": "10113/AA758813", "accessLevel": "public", "contactPoint": { "hasEmail": "mailto:Greg.McCarty@usda.gov", "fn": "McCarty, Greg" }, "programCode": [ "005:040" ], "description": "This data set consists of repeat digital imagery from a tower-mounted digital camera (hereafter, PhenoCam) maintained by the USDA-ARS Hydrology Remote Sensing Laboratory (HRSL) in the Lower Chesapeake Bay (LCB) watershed. HRSL is a member of the PhenoCam network, which has as its mission to serve as a long-term, continental-scale, phenological observatory. Imagery is uploaded to the PhenoCam server every 30 minutes. The archived images provide a permanent record that can be visually-inspected to determine the phenological state of the vegetation at any point in time. Vegetation greenness metrics (e.g., GCC) derived from the ratio of the green color band to sum of red, green, and blue color bands serve as proxies for vegetation greenness. Greenness metrics can be extracted from the images using simple image processing methods in 1-day or 3-day increments.
\nThis dataset is available to the public and may be freely downloaded. Please keep the designated Contact person informed of any plans to use the dataset. Consultation or collaboration with the original investigators is strongly encouraged. Publications and data products that make use of the dataset must include proper acknowledgement.
\nThe development of PhenoCam has been supported by multiple entities. Those include the Northeastern States Research Cooperative, NSF’s Macrosystems Biology program (award EF-1065029), DOE’s Regional and Global Climate Modeling program (award DE-SC0016011), the US National Park Service Inventory and Monitoring Program, the USA National Phenology Network (grant number G10AP00129 from the United States Geological Survey), and is currently supported by the Department of Agriculture (USDA) Agricultural Research Service.
\nThis research was a contribution from the Long-Term Agroecosystem Research (LTAR) network. LTAR is supported by the United States Department of Agriculture (USDA) Agricultural Research Service.
", "title": "PhenoCam images from ARSLTARMDCRRESW site, Caroline County, Maryland, USA since 2019", "distribution": [ { "@type": "dcat:Distribution", "downloadURL": "https://phenocam.nau.edu/webcam/sites/arsltarmdcrresw/", "mediaType": "text/html", "title": "https://phenocam.nau.edu/webcam/sites/arsltarmdcrresw/" } ], "license": "https://www.usa.gov/publicdomain/label/1.0/", "bureauCode": [ "005:18" ], "modified": "2024-02-20", "publisher": { "@type": "org:Organization", "name": "Agricultural Research Service" }, "keyword": [ "phenology", "NP211", "NP212", "phenocam", "long-term monitoring sites", "LTAR", "Choptank River", "wetlands", "primary productivity", "data.gov", "ARS" ], "spatial": "{\"type\": \"Point\", \"coordinates\": [-75.7532, 39.0549]}" }, { "identifier": "10113/AA758805", "accessLevel": "public", "contactPoint": { "hasEmail": "mailto:Greg.McCarty@usda.gov", "fn": "McCarty, Greg" }, "programCode": [ "005:040" ], "description": "This data set consists of repeat digital imagery from a tower-mounted digital camera (hereafter, PhenoCam) maintained by the USDA-ARS Hydrology Remote Sensing Laboratory (HRSL) in the Lower Chesapeake Bay (LCB) watershed. HRSL is a member of the PhenoCam network, which has as its mission to serve as a long-term, continental-scale, phenological observatory. Imagery is uploaded to the PhenoCam server every 30 minutes. The archived images provide a permanent record that can be visually-inspected to determine the phenological state of the vegetation at any point in time. Vegetation greenness metrics (e.g., GCC) derived from the ratio of the green color band to sum of red, green, and blue color bands serve as proxies for vegetation greenness. Greenness metrics can be extracted from the images using simple image processing methods in 1-day or 3-day increments.
\nThis dataset is available to the public and may be freely downloaded. Please keep the designated Contact person informed of any plans to use the dataset. Consultation or collaboration with the original investigators is strongly encouraged. Publications and data products that make use of the dataset must include proper acknowledgement.
\nThe development of PhenoCam has been supported by multiple entities. Those include the Northeastern States Research Cooperative, NSF’s Macrosystems Biology program (award EF-1065029), DOE’s Regional and Global Climate Modeling program (award DE-SC0016011), the US National Park Service Inventory and Monitoring Program, the USA National Phenology Network (grant number G10AP00129 from the United States Geological Survey), and is currently supported by the Department of Agriculture (USDA) Agricultural Research Service.
\nThis research was a contribution from the Long-Term Agroecosystem Research (LTAR) network. LTAR is supported by the United States Department of Agriculture (USDA) Agricultural Research Service.
", "title": "PhenoCam images from ARSOPE3LTAR site, Beltsville Agricultural Research Center, Maryland, USA since 2017", "distribution": [ { "@type": "dcat:Distribution", "downloadURL": "https://phenocam.nau.edu/webcam/sites/arsope3ltar/", "mediaType": "text/html", "title": "https://phenocam.nau.edu/webcam/sites/arsope3ltar/" } ], "license": "https://www.usa.gov/publicdomain/label/1.0/", "bureauCode": [ "005:18" ], "modified": "2024-02-20", "publisher": { "@type": "org:Organization", "name": "Agricultural Research Service" }, "keyword": [ "phenology", "NP211", "NP212", "phenocam", "long-term monitoring sites", "LTAR", "Beltsville", "OPE3", "digital image", "corn", "primary productivity", "data.gov", "ARS" ], "spatial": "{\"type\": \"Point\", \"coordinates\": [-76.8442, 39.0309]}" }, { "identifier": "10113/AA233", "accessLevel": "public", "contactPoint": { "hasEmail": "mailto:dawn.browning@ars.usda.gov", "fn": "Browning, Dawn" }, "programCode": [ "005:040" ], "description": "This data set consists of repeat digital imagery from the tower-mounted digital cameras (hereafter, PhenoCams) at the Jornada Experimental Range. JER is a member of the PhenoCam network, which has as its mission to serve as a long-term, continental-scale, phenological observatory. Imagery is uploaded to the PhenoCam server every 30 minutes. The archived images provide a permanent record that can be visually-inspected to determine the phenological state of the vegetation at any point in time. Vegetation greenness metrics (e.g., GCC) derived from the ratio of the green color band to sum of red, green, and blue color bands serve as proxies for vegetation greenness. Greenness metrics can be extracted from the images using simple image processing methods in 1-day or 3-day increments.\nThis dataset is available to the public and may be freely downloaded. Please keep the designated Contact person informed of any plans to use the dataset. Consultation or collaboration with the original investigators is strongly encouraged. Publications and data products that make use of the dataset must include proper acknowledgement.\nThe development of PhenoCam has been supported by multiple entities. Those include the Northeastern States Research Cooperative, NSF’s Macrosystems Biology program (award EF-1065029), DOE’s Regional and Global Climate Modeling program (award DE-SC0016011), the US National Park Service Inventory and Monitoring Program, the USA National Phenology Network (grant number G10AP00129 from the United States Geological Survey), and is currently supported by the Department of Agriculture (USDA) Agricultural Research Service.\nThis research is a contribution from the Long-Term Agroecosystem Research (LTAR) network. LTAR and the Jornada Experimental Range are supported by the United States Department of Agriculture (USDA) Agricultural Research Service.
\nResource Title: PhenoCam images from JERBAJADA.
File Name: Web Page, url: https://phenocam.sr.unh.edu/webcam/sites/jerbajada/
This data set consists of repeat digital imagery from the tower-mounted digital cameras (hereafter, PhenoCams) at the Jornada Experimental Range. JER is a member of the PhenoCam network, which has as its mission to serve as a long-term, continental-scale, phenological observatory. Imagery is uploaded to the PhenoCam server every 30 minutes. The archived images provide a permanent record that can be visually-inspected to determine the phenological state of the vegetation at any point in time. Vegetation greenness metrics (e.g., GCC) derived from the ratio of the green color band to sum of red, green, and blue color bands serve as proxies for vegetation greenness. Greenness metrics can be extracted from the images using simple image processing methods in 1-day or 3-day increments.
\nThis dataset is available to the public and may be freely downloaded. Please keep the designated Contact person informed of any plans to use the dataset. Consultation or collaboration with the original investigators is strongly encouraged. Publications and data products that make use of the dataset must include proper acknowledgement.
\nThe development of PhenoCam has been supported by multiple entities. Those include the Northeastern States Research Cooperative, NSF’s Macrosystems Biology program (award EF-1065029), DOE’s Regional and Global Climate Modeling program (award DE-SC0016011), the US National Park Service Inventory and Monitoring Program, the USA National Phenology Network (grant number G10AP00129 from the United States Geological Survey), and is currently supported by the Department of Agriculture (USDA) Agricultural Research Service.
\nThis research is a contribution from the Long-Term Agroecosystem Research (LTAR) network. LTAR and the Jornada Experimental Range are supported by the United States Department of Agriculture (USDA) Agricultural Research Service.
", "title": "PhenoCam images from JERGRASSLAND site, Jornada Experimental Range, New Mexico, USA since 2019", "distribution": [ { "@type": "dcat:Distribution", "downloadURL": "https://phenocam.nau.edu/webcam/sites/jergrassland/", "mediaType": "text/html", "title": "https://phenocam.nau.edu/webcam/sites/jergrassland/" } ], "license": "https://www.usa.gov/publicdomain/label/1.0/", "bureauCode": [ "005:18" ], "modified": "2024-02-20", "publisher": { "@type": "org:Organization", "name": "Agricultural Research Service" }, "keyword": [ "primary productivity", "phenology", "NP216", "phenocam", "long-term monitoring sites", "LTAR", "New Mexico", "digital image", "data.gov", "ARS" ], "spatial": "{\"type\": \"Polygon\", \"coordinates\": [[[-106.99172973633, 32.467789054148], [-106.99172973633, 32.758136474891], [-106.60308837891, 32.758136474891], [-106.60308837891, 32.467789054148], [-106.99172973633, 32.467789054148]]]}" }, { "identifier": "10113/AA692787", "accessLevel": "public", "contactPoint": { "hasEmail": "mailto:dawn.browning@ars.usda.gov", "fn": "Browning, Dawn" }, "programCode": [ "005:040" ], "description": "This data set consists of repeat digital imagery from the tower-mounted digital cameras (hereafter, PhenoCams) at the Jornada Experimental Range. JER is a member of the PhenoCam network, which has as its mission to serve as a long-term, continental-scale, phenological observatory. Imagery is uploaded to the PhenoCam server every 30 minutes. The archived images provide a permanent record that can be visually-inspected to determine the phenological state of the vegetation at any point in time. Vegetation greenness metrics (e.g., GCC) derived from the ratio of the green color band to sum of red, green, and blue color bands serve as proxies for vegetation greenness. Greenness metrics can be extracted from the images using simple image processing methods in 1-day or 3-day increments.
\nThis dataset is available to the public and may be freely downloaded. Please keep the designated Contact person informed of any plans to use the dataset. Consultation or collaboration with the original investigators is strongly encouraged. Publications and data products that make use of the dataset must include proper acknowledgement.
\nThe development of PhenoCam has been supported by multiple entities. Those include the Northeastern States Research Cooperative, NSF’s Macrosystems Biology program (award EF-1065029), DOE’s Regional and Global Climate Modeling program (award DE-SC0016011), the US National Park Service Inventory and Monitoring Program, the USA National Phenology Network (grant number G10AP00129 from the United States Geological Survey), and is currently supported by the Department of Agriculture (USDA) Agricultural Research Service.
\nThis research is a contribution from the Long-Term Agroecosystem Research (LTAR) network. LTAR and the Jornada Experimental Range are supported by the United States Department of Agriculture (USDA) Agricultural Research Service.
", "title": "PhenoCam images from JERGRASSLAND2 site, Jornada Experimental Range, New Mexico, USA since 2022", "distribution": [ { "@type": "dcat:Distribution", "downloadURL": "https://phenocam.nau.edu/webcam/sites/jergrassland2/", "mediaType": "text/html", "title": "https://phenocam.nau.edu/webcam/sites/jergrassland2/" } ], "license": "https://www.usa.gov/publicdomain/label/1.0/", "bureauCode": [ "005:18" ], "modified": "2024-02-20", "publisher": { "@type": "org:Organization", "name": "Agricultural Research Service" }, "keyword": [ "primary productivity", "phenology", "NP216", "phenocam", "long-term monitoring sites", "LTAR", "New Mexico", "digital image", "data.gov", "ARS" ], "spatial": "{\"type\": \"Polygon\", \"coordinates\": [[[-106.99172973633, 32.467789054148], [-106.99172973633, 32.758136474891], [-106.60308837891, 32.758136474891], [-106.60308837891, 32.467789054148], [-106.99172973633, 32.467789054148]]]}" }, { "identifier": "10113/AA41448", "accessLevel": "public", "contactPoint": { "hasEmail": "mailto:dawn.browning@ars.usda.gov", "fn": "Browning, Dawn" }, "programCode": [ "005:040" ], "description": "This data set consists of repeat digital imagery from the tower-mounted digital cameras (hereafter, PhenoCams) at the Jornada Experimental Range. JER is a member of the PhenoCam network, which has as its mission to serve as a long-term, continental-scale, phenological observatory. Imagery is uploaded to the PhenoCam server every 30 minutes. The archived images provide a permanent record that can be visually-inspected to determine the phenological state of the vegetation at any point in time. Vegetation greenness metrics (e.g., GCC) derived from the ratio of the green color band to sum of red, green, and blue color bands serve as proxies for vegetation greenness. Greenness metrics can be extracted from the images using simple image processing methods in 1-day or 3-day increments.\nThis dataset is available to the public and may be freely downloaded. Please keep the designated Contact person informed of any plans to use the dataset. Consultation or collaboration with the original investigators is strongly encouraged. Publications and data products that make use of the dataset must include proper acknowledgement.\nThe development of PhenoCam has been supported by multiple entities. Those include the Northeastern States Research Cooperative, NSF’s Macrosystems Biology program (award EF-1065029), DOE’s Regional and Global Climate Modeling program (award DE-SC0016011), the US National Park Service Inventory and Monitoring Program, the USA National Phenology Network (grant number G10AP00129 from the United States Geological Survey), and is currently supported by the Department of Agriculture (USDA) Agricultural Research Service.\nThis research is a contribution from the Long-Term Agroecosystem Research (LTAR) network. LTAR and the Jornada Experimental Range are supported by the United States Department of Agriculture (USDA) Agricultural Research Service.
Resource Title: PhenoCam images from JERNORT.
File Name: Web Page, url: https://phenocam.sr.unh.edu/webcam/sites/jernort/
This data set consists of repeat digital imagery from the tower-mounted digital cameras (hereafter, PhenoCams) at the Jornada Experimental Range. JER is a member of the PhenoCam network, which has as its mission to serve as a long-term, continental-scale, phenological observatory. Imagery is uploaded to the PhenoCam server every 30 minutes. The archived images provide a permanent record that can be visually-inspected to determine the phenological state of the vegetation at any point in time. Vegetation greenness metrics (e.g., GCC) derived from the ratio of the green color band to sum of red, green, and blue color bands serve as proxies for vegetation greenness. Greenness metrics can be extracted from the images using simple image processing methods in 1-day or 3-day increments.
\nThis dataset is available to the public and may be freely downloaded. Please keep the designated Contact person informed of any plans to use the dataset. Consultation or collaboration with the original investigators is strongly encouraged. Publications and data products that make use of the dataset must include proper acknowledgement.
\nThe development of PhenoCam has been supported by multiple entities. Those include the Northeastern States Research Cooperative, NSF’s Macrosystems Biology program (award EF-1065029), DOE’s Regional and Global Climate Modeling program (award DE-SC0016011), the US National Park Service Inventory and Monitoring Program, the USA National Phenology Network (grant number G10AP00129 from the United States Geological Survey), and is currently supported by the Department of Agriculture (USDA) Agricultural Research Service.
\nThis research is a contribution from the Long-Term Agroecosystem Research (LTAR) network. LTAR and the Jornada Experimental Range are supported by the United States Department of Agriculture (USDA) Agricultural Research Service.
", "title": "PhenoCam images from JERNOVEL site, Jornada Experimental Range, New Mexico, USA since 2019", "distribution": [ { "@type": "dcat:Distribution", "downloadURL": "https://phenocam.nau.edu/webcam/sites/jernovel/", "mediaType": "text/html", "title": "https://phenocam.nau.edu/webcam/sites/jernovel/" } ], "license": "https://www.usa.gov/publicdomain/label/1.0/", "bureauCode": [ "005:18" ], "modified": "2024-02-20", "publisher": { "@type": "org:Organization", "name": "Agricultural Research Service" }, "keyword": [ "primary productivity", "phenology", "NP216", "phenocam", "long-term monitoring sites", "LTAR", "New Mexico", "digital image", "data.gov", "ARS" ], "spatial": "{\"type\": \"Polygon\", \"coordinates\": [[[-106.99172973633, 32.467789054148], [-106.99172973633, 32.758136474891], [-106.60308837891, 32.758136474891], [-106.60308837891, 32.467789054148], [-106.99172973633, 32.467789054148]]]}" }, { "identifier": "10113/AA692792", "accessLevel": "public", "contactPoint": { "hasEmail": "mailto:dawn.browning@ars.usda.gov", "fn": "Browning, Dawn" }, "programCode": [ "005:040" ], "description": "This data set consists of repeat digital imagery from the tower-mounted digital cameras (hereafter, PhenoCams) at the Jornada Experimental Range. JER is a member of the PhenoCam network, which has as its mission to serve as a long-term, continental-scale, phenological observatory. Imagery is uploaded to the PhenoCam server every 30 minutes. The archived images provide a permanent record that can be visually-inspected to determine the phenological state of the vegetation at any point in time. Vegetation greenness metrics (e.g., GCC) derived from the ratio of the green color band to sum of red, green, and blue color bands serve as proxies for vegetation greenness. Greenness metrics can be extracted from the images using simple image processing methods in 1-day or 3-day increments.
\nThis dataset is available to the public and may be freely downloaded. Please keep the designated Contact person informed of any plans to use the dataset. Consultation or collaboration with the original investigators is strongly encouraged. Publications and data products that make use of the dataset must include proper acknowledgement.
\nThe development of PhenoCam has been supported by multiple entities. Those include the Northeastern States Research Cooperative, NSF’s Macrosystems Biology program (award EF-1065029), DOE’s Regional and Global Climate Modeling program (award DE-SC0016011), the US National Park Service Inventory and Monitoring Program, the USA National Phenology Network (grant number G10AP00129 from the United States Geological Survey), and is currently supported by the Department of Agriculture (USDA) Agricultural Research Service.
\nThis research is a contribution from the Long-Term Agroecosystem Research (LTAR) network. LTAR and the Jornada Experimental Range are supported by the United States Department of Agriculture (USDA) Agricultural Research Service.
", "title": "PhenoCam images from JERNOVEL2 site, Jornada Experimental Range, New Mexico, USA since 2022", "distribution": [ { "@type": "dcat:Distribution", "downloadURL": "https://phenocam.nau.edu/webcam/sites/jernovel2/", "mediaType": "text/html", "title": "https://phenocam.nau.edu/webcam/sites/jernovel2/" } ], "license": "https://www.usa.gov/publicdomain/label/1.0/", "bureauCode": [ "005:18" ], "modified": "2024-02-20", "publisher": { "@type": "org:Organization", "name": "Agricultural Research Service" }, "keyword": [ "primary productivity", "phenology", "NP216", "phenocam", "long-term monitoring sites", "LTAR", "New Mexico", "digital image", "data.gov", "ARS" ], "spatial": "{\"type\": \"Polygon\", \"coordinates\": [[[-106.99172973633, 32.467789054148], [-106.99172973633, 32.758136474891], [-106.60308837891, 32.758136474891], [-106.60308837891, 32.467789054148], [-106.99172973633, 32.467789054148]]]}" }, { "identifier": "10113/AA41447", "accessLevel": "public", "contactPoint": { "hasEmail": "mailto:dawn.browning@ars.usda.gov", "fn": "Browning, Dawn" }, "programCode": [ "005:040" ], "description": "This data set consists of repeat digital imagery from the tower-mounted digital cameras (hereafter, PhenoCams) at the Jornada Experimental Range. JER is a member of the PhenoCam network, which has as its mission to serve as a long-term, continental-scale, phenological observatory. Imagery is uploaded to the PhenoCam server every 30 minutes. The archived images provide a permanent record that can be visually-inspected to determine the phenological state of the vegetation at any point in time. Vegetation greenness metrics (e.g., GCC) derived from the ratio of the green color band to sum of red, green, and blue color bands serve as proxies for vegetation greenness. Greenness metrics can be extracted from the images using simple image processing methods in 1-day or 3-day increments.
\nThis dataset is available to the public and may be freely downloaded. Please keep the designated Contact person informed of any plans to use the dataset. Consultation or collaboration with the original investigators is strongly encouraged. Publications and data products that make use of the dataset must include proper acknowledgement.
\nThe development of PhenoCam has been supported by multiple entities. Those include the Northeastern States Research Cooperative, NSF’s Macrosystems Biology program (award EF-1065029), DOE’s Regional and Global Climate Modeling program (award DE-SC0016011), the US National Park Service Inventory and Monitoring Program, the USA National Phenology Network (grant number G10AP00129 from the United States Geological Survey), and is currently supported by the Department of Agriculture (USDA) Agricultural Research Service.
\nThis research is a contribution from the Long-Term Agroecosystem Research (LTAR) network. LTAR and the Jornada Experimental Range are supported by the United States Department of Agriculture (USDA) Agricultural Research Service.
\nResource Title: PhenoCam images from JERSAND.
File Name: Web Page, url: https://phenocam.sr.unh.edu/webcam/sites/jersand/
This data set consists of repeat digital imagery from the tower-mounted digital cameras (hereafter, PhenoCams) at the Jornada Experimental Range. JER is a member of the PhenoCam network, which has as its mission to serve as a long-term, continental-scale, phenological observatory. Imagery is uploaded to the PhenoCam server every 30 minutes. The archived images provide a permanent record that can be visually-inspected to determine the phenological state of the vegetation at any point in time. Vegetation greenness metrics (e.g., GCC) derived from the ratio of the green color band to sum of red, green, and blue color bands serve as proxies for vegetation greenness. Greenness metrics can be extracted from the images using simple image processing methods in 1-day or 3-day increments.
\nThis dataset is available to the public and may be freely downloaded. Please keep the designated Contact person informed of any plans to use the dataset. Consultation or collaboration with the original investigators is strongly encouraged. Publications and data products that make use of the dataset must include proper acknowledgement.
\nThe development of PhenoCam has been supported by multiple entities. Those include the Northeastern States Research Cooperative, NSF’s Macrosystems Biology program (award EF-1065029), DOE’s Regional and Global Climate Modeling program (award DE-SC0016011), the US National Park Service Inventory and Monitoring Program, the USA National Phenology Network (grant number G10AP00129 from the United States Geological Survey), and is currently supported by the Department of Agriculture (USDA) Agricultural Research Service.
\nThis research is a contribution from the Long-Term Agroecosystem Research (LTAR) network. LTAR and the Jornada Experimental Range are supported by the United States Department of Agriculture (USDA) Agricultural Research Service.
", "title": "PhenoCam images from JERSHRUBLAND site, Jornada Experimental Range, New Mexico, USA since 2019", "distribution": [ { "@type": "dcat:Distribution", "downloadURL": "https://phenocam.nau.edu/webcam/sites/jershrubland/", "mediaType": "text/html", "title": "https://phenocam.nau.edu/webcam/sites/jershrubland/" } ], "license": "https://www.usa.gov/publicdomain/label/1.0/", "bureauCode": [ "005:18" ], "modified": "2024-02-20", "publisher": { "@type": "org:Organization", "name": "Agricultural Research Service" }, "keyword": [ "primary productivity", "phenology", "NP216", "phenocam", "long-term monitoring sites", "LTAR", "New Mexico", "digital image", "data.gov", "ARS" ], "spatial": "{\"type\": \"Polygon\", \"coordinates\": [[[-106.99172973633, 32.467789054148], [-106.99172973633, 32.758136474891], [-106.60308837891, 32.758136474891], [-106.60308837891, 32.467789054148], [-106.99172973633, 32.467789054148]]]}" }, { "identifier": "10113/AA692796", "accessLevel": "public", "contactPoint": { "hasEmail": "mailto:dawn.browning@ars.usda.gov", "fn": "Browning, Dawn" }, "programCode": [ "005:040" ], "description": "This data set consists of repeat digital imagery from the tower-mounted digital cameras (hereafter, PhenoCams) at the Jornada Experimental Range. JER is a member of the PhenoCam network, which has as its mission to serve as a long-term, continental-scale, phenological observatory. Imagery is uploaded to the PhenoCam server every 30 minutes. The archived images provide a permanent record that can be visually-inspected to determine the phenological state of the vegetation at any point in time. Vegetation greenness metrics (e.g., GCC) derived from the ratio of the green color band to sum of red, green, and blue color bands serve as proxies for vegetation greenness. Greenness metrics can be extracted from the images using simple image processing methods in 1-day or 3-day increments.
\nThis dataset is available to the public and may be freely downloaded. Please keep the designated Contact person informed of any plans to use the dataset. Consultation or collaboration with the original investigators is strongly encouraged. Publications and data products that make use of the dataset must include proper acknowledgement.
\nThe development of PhenoCam has been supported by multiple entities. Those include the Northeastern States Research Cooperative, NSF’s Macrosystems Biology program (award EF-1065029), DOE’s Regional and Global Climate Modeling program (award DE-SC0016011), the US National Park Service Inventory and Monitoring Program, the USA National Phenology Network (grant number G10AP00129 from the United States Geological Survey), and is currently supported by the Department of Agriculture (USDA) Agricultural Research Service.
\nThis research is a contribution from the Long-Term Agroecosystem Research (LTAR) network. LTAR and the Jornada Experimental Range are supported by the United States Department of Agriculture (USDA) Agricultural Research Service.
", "title": "PhenoCam images from JERSHRUBLAND2 site, Jornada Experimental Range, New Mexico, USA since 2022", "distribution": [ { "@type": "dcat:Distribution", "downloadURL": "https://phenocam.nau.edu/webcam/sites/jershrubland2/", "mediaType": "text/html", "title": "https://phenocam.nau.edu/webcam/sites/jershrubland2/" } ], "license": "https://www.usa.gov/publicdomain/label/1.0/", "bureauCode": [ "005:18" ], "modified": "2024-02-20", "publisher": { "@type": "org:Organization", "name": "Agricultural Research Service" }, "keyword": [ "primary productivity", "phenology", "NP216", "phenocam", "long-term monitoring sites", "LTAR", "New Mexico", "digital image", "data.gov", "ARS" ], "spatial": "{\"type\": \"Polygon\", \"coordinates\": [[[-106.99172973633, 32.467789054148], [-106.99172973633, 32.758136474891], [-106.60308837891, 32.758136474891], [-106.60308837891, 32.467789054148], [-106.99172973633, 32.467789054148]]]}" }, { "identifier": "10113/AA692794", "accessLevel": "public", "contactPoint": { "hasEmail": "mailto:dawn.browning@ars.usda.gov", "fn": "Browning, Dawn" }, "programCode": [ "005:040" ], "description": "This data set consists of repeat digital imagery from the tower-mounted digital cameras (hereafter, PhenoCams) at the Jornada Experimental Range. JER is a member of the PhenoCam network, which has as its mission to serve as a long-term, continental-scale, phenological observatory. Imagery is uploaded to the PhenoCam server every 30 minutes. The archived images provide a permanent record that can be visually-inspected to determine the phenological state of the vegetation at any point in time. Vegetation greenness metrics (e.g., GCC) derived from the ratio of the green color band to sum of red, green, and blue color bands serve as proxies for vegetation greenness. Greenness metrics can be extracted from the images using simple image processing methods in 1-day or 3-day increments.
\nThis dataset is available to the public and may be freely downloaded. Please keep the designated Contact person informed of any plans to use the dataset. Consultation or collaboration with the original investigators is strongly encouraged. Publications and data products that make use of the dataset must include proper acknowledgement.
\nThe development of PhenoCam has been supported by multiple entities. Those include the Northeastern States Research Cooperative, NSF’s Macrosystems Biology program (award EF-1065029), DOE’s Regional and Global Climate Modeling program (award DE-SC0016011), the US National Park Service Inventory and Monitoring Program, the USA National Phenology Network (grant number G10AP00129 from the United States Geological Survey), and is currently supported by the Department of Agriculture (USDA) Agricultural Research Service.
\nThis research is a contribution from the Long-Term Agroecosystem Research (LTAR) network. LTAR and the Jornada Experimental Range are supported by the United States Department of Agriculture (USDA) Agricultural Research Service.
", "title": "PhenoCam images from JERWERN site, Jornada Experimental Range, New Mexico, USA since 2017", "distribution": [ { "@type": "dcat:Distribution", "downloadURL": "https://phenocam.nau.edu/webcam/sites/jernwern/", "mediaType": "text/html", "title": "https://phenocam.nau.edu/webcam/sites/jernwern/" } ], "license": "https://www.usa.gov/publicdomain/label/1.0/", "bureauCode": [ "005:18" ], "modified": "2024-02-20", "publisher": { "@type": "org:Organization", "name": "Agricultural Research Service" }, "keyword": [ "primary productivity", "phenology", "NP216", "phenocam", "long-term monitoring sites", "LTAR", "New Mexico", "digital image", "data.gov", "ARS" ], "spatial": "{\"type\": \"Polygon\", \"coordinates\": [[[-106.99172973633, 32.467789054148], [-106.99172973633, 32.758136474891], [-106.60308837891, 32.758136474891], [-106.60308837891, 32.467789054148], [-106.99172973633, 32.467789054148]]]}" }, { "identifier": "10113/AA22579", "accessLevel": "public", "contactPoint": { "hasEmail": "mailto:Greg.McMaster@ars.usda.gov", "fn": "McMaster, Gregory S." }, "programCode": [ "005:040" ], "description": "PhenologyMMS is a simulation model that outlines and quantifies the developmental sequence of different crops under varying levels of water deficits, provides developmental information relevant to each crop, and is intended to be used either independently or inserted into existing crop growth models.
Resource Title: PhenologyMMS.
File Name: Web Page, url: https://www.ars.usda.gov/research/software/download/?softwareid=238&modecode=30-12-30-25
download page
PhotoSim: Leaf Photosynthesis Model for Floriculture Crops program models the photosynthetic response of 13 floriculture crops to light, temperature, or carbon dioxide (CO2) and allows users to estimate the impact of adjusting their greenhouse environment. You can predict the impact on photosynthesis for different management changes (shading, supplemental high pressure sodium lighting, CO2 injection,or heating or cooling).
Resource Title: PhotoSim .
File Name: Web Page, url: https://www.ars.usda.gov/midwest-area/wooster-oh/application-technology-research/docs/photosim-leaf-photosynthesis-model-for-floriculture-crops/
download page: https://www.ars.usda.gov/research/software/download/?softwareid=447
This is an Aegilops tauschii genome database containing genetic and physical maps, genetic markers and genomic sequences and up-to-date releases on Ae. tauschii genome mapping.
Resource Title: Web Page.
File Name: Web Page, url: https://probes.pw.usda.gov/WheatDMarker/
NOTE: This resource, previously available at www.phytophthoradb.org, is no longer publicly accessible.
\nThis database aims to include Phytophthora collections throughout the world in order to create a global atlas of the diversity and distribution of Phytophthora species.
\nPhytophthora, an oomycete plant pathogen, is more closely related to brown algae and diatoms than true fungi and has been placed in a separate kingdom, the Stramenopiles (Gunderson et al., 1987; Förster et al., 1990; Leipe et al., 1994). Due to their high virulence and ability to spread rapidly throughout the world, Phytophthora is one of the most important groups of plant pathogens. The destructive potential of Phytophthora diseases is well illustrated by late blight (P. infestans), which was responsible for the Irish potato famine and has again become globally problematic due to the introduction of new, fungicide-resistant lineages (Fry and Goodwin, 1997). Sudden oak death in the US (Rizzo et al., 2002) and diseases on ornamental plants in Europe (Werres et al., 2001), caused by P. ramorum, are examples of the threat to forest ecosystems and the nursery industry.\n\nToward the goal of enhancing our ability to detect, diagnose, monitor, and manage Phytophthora diseases, we have been systematically cataloging genotypic and phenotypic data of Phytophthora spp. in a web-based database that can be easily accessed and utilized by the global community of plant health professionals. Although we are currently focusing on the genotypic characterization of the isolates archived in the World Phytophthora Collection (WPC; Phytophthora.ucr.edu) at UC-Riverside and in the Pennsylvania Department of Agriculture (PDA), we plan to include Phytophthora collections throughout the world in order to create a global atlas of the diversity and distribution of Phytophthora species. \n\nThis project has been mainly supported by the NRI-Plant Biosecurity program (2005-35605-15393 and 2008-55605-18773) and currently involves the following principal investigators, including Seogchan Kang, David Geiser, and Scott Isard (Penn State), Mike Coffey (UC-Riverside), Joe Russo (ZedX, Inc.), Kelly Ivors (NC State), Frank Martin and Nik Grunwald (USDA-ARS). Grants from the Pennsylvania Department of Agriculture (ME442316 and ME 445580) and a cooperative agreement with USDA-ARS (59-1920-3-304) have also been used to support parts of this project.
\nPartially supported by Grant from the USDA-AFRI Plant Biosecurity program supported the\nestablishment and improvement of the PD (2005-35605-15393 and 2008-55605-18773).
", "title": "Phytophthora Database", "distribution": [], "license": "https://www.usa.gov/publicdomain/label/1.0/", "bureauCode": [ "005:18" ], "modified": "2024-02-08", "publisher": { "@type": "org:Organization", "name": "Agricultural Research Service" }, "accrualPeriodicity": "irregular", "keyword": [ "molds", "Phytophthora", "plant disease", "plant pathogens", "Basic Local Alignment Search Tool", "BLAST", "molecular diagnosis", "invasive pathogen", "NP303", "Online database", "data.gov", "ARS" ] }, { "identifier": "10.15482/USDA.ADC/1529793", "accessLevel": "public", "contactPoint": { "hasEmail": "mailto:amy.l.baker@usda.gov", "fn": "Baker, Amy L." }, "programCode": [ "005:040" ], "description": "An experimental challenge of Influenza A virus in genetically modified TMPRSS2 knockout pigs.
\nResources in this dataset:
\nThis ongoing data set contains basal cover of perennial grasses and canopy cover of shrubs in 122 1m x 1m quadrats on the Jornada Experimental Range in the northern extent of the Chihuahuan Desert of New Mexico, USA. These quadrats were established to investigate livestock grazing effects on plant community dynamics as well as responses to variable climatic conditions over time. Vegetation monitoring is carried out by charting the basal areas of perennial grasses and canopy areas of shrubs within each quadrat. Quadrats were established at different times, with start dates from 1915 to 1932. Specific quadrat locations were selected for a variety of reasons, but the overall intent was to represent varying plant community conditions across the Jornada Experimental Range. From 1915 to 1924 charting was done by dividing the quadrat frame into a decimeter grid using straps and reproducing locations of plants on grid paper. From 1925 to 2016 charting was done using a pantograph. With few exceptions, quadrats were charted until 1947, and a portion of the quadrats were charted intermittently between 1947 and 1979. Sampling resumed again in 1995 and continues every 5-6 years. Charts are digitally scanned, georeferenced, and chart features are digitally reproduced by hand. This data set is not yet complete; charts are actively being processed by Jornada Experimental Range staff and will be updated to this data package as they become available. A companion data package of counts of perennial forbs and subshrubs for each quadrat is also available for this project (data package knb-lter-jrn.210351002).
Resource Title: Website Pointer to html file.
File Name: Web Page, url: https://portal.edirepository.org/nis/mapbrowse?scope=knb-lter-jrn&identifier=210351001
Webpage with information and links to data files for download
This ongoing data set contains counts of perennial forbs and subshrubs in 122 1m x 1m quadrats on the Jornada Experimental Range in the northern extent of the Chihuahuan Desert of New Mexico, USA. These quadrats were established to investigate livestock grazing effects on plant community dynamics as well as responses to variable climatic conditions over time. Vegetation monitoring is carried out by charting the locations of forbs and subshrubs within each quadrat. Quadrats were established at different times, with start dates from 1915 to 1935. Specific quadrat locations were selected for a variety of reasons, but the overall intent was to represent varying plant community conditions across the Jornada Experimental Range. From 1915 to 1924 charting was done by dividing the quadrat frame into a decimeter grid using straps and reproducing locations of plants on grid paper. From 1925 to 2016 charting was done using a pantograph. With few exceptions, quadrats were charted until 1947, and a portion of the quadrats were charted intermittently between 1947 and 1979. Sampling resumed again in 1995 and continues every 5-6 years. Charts are digitally scanned, georeferenced, and chart features are digitally reproduced by hand. This data set is not yet complete; charts are actively being processed by Jornada Experimental Range staff and will be updated to this data package as they become available. A companion data package of basal cover of perennial grasses and canopy cover of shrubs is also available for this project (data package knb-lter-jrn.210351001).
Resource Title: Website Pointer to html file.
File Name: Web Page, url: https://portal.edirepository.org/nis/mapbrowse?scope=knb-lter-jrn&identifier=210351002
Webpage with information and links to data files for download
[NOTE: PLEXdb is no longer available online. Oct 2019.]
\nPLEXdb (Plant Expression Database) is a unified gene expression resource for plants and plant pathogens. PLEXdb is a genotype to phenotype, hypothesis building information warehouse, leveraging highly parallel expression data with seamless portals to related genetic, physical, and pathway data.
\nPLEXdb (http://www.plexdb.org), in partnership with community databases, supports comparisons of gene expression across multiple plant and pathogen species, promoting individuals and/or consortia to upload genome-scale data sets to contrast them to previously archived data. These analyses facilitate the interpretation of structure, function and regulation of genes in economically important plants. A list of Gene Atlas experiments highlights data sets that give responses across different developmental stages, conditions and tissues. Tools at PLEXdb allow users to perform complex analyses quickly and easily. The Model Genome Interrogator (MGI) tool supports mapping gene lists onto corresponding genes from model plant organisms, including rice and Arabidopsis. MGI predicts homologies, displays gene structures and supporting information for annotated genes and full-length cDNAs. The gene list-processing wizard guides users through PLEXdb functions for creating, analyzing, annotating and managing gene lists. Users can upload their own lists or create them from the output of PLEXdb tools, and then apply diverse higher level analyses, such as ANOVA and clustering. PLEXdb also provides methods for users to track how gene expression changes across many different experiments using the Gene OscilloScope. This tool can identify interesting expression patterns, such as up-regulation under diverse conditions or checking any gene’s suitability as a steady-state control.
\nResource Title: Website Pointer for Plant Expression Database, Iowa State University.
File Name: Web Page, url: https://www.bcb.iastate.edu/plant-expression-database
[NOTE: PLEXdb is no longer available online. Oct 2019.]\nProject description for the Plant Expression Database (PLEXdb) and integrated tools.
This ongoing data package, which began in 1992, contains monthly plant phenological observations by species at the 15 Net Primary Production (NPP) study sites at the Jornada Experimental Range (JER) or Chihuahuan Desert Rangeland Research Center (CDRRC) in Dona Ana County, New Mexico, USA. Sites were selected to represent the 5 major ecosystem types in the Chihuahuan Desert (upland grasslands, playa grasslands, mesquite-dominated shrublands, creosotebush-dominated shrublands, tarbush-dominated shrublands). For each ecosystem type, three sites were selected to represent the range in variability in production and plant diversity; thus the locations are not replicates. A transect at each site is monitored monthly to assess the following phenological stages for each species: dormancy, non-reproductive status, budding, flowering, and fruiting. Sampling methods in the first years of the study monitored all plant species present but have been changed to focus on specific species at each site.
Resource Title: Website Pointer to html file.
File Name: Web Page, url: https://portal.edirepository.org/nis/mapbrowse?scope=knb-lter-jrn&identifier=210287001
Webpage with information and links to data files for download
Poultry litter (PL) is a by-product of broiler production. Most PL is land applied. Land-applied PL is a valuable nutrient source for crop production but can also be a route of environmental contamination with manure-borne bacteria. The objective of this study was to characterize the fate of pathogens, fecal indicator bacteria (FIB), and bacteria containing antibiotic resistance genes (ARGs) after application of PL to soils under conventional till or no-till management. This 2-yr study was conducted in accordance with normal agricultural practices, and microbial populations were quantified using a combination of culture and quantitative, real-time polymerase chain reaction analysis. Initial concentrations of Campylobacter jejuni in PL were 5.4 ± 3.2 × 10⁶ cells g-1 PL; Salmonella sp. was not detected in the PL but was enriched periodically from PL-amended soils. Escherichia coli was detected in PL (1.5 ± 1.3 × 10² culturable or 1.5 ± 0.3 × 10⁷ genes g-1) but was rarely detected in field soils, whereas enterococci (1.5 ± 0.5 × 10⁸ cells g-1 PL) were detected throughout the study. These results suggest that enterococci may be better FIB for field-applied PL. Concentrations of ARGs for sulfonamide, streptomycin, and tetracycline resistance increased up to 3.0 orders of magnitude after PL application and remained above background for up to 148 d. These data provide new knowledge about important microbial FIB, pathogens, and ARGs associated with PL application under realistic field-based conditions.
Resource Title: GeoData catalog record.
File Name: Web Page, url: https://geodata.nal.usda.gov/geonetwork/srv/eng/catalog.search#/metadata/07bc5fb2-462e-40bc-bee6-d24e735ea9b1
Interspecies human-to-swine IAV transmission occurs globally and contributes to increased IAV diversity in pig populations. We present data that a swine isolate from a 2018-2019 human-to-swine transmission event was shed for multiple days in challenged and contact pigs. By characterizing this introduction through bioinformatic, molecular, and animal experimental approaches, these findings better inform animal health practices and in vaccine decision-making. Since wholly human seasonal H3N2 viruses in the U.S. were not previously identified as being transmissible in pigs (i.e. reverse zoonosis), these findings reveal the interspecies barriers for transmission to pigs may not require significant changes to all human seasonal H3N2.
", "title": "Powell FLU39 raw data.xlsx", "distribution": [ { "@type": "dcat:Distribution", "downloadURL": "https://ndownloader.figshare.com/files/44072738", "format": "xlsx", "mediaType": "application/vnd.openxmlformats-officedocument.spreadsheetml.sheet", "title": "Powell FLU39 raw data.xlsx" } ], "license": "https://www.usa.gov/publicdomain/label/1.0/", "bureauCode": [ "005:18" ], "modified": "2024-01-17", "publisher": { "@type": "org:Organization", "name": "Agricultural Research Service" }, "keyword": [ "influenza", "swine", "H3N2", "3C3a", "interspecies transmission" ] }, { "identifier": "10.15482/USDA.ADC/1524292", "accessLevel": "public", "contactPoint": { "hasEmail": "mailto:beto.perezdeleon@usda.gov", "fn": "Perez de Leon, Adalberto" }, "programCode": [ "005:040" ], "description": "[NOTE - 11/24/2021: this dataset supersedes an earlier version https://doi.org/10.15482/USDA.ADC/1518654 ]
\n
\nResources in this dataset:
An easy-to-customize, low-cost, low disturbance, motorized, and adjustable proximal sensing cart for field-based high-throughput phenotyping is described. General dimensions, motor specifications, and a remote operation application are given. The cart, named \"Professor\", supports mounting multiple proximal sensors and cameras for characterizing plant traits grown under field conditions. Professor easily adapts to multiple sensor configurations supporting detection of multiple target traits and has two axes of adjustable clearance by design. Professor is useful as a field-based phenotyping platform and offers a framework for customized development and application.
Resource Title: S. File 1.
File Name: S. File 1.xlsx
Resource Description: Components needed for the assembly of Professor. Hyperlinks to websites for purchase also provided.
Resource Title: S. File 2.
File Name: S. File 2.PDF
Resource Description: Specifications for Swivel wheel assembly. File provides two views of the swivel wheel mount including dimensions and part order assembly.
Resource Title: S. File 3.
File Name: S. File 3.PDF
Resource Description: Specifications for wheel support arm assembly. File provides two views of the wheel support including dimensions and part order assembly.
Resource Title: S. File 4.
File Name: S. File 4.pdf
Resource Description: Specifications for Front wheel assembly. File provides two views of the front wheel mount including dimensions and part order assembly.
Resource Title: S. File 5.
File Name: S. File 5.PDF
Resource Description: Specifications for Motor assembly. File includes two views of the motor mount including dimensions and part order assembly.
Resource Title: S. File 6.
File Name: S. File 6.PDF
Resource Description: Specifications for Custom sprocket. File contains dimensions only.
Resource Title: S. File 7.
File Name: S. File 7.xlsx
Resource Description: This file contains the collected GPS and timestamp information used to generate Table 1 in the paper. The file was generated by clipping GPS data to plot polygons in Quantum GIS software to show accuracy of placement and consistency of speed of the motorized cart in the field.\nTable 1. The drive time for each 12.1 m plot for three replicates (Pass) as recorded by a Hemishpere GPS receiver and Campbell Scientific data logger. The average time per plot is calculated below. The difference in time for each plot from the average is listed in the Difference column. Time is listed as minute:second.milisecond
Resource Title: S. Video 1.
File Name: S. Video 1.mp4
Resource Description: A short video showing Professor navigate loose soil with small dirt clods in the field. Note the cart is being operated in a reverse configuration. The camera is mounted on the frame and directed towards the swivel wheels to show displacement.
Resource Title: S. Video 2.
File Name: S. Video 2.mp4
Resource Description: A short video showing Professor navigate very loose soil up a small incline. Note the cart does slip and bounce when traction is lost. The video camera is mounted to the operator’s hat.
Resource Title: S. Video 3.
File Name: S. Video 3.mp4
Resource Description: A short video showing Professor navigate bumpy terrain with medium dirt clods. The video camera is mounted to the operator’s hat.
Resource Title: S. Video 4.
File Name: S. Video 4.mp4
Resource Description: A short video showing Professor navigate rough terrain with large dirt clods. Note the cart does require minor assistance in this video. The video camera is mounted to the operator’s hat.
Boxwood blight disease, caused by the fungi Calonectria henricotiae and C. pseudonaviculata, is an emergent threat to natural and managed landscapes worldwide. This dataset contains protein predictions and identifications generated from Calonectria pseudonaviculata CBS 139707 (aka cpsCT01) genome dataset https://doi.org/10.15482/USDA.ADC/1410184.
Resource Title: Protein predictions and identifications generated from Calonectria pseudonaviculata CBS 139707 (aka cpsCT01) genome dataset .
File Name: Calonectria pseudonaviculata protein.fasta.txt
Resource Description: This dataset contains protein predictions and identifications generated from Calonectria pseudonaviculata CBS 139707 (aka cpsCT01) genome dataset https://doi.org/10.15482/USDA.ADC/1410184
Genomic, Genetic and Breeding Resources for Pulse Crop Improvement. Crops supported include Adzuki bean, Bambara bean, Chickpea, Common bean, Cowpea, Faba bean, Lentil, Lupin, Pea, Pigeon pea, Vetch, and others. The Pulse Crop Database (PCD), formerly the Cool Season Food Legume Database (CSFL), is being developed by the Main Bioinformatics Laboratory at Washington State University in collaboration with the USDA-ARS Grain Legume Genetics and Physiology Research Unit, the USDA-ARS Plant Germplasm Introduction and Testing Unit, the USA Dry Pea and Lentil Council, Northern Pulse Growers and allied scientists in the US and across the world, to serve as a resource for Genomics-Assisted Breeding (GAB). GAB offers tools to identify genes related to traits of interest among other methods to optimize plant breeding efficiency and research, by providing relevant genomic, genetic and breeding information and analysis. Therefore, tools such as JBrowse and MapViewer can be found in this database, as well as key resources to provide the access to the annotation of available transcriptome data, helping pulse breeders and researchers to succeed in their programs.
\nResource Title: Pulse Crop Database Resources.
File Name: Web Page, url: https://www.pulsedb.org/
Resources include data submission and download, and search by gene and transcript, germplasm, map, marker, publication, QTL, sequence, megasearch, and trait/descriptor. A User Manual describes how to access data and use the tools on the Pulse Crop Database. Tools supported: BLAST, JBrowse, PathwayCyc, MapViewer, and Synteny Viewer
This data package contains vegetation cover from plots with various levels of herbivore exclusion on the Jornada Experimental Range (JER) and Chihuahuan Desert Rangeland Research Center (CDRRC) in Dona Ana County, southern New Mexico, USA. Study sites were established in 1995; one in black grama grassland and the other in creosotebush shrubland to compare the impact of herbivores on ecosystem processes between these vegetation types. Parallel studies were established at the Sevilleta LTER site (New Mexico, USA) and Mapimi Biosphere Reserve (Durango, Mexico). Each study site is 1 km by 0.5 km in area. Four replicate experimental blocks were randomly located at the grassland study site to measure vegetation responses using exclusion treatments including a) all mammalian herbivores, including cattle, lagomorphs, and rodents, b) lagomorphs and cattle only, c) cattle only, and d) control accessible to all herbivores. Because grazing cattle are excluded from the entire creosote site, only three replicate experimental blocks were randomly located there including a) all mammalian herbivores, including lagomorphs, and rodents, b) lagomorphs only, and c) control accessible to all herbivores. Thirty-six sampling points were positioned at 5.8-meter intervals on a systematically located 6 by 6 point grid within each plot. A permanent one-meter by one-meter vegetation measurement quadrat is located at each of the 36 points. At each quadrat, percent cover by individual plant species is measured. Other measurements include height (cm) of each species in the quadrat, and plant condition (living or dead). Data were collected in the spring and fall of every year from 1995 to 2005. After 2005, sampling frequency changed to every 5 years in the fall. This study is ongoing.
Resource Title: Website Pointer to html file.
File Name: Web Page, url: https://portal.edirepository.org/nis/mapbrowse?scope=knb-lter-jrn&identifier=210086002
Webpage with information and links to data files for download
This Microsoft Excel workbook contains spreadsheets for calculating response-factor normalized triacylglycerol (TAG) compositions from response factors derived from GC-FID of fatty acid methyl esters (FAME). This workbook (1.160 Mb) reads the output from a ThermoScientific XCalibur Quan Browser •Excel Short Report• (In XCalibur: File • Export data to Excel • Export Short Excel report), and requires input of the FA composition determined by GC-FID (manually entered or read from Excel spreadsheet [provided upon request]).
Resource Title: QuaQuantification of TAGs by LC-MS.
File Name: Web Page, url: https://www.ars.usda.gov/research/software/download/?softwareid=457&modecode=80-40-05-05
download page
This file contains all of the R code, notebooks, and output (web pages and figures) used to analyze the raw data in https://agdatacommons.nal.usda.gov/articles/dataset/Byrdwell_Bovine_Milk_Dataset_061021/24669096 as described in the manuscript \"An Interactive R-Based Custom Quantification Program for Quantitative Analysis of Triacylglycerols in Bovine Milk\".
", "title": "R Code and Output Files for: An Interactive R-Based Custom Quantification Program for Quantitative Analysis of Triacylglycerols in Bovine Milk", "distribution": [ { "@type": "dcat:Distribution", "downloadURL": "https://ndownloader.figshare.com/files/45360595", "format": "zip", "mediaType": "application/zip", "title": "R_Code&Output.zip" } ], "license": "https://creativecommons.org/licenses/by/4.0/", "bureauCode": [ "005:18" ], "modified": "2024-04-26", "publisher": { "@type": "org:Organization", "name": "Agricultural Research Service" }, "accrualPeriodicity": "irregular", "keyword": [ "Bovine Milk", "Triacylglycerols (TAGs)", "Lipids", "Triglycerides", "R Code", "RStudio" ] }, { "identifier": "10.15482/USDA.ADC/1372394", "accessLevel": "public", "contactPoint": { "hasEmail": "mailto:doug.karlen@ars.usda.gov", "fn": "Karlen, Doug" }, "programCode": [ "005:040" ], "description": "REAP (Resilient Economic Agricultural Practices), formerly known as the Renewable Energy Assessment Project, was initially organized to quantitatively assess the impacts of crop residue (e.g., corn stover) on soil properties. The project's current vision is to revitalize soil health and resiliency, thereby enabling soil resources to meet expanding societal demands while safe-guarding planetary health. Goals include 1) Identifying physical, chemical, or biological parameters and index tools that quantify management effects on carbon sequestration and soil health; 2) Conducting coordinated, quantitative multi-location comparisons of business as usual vs. improved management practices designed to enhance nutrient use efficiency and soil health; 3) Identification of critical indicators and index tools to quantify site-specific soil health and water quality effects; 4) Developing, expanding, and coordinating among ARS teams providing data and databases needed to sustainably supply cellulosic-based bioenergy feedstock and other national natural resource and agricultural challenges.
Resource Title: REAP Data Search.
File Name: Web Page, url: https://agcros-usdaars.opendata.arcgis.com/datasets?group_ids=01c66889194d40e18e7c0bc3e3a9754f
REAP Study for Resilient Economic Agricultural Practices in St. Paul, Minnesota\nCorn stover is an important livestock feed and will probably be a major source of renewable bioenergy, especially in the U.S. Corn Belt. Overly aggressive removal of stover, however, could lead to greater soil erosion and hurt producer yields in the long-run. Good residue management practices could help prevent erosion of valuable topsoil by wind and water while still providing a revenue source for producers, either as livestock feed or for use in renewable bioenergy. Plant residues also contribute to soil structure, nutrient cycling, and help sustain the soil microbiota. Good residue management could also help control the loss of greenhouse gases from agricultural soils that could add to already increasing levels of atmospheric greenhouse gases contributing to global climate change. Cumulative GHG emissions varied widely across locations, by management, and from year-to-year. Despite this high variability, maximum stover removal averaged across all sites, years, and management resulted in lower total emissions of CO2 (-12 ± 11%) and N2O (-13 ± 28%) compared to no stover removal. Decreases in total CO2 and N2O emissions in stover removal treatments were attributed to decreased availability of stover-derived C and N inputs into soils, as well as possible microclimatic differences. Soils at all sites were CH4 neutral or small CH4 sinks. Exceptions to these trends occurred for all GHGs, highlighting the importance of site-specific management and environmental conditions on GHG fluxes in agricultural soils..
Resource Title: GeoData catalog record.
File Name: Web Page, url: https://geodata.nal.usda.gov/geonetwork/srv/eng/catalog.search#/metadata/fbda3036-2634-4566-abec-0a488eea1f1a
REAP Study for Resilient Economic Agricultural Practices in West Lafayette, Indiana\nCorn stover is an important livestock feed and will probably be a major source of renewable bioenergy, especially in the U.S. Corn Belt. Overly aggressive removal of stover, however, could lead to greater soil erosion and hurt producer yields in the long-run. Good residue management practices could help prevent erosion of valuable topsoil by wind and water while still providing a revenue source for producers, either as livestock feed or for use in renewable bioenergy. Plant residues also contribute to soil structure, nutrient cycling, and help sustain the soil microbiota. Good residue management could also help control the loss of greenhouse gases from agricultural soils that could add to already increasing levels of atmospheric greenhouse gases contributing to global climate change. Cumulative GHG emissions varied widely across locations, by management, and from year-to-year. Despite this high variability, maximum stover removal averaged across all sites, years, and management resulted in lower total emissions of CO2 (-12 ± 11%) and N2O (-13 ± 28%) compared to no stover removal. Decreases in total CO2 and N2O emissions in stover removal treatments were attributed to decreased availability of stover-derived C and N inputs into soils, as well as possible microclimatic differences. Soils at all sites were CH4 neutral or small CH4 sinks. Exceptions to these trends occurred for all GHGs, highlighting the importance of site-specific management and environmental conditions on GHG fluxes in agricultural soils.
Resource Title: West Lafayette, IN REAP Study (INWLREAP) CSV data.
File Name: INWLREAP_csv_data.zip
Resource Description: CSV format data on Experimental Units, Field Sites, Greenhouse Gas Flux, Harvest Fraction, Residue Management, Soil Biology, Soil Chemistry, Soil Physics, Amendments, Growth Stages, Planting, Residue, Persons, Treatments, Weather Daily, Weather Station.
RETC is a computer program which may be used to analyze the soil water retention and hydraulic conductivity functions of unsaturated soils. These hydraulic properties are key parameters in any quantitative description of water flow into and through the unsaturated zone of soils. The program uses the parametric models of Brooks-Corey and van Genuchten to represent the soil water retention curve, and the theoretical pore-size distribution models of Mualem and Burdine to predict the unsaturated hydraulic conductivity function from observed soil water retention data. The program comes with a manual which gives a detailed discussion of the different analytical expressions used for quantifying the soil water retention and hydraulic conductivity functions. A brief review is also given of the nonlinear least-squares parameter optimization method used for estimating the unknown coefficients in the hydraulic models. The RETC program may be used to predict the hydraulic conductivity from observed soil water retention data assuming that one observed conductivity value (not necessarily at saturation) is available.
\nThe program also permits one to fit analytical functions simultaneously to observed water retention and hydraulic conductivity data. Several examples are presented to illustrate a variety of program options.
\nThe program comes with a user manual giving detailed information about the computer program along with instructions for data input preparation and listings of sample input and output files. A listing of the source code is also provided.
Resource Title: RETC download page.
File Name: Web Page, url: https://www.ars.usda.gov/research/software/download/?softwareid=100&modecode=20-36-15-00
RIST (Rainfall Intensity Summarization Tool) is a Windows-based program designed to facilitate analysis of precipitation records.
\nRIST has improved efficiency and output files suitable for input to runoff, erosion, and water quality models including RUSLE, WEPP, SWAT, and AnnAGNPS. RIST inputs text files in user-specified fixed-width or comma-delimited formats. Rainfall records may be time-and-date stamp, fixed interval, or variable interval (breakpoint) data. Standard outputs include:
\nStandard RUSLE outputs include a storm-by-storm summary of total precipitation, duration, intensity, kinetic energy, and EI30; and bi-weekly and monthly rainfall summaries of rainfall, energy, EI30 and erosivity density. Optionally, storms with less than 0.5 in. (12.7mm) of precipitation may be excluded from the energy and intensity calculations.
\nStandard WEPP outputs include daily rainfall, storm duration (reduced by excluding periods greater than 30 minutes without rain), ip, and tp.
\nOutput for SWAT and AnnAGNPS include daily precipitation and, optionally, sub-daily precipitation totals.
\nRIST also includes the capability to generate (1) precipitation totals at any user-specified fixed time interval or (2) a storm-by-storm analysis including maximum intensities observed during 5, 10, 15, 20, 30, and 60 minute within-in storm periods.
\nResource Title: RIST - Rainfall Intensity Summarization Tool.
File Name: Web Page, url: https://www.ars.usda.gov/research/software/download/?softwareid=WPP-01&modecode=60-60-05-05
download page
Mathematical models have become increasingly popular in both research and management problems involving flow and transport processes in the subsurface. The unsaturated hydraulic functions are key input data in numerical models of vadose zone processes. These functions may be either measured directly or estimated indirectly through prediction from more easily measured data based using quasi-empirical models. Rosetta V1.0 is a Windows 95/98 program to estimate unsaturated hydraulic properties from surrogate soil data such as soil texture data and bulk density. Models of this type are called pedotransfer functions (PTFs) since they translate basic soil data into hydraulic properties. Rosetta can be used to estimate the following properties:
\n
\n
Detailed description of the hydraulic functions Rosetta offers five PTFs that allow prediction of the hydraulic properties with limited or more extended sets of input data. This hierarchical approach is of a great practical value because it permits optimal use of available input data. The models use the following hierarchical sequence of input data
\n
\n
The first model is based on a lookup table that provides class average hydraulic parameters for each USDA soil textural class. The other four models are based on neural network analyses and provide more accurate predictions when more input variables are used. In addition to the hierarchical approach, we also offer a model that allows prediction of the unsaturated hydraulic conductivity parameters from fitted van Genuchten (1980) retention parameters (Schaap and Leij, 1999). This model is also used in the hierarchical approach such that it automatically uses the predicted retention parameters as input, instead of measured (fitted) retention parameters.
\nAll estimated hydraulic parameters are accompanied by uncertainty estimates that permit an assessment of the reliability of Rosetta's predictions. These uncertainty estimates were generated by combining the neural networks with the bootstrap method (see Schaap and Leij (1998) and Schaap et al. (1999) for more information).
Resource Title: ROSETTA download page.
File Name: Web Page, url: https://www.ars.usda.gov/research/software/download/?softwareid=141&modecode=20-36-15-00
Root Zone Water Quality Model 2 (RZWQM2) is a whole-system model for studying crop production and environmental quality under current and changing climate conditions. It emphasizes the effects of agricultural management practices on physical, chemical and biological processes. RZWQM2 is a one-dimensional model with a pseudo 2-dimensional drainage flow. Crop simulation options include the generic plant growth model, DSSAT-CSM 4.0 and HERMES SUCROS models. It also can simulate surface energy balance with components from the SHAW model and water erosion from the GLEAMS model. An automated parameter estimation algorithm (PEST) was added to RZWQM2 for objective model calibration and uncertainty analysis.
Resource Title: RZWQM2 download page.
File Name: Web Page, url: https://www.ars.usda.gov/research/software/download/?softwareid=412&modecode=30-12-30-25
This data package contains rabbit feces count data from plots with various levels of herbivore exclusion on Jornada Experimental Range (JER) and Chihuahuan Desert Rangeland Research Center (CDRRC) lands. Study sites were established in 1995; one in black grama grassland and the other in creosotebush shrubland to compare the impact of herbivores on ecosystem processes between these vegetation types. Parallel studies were established at the Sevilleta LTER site (New Mexico, USA) and Mapimi Biosphere Reserve (Durango, Mexico). Each study site is 1 km by 0.5 km in area. Four replicate experimental blocks were randomly located at the grassland study site to measure vegetation responses using exclusion treatments including a) all mammalian herbivores, including cattle, lagomorphs, and rodents, b) lagomorphs and cattle only, c) cattle only, and d) control accessible to all herbivores. Because grazing cattle are excluded from the entire creosote site, only three replicate experimental blocks were randomly located there including a) all mammalian herbivores, including lagomorphs, and rodents, b) lagomorphs only, and c) control accessible to all herbivores. Thirty-six sampling points were positioned at 5.8-meter intervals on a systematically located 6 by 6 point grid within each plot. A permanent one-meter by one-meter vegetation measurement quadrat is located at each of the 36 points. Each year in spring and fall from 1995-2005, the total number of rabbit feces were counted within each quadrat. After 2005, sampling frequency channged to every 5 years and data collected record only presence or absence of feces. This study is ongoing.
Resource Title: Website Pointer to html file.
File Name: Web Page, url: https://portal.edirepository.org/nis/mapbrowse?scope=knb-lter-jrn&identifier=210086005
Webpage with information and links to data files for download
This data package contains rabbit survey data from grassland and creosote shrubland habitats on Jornada Experimental Range (JER) and Chihuahuan Desert Rangeland Research Center (CDRRC) lands. Two survey routes were established along Jornada Basin roads in 1996; one in black grama grassland and the other in creosotebush shrubland. Quarterly surveys are conducted on these roads at or near the full moon to measure the density of rabbits in the two vegetation types. Each route is about 6 miles long. Parallel studies were established at the Sevilleta LTER site (New Mexico, USA) and Mapimi Biosphere Reserve (Durango, Mexico). Data collection began in April 1996 and includes date and time lagomorphs are spotted, species identification, habitat type, distance/direction from vehicle, and comments on the weather, moon, and anything unusual. This study is ongoing with new data collected quarterly.
Resource Title: Website Pointer to html file.
File Name: Web Page, url: https://portal.edirepository.org/nis/mapbrowse?scope=knb-lter-jrn&identifier=210086006
Webpage with information and links to data files for download
Introduction\nPreservation and management of semi-arid ecosystems requires understanding of the processes involved in soil erosion and their interaction with plant community. Rainfall simulations on natural plots provide an effective way of obtaining a large amount of erosion data under controlled conditions in a short period of time. This dataset contains hydrological (rainfall, runoff, flow velocity), erosion (sediment concentration and rate), vegetation (plant cover), and other supplementary information from 272 rainfall simulation experiments conducted on 23 rangeland locations in Arizona and Nevada between 2002 and 2013. The dataset advances our understanding of basic hydrological and biological processes that drive soil erosion on arid rangelands. It can be used to quantify runoff, infiltration, and erosion rates on a variety of ecological sites in the Southwestern USA. Inclusion of wildfire and brush treatment locations combined with long term observations makes it important for studying vegetation recovery, ecological transitions, and effect of management. It is also a valuable resource for erosion model parameterization and validation.
\nInstrumentation\nRainfall was generated by a portable, computer-controlled, variable intensity simulator (Walnut Gulch Rainfall Simulator). The WGRS can deliver rainfall rates ranging between 13 and 178 mm/h with variability coefficient of 11% across 2 by 6.1 m area. Estimated kinetic energy of simulated rainfall was 204 kJ/ha/mm and drop size ranged from 0.288 to 7.2 mm. Detailed description and design of the simulator is available in Stone and Paige (2003). Prior to each field season the simulator was calibrated over a range of intensities using a set of 56 rain gages. During the experiments windbreaks were setup around the simulator to minimize the effect of wind on rain distribution. On some of the plots, in addition to rainfall only treatment, run-on flow was applied at the top edge of the plot. The purpose of run-on water application was to simulate hydrological processes that occur on longer slopes (>6 m) where upper portion of the slope contributes runoff onto the lower portion.
\nRunoff rate from the plot was measured using a calibrated V-shaped supercritical flume equipped with depth gage. Overland flow velocity on the plots was measured using electrolyte and fluorescent dye solution. Dye moving from the application point at 3.2 m distance to the outlet was timed with stopwatch. Electrolyte transport in the flow was measured by resistivity sensors imbedded in edge of the outlet flume. Maximum flow velocity was defined as velocity of the leading edge of the solution and was determined from beginning of the electrolyte breakthrough curve and verified by visual observation (dye). Mean flow velocity was calculated using mean travel time obtained from the electrolyte solution breakthrough curve using moment equation.
\nSoil loss from the plots was determined from runoff samples collected during each run. Sampling interval was variable and aimed to represent rising and falling limbs of the hydrograph, any changes in runoff rate, and steady state conditions. This resulted in approximately 30 to 50 samples per simulation.
\nShortly before every simulation plot surface and vegetative cover was measured at 400 point grid using a laser and line-point intercept procedure (Herrick et al., 2005). Vegetative cover was classified as forbs, grass, and shrub. Surface cover was characterized as rock, litter, plant basal area, and bare soil. These 4 metrics were further classified as protected (located under plant canopy) and unprotected (not covered by the canopy). In addition, plant canopy and basal area gaps were measured on the plots over three lengthwise and six crosswise transects.
\nExperimental procedure\nFour to eight 6.1 m by 2 m replicated rainfall simulation plots were established on each site. The plots were bound by sheet metal borders hammered into the ground on three sides. On the down slope side a collection trough was installed to channel runoff into the measuring flume. If a site was revisited, repeat simulations were always conducted on the same long term plots.
\nThe experimental procedure was as follows. First, the plot was subjected to 45 min, 65 mm/h intensity simulated rainfall (dry run) intended to create initial saturated condition that could be replicated across all sites. This was followed by a 45 minute pause and a second simulation with varying intensity (wet run). During wet runs two modes of water application were used as: rainfall or run-on. Rainfall wet runs typically consisted of series of application rates (65, 100, 125, 150, and 180 mm/h) that were increased after runoff had reached steady state for at least five minutes. Runoff samples were collected on the rising and falling limb of the hydrograph and during each steady state (a minimum of 3 samples). Overland flow velocities were measured during each steady state as previously described. When used, run-on wet runs followed the same procedure as rainfall runs, except water application rates varied between 100 and 300 mm/h. In approximately 20% of simulation experiments the wet run was followed by another simulation (wet2 run) after a 45 min pause. Wet2 runs were similar to wet runs and also consisted of series of varying intensity rainfalls and/or run-on inputs.
\nResulting Data\nThe dataset contains hydrological, erosion, vegetation, and ecological data from 272 rainfall simulation experiments conducted on 12 sq. m plots at 23 rangeland locations in Arizona and Nevada. The experiments were conducted between 2002 and 2013, with some locations being revisited multiple times.
Resource Title: Appendix B. Lists of sites and general information.
File Name: Rainfall Simulation Sites Summary.xlsx
Resource Description: The table contains list or rainfall simulation sites and individual plots, their coordinates, topographic, soil, ecological and vegetation characteristics, and dates of simulation experiments. The sites grouped by common geographic area.
Resource Software Recommended: Microsoft Excel,url: https://products.office.com/en-us/excel
Resource Title: Appendix F. Site pictures.
File Name: Site photos.zip
Resource Description: Pictures of rainfall simulation sites and plots.
Resource Title: Appendix C. Rainfall simulations.
File Name: Rainfall simulation.csv
Resource Description: Please see Appendix C. Rainfall simulations (revised) for data with errors corrected (11/27/2017).
\nThe table contains rainfall, runoff, sediment, and flow velocity data from rainfall simulation experiments
Resource Software Recommended: MS Access,url: https://products.office.com/en-us/access
Resource Title: Appendix C. Rainfall simulations.
File Name: Rainfall simulation.csv
Resource Description: Please see Appendix C. Rainfall simulations (revised) for data with errors corrected (11/27/2017).
\nThe table contains rainfall, runoff, sediment, and flow velocity data from rainfall simulation experiments
Resource Software Recommended: MS Excel,url: https://products.office.com/en-us/excel
Resource Title: Appendix E. Simulation sites map.
File Name: Rainfall Simulator Sites Map.zip
Resource Description: Map of rainfall simulation sites with embedded images in Google Earth.
Resource Software Recommended: Google Earth,url: https://www.google.com/earth/
Resource Title: Appendix D. Ground and vegetation cover.
File Name: Plot Ground and Vegetation Cover.csv
Resource Description: The table contains ground (rock, litter, basal, bare soil) cover, foliar cover, and basal gap on plots immediately prior to simulation experiments.
Resource Software Recommended: Microsoft Access,url: https://products.office.com/en-us/access
Resource Title: Appendix D. Ground and vegetation cover.
File Name: Plot Ground and Vegetation Cover.csv
Resource Description: The table contains ground (rock, litter, basal, bare soil) cover, foliar cover, and basal gap on plots immediately prior to simulation experiments.
Resource Software Recommended: Microsoft Excel,url: https://products.office.com/en-us/excel
Resource Title: Appendix A. Data dictionary.
File Name: Data dictionary.csv
Resource Description: Explanation of terms and units
Resource Software Recommended: MS Excel,url: https://products.office.com/en-us/excel
Resource Title: Appendix A. Data dictionary.
File Name: Data dictionary.csv
Resource Description: Explanation of terms and units
Resource Software Recommended: MS Access,url: https://products.office.com/en-us/access
Resource Title: Appendix C. Rainfall simulations (revised).
File Name: Rainfall simulation (R11272017).csv
Resource Description: The table contains rainfall, runoff, sediment, and flow velocity data from rainfall simulation experiments\n(updated 11/27/2017)
Resource Software Recommended: Microsoft Access,url: https://products.office.com/en-us/access
The Rangeland Analysis Platform ( rangelands.app) is a free online application that provides simple and fast access to geospatial vegetation data for U.S. rangelands. The tool was developed to provide landowners, resource managers, conservationists, and scientists access to data that can inform land management planning, decision making, and the evaluation of outcomes. The Rangeland Analysis Platform (RAP) uses innovative cloud computing technology to provide maps and analysis opportunities straight to your desktop, delivered securely and instantaneously.
\nThe maps and data provided by RAP are intended to be used alongside local knowledge and site-specific data to inform management actions that improve rangelands and wildlife habitat.
\nBiomass\nThe Rangeland Analysis Platform’s vegetation biomass product provides annual and 16-day aboveground biomass from 1986 to present of: annual forbs and grasses, perennial forbs and grasses, and herbaceous (combination of annual and perennial forbs and grasses). Estimates represent accumulated new biomass throughout the year or 16-day period and do not include biomass accumulation in previous years. Aboveground biomass was calculated by separating net primary production (paritioned by functional group) to aboveground and converting carbon to biomass (Jones et al. 2021, Robinson et al. 2019). Estimates are provided in United States customary units (lbs/acre) to facilitate use. Although these data were produced across a broad region, they are primarily intended for rangeland ecosystems. Biomass estimates may not be suitable in other ecosystems, e.g., forests., and are not to be used in agricultural lands, i.e., croplands.
\nCover\nThe Rangeland Analysis Platform’s vegetation cover product provides annual percent cover estimates from 1986 to present of: annual forbs and grasses, perennial forbs and grasses, shrubs, trees, and bare ground. The estimates were produced by combining 75,000 field plots collected by BLM, NPS, and NRCS with the historical Landsat satellite record. Utilizing the power of cloud computing, cover estimates are predicted across the United States at 30m resolution, an area slightly larger than a baseball diamond.
\nPartitioned NPP\nThe Rangeland Analysis Platform provides net primary productivity (NPP) estimates from 1986 to present. Estimates are partitioned into the following functional groups: annual forb and grass, perennial forb and grass, shrub, and tree. NPP is the net increase (i.e., photosynthesis minus respiration) in total plant carbon, including above and below ground.
\nNPP data download\nPartitioned NPP is available as GeoTIFFs from http://rangeland.ntsg.umt.edu/data/rap/rap-vegetation-npp/ and in Google Earth Engine (ImageCollection ‘projects/rap-data-365417/assets/npp-partitioned-v3’).
", "title": "Rangeland Analysis Platform: Monitor rangelands across the USA", "distribution": [ { "@type": "dcat:Distribution", "downloadURL": "https://rangelands.app/", "mediaType": "text/html", "title": "https://rangelands.app/" } ], "license": "https://www.usa.gov/publicdomain/label/1.0/", "bureauCode": [ "005:18" ], "modified": "2024-02-20", "publisher": { "@type": "org:Organization", "name": "Agricultural Research Service" }, "keyword": [ "cover", "biomass", "carbon", "Biota", "Agriculture", "Environment", "litter", "Vegetation", "landscape analysis", "landsat", "geographic information system", "Web Map", "NP216", "Online database", "data.gov", "ARS" ], "spatial": "{\"type\": \"Polygon\", \"coordinates\": [[[-127.48260498047, 50.212943287279], [-65.387878417969, 49.789244098664], [-65.387878417969, 23.69609223712], [-128.09783935547, 23.816757198536], [-127.48260498047, 50.212943287279]]]}" }, { "identifier": "10.15482/USDA.ADC/1518736", "accessLevel": "public", "contactPoint": { "hasEmail": "mailto:Renee.Arias@USDA.GOV", "fn": "Arias, Renee" }, "programCode": [ "005:040" ], "description": "Raw genome sequencing data of 17 isolates of Aspergillus flavus and Aspergillus parasiticus collected from peanuts from Ethiopia. These isolates were selected as representative of the genetic diversity of Aspergillus section Flavi found colonizing peanut seeds in four peanut-farming districts of Ethiopia, these are Darolabu, Gursum, Fedis, and Babile.
Resource Title: E1201_R1.
File Name: E1201_S52_L008_R1_001.fastq.gz
Resource Title: E1201_R2.
File Name: E1201_S52_L008_R2_001.fastq.gz
Resource Title: E1236_R1.
File Name: E1236_S53_L008_R1_001.fastq.gz
Resource Title: E1236_R2.
File Name: E1236_S53_L008_R2_001.fastq.gz
Resource Title: E1275_R1.
File Name: E1275_S55_L008_R1_001.fastq.gz
Resource Title: E1275_R2.
File Name: E1275_S55_L008_R2_001.fastq.gz
Resource Title: E1288_R1.
File Name: E1288_S56_L008_R1_001.fastq.gz
Resource Title: E1288_R2.
File Name: E1288_S56_L008_R2_001.fastq.gz
Resource Title: E1293_R1.
File Name: E1293_S57_L008_R1_001.fastq.gz
Resource Title: E1293_R2.
File Name: E1293_S57_L008_R2_001.fastq.gz
Resource Title: E1316_R1.
File Name: E1316_S58_L008_R1_001.fastq.gz
Resource Title: E1316_R2.
File Name: E1316_S58_L008_R2_001.fastq.gz
Resource Title: E1319_R1.
File Name: E1319_S59_L008_R1_001.fastq.gz
Resource Title: E1319_R2.
File Name: E1319_S59_L008_R2_001.fastq.gz
Resource Title: E1337_R1.
File Name: E1337_S60_L008_R1_001.fastq.gz
Resource Title: E1337_R2.
File Name: E1337_S60_L008_R2_001.fastq.gz
Resource Title: E1345_R1.
File Name: E1345_S61_L008_R1_001.fastq.gz
Resource Title: E1345_R2.
File Name: E1345_S61_L008_R2_001.fastq.gz
Resource Title: E1348_R1.
File Name: E1348_S62_L008_R1_001.fastq.gz
Resource Title: E1348_R2.
File Name: E1348_S62_L008_R2_001.fastq.gz
Resource Title: E1365_R1.
File Name: E1365_S63_L008_R1_001.fastq.gz
Resource Title: E1365_R2.
File Name: E1365_S63_L008_R2_001.fastq.gz
Resource Title: E1376_R1.
File Name: E1376_S64_L008_R1_001.fastq.gz
Resource Title: E1376_R2.
File Name: E1376_S64_L008_R2_001.fastq.gz
Resource Title: E1402_R1.
File Name: E1402_S65_L008_R1_001.fastq.gz
Resource Title: E1402_R2.
File Name: E1402_S65_L008_R2_001.fastq.gz
Resource Title: E1404_R1.
File Name: E1404_S66_L008_R1_001.fastq.gz
Resource Title: E1404_R2.
File Name: E1404_S66_L008_R2_001.fastq.gz
Resource Title: E1406_R1.
File Name: E1406_S67_L008_R1_001.fastq.gz
Resource Title: E1406_R2.
File Name: E1406_S67_L008_R2_001.fastq.gz
Resource Title: E1443_R1.
File Name: E1443_S69_L008_R1_001.fastq.gz
Resource Title: E1443_R2.
File Name: E1443_S69_L008_R2_001.fastq.gz
Resource Title: E1445_R1.
File Name: E1445_S70_L008_R1_001.fastq.gz
Resource Title: E1445_R2.
File Name: E1445_S70_L008_R2_001.fastq.gz
Field and Lab data regarding the effects of 4 sublethal concentrations of a neonicotinoid insecticide (Imidacloprid) on honey bees and about a dozen native bee species.
Resource Title: Weighted Tolerance Index (WTI) .
File Name: WTI Calculation.docx
Resource Description: Calculating the weighted tolerance index (WTI) for bee species imbibing sublethal quantities of imidacloprid
Resource Title: Weighted tolerance index for 10 bee genera subjected to sublethal concentrations of imidacloprid insecticide (5 - 100ppb).
File Name: Table 4 WTI.docx
Resource Description: These data show to what degree representative species of 10 bee genera were tolerant to the side-effects of imidacloprid intoxication. Higher WTI index indicates greater relative tolerance
Resource Title: Raw data and preliminary analyses.
File Name: BEETOX RAW DATA AGCOMMONS 1.csv
Resource Description: These data represent the raw dataset for bioassays conducted on 12 species of bees representing 10 genera.
Resource Title: Beetox raw data - data dictionary.
File Name: BEETOX raw data DD.csv
Resource Title: Bioassay Data Beetox 2016.
File Name: BIOASSAY DATA BEETOX 2016 2017 4.xlsx
Developed by Gloria DeGrandi-Hoffman et al. A computer-based model simulating the interactions of weather, bloom and honey bee foraging activity that culminate in 'Delicious' apple fruit-set. The model predicts the percentage of blossoms setting fruit based upon weather conditions, orchard design, tree characteistics, and honey bee colonies per hectare. Now available in a complete archive (.ZIP file).
Resource Title: Redapol.
File Name: Web Page, url: https://www.ars.usda.gov/research/software/download/?softwareid=74&modecode=20-22-05-00
Single cell suspensions enriched for epithelial cells were obtained from duodenum, jejunum, and ileum of a 7.5-week-old pig and subjected to single-cell RNA sequencing (scRNA-seq). scRNA-seq was performed to provide transcriptomic profiles of epithelial cells, with 695 cells annotated into 6 cell types. Deeper interrogation of data revealed previously undescribed cells in porcine intestine, and region-specific gene expression profiles within specific cell subsets. Data herein includes a .h5seurat files of the epithelial cell subsets analyzed. Files may be used to reconstruct different analyses and perform further data query. Scripts for original data analyses are found at https://github.com/USDA-FSEPRU/scRNAseqEpSI_Pilot. Raw data are available at GEO accession GSE208613. Data are available for online query at https://singlecell.broadinstitute.org/single_cell/study/SCP1936/regional-epithelial-cell-diversity-in-the-small-intestine-of-pigs.
Resource Title: .h5Seurat object - epithelial cells.
File Name: EpithelialCells.tar
Resource Description: Epithelial cells used for data analysis, available in .h5Seurat file format. Untar file before use.
What is it?
The “Regional self-reliance model of the New England food system” explores future scenarios of regional food self-reliance. In this model, self-reliance is defined as the ratio of production to consumption and can be expressed for individual commodities, food groups, or the overall diet. The model allows a user to define assumptions about diet composition and target self-reliance for different groups of foods. The model estimates the regional self-reliance across seven food groups (grains, vegetables, fruits, dairy, protein-rich foods, fats and oils, and sweeteners) and for the overall diet. In addition, the model calculates land requirements for producing the target amounts of food from New England agriculture. These estimates are presented beside data on current land use to place the results in context.
Why was it generated?
The model was generated as part of the New England Feeding New England (NEFNE) project. The central question of NEFNE was, \"What would it take for 30% of the food consumed in New England to be regionally produced by 2030?\" The model addresses the agricultural production capacity of the region, while accounting for the contribution of capture fisheries and aquaculture to food production. The purpose of the model is to estimate the production capacity of the region’s land resources to evaluate the land requirements of increasing regional self-reliance in food.
How was it generated?
A team of researchers collaborated to construct the model. The model builds on prior work on regional self-reliance, the human carrying capacity of agricultural resources, and analysis of livestock feed requirements. As described below, the model estimates the land requirements of supplying a given level of self-reliance, accounting for food needs, food losses and waste, livestock feed requirements, crop yields, and land availability.
Starting from the food consumption end of the food system, the model takes input data on food intake (in servings person-1 day-1) by food group (e.g., grains) and distributes consumption across primary food commodities from that food group (e.g., corn meal, wheat flour) in the Loss-Adjusted Food Supply. Intake for each primary food commodity is then converted into the equivalent quantity of agricultural commodity (in pounds year-1) needed to supply the region with a sufficient amount of that commodity to meet the target level of self-reliance, at a given projected population size. This conversion accounts for the serving size of the commodity (in grams), losses at different stages of the food system, and processing conversions. For animal products, a further step is taken to convert the quantity of food consumed into equivalent quantities of crop biomass required to feed the requisite livestock. Land requirements for each food are determined by dividing the agricultural commodity (for plant foods) or crop biomass requirements (for animal products) by regional average yields for the appropriate crop(s).
Input data were collected from an array of secondary data sources, including, the Loss-Adjusted Food Supply, the Census of Agriculture, the New England Agricultural Bulletin, Major Land Uses, the Atlantic Coastal Cooperative Statistics Program Data Warehouse, and the NOAA Fisheries Landings data portal. Additional sources used to develop the model are cited in the workbook and reference information is provided in each worksheet. The unique contribution of the model is to organize the data in a form that permits exploration of alternative scenarios of diet, target self-reliance, and land availability for the New England region.
", "title": "Regional self-reliance model of the New England food system", "distribution": [ { "@type": "dcat:Distribution", "downloadURL": "https://ndownloader.figshare.com/files/45279424", "format": "xlsx", "mediaType": "application/vnd.openxmlformats-officedocument.spreadsheetml.sheet", "title": "Production_milestones_model.xlsx" } ], "license": "https://www.usa.gov/publicdomain/label/1.0/", "bureauCode": [ "005:18" ], "modified": "2024-04-18", "publisher": { "@type": "org:Organization", "name": "Agricultural Research Service" }, "accrualPeriodicity": "irregular", "keyword": [ "food self-sufficiency", "Northeast U.S", "carrying capacity", "NEFNE Project" ] }, { "identifier": "10113/AA16574", "accessLevel": "public", "contactPoint": { "hasEmail": "mailto:bcdc@ars-grin.gov", "fn": "Biological Control Documentation Center" }, "programCode": [ "005:040" ], "description": "The Releases Of Beneficial Organisms (ROBO) database consists of documented importations and releases of beneficial insects, mites, and microorganisms, as biological control agents of invasive pests and weeds, and as pollinators. It also includes information on importation and release of microbial natural enemies, and as such is related to the National Microbial Germplasm Program. The goal of the ROBO program is to provide information on invertebrate and microbial germplasm for biological control of invertebrate pests and weeds and ecological research. Users of this database are expected to be foreign and domestic scientists and students involved in biological control and ecological studies, public and private biological control practitioners, and officials in state and federal regulatory agencies dealing with issues involving the introduction of non-indigenous organisms.
\nThe primary organisms covered by this database include: arthropod (insects, mites, and ticks), nematode and other invertebrate pests, weedy plants, and their microbial (bacteria, viruses, fungi, protozoa, etc.), arthropod, nematode and other invertebrate natural enemies. The primary emphasis of the database is collection, introduction, release, culture, establishment, recolonization and impact of non-indigenous organisms on pests in the United States, and their shipment to other countries. The database also includes information on the collection, introduction and release of non-indigenous invertebrate pollinators in the United States.
\nThe ROBO site, originally at https://www.ars-grin.gov/nigrp/robo.html, contained descriptions with links to the database search interface and guidelines, but is in the process of being modernized. The link presented here as part of this resource explains the timeline for this activity, and will be updated once the project is complete.
Resource Title: Releases of Beneficial Organisms in the United States and Territories (ROBO) web page.
File Name: Web Page, url: https://www.ars.usda.gov/research/project/?accnNo=420819
The ROBO site, originally at https://www.ars-grin.gov/nigrp/robo.html, contained descriptions with links to the database search interface and guidelines, but is in the process of being modernized. The link presented here as part of this resource explains the timeline for this activity, and will be updated once the project is complete.
Reliable and cost-effective sampling methods are critical to the development of monitoring systems for pest management and can enhance research activities that address issues in population ecology and population dynamics. Validation and evaluation of these plans are central to development and implementation in the field. Sampling plans are often developed from a restricted range of observations from a small area, but are then used over a wide area representing a novel array of environmental and agronomic conditions.
\nSets of tools for sample plan evaluation originally released in 1997, these Monte Carlo simulations can be used to evaluate sampling models during the developmental phase; however, they may not be adequate for testing model validity and performance under field conditions. This is primarily due to the assumption of an underlying statistical distribution (e.g., negative-binomial, normal) which may not adequately represent the actual distributions of insects in all instances. Here we present a method in which actual field data is resampled to evaluate sample plan performance. We originally developed DOS-based computer software for this purpose. The full functionality of this original program is available as an Excel Add-in in RVSP V.2 compatible with current and past versions of Excel.
Resource Title: Resampling Validation of Sample Plans (RVSP).
File Name: Web Page, url: https://www.ars.usda.gov/research/software/download/?softwareid=129&modecode=20-20-05-05
Residue Removal Study for Greenhouse gas Reduction through Agricultural Carbon Enhancement network and Resilient Economic Agricultural Practices in Brookings, South Dakota
\nResource Title: GeoData catalog record.
File Name: Web Page, url: https://geodata.nal.usda.gov/geonetwork/srv/eng/catalog.search#/metadata/16fa0ab9-c011-4550-a15c-8286d3d5b716
RUSLE2 is a program used to evaluate potential erosion rates at specific sites as well as guide conservation and erosion control planning. It also provides economic information about fuel use and costs for specific crop management systems. The RUSLE2 site also supplies data files from their site that work together in these categories: Crop Management Zone, Climate, and Soil.
\nRUSLE2 uses factors based on climate, soil erodibility, topography, cover management and support practices to compute soil erosion. Conservation planning concepts must be understood and implemented into the RUSLE2 program in order for this program to be used effectively.
\nResource Title: RUSLE2 software download.
File Name: RUSLE2_Program_File, url: http://fargo.nserl.purdue.edu/RUSLE2_ftp/RUSLE2_Program_File
RUSLE2 download files: http://fargo.nserl.purdue.edu/RUSLE2_ftp/RUSLE2_Program_File\n\nRelated data files include:\nNCRS Master Database - download: https://fargo.nserl.purdue.edu/RUSLE2_ftp/NRCS_Base_Database/\nNCRS Climate Data - download: https://fargo.nserl.purdue.edu/RUSLE2_ftp/Climate_data/\nCrop Management Templates, Crop Management Zone Maps Data Files: https://fargo.nserl.purdue.edu/RUSLE2_ftp/Crop_Management_Templates/\nSoils data - files by state: https://fargo.nserl.purdue.edu/rusle2_dataweb/NRCS_Soils_Data_Files.htm
An extensive, 33 year (1964-1996), climatic database has been developed for three climate stations on the Reynolds Creek Experimental Watershed (RCEW) located near the north end of the Owyhee Mountains in southwest Idaho. The longest records (1964-1996) are for daily maximum and minimum temperature. The length of record for other weather elements that include relative humidity, solar radiation, wind speed and direction, daily Class A pan evaporation and barometric pressure varies, but in general is from 1974-1996. Weather sensors have varied from hygrothermographs with spring-driven clocks and charts to electronic sensors with the data telemetered daily to the Northwest Watershed Research Center (NWRC) office in Boise, Idaho. Most of the data, since the early 1980's, were measured and stored electronically, therefore, hourly data are available for most climatic elements between the early 1980's and 1996. These data can be accessed from the USDA-ARS Northwest Watershed Research Center database.
Resource Title: Climate Data.
File Name: climate.zip
Resource Description: Climate data
Reynolds Creek Experimental Watershed discharge records are available for 13 stations with varying lengths of record ranging from 8 to 34 years. The U.S. Department of Agriculture, Agricultural Research Service, Northwest Watershed Research Center initiated a stream discharge and suspended-sediment research program at Reynolds Creek Experimental Watershed in the early 1960s. Continuous discharge measurements began at two sites in 1963, at three additional sites in 1964, and at eight additional sites in subsequent years. Contributing areas to these gauging stations range from 1.03 to 23,822 ha, selected to represent the broad range of environmental settings found across northwestern rangelands. Watershed drainage areas range from 1.03 to 23,822 ha with flow characteristics including ephemeral, intermittent, and perennial regimes. Discharge records are available for 13 stations with varying lengths of record ranging from 8 to 34 years. Drop-box weirs have performed well in RCEW over a wide range of discharges and sediment loads. Four additional types of stream-gauging devices are used in RCEW: (1) self-cleaning overflow V-notch (SCOV) weir, (2) 30 V-notch weir, (3) 90 V-notch weir, and (4) Parshall flume. All stations are equipped with stilling wells and floats for obtaining instantaneous measures of stage height. Instrument shelters are heated to permit collection of discharge and sediment data during cold winter periods. Gauging stations are visited on a weekly or biweekly basis to obtain independent stage height readings for error checking and to service all instrumentation. Stage height measurements were originally recorded using Leopold-Stevens A-35 and FW-1 strip chart recorders, later supplanted by electronic data loggers.
Resource Title: Stream Flow.
File Name: streamflow.zip
Resource Description: Data for Reynolds Creek Experimental Watershed, Idaho (Discharge)
Lysimeters are instruments that measure water and/or solute movement in soils. The primary purpose for these lysimeters was to measure evapotranspiration (ET); these data describe changes in soil water during the snow-free season. In addition to measuring changes in total soil water, soil water content profiles and soil temperature profiles were measured within or adjacent to the lysimeters and are reported. Two pairs of soil lysimeters were installed in the RCEW in 1967, one pair at the Lower Sheep Creek climate station (designated the east and west lysimeters), separated, center to center, by 3.6 m, and the other pair at the Reynolds Mountain climate station (designated north and south), separated by 4.7 m. These lysimeters were hydraulic weighing lysimeters in which an inner cylindrical tank containing soil is set within a slightly larger outer cylinder. The inner cylinder rests on a coil of 0.05 m diameter butyl tubing filled with liquid (different low-freezing point liquids were used). The inner cylinder was 1.22 m deep and 1.47 m in diameter. The butyl tubing was hydraulically connected underground to a pressure transducer or manometer. The soil in each lysimeter was extracted from near the lysimeter sites. A soil core was taken by repeatedly excavating a soil cylinder of slightly larger diameter than the lysimeter and forcing the lysimeter sleeve over the soil to the depth of the sleeve (1.22 m). A metal plate was then forced across the cylinder bottom and welded to it in place. The inner cylinder, thus filled with soil, was then transported to the previously excavated outer cylinder via crane and set on the butyl tubing. A neutron probe access tube was installed in the center of each lysimeter to monitor soil water content changes with depth, and two 1.2 m ceramic suction \"candles\" were placed at the bottom of the lysimeters through a separate entrance. This operation resulted in an undisturbed soil monolith with extant vegetation in place. This is critical for two reasons: (1) Growing native vegetation under natural conditions is problematic in this environment, and plant development is slow. (2) The soil horizonation, particularly the argillic and calcic horizons which are both strongly embedded in coarse fragments, would be essentially impossible to reproduce artificially.
Resource Title: Soil Moisture.
File Name: soilmoisture.zip
Resource Description: Data for Reynolds Creek Experimental Watershed, Idaho (Lysimeter)
An extensive precipitation database has been developed over the past 35 years with the first records starting in January 1962 and going through September 1996 from the Reynolds Creek Experimental Watershed located near the north end of the Owyhee Mountains in southwest Idaho. Precipitation ranges from 236 mm on the lowest elevations at the north end of the watershed to 1123 mm at the southwest corner of the watershed. The gauge network was changed in 1967-1968 from a single unshielded, universal-recording gauge at each location to the dual-gauge system that is presently used. The dualgauge system consists of an unshielded and a shielded universal-recording gauge with orifices 3.05 m above the ground. The number of dual-gauge sites was reduced from the original 46 in 1968 to 17 by 1996. Also, several sites have been added and/or taken out of the network at various times for special studies. There are continuous 35 year records available for 12 sites, 20-32 year records available for 8 sites, 10-19 year records available for 25 sites, and 4-9 year records for 8 sites for a total of 53 sites. All of these data have been stored as breakpoint and hourly records in the USDA-ARS, Northwest Watershed Research Center database. These breakpoint and hourly data are available.
Resource Title: Precipitation.
File Name: precipitation.zip
Resource Description: Precipitation data
Automated Sigma pump samplers were used at all RCEW gauging stations to collect instantaneous point measures of suspended-sediment concentration. The US Department of Agriculture, Agricultural Research Service, Northwest Watershed Research Center initiated a stream discharge and suspended-sediment research program at Reynolds Creek Experimental Watershed in the early 1960s. Samples of suspended-sediment concentration were collected at Outlet, Tollgate, and Reynolds Mountain East gauging stations starting in the 1960s and continuing to the present. In early years, samples were collected manually during storm events using integrated samplers at the large weirs or simple grab samples at the smaller weirs. Later, a variety of early sediment samplers such as the U.S. PS-67 and U.S. PS-69 pumping samplers were tested and used in RCEW through cooperative efforts with other Agricultural Research Service locations, federal and state agencies, and universities. In recent years, automated Sigma pump samplers have been used at all gauging stations to collect a continuous record of instantaneous point measures of suspended-sediment concentration during high and low flows. Drop-box weirs have also performed well in RCEW over a wide range of discharges and sediment loads. Four additional types of stream-gauging devices are used in RCEW: (1) self-cleaning overflow V-notch (SCOV) weir, (2) 30 V-notch weir, (3) 90 V-notch weir, and (4) Parshall flume. All stations are equipped with stilling wells and floats for obtaining instantaneous measures of stage height. Instrument shelters are heated to permit collection of discharge and sediment data during cold winter periods. Gauging stations are visited on a weekly or biweekly basis to obtain independent stage height readings for error checking and to service all instrumentation. Stage height measurements were originally recorded using Leopold-Stevens A-35 and FW-1 strip chart recorders, later supplanted by electronic data loggers.
Resource Title: Stream Flow.
File Name: streamflow.zip
Resource Description: Data for Reynolds Creek Experimental Watershed, Idaho (Sediment)
Snow is the dominant form of precipitation in the Reynolds Creek Experimental Watershed (RCEW). Seven snow course sites were established in 1961, and one additional site was added in 1970. All sites are located in the high-elevation southern extent of the basin, where snow accumulation is greatest. Snow water equivalent (SWE) and depth have been sampled at multiple locations in RCEW since 1961. These data have been collected using snow tube methods that are generally considered the standard for manual measurement of SWE and snow depth. Snow water equivalent (SWE) has been measured at eight locations in RCEW every 2 weeks throughout the snow season (December 1 to June 1) for 35 water years (1962-1996). SWE was continuously monitored at site 176x07 using a snow pillow for 14 water years (1983-1996).
Resource Title: Data for Reynolds Creek Experimental Watershed, Idaho (Snow).
File Name: snow.zip
Resource Description: Data for Reynolds Creek Experimental Watershed, Idaho (Snow)
Long-term soil temperature data were collected at the Reynolds Creek Experimental Watershed (RCEW) from 1981-1996 at five locations representing different climatic regimes and soils in the RCEW, ranging in elevation from 1190 to 2101 m. Each site is located in close proximity to a climate station on nearly level slopes. In most sites, there were six or seven measurement depths ranging from 2.5 to 240 cm; in 1990, new sensors were installed at all sites at depths of 5, 10, 20, 30, 40, 50, 60, 90, 120, and 180 cm. Each soil temperature depth profile is located near at least one neutron access tube and a precipitation gauge, and complete climate station information was collected either at the site or in reasonable proximity. Regular data collection started in 1981 or 1982, depending on the site. The temperature sensors used were YSI (Yellow Springs Instruments, Yellow Springs, Ohio) two-thermistor composite thermolinear components accurate to 0.15C. Data were originally collected in 1981 by connecting a hand-held voltmeter to the sensor leads, and individual sensors at different depths were read using a manual switch. These data were collected once each week, and the time was recorded. At some sites the switches were bypassed and hooked up to data loggers of various design resulting in more frequent (either 1 or 4 hour) recording intervals. Prior to 1990, soil temperature sensors were installed by attaching the sensors to a 0.05 m diameter wooden pole at the desired depth intervals, drilling a hole a with a drill rig (the soils in the RCEW are very rocky), inserting the pole in the drilled hole, and backfilling.
Resource Title: Soil Temperature.
File Name: soiltemperature.zip
Resource Description: Data for Reynolds Creek Experimental Watershed, Idaho (Soil Temperature)
Simple Nucleotide Polymorphism (SNP) Data (12 chromosomes) MY2 SSRs MY2 Traits. \nGenomics and Bioinformatics Research Unit, Stoneville, MS.
\nResource Title: Rice_SNP_data_chromosomes_1-6.
File Name: Rice_SNP_data_chromosomes_1-6_0.zip
Resource Description:
Rice_SNP_data_chromosomes_1-6
\nResource Title: Rice_SNP_data_chromosomes_7-12.
File Name: Rice_SNP_data_chromosomes_7-12.zip
Resource Description:
Rice_SNP_data_chromosomes_7-12
\nResource Title: MY2.
File Name: MY2.zip
Resource Description:
MY2
\nRicebase (https://ricebase.org) is an integrative genomic database for rice (Oryza sativa) with an emphasis on combining datasets in a way that maintains the key links between past and current genetic studies. Ricebase includes DNA sequence data, gene annotations, nucleotide variation data and molecular marker fragment size data. Rice research has benefited from early adoption and extensive use of simple sequence repeat (SSR) markers; however, the majority of rice SSR markers were developed prior to the latest rice pseudomolecule assembly. Interpretation of new research using SNPs in the context of literature citing SSRs requires a common coordinate system. A new pipeline, using a stepwise relaxation of stringency, was used to map SSR primers onto the latest rice pseudomolecule assembly. The SSR markers and experimentally assayed amplicon sizes are presented in a relational database with a web-based front end, and are available as a track loaded in a genome browser with links connecting the browser and database. The combined capabilities of Ricebase link genetic markers, genome context, allele states across rice germplasm and potentially user curated phenotypic interpretations as a community resource for genetic discovery and breeding in rice.
\nResource Title: Ricebase.
File Name: Web Page, url: https://ricebase.org/
Ricebase: a breeding and genetics platform for rice, integrating individual molecular markers, pedigrees and whole-genome-based data
[NOTE - 5/31/2022: this dataset was updated to include two additional resources: Ring Nematode Phenolic Project Materials and Methods and Ring nematode phenolic induction and sensitivity data summaries. No other changes to the data were made.]
\nThis dataset includes data collected from two experiments, one in 2018 and one in 2019, that examined the potential induction of phenolic compounds in the roots of grapevines fed upon by ring nematodes, Mesocriconema xenoplax. Furthermore, a bioassay on 96-well plates was performed to examine the ability of a subclass of phenolics in grapevines (i.e. stilbenoids available as monomers, dimers, trimers, or tetramers) to affect ring nematode mortality. There appeared no significant effects of ring nematode feeding on phenolic levels, nor did these compounds affect survival in the in vitro tests.
Resource Title: Ring Nematode Grapevine Phenolic Induction and Sensitivity.
File Name: Ring Nematode- Phenolic Study.xlsx
Resource Description: This dataset includes two tabs. One tab involves data regarding phenolic compounds in grapevine roots that were healthy or infected by ring nematodes, in one of four different rootstock cultivars (two considered resistant and two considered susceptible). The other tab involves an in vitro study whereby ring nematodes were exposed to different phenolic compounds and mortality was assessed after 24 hours.
Resource Title: Ring Nematode Phenolic Project Materials and Methods.
File Name: Ring Nematode Phenolic Project Materials and Methods.docx
Resource Description: This files contains a comprehensive Materials and Methods write-up to describe how the data were obtained for the project entitled \"Ring nematode induction of and sensitivity to grapevine phenolic compounds\", which is the dataset that this is filed under.
Resource Title: Ring nematode phenolic induction and sensitivity data summaries.
File Name: Ring nematode phenolic induction and sensitivity data summaries.docx
Resource Description: This Word document provides two figures that summarize the data of the project entitled \"Ring Nematode Induction of and Sensitivity to Grapevine Phenolic Compounds.\" The first Figure summarizes the data that involves phenolic compound analyses from healthy and infected roots. The second Figure summarizes the data from the study that examined mortality effects of stilbenoids on ring nematodes.
This data package contains rodent trapping data from plots with various levels of herbivore exclusion on the Jornada Experimental Range (JER) and Chihuahuan Desert Rangeland Research Center (CDRRC) lands. Study sites were established in 1995; one in black grama grassland and the other in creosotebush shrubland to compare the impact of herbivores on ecosystem processes between these vegetation types. Parallel studies were established at the Sevilleta LTER site (New Mexico, USA) and Mapimi Biosphere Reserve (Durango, Mexico). Each study site is 1 km by 0.5 km in area. Three replicate rodent trapping webs and four replicate experimental blocks were randomly located at each study site. Rodent trapping webs were used to measure rodent population density and species diversity over time, while the experimental blocks measure vegetation responses to herbivore exclusion treatments including a) all mammalian herbivores, including cattle, lagomorphs, and rodents, b) lagomorphs and cattle only, c) cattle only, and d) control accessible to all herbivores. Rodent populations were sampled from each of the three webs at each study site during overnight trapping campaigns twice per year, in the early (April-May) and late (September-October) summer between 1995 and 2007 (trapping study terminated after October 2007). During each trapping campaign, live-traps were left open for three consecutive nights, and captured animals were recorded on the three subsequent mornings. Each animal caught was identified, measured, and released at the same location where it was captured. This study is complete.
Resource Title: Website Pointer to html file.
File Name: Web Page, url: https://portal.edirepository.org/nis/mapbrowse?scope=knb-lter-jrn&identifier=210086009
Webpage with information and links to data files for download
What is Stored Grain Advisor?
\nStored Grain Advisor (SGA) is a decision support system for the managemement of insect pests of farm-stored wheat. SGA predicts the likelihood of insect infestation, and recommends preventative and remedial action. It also provides advice on how to sample and identify insect pests of stored wheat.
\nComputer models of insect population growth allow SGA to predict future insect populations in the grain bin, as well as the breakdown of insecticides, the effects of fumigation, and cooling the wheat with aeration. The ability of Stored Grain Advisor to graphically show insect population trends makes it a powerful educational tool.
\nRequirements
\nVersion 3.04 runs under Microsoft Windows 98, 2000, XP, and 32 bit Vista.
\nInstructions
\nRemove any previous versions of SGA using the uninstaller included with the program.\nDownload SgaSetup.exe to your computer.\nRun SgaSetup.exe and follow the Installer's instructions.\nDelete SgaSetup.exe.
\nResource Title: SGA (farm) download page.
File Name: Web Page, url: https://www.ars.usda.gov/research/software/download/?softwareid=82&modecode=30-20-05-20
What is Stored Grain Advisor?
\nStored Grain Advisor (SGA) is a decision support system for the managemement of insect pests of farm-stored wheat. SGA predicts the likelihood of insect infestation, and recommends preventative and remedial action. It also provides advice on how to sample and identify insect pests of stored wheat.
\nComputer models of insect population growth allow SGA to predict future insect populations in the grain bin, as well as the breakdown of insecticides, the effects of fumigation, and cooling the wheat with aeration. The ability of Stored Grain Advisor to graphically show insect population trends makes it a powerful educational tool.
\nRequirements
\nVersion 3.04 runs under Microsoft Windows 98, 2000, XP, and 32 bit Vista.
\nInstructions
\nRemove any previous versions of SGA using the uninstaller included with the program.\nDownload SgaSetup.exe to your computer.\nRun SgaSetup.exe and follow the Installer's instructions.\nDelete SgaSetup.exe.
\nSGA Pro\nSGA Pro was designed for use in commercial elevators as part of the Areawide IPM Project for stored grain. Grain samples are taken with a vacuum probe and processed over an inclined sieve. SGA Pro analyzes the insect data, grain temperatures and moistures, and determines which bins need to be fumigated. (NOTE: available but unsupported.)
\nThis program runs under Microsoft Windows 98, 2000, XP, Vista, and Win7. Note: Win7 may require Windows Classic theme to display properly.
\nSGA Pro was designed for use in commercial elevators (concrete silos, etc).
\nThis system takes a sampling based approach to managing insect pests. Grain samples are taken with a vacuum probe, and processed over an inclined sieve. SGA Pro analyzes the insect data, grain temperatures and moistures, and determines which bins need to be fumigated.
\nThis software was developed for the Areawide IPM Project.
Resource Title: SGA Pro download page.
File Name: Web Page, url: https://www.ars.usda.gov/research/software/download/?softwareid=81&modecode=30-20-05-20
The Southern Great Plains 1997 (SGP97) Hydrology Experiment originated from an interdisciplinary investigation, \"Soil Moisture Mapping at Satellite Temporal and Spatial Scales\" (PI: Thomas J. Jackson, USDA Agricultural Research Service, Beltsville, MD) selected under the NASA Research Announcement 95-MTPE-03. The core of the 1997 experiment involves the deployment of the L-band Electronically Scanned Thinned Array Radiometer (ESTAR) for daily mapping of surface soil moisture. The region selected for investigation is the best instrumented site for surface soil moisture, hydrology and meteorology in the world. This includes the USDA/ARS Little Washita Watershed, the USDA/ARS facility at El Reno, Oklahoma, the ARM/CART central facility, as well as the Oklahoma Mesonet. The temporal coverage for this dataset is as follows: Begin datetime: 1995-10-01 00:00:00, End datetime: 2001-03-31 23:59:59. The Department of Energy (DOE) Atmospheric Radiation Measurement (ARM) Southern Great Plains (SGP) Organic Carbon and Organic Matter Soils Data Set is one of the various sub-surface data sets developed for the GCIP (Global Energy and Water Cycle Experiment [GEWEX] Continental-scale International Project) Enhanced Observation Period (EOP) Data Set. This data set contains a summary table of the measured organic carbon percentage and the estimated organic matter percentage in the near surface soil at each of the ARM SWATS (Soil Water and Temperature System) sites at the SGP site. The soil characterizations were performed by Oklahoma State University.
Resource Title: GeoData catalog record.
File Name: Web Page, url: https://geodata.nal.usda.gov/geonetwork/srv/eng/catalog.search#/metadata/SGP97armSoils_JJM_2015-04-23_1027
The Southern Great Plains 1997 (SGP97) Hydrology Experiment originated from an interdisciplinary investigation, \"Soil Moisture Mapping at Satellite Temporal and Spatial Scales\" (PI: Thomas J. Jackson, USDA Agricultural Research Service, Beltsville, MD) selected under the NASA Research Announcement 95-MTPE-03. The core of the 1997 experiment involves the deployment of the L-band Electronically Scanned Thinned Array Radiometer (ESTAR) for daily mapping of surface soil moisture. The region selected for investigation is the best instrumented site for surface soil moisture, hydrology and meteorology in the world. This includes the USDA/ARS Little Washita Watershed, the USDA/ARS facility at El Reno, Oklahoma, the ARM/CART central facility, as well as the Oklahoma Mesonet. The temporal coverage for this dataset is as follows: Begin datetime: 1995-10-01 00:00:00, End datetime: 2001-03-31 23:59:59. The Department of Energy (DOE) Atmospheric Radiation Measurement (ARM) Southern Great Plains (SGP) Parameters for Soil Water Retention Models Data Set is one of the various sub-surface data sets developed for the ARM/GCIP (Global Energy and Water Cycle Experiment (GEWEX) Continental-scale International Project) 1996 Near-Surface Observation (NESOB-96) Data Set. This data set contains one table for each of the ARM SWATS (Soil Water and Temperature System) sites at the SGP site containing the fitted values of the parameters in the van Genuchten and Brooks-Corey equations for relating soil water pressure to volumetric water content. The soil characterizations were perfomed by Oklahoma State University.
Resource Title: GeoData catalog record.
File Name: Web Page, url: https://geodata.nal.usda.gov/geonetwork/srv/eng/catalog.search#/metadata/SGP97armParameters_JJM_2015-04-23_1318
The Southern Great Plains 1997 (SGP97) Hydrology Experiment originated from an interdisciplinary investigation, \"Soil Moisture Mapping at Satellite Temporal and Spatial Scales\" (PI: Thomas J. Jackson, USDA Agricultural Research Service, Beltsville, MD) selected under the NASA Research Announcement 95-MTPE-03. The core of the 1997 experiment involves the deployment of the L-band Electronically Scanned Thinned Array Radiometer (ESTAR) for daily mapping of surface soil moisture. The region selected for investigation is the best instrumented site for surface soil moisture, hydrology and meteorology in the world. This includes the USDA/ARS Little Washita Watershed, the USDA/ARS facility at El Reno, Oklahoma, the ARM/CART central facility, as well as the Oklahoma Mesonet. The temporal coverage for this dataset is as follows: Begin datetime: 1995-10-01 00:00:00, End datetime: 2001-03-31 23:59:59. The Department of Energy (DOE) Atmospheric Radiation Measurement (ARM) Southern Great Plains (SGP) Soil Bulk Density Data Set is one of the various sub-surface data sets developed for the ARM/GCIP (Global Energy and Water Cycle Experiment (GEWEX) Continental-scale International Project) 1996 Near-Surface Observation (NESOB-96) Data Set. This data set contains a summary table of the bulk densities representing the average of the values obtained from the soil water retention samples at each of the ARM SWATS (Soil Water and Temperature System) sites at the SGP site. The soil characterizations were perfomed by Oklahoma State University.
Resource Title: GeoData catalog record.
File Name: Web Page, url: https://geodata.nal.usda.gov/geonetwork/srv/eng/catalog.search#/metadata/SGP97armBulkDensity_JJM_2015-04-23_1336
The Southern Great Plains 1997 (SGP97) Hydrology Experiment originated from an interdisciplinary investigation, \"Soil Moisture Mapping at Satellite Temporal and Spatial Scales\" (PI: Thomas J. Jackson, USDA Agricultural Research Service, Beltsville, MD) selected under the NASA Research Announcement 95-MTPE-03. The core of the 1997 experiment involves the deployment of the L-band Electronically Scanned Thinned Array Radiometer (ESTAR) for daily mapping of surface soil moisture. The region selected for investigation is the best instrumented site for surface soil moisture, hydrology and meteorology in the world. This includes the USDA/ARS Little Washita Watershed, the USDA/ARS facility at El Reno, Oklahoma, the ARM/CART central facility, as well as the Oklahoma Mesonet. The temporal coverage for this dataset is as follows: Begin datetime: 1995-10-01 00:00:00, End datetime: 2001-03-31 23:59:59. The Department of Energy (DOE) Atmospheric Radiation Measurement (ARM) Southern Great Plains (SGP) Soil Particle Size Data Set is one of the various sub-surface data sets developed for the ARM/GCIP (Global Energy and Water Cycle Experiment ?GEWEX? Continental-scale International Project) 1996 Near-Surface Observation (NESOB-96) Data Set. This data set contains tables of the laboratory data for each soil layer at each of the ARM SWATS (Soil Water and Temperature System) sites at the SGP site. The soil characterizations were perfomed by Oklahoma State University.
Resource Title: GeoData catalog record.
File Name: Web Page, url: https://geodata.nal.usda.gov/geonetwork/srv/eng/catalog.search#/metadata/SGP97armParticle_JJM_2015-04-23_1404
The Southern Great Plains 1997 (SGP97) Hydrology Experiment originated from an interdisciplinary investigation, \"Soil Moisture Mapping at Satellite Temporal and Spatial Scales\" (PI: Thomas J. Jackson, USDA Agricultural Research Service, Beltsville, MD) selected under the NASA Research Announcement 95-MTPE-03. The core of the 1997 experiment involves the deployment of the L-band Electronically Scanned Thinned Array Radiometer (ESTAR) for daily mapping of surface soil moisture. The region selected for investigation is the best instrumented site for surface soil moisture, hydrology and meteorology in the world. This includes the USDA/ARS Little Washita Watershed, the USDA/ARS facility at El Reno, Oklahoma, the ARM/CART central facility, as well as the Oklahoma Mesonet. The temporal coverage for this dataset is as follows: Begin datetime: 1995-10-01 00:00:00, End datetime: 2001-03-31 23:59:59. The Department of Energy (DOE) Atmospheric Radiation Measurement (ARM) Southern Great Plains (SGP) Soil Texture Data Set is one of the various sub-surface data sets developed for the ARM/GCIP (Global Energy and Water Cycle Experiment (GEWEX) Continental-scale International Project) 1996 Near-Surface Observation (NESOB-96) Data Set. This data set contains a summary table of the percentages of sand, silt, and clay fractions in each soil layer at each of the ARM SWATS (Soil Water and Temperature System) sites at the SGP site. Also included is the corresponding USDA texture class as determined from the \"soil triangle\". The soil characterizations were perfomed by Oklahoma State University.
Resource Title: GeoData catalog record.
File Name: Web Page, url: https://geodata.nal.usda.gov/geonetwork/srv/eng/catalog.search#/metadata/SGP97armTexture_JJM_2015-04-23_1409
The Southern Great Plains 1997 (SGP97) Hydrology Experiment originated from an interdisciplinary investigation, \"Soil Moisture Mapping at Satellite Temporal and Spatial Scales\" (PI: Thomas J. Jackson, USDA Agricultural Research Service, Beltsville, MD) selected under the NASA Research Announcement 95-MTPE-03. The core of the 1997 experiment involves the deployment of the L-band Electronically Scanned Thinned Array Radiometer (ESTAR) for daily mapping of surface soil moisture. The region selected for investigation is the best instrumented site for surface soil moisture, hydrology and meteorology in the world. This includes the USDA/ARS Little Washita Watershed, the USDA/ARS facility at El Reno, Oklahoma, the ARM/CART central facility, as well as the Oklahoma Mesonet. The temporal coverage for this dataset is as follows: Begin datetime: 1995-10-01 00:00:00, End datetime: 2001-03-31 23:59:59. The Department of Energy (DOE) Atmospheric Radiation Measurement (ARM) Southern Great Plains (SGP) Soil Water Retention Data Set is one of the various sub-surface data sets developed for the ARM/GCIP (Global Energy and Water Cycle Experiment (GEWEX) Continental-scale International Project) 1996 Near-Surface Observation (NESOB-96) Data Set. This data set contains a table for each of the ARM SWATS (Soil Water and Temperature System) sites at the SGP site containing the observed soil water retention data as obtained from laboratory tests using pressure plates and hanging columns. The soil characterizations were perfomed by Oklahoma State University.
Resource Title: GeoData catalog record.
File Name: Web Page, url: https://geodata.nal.usda.gov/geonetwork/srv/eng/catalog.search#/metadata/SGP97armRetention_JJM_2015-04-23_1419
The core of the 1997 experiment involves the deployment of the L-band Electronically Scanned Thinned Array Radiometer (ESTAR) for daily mapping of surface soil moisture over an area greater than 10,000 km2 and a period on the order of a month. The region selected for investigation is the best instrumented site for surface soil moisture, hydrology and meteorology in the world. This includes the USDA/ARS Little Washita Watershed, the USDA/ARS facility at El Reno, Oklahoma, the ARM/CART central facility, as well as the Oklahoma Mesonet. The region covered by the experiment is 34.5 to 37 North latitude and 97 to 99 West longitude. The aircraft mapping took place over the period 18 June to 18 July 1997. This dataset presents brightness temperature images from the Electronically Scanned Thinned Array Radiometer (L band passive microwave radiometer).
Resource Title: GeoData catalog record.
File Name: Web Page, url: https://geodata.nal.usda.gov/geonetwork/srv/eng/catalog.search#/metadata/SGP97estar_2015-04-23_0916
The Southern Great Plains 1997 (SGP97) Hydrology Experiment originated from an interdisciplinary investigation, \"Soil Moisture Mapping at Satellite Temporal and Spatial Scales\" (PI: Thomas J. Jackson, USDA Agricultural Research Service, Beltsville, MD) selected under the NASA Research Announcement 95-MTPE-03. The Global Energy and Water Cycle Experiment (GEWEX) Continental-scale International Project (GCIP) Enhanced Observing Period (EOP) takes place in the Mississippi River basin during 1995-2000. The Mississippi River basin provides a number of watershed areas that are potentially useful for hydrologic focused studies. During this period, there will be a number of Enhanced Seasonal Observing Periods (ESOPs) in various smaller scale areas. The temporal coverage for this dataset is as follows: Begin date: 1995-10-01 00:00:00, End date: 2000-10-01 23:59:59. This dataset contains the National Centers for Environmental Prediction (NCEP) Environmental Modeling Center (EMC) 4 KM GRIB gage-only analysis using 24h accumulated (\"RFC\") dataset. A prototype, real-time, hourly, multi-sensor National Preciptation Analysis (NPA) has been developed at NCEP in cooperation with the Office of Hydrology (OH). This analysis merges two data sources that are currently being collected in real-time by OH and NCEP. Hourly digital precipitation (HDP) radar estimates are created by the WSR-88D Radar Product Generator on a 131 X 131 4-km grid centered over each radar site. Data analysis routines, including a bias correction of the radar estimates using rain gage data, have been adapted by NCEP on a national 4-km grid from algorithms developed by OH and executed regionally at NWS River Forecast Centers (RFC). The format of the files is GRIB. The files are compressed using the UNIX \"compress\" command and \"uncompress\" must be used before decoding.
Resource Title: GeoData catalog record.
File Name: Web Page, url: https://geodata.nal.usda.gov/geonetwork/srv/eng/catalog.search#/metadata/SGP974KM_JJM_2015-04-23_1504
The Southern Great Plains 1997 (SGP97) Hydrology Experiment originated from an interdisciplinary investigation, \"Soil Moisture Mapping at Satellite Temporal and Spatial Scales\" (PI: Thomas J. Jackson, USDA Agricultural Research Service, Beltsville, MD) selected under the NASA Research Announcement 95-MTPE-03. The Global Energy and Water Cycle Experiment (GEWEX) Continental-scale International Project (GCIP) Enhanced Observing Period (EOP) takes place in the Mississippi River basin, which provides a number of watershed areas that are potentially useful for hydrologic focused studies. The temporal coverage for this dataset is as follows: Begin datetime: 1996-07-09 00:00:00, End datetime: 2001-12-31 23:59:59. This dataset contains the National Centers for Environmental Prediction (NCEP) Environmental Modeling Center (EMC) 4 KM GRIB gage-only analysis (\"GAG\") data. A prototype, real-time, hourly, multi-sensor National Preciptation Analysis (NPA) has been developed at NCEP in cooperation with the Office of Hydrology (OH). This analysis merges two data sources that are currently being collected in real-time by OH and NCEP. Hourly digital precipitation (HDP) radar estimates are created by the WSR-88D Radar Product Generator on a 131 X 131 4-km grid centered over each radar site. Data analysis routines, including a bias correction of the radar estimates using rain gage data, have been adapted by NCEP on a national 4-km grid from algorithms developed by OH and executed regionally at NWS River Forecast Centers (RFC). This dataset only contains the NCEP 4 KM GRIB Data gage-only hourly, 6-hourly, and daily analysis. 6-hourly data are generally available at 00Z, 06Z, 12Z, and 18Z. Daily data are generally available at 12Z. Depending on the time period selected, all three datasets may or may not be available. Other NCEP 4 KM GRIB Data including multi-sensor analysis (gage and unbiased radar), radar estimate, radar estimate after bias removal, and gage-only analysis using 24h accumulated (\"RFC\") data are available as independent datasets. Depending on the time period selected, all five types may or may not be available. Please see GCIP/EOP: Surface NCEP Ancillary Catalogue of Available GCIP Precipitation Data (NCEP/EMC). The format of the files is GRIB. The files are compressed using the UNIX \"compress\" command and \"uncompress\" must be used before decoding.
Resource Title: GeoData catalog record.
File Name: Web Page, url: https://geodata.nal.usda.gov/geonetwork/srv/eng/catalog.search#/metadata/SGP974KM1996_JJM_2015-04-24_1043
The Southern Great Plains 1997 (SGP97) Hydrology Experiment originated from an interdisciplinary investigation, \"Soil Moisture Mapping at Satellite Temporal and Spatial Scales\" (PI: Thomas J. Jackson, USDA Agricultural Research Service, Beltsville, MD) selected under the NASA Research Announcement 95-MTPE-03. The Global Energy and Water Cycle Experiment (GEWEX) Continental-scale International Project (GCIP) Enhanced Observing Period (EOP) takes place in the Mississippi River basin, which provides a number of watershed areas that are potentially useful for hydrologic focused studies. The temporal coverage for this dataset is as follows: Begin datetime: 1996-07-09 00:00:00, End datetime: 2001-12-31 23:59:59. This dataset contains the National Centers for Environmental Prediction (NCEP) Environmental Modeling Center (EMC) 4 KM GRIB multi-sensor analysis (\"MUL\") data. A prototype, real-time, hourly, multi-sensor National Preciptation Analysis (NPA) has been developed at NCEP in cooperation with the Office of Hydrology (OH). This analysis merges two data sources that are currently being collected in real-time by OH and NCEP. Hourly digital precipitation (HDP) radar estimates are created by the WSR-88D Radar Product Generator on a 131 X 131 4-km grid centered over each radar site. Data analysis routines, including a bias correction of the radar estimates using rain gage data, have been adapted by NCEP on a national 4-km grid from algorithms developed by OH and executed regionally at NWS River Forecast Centers (RFC). This dataset only contains the NCEP 4 KM GRIB Data multi-sensor hourly, 6-hourly, and daily analysis (gage and unbiased radar). 6-hourly data are generally available at 00Z, 06Z, 12Z, and 18Z. Daily data are generally available at 12Z. Depending on the time period selected, all three datasets may or may not be available. Other NCEP 4 KM GRIB Data including gage-only analysis, radar estimate, radar estimate after bias removal, and gage-only analysis using 24h accumulated (\"RFC\") data are available as independent datasets. Depending on the time period selected, all five types may or may not be available. Please see GCIP/EOP: Surface NCEP Ancillary Catalogue of Available GCIP Precipitation Data (NCEP/EMC). The format of the files is GRIB. The files are compressed using the UNIX \"compress\" command and \"uncompress\" must be used before decoding.
Resource Title: GeoData catalog record.
File Name: Web Page, url: https://geodata.nal.usda.gov/geonetwork/srv/eng/catalog.search#/metadata/SGP974KM2001_JJM_2015-04-24_1054
The Southern Great Plains 1997 (SGP97) Hydrology Experiment originated from an interdisciplinary investigation, \"Soil Moisture Mapping at Satellite Temporal and Spatial Scales\" (PI: Thomas J. Jackson, USDA Agricultural Research Service, Beltsville, MD) selected under the NASA Research Announcement 95-MTPE-03. The Global Energy and Water Cycle Experiment (GEWEX) Continental-scale International Project (GCIP) Enhanced Observing Period (EOP) takes place in the Mississippi River basin, which provides a number of watershed areas that are potentially useful for hydrologic focused studies. The temporal coverage for this dataset is as follows: Begin datetime: 1996-05-01 00:00:00, End datetime: 2001-12-31 23:59:59. This dataset contains the National Centers for Environmental Prediction (NCEP) Environmental Modeling Center (EMC) 4 KM GRIB radar estimate (no bias removal) \"RAD\" data. A prototype, real-time, hourly, multi-sensor National Preciptation Analysis (NPA) has been developed at NCEP in cooperation with the Office of Hydrology (OH). This analysis merges two data sources that are currently being collected in real-time by OH and NCEP. Hourly digital precipitation (HDP) radar estimates are created by the WSR-88D Radar Product Generator on a 131 X 131 4-km grid centered over each radar site. Data analysis routines, including a bias correction of the radar estimates using rain gage data, have been adapted by NCEP on a national 4-km grid from algorithms developed by OH and executed regionally at NWS River Forecast Centers (RFC). This dataset only contains the NCEP 4 KM GRIB Data hourly, 6-hourly, and daily radar estimate (no bias removal). 6-hourly data are generally available at 00Z, 06Z, 12Z, and 18Z. Daily data are generally available at 12Z. Depending on the time period selected, all three datasets may or may not be available. Other NCEP 4 KM GRIB Data including gage-only analysis, multi-sensor analysis (gage and unbiased radar), radar estimate after bias removal, and gage-only analysis using 24h accumulated (\"RFC\") data are available as independent datasets. Depending on the time period selected, all five types may or may not be available. Please see GCIP/EOP: Surface NCEP Ancillary Catalogue of Available GCIP Precipitation Data (NCEP/EMC). The format of the files is GRIB. The files are compressed using the UNIX \"compress\" command and \"uncompress\" must be used before decoding.
Resource Title: GeoData catalog record.
File Name: Web Page, url: https://geodata.nal.usda.gov/geonetwork/srv/eng/catalog.search#/metadata/SGP974KMnobias_JJM_2015-04-24_1102
The Southern Great Plains 1997 (SGP97) Hydrology Experiment originated from an interdisciplinary investigation, \"Soil Moisture Mapping at Satellite Temporal and Spatial Scales\" (PI: Thomas J. Jackson, USDA Agricultural Research Service, Beltsville, MD) selected under the NASA Research Announcement 95-MTPE-03. The Global Energy and Water Cycle Experiment (GEWEX) Continental-scale International Project (GCIP) Enhanced Observing Period (EOP) takes place in the Mississippi River basin, which provides a number of watershed areas that are potentially useful for hydrologic focused studies. The temporal coverage for this dataset is as follows: Begin datetime: 1997-04-23 00:00:00, End datetime: 2001-12-31 23:59:59. This dataset contains the National Centers for Environmental Prediction (NCEP) Environmental Modeling Center (EMC) 4 KM GRIB radar estimate after bias removal (\"UBR\") data. A prototype, real-time, hourly, multi-sensor National Preciptation Analysis (NPA) has been developed at NCEP in cooperation with the Office of Hydrology (OH). This analysis merges two data sources that are currently being collected in real-time by OH and NCEP. Hourly digital precipitation (HDP) radar estimates are created by the WSR-88D Radar Product Generator on a 131 X 131 4-km grid centered over each radar site. Data analysis routines, including a bias correction of the radar estimates using rain gage data, have been adapted by NCEP on a national 4-km grid from algorithms developed by OH and executed regionally at NWS River Forecast Centers (RFC). This dataset only contains the NCEP 4 KM GRIB Data hourly, 6-hourly, and daily radar estimate after bias removal. 6-hourly data are generally available at 00Z, 06Z, 12Z, and 18Z. Daily data are generally available at 12Z. Depending on the time period selected, all three datasets may or may not be available. Other NCEP 4 KM GRIB Data including gage-only analysis, multi-sensor analysis (gage and unbiased radar), radar estimate (no bias removal), and gage-only analysis using 24h accumulated (\"RFC\") data are available as independent datasets. Depending on the time period selected, all five types may or may not be available. Please see GCIP/EOP: Surface NCEP Ancillary Catalogue of Available GCIP Precipitation Data (NCEP/EMC). The format of the files is GRIB. The files are compressed using the UNIX \"compress\" command and \"uncompress\" must be used before decoding.
Resource Title: GeoData catalog record.
File Name: Web Page, url: https://geodata.nal.usda.gov/geonetwork/srv/eng/catalog.search#/metadata/SGP974KMUBR_JJM_2015-04-24_1106
The Southern Great Plains 1997 (SGP97) Hydrology Experiment originated from an interdisciplinary investigation, \"Soil Moisture Mapping at Satellite Temporal and Spatial Scales\" (PI: Thomas J. Jackson, USDA Agricultural Research Service, Beltsville, MD) selected under the NASA Research Announcement 95-MTPE-03. The Department of Energy (DOE) Atmospheric Radiation Measurement (ARM) Global Energy and Water Cycle Experiment (GEWEX) Continental-Scale International Project (GCIP) Near-Surface Observation Data Set (NESOB) 1997 Hourly Surface Composite is composed of data from several sources (i.e., Automated Surface Observing System (ASOS), Department Of Energy (DOE) Atmospheric Radiation Measurement Surface (ARMSFC), National Oceanic and Atmospheric Administration (NOAA) Wind Profiler Network (NPN), High Plains Climate Network (HPCN), National Climatic Data Center (NCDC) DATSAV3, and the NOAA Atmospheric Turbulence and Diffusion Division (ATDD) Little Washita Meteorological site for the ARM/GCIP NESOB 1997 domain. Data from these sources (approximately 100 stations) were merged and quality controlled to form this Surface Composite. This Surface Composite contains data for the ARM/GCIP NESOB 1997 time period (01 April 1997 through 31 March 1998) and for the ARM/GCIP NESOB 1997 domain only. The ARM/GCIP NESOB 1997 domain is approximately 34N to 39N latitude and 94.5W to 100.5W longitude. The ARM/GCIP NESOB 1997 Hourly Surface Composite contains ten metadata parameters and 38 data parameters and flags. The metadata parameters describe the station location and time at which the data were collected. The time of observation is reported both in Universal Time Coordinated (UTC) Nominal and UTC actual time. Days begin at UTC hour 0100 and end at UTC hour 0000 the following day. The data parameters are valid for the reported times. Missing values are reported as 9's in the data field. Several data parameters have an associated Quality Control (QC) Flag Code which is assigned during the Joint Office for Science Support (JOSS) quality control processing; data were never changed, only flagged. When not present in the raw data, the dewpoint is computed using the formula from Bolton (1980). Calculated Sea Level pressure is computed from station pressure, temperature, dewpoint, and station elevation using the formula of Wallace and Hobbs (1977). Specific Humidity values were computed from dew point and station pressure using formulas from Wexler and Wildhack (1963). The squall/gust wind speed data were not quality controlled.
Resource Title: GeoData catalog record.
File Name: Web Page, url: https://geodata.nal.usda.gov/geonetwork/srv/eng/catalog.search#/metadata/041f01f5-c04f-4be5-a74c-5d51af5878fd
The National Centers for Environmental Prediction (NCEP) Miscellaneous Daily Precipitation Dataset is one of several precipitation datasets provided in the Global Energy and Water Cycle Experiment (GEWEX) Continental-Scale International Project (GCIP) Near-Surface Observation Data Set (NESOB) 1997. This dataset contains all daily precipitation data from the National Centers for Environmental Prediction (NCEP) stations. Stations that reported at standard or incremental times are also included in the various NESOB 1997 precipitation composite datasets. The miscellaneous daily precipitation dataset contains data from stations in the NESOB 1997 domain (94.5 W to 100.5W longitude and 34N to 39N latitude) and time period (01 April 1997 through 31 March 1998). These data were not quality controlled by the University Corporation for Atmospheric Research/Joint Office for Science Support (UCAR/JOSS). The National Centers for Environmental Prediction (NCEP) Miscellaneous Daily Precipitation Dataset contains fifteen parameters and uses code tables from the Standard Hydrometeorological Exchange Format (SHEF). The fifteen parameters repeat once for each time period, where the time period is nominally daily. The Physical Element code field should always contain a PP indicating that the precipitation data is reported as incremental values. Missing values are not reported. Each precipitation value has an associated observation date and time which are UTC times.
Resource Title: GeoData catalog record.
File Name: Web Page, url: https://geodata.nal.usda.gov/geonetwork/srv/eng/catalog.search#/metadata/9b312e25-fde6-41fd-9775-e10a039cbd33
The National Centers for Environmental Prediction (NCEP) Miscellaneous Precipitation Dataset is one of several precipitation datasets provided in the Global Energy and Water Cycle Experiment (GEWEX) Continental-Scale International Project (GCIP) Near-Surface Observation Data Set (NESOB) 1997. This dataset contains all hourly precipitation data from the National Centers for Environmental Prediction (NCEP) stations. Stations that reported at standard or incremental times are also included in the various NESOB 1997 precipitation composite datasets. The miscellaneous precipitation dataset contains data from stations in the NESOB 1997 domain (94.5 W to 100.5W longitude and 34N to 39N latitude) and time period (01 April 1997 through 31 March 1998). These data were not quality controlled by the University Corporation for Atmospheric Research/Joint Office for Science Support (UCAR/JOSS). The National Centers for Environmental Prediction (NCEP) Miscellaneous Precipitation Dataset contains eight parameters and uses code tables from the Standard Hydrometeorological Exchange Format (SHEF). The eight parameters repeat once for each time period, where the time period is nominally hourly. The Physical Element code field should always contain a PP indicating that the precipitation data is reported as incremental values. Missing values are not reported. Each precipitation value has an associated observation date and time which are UTC times. The algorithms used to form the NCEP Precipitation data are not currently available.
Resource Title: GeoData catalog record.
File Name: Web Page, url: https://geodata.nal.usda.gov/geonetwork/srv/eng/catalog.search#/metadata/a9eadec5-9d42-41a6-b751-0f3a338de036
The Southern Great Plains 1997 (SGP97) Hydrology Experiment originated from an interdisciplinary investigation, \"Soil Moisture Mapping at Satellite Temporal and Spatial Scales\" (PI: Thomas J. Jackson, USDA Agricultural Research Service, Beltsville, MD) selected under the NASA Research Announcement 95-MTPE-03. The National Climatic Data Center (NCDC) Evaporation Dataset is one of several surface datasets provided for the Global Energy and Water Cycle Experiment (GEWEX) Continental-Scale International Project (GCIP) Near Surface Observation Data Set (NESOB) 1997 project. This dataset was formed by extracting evaporation data from the GCIP/Enhanced Seasonal Observing Period 1997 (GCIP/ESOP-97) NCDC Summary of the Day Co-operative Dataset (TD-3200) for the NESOB 1997 area and time of interest. This NCDC Evaporation Dataset contains data from approximately 14 stations reporting evaporation data for the NESOB 1997 time period (01 April 1997 through 31 March 1998, and in the NESOB 1997 domain (approximately 94.5W to 100.5W longitude and 34N to 39N latitude). The NCDC Evaporation Dataset contains seven metadata parameters and sixteen data parameters and flags. The metadata parameters describe the date, network, station and location at which the data were collected. Data values are valid for the 24 hours preceding the time of observation, and all times are UTC. The evaporation and temperature parameters are not reported when the temperature is below freezing. The data parameters have two associated NCDC Quality Control (QC) Flags. The NCDC Evaporation Dataset hour of observation varies by station. Quality Control for this data was provided by NCDC. No additional QC was performed by University Corporation for Atmospheric Research/Joint Office for Science Support (UCAR/JOSS) on this dataset.
Resource Title: GeoData catalog record.
File Name: Web Page, url: https://geodata.nal.usda.gov/geonetwork/srv/eng/catalog.search#/metadata/7c8ce630-bb05-4fbc-b380-ee561e822d52
This 30 minute Net Radiation and Photosynthetically Active Radiation (PAR) Composite is one of several surface-layer data sets provided in the Atmospheric Radiation Measurement(ARM)/Global Energy and Water Cycle Experiment (GEWEX) Continental-Scale International Project (GCIP) Near Surface Observation Data Set - 1997 (NESOB-97). This radiation composite was formed from three data sources: net radiation derived from the Solar and Infrared Radiation Observing System (SIROS) 20 second data of Upwelling and Downwelling Longwave and Shortwave Irradiance; net radiation derived from the Solar Infrared Station (SIRS) 20 second data of Upwelling and Downwelling Longwave and Shortwave Irradiance; and 30 minute data from the GCIP National Oceanic and Atmospheric Administration (NOAA)/Atmospheric Turbulence and Diffusion Division (ATDD) Little Washita, Oklahoma long term flux monitoring site. This composite was developed by the merging of the computed 30-minute averaged values of Net Radiation as derived by University Corporation for Atmospheric Research/Joint Office for Science Support (UCAR/JOSS) from the 20-second values provided by ARM for its SIROS and SIRS stations, and the 30-minute averaged values of Incoming/Outgoing PAR and Net Radiation as provided by NOAA/ATDD for its Little Washita station. UCAR/JOSS computed standard deviations for the averaged data when at least 15 observations were available within the 30-minute averaging interval. JOSS did not do any other quality control on the data set. The NESOB-97 Net Radiation and PAR Composite Dataset contains eight metadata parameters and nine data parameters and flags. The metadata parameters describe the date, time, network, station and location at which the data were collected. Data values are valid for the 30 minutes preceeding the time of observation. All times are UTC. The data parameters have an associated QC flag but UCAR/JOSS does not Quality Control the data at the present time. The Quality Control flag is set to \"U\" for \"Unchecked\", unless the datum is missing, in which case the flag is set to \"M\". Note that the SIROS stations were changed over to SIRS in August 1997.
Resource Title: GeoData catalog record.
File Name: Web Page, url: https://geodata.nal.usda.gov/geonetwork/srv/eng/catalog.search#/metadata/b8988601-ea9a-4392-8ee4-eb0d67d1e946
This 30 minute Sensible, Latent and Ground Heat Flux Composite is one of two surface-layer flux data sets provided in the Atmospheric Radiation Measurement(ARM)/Global Energy and Water Cycle Experiment (GEWEX) Continental-Scale International Project (GCIP) Near Surface Observation Data Set - 1997 (NESOB-97). This Sensible, Latent and Ground Heat Flux composite was formed from three data sources: the ARM Southern Great Plains (SGP) Clouds and Radiation Testbed (CART) Energy Balance/Bowen Ratio (EBBR) sites, the National Oceanic and Atmospheric Administration (NOAA)/Atmospheric Turbulence and Diffusion Division (ATDD) Little Washita Watershed site, and the ARM SGP Eddy Correlation (ECOR) sites. Data from 14 ARM/EBBR stations, 1 NOAA/ATDD station, and 8 ARM/ECOR stations were merged to form this composite. The University Corporation for Atmospheric Research/Joint Office for Science Support (UCAR/JOSS) did not do any quality control on the data set. Heat flux sensors consist of a differential temperature sensor which measures heat flow. Heat flux is a vector quantity of energy flowing through a 1 meter square surface in one second. Sensible heat flux is the transfer of sensible heat between the surface and the air, or vice versa. Latent heat flux is the transfer of latent heat (heat released or absorbed by water) between the surface and the air, or vice versa. Ground, or soil, heat flux is the transfer of sensible heat in the soil, either toward the surface or away from the surface. The Little Washita site records only 1 soil heat flux value. The EBBR sites record soil heat flux values from 5 different sensors. The ARM soil sensors are located in a half-circle approximately 2 meters in diameter under the net radiometer, which extends to the south about 1 meter from the EBBR frame. The soil conditions at the EBBR sites are varied from very sandy soil to very clay-laden soil. However, all of the sensors for one particular EBBR site are in the same soil type. Information on the soil characteristics at each of the ARM Soil Water and Temperature System (SWATS) sites (which are located nearby the ARM EBBR sites) is available as part of the ARM/GCIP NESOB-97. (These include the \"Organic Carbon and Matter\", \"Soil Texture\", \"Parameters for Soil Water Retention Models\", \"Bulk Density\", Particle Size\", and \"Soil Water Retention\" data sets). The EBBR sites also record Bowen Ratio, home_15 and home_30 values, as well, whereas the Little Washita site does not. Since this is a composite data set, only the first 3 fields of data from the Little Washita site will have values, while the rest of the parameters on a line will always be missing. Missing values are -999.99999.\n(NOAA)/Atmospheric Turbulence and Diffusion Division (ATDD) Little Washita, Oklahoma long term flux monitoring site. This composite was developed by the merging of the computed 30-minute averaged values of Net Radiation as derived by University Corporation for Atmospheric Research/Joint Office for Science Support (UCAR/JOSS) from the 20-second values provided by ARM for its SIROS and SIRS stations, and the 30-minute averaged values of Incoming/Outgoing PAR and Net Radiation as provided by NOAA/ATDD for its Little Washita station. UCAR/JOSS computed standard deviations for the averaged data when at least 15 observations were available within the 30-minute averaging interval. JOSS did not do any other quality control on the data set. The NESOB-97 Net Radiation and PAR Composite Dataset contains eight metadata parameters and nine data parameters and flags. The metadata parameters describe the date, time, network, station and location at which the data were collected. Data values are valid for the 30 minutes preceeding the time of observation. All times are UTC. The data parameters have an associated QC flag but UCAR/JOSS does not Quality Control the data at the present time. The Quality Control flag is set to \"U\" for \"Unchecked\", unless the datum is missing, in which case the flag is set to \"M\". Note that the SIROS stations were changed over to SIRS in August 1997.
Resource Title: GeoData catalog record.
File Name: Web Page, url: https://geodata.nal.usda.gov/geonetwork/srv/eng/catalog.search#/metadata/428b1ca5-4e93-4553-8373-29d739077c1f
This 30 minute Shortwave and Longwave Radiation Composite is one of several surface-layer data sets provided in the Atmospheric Radiation Measurement(ARM)/Global Energy and Water Cycle Experiment (GEWEX) Continental-Scale International Project (GCIP) Near Surface Observation Data Set - 1997 (NESOB-97). This Radiation Composite was formed from five data sources: (1) the 25m ARM/Clouds and Radiation Testbed (CART) Multi-Filter Radiometer (MFR) 20 second data of Upwelling Longwave and Shortwave Irradiance; (2) the Solar and Infrared Radiation Observing System (SIROS) 20 second data of Upwelling and Downwelling Longwave and Shortwave Irradiance, which changed over to (3) the Solar Infrared Station (SIRS) 20 second data of Upwelling and Downwelling Longwave and Shortwave Irradiance; (4) the Broadband Solar Radiation Network (BSRN) 1 minute data of Downwelling Longwave and Shortwave Irradiance; and (5) the High Plains Climate Network (HPCN) hourly Solar Radiation data. This composite was developed by the merging of the 30-minute averaged values of Irradiance as derived by University Corporation for Atmospheric Research/Joint Office for Science Support (UCAR/JOSS) from the 20-second values provided by ARM for its 25m MFR station and its SIROS and SIRS stations; the 30-minute averaged values of Irradiance as derived by UCAR/JOSS from the 1-minute values provided by ARM for its BSRN station; and the hourly values provided by HPCN. UCAR/JOSS computed standard deviations for the averaged irradiance data when at least 15 observations were available within the 30-minute averaging interval. JOSS did not do any other quality control on the data set. This radiation composite contains data within the NESOB 1997 domain (100.5W to 94.5W longitude and 34N to 39N latitude) and time period (01 April 1997 through 31 March 1998). The ARM/GCIP NESOB-97 Shortwave and Longwave Radiation Composite Dataset contains eight metadata parameters and twelve data parameters and flags. The metadata parameters describe the date, time, network, station and location at which the data were collected. Data values are valid for the 30 minutes preceding the time of observation, and all times are UTC. The data parameters have an associated QC flag but the University Corporation for Atmospheric Research/Joint Office for Science Support (UCAR/JOSS) does not Quality Control the data at the present time. The Quality Control flag is set to \"U\" for \"Unchecked\", unless the datum is missing, in which case the flag is set to \"M\". A few problems occurred with instrumentation during NESOB-97 which affected the quality of the data; explanations of these problems can be found in the dataset documentation.
Resource Title: GeoData catalog record.
File Name: Web Page, url: https://geodata.nal.usda.gov/geonetwork/srv/eng/catalog.search#/metadata/8a2be0bc-8170-4361-b404-ccda0a47fcf0
This 30 minute Skin Temperature Composite is one of several surface-layer data sets provided in the Atmospheric Radiation Measurement (ARM)/Global Energy and Water Cycle Experiment (GEWEX) Continental-Scale International Project (GCIP) Near Surface Observation Data Set - 1997 (NESOB-97). This Skin Temperature composite was formed from three data sources: the 10m and 25m ARM/Clouds and Radiation Testbed (CART) Multi-Filter Radiometer (MFR) 20 second data, and 30 minute data from the GCIP National Oceanic and Atmospheric Administration (NOAA)/Atmospheric Turbulence and Diffusion Division (ATDD) Little Washita, Oklahoma long term flux monitoring site. This composite was developed by the merging of the 30-minute averaged values of skin temperature as provided by NOAA/ATDD for its Little Washita station and the 30-minute averaged values of skin temperature as derived by University Corporation for Atmospheric Research/Joint Office for Science Support (UCAR/JOSS) from the 20-second values provided by ARM for its 10m and 25m MFR stations. UCAR/JOSS computed standard deviations for the ARM 10m and 25m MFR data when at least 15 observations were available within the 30-minute averaging interval. The ARM/GCIP NESOB-97 Skin Temperature Composite contains 8 metadata parameters and 3 data parameters. The metadata parameters describe the date/time, network, station, and location at which the data were collected. The 3 data parameters repeat once for each 30 minute period from UTC 0000 through UTC 2330. Data reported for a designated 30 minute time represents data collected during the previous 30 minute period. All times are reported in UTC, and skin temperature values are reported in degrees Celsius. Each data value is followed by a Quality Control flag, but UCAR/JOSS does not Quality Control the data at the present time. The Quality Control flag is set to \"U\" for \"Unchecked\", unless the datum is missing, in which case the flag is set to \"M\". Missing values are -999.99. The standard deviation was calculated for the ARM 10m and 25m MFR Skin Temperature values when there were at least 15 measurements in the 30 minute averaging interval. No standard deviations were calculated for the Little Washita data, since it originated in 30 minute frequency.
Resource Title: GeoData catalog record.
File Name: Web Page, url: https://geodata.nal.usda.gov/geonetwork/srv/eng/catalog.search#/metadata/f45c0d23-6589-4259-b198-28cbda6b360f
The Southern Great Plains 1997 (SGP97) Hydrology Experiment originated from an interdisciplinary investigation, \"Soil Moisture Mapping at Satellite Temporal and Spatial Scales\" (PI: Thomas J. Jackson, USDA Agricultural Research Service, Beltsville, MD) selected under the NASA Research Announcement 95-MTPE-03. The National Oceanic and Atmospheric Administration (NOAA)/Atmospheric Turbulence and Diffusion Division (ATDD) Soil Moisture Dataset is one of several sub-surface datasets provided for the Global Energy and Water Cycle Experiment (GEWEX) Continental-Scale International Project (GCIP) Near Surface Observation Data Set (NESOB) 1997 project. This dataset contains data from one station, the Little Washita Watershed Long Term Flux Site (near Chickasha, Oklahoma) within the NESOB 1997 domain (100.5W to 94.5W longitude and 34N to 39N latitude) and time period (01 April 1997 through 31 March 1998). The NOAA/ATDD Soil Moisture Dataset contains eight metadata parameters and one data parameter and flag. The metadata parameters describe the date, time, network, station and location at which the data were collected. Data values are valid for the 30 minutes preceding the time of observation, and all times are UTC. The data parameter consists of soil volumetric water content at 10 centimeter zone.
Resource Title: GeoData catalog record.
File Name: Web Page, url: https://geodata.nal.usda.gov/geonetwork/srv/eng/catalog.search#/metadata/SGP97NESOB_NOAAsoilmoisture_jjm_2015-05-04_1228
The Southern Great Plains 1997 (SGP97) Hydrology Experiment originated from an interdisciplinary investigation, \"Soil Moisture Mapping at Satellite Temporal and Spatial Scales\" (PI: Thomas J. Jackson, USDA Agricultural Research Service, Beltsville, MD) selected under the NASA Research Announcement 95-MTPE-03. The National Oceanic and Atmospheric Administration (NOAA)/Atmospheric Turbulence and Diffusion Division (ATDD) Soil Temperature Dataset is one of several sub-surface datasets provided for the Global Energy and Water Cycle Experiment (GEWEX) Continental-Scale International Project (GCIP) Near Surface Observation Data Set (NESOB) 1997 project. This dataset contains data from one station, the Little Washita watershed long term flux site, within the NESOB 1997 domain (100.5W to 94.5W longitude and 34N to 39N latitude) and time period (01 April 1997 through 30 September 1997). Soil Temperature is sampled every 2 seconds with a datalogger and multiplexor (CR21x, Campbell Scientific, Inc.), and averages are computed every 30 minutes. A laptop computer retrieves the soil temperature data from the CR21X datalogger every 30 minutes and appends the data to an existing file. After midnight, the data are copied to separate files with a name, year, and calendar day header. The computer is equipped with a modem and cellular phone in order to retrieve the data and conduct occasional system checks. On average, data are retrieved from the laptop computers about once every two days. The NOAA/ATDD Soil Temperature Dataset contains eight metadata parameters and eighteen data parameters and flags. The metadata parameters describe the date, time, network, station and location at which the data were collected. Data values are valid for the 30 minutes preceding the time of observation, and all times are UTC. The data parameters consist of triplets for each depth.
Resource Title: GeoData catalog record.
File Name: Web Page, url: https://geodata.nal.usda.gov/geonetwork/srv/eng/catalog.search#/metadata/SGP97NESOB_NOAAsoiltemp_jjm_2015-05-04_1245
The Southern Great Plains 1997 (SGP97) Hydrology Experiment originated from an interdisciplinary investigation, \"Soil Moisture Mapping at Satellite Temporal and Spatial Scales\" (PI: Thomas J. Jackson, USDA Agricultural Research Service, Beltsville, MD) selected under the NASA Research Announcement 95-MTPE-03. The Continental-scale International Project (GCIP) Enhanced Observing Period (EOP) takes place in the Mississippi River basin, which provides a number of watershed areas that are potentially useful for hydrologic focused studies. The National Climatic Data Center (NCDC) Soil Temperature Dataset is one of several surface datasets provided for the Global Energy and Water-Balance Experiment (GEWEX) Continental-Scale International Project (GCIP) Near Surface Observation Data Set (NESOB) 1997 project. This dataset was formed by extracting soil temperature data from the GCIP/Enhanced Seasonal Observing Period 1997 (GCIP/ESOP-97) NCDC Summary of the Day Co-operative Dataset (TD-3200) for the NESOB 1997 area and time of interest. This NCDC Soil Temperature Dataset contains data from approximately 12 stations reporting soil temperature data for the NESOB 1997 time period (01 April 1997 through 31 March 1998) and in a domain slightly beyond that of NESOB 1997 (approximately 94.5W to 102W longitude and 34N to 39.5N latitude). The NCDC Soil Temperature Dataset contains seven metadata parameters and eighteen data parameters and flags. The metadata parameters describe the date, network, station and location at which the data were collected. Data values are valid for the 24 hours preceding the time of observation, and all times are UTC. Some stations may report soil temperatures at observation time twice a day. Separate records will occur for both observation times.
Resource Title: GeoData catalog record.
File Name: Web Page, url: https://geodata.nal.usda.gov/geonetwork/srv/eng/catalog.search#/metadata/SGP97NESOBsoiltemp_jjm_2015-05-04_1032
The Southern Great Plains 1997 (SGP97) Hydrology Experiment originated from an interdisciplinary investigation, \"Soil Moisture Mapping at Satellite Temporal and Spatial Scales\" (PI: Thomas J. Jackson, USDA Agricultural Research Service, Beltsville, MD) selected under the NASA Research Announcement 95-MTPE-03. The Fifteen Minute Precipitation Composite is one of several precipitation datasets provided in the Global Energy and Water Cycle Experiment (GEWEX) Continental-Scale International Project (GCIP) Near-Surface Observation Data Set (NESOB) 1997. This precipitation composite was formed from two data sources (National Climatic Data Center (NCDC) Fifteen Minute Precipitation data (TD 3260), and fifteen minute precipitation extracted from the Department Of Energy (DOE) Atmospheric Radiation Measurement Surface (ARMSFC) five minute surface data). Data from these sources were quality controlled and merged to form this precipitation composite. This composite contains data for the NESOB 1997 domain and time period (01 April 1997 through 31 March 1998). The NESOB 1997 domain is approximately 94.5W to 100.5 W longitude and 34N to 39 N latitude. Each 15-minute precipitation incremental value in this dataset was formed by summing the 5-minute precipitation values extracted from the Department Of Energy (DOE) Atmospheric Radiation Measurement Surface (ARMSFC) five minute surface data. The NESOB 1997 Fifteen Minute Precipitation Composite contains seven metadata parameters and three data parameters. The metadata parameters describe the date/time, network, station and location at which the data were collected. The three data parameters repeat once for each fifteen minutes from UTC 0000 through UTC hour 2345. Data reported for a designated 15-minute observation represents data collected during the previous 15-minutes. All times are reported in UTC, and precipitation data values are reported in millimeters.
Resource Title: GeoData catalog record.
File Name: Web Page, url: https://geodata.nal.usda.gov/geonetwork/srv/eng/catalog.search#/metadata/SGP97NESOB15minprecip_jjm_2015-05-04_1334
The Southern Great Plains 1997 (SGP97) Hydrology Experiment originated from an interdisciplinary investigation, \"Soil Moisture Mapping at Satellite Temporal and Spatial Scales\" (PI: Thomas J. Jackson, USDA Agricultural Research Service, Beltsville, MD) selected under the NASA Research Announcement 95-MTPE-03. The GEWEX Continental-Scale International Project (GCIP) Near-Surface Observation Data Set (NESOB) 1997 ARM 5 Minute Surface Composite is composed of data from the Department Of Energy (DOE) Atmospheric Radiation Measurement Surface (ARMSFC) Network within the NESOB 1997 domain. This Surface Composite contains data for the NESOB 1997 time period (01 April 1997 through 31 March 1998) and for the NESOB 1997 area which is approximately 34N to 39N latitude and 94.5W to 100.5W longitude. The DOE ARM Surface (ARMSFC) 5-minute values were derived from ARMSFC 1-minute data. The ARMSFC instrument readouts were every second for all variables except 1 minute for barometric pressure. The detailed descriptions of the algorithms used to produce ARMSFC one minute data are not currently available. When not present in the raw data, the dewpoint is computed using the formula from Bolton (1980). Calculated Sea Level pressure is computed from station pressure, temperature, dewpoint, and station elevation using the formula of Wallace and Hobbs (1977). Specific Humidity values were computed from dew point and station pressure using formulas from Wexler and Wildhack (1963). The NESOB 1997 ARM 5-Minute Surface Composite contains ten metadata parameters and 41 data parameters and flags. The metadata parameters describe the station location and time at which the data were collected. The time of observation is reported both in Universal Time Coordinated (UTC) Nominal and UTC actual time. Days begin at UTC hour 0000 and end at UTC hour 2355. The data parameters are valid for the reported times. Missing values are reported as 9's in the data field.
Resource Title: GeoData catalog record.
File Name: Web Page, url: https://geodata.nal.usda.gov/geonetwork/srv/eng/catalog.search#/metadata/SGP97NESOB5minMeteor_jjm_2015-05-07_0916
The Southern Great Plains 1997 (SGP97) Hydrology Experiment originated from an interdisciplinary investigation, \"Soil Moisture Mapping at Satellite Temporal and Spatial Scales\" (PI: Thomas J. Jackson, USDA Agricultural Research Service, Beltsville, MD) selected under the NASA Research Announcement 95-MTPE-03. The ARM Cloud and Radiation Testbed (CART) cloud height dataset is one of several datasets provided for the GEWEX Continental-Scale International Project (GCIP) Near-Surface Observing Period (NESOB) 1997 project. This dataset contains cloud height data collected using the ARMCART SGP Belfort Laser Ceilometer (BLC) Model 7013C and the ARMCART SGP MicroPulse Lidar (MPL) located at station E13: Lamont Central Facility 1 (CF1). This dataset contains data from these two instruments located within the NESOB 1997 domain (94.5 W to 100.5 W longitude and 34 N to 39 N latitude) for the NESOB 1997 time period (01 April 1997 through 31 March 1998). The data in this dataset were formed by extracting 30 minute cloud height data from 60 second BLC data in netCDF format. A zero for the first cloud layer signifies no clouds detected within the limit of the instrument field of view and range. A cloud ht of zero for the second and third cloud layers indicates an unknown cloud height (i.e. the ceiliometer can't see through lower clouds). These zeros are reported as \"0.00000 U\" in the data. The ARMCART Belfort Laser Ceilometer data contains eight metadata parameters and eight data parameters and flags. The metadata parameters describe the date, network, station and location at which the data were collected. Data values are collected at the time of observation. All times are UTC.
Resource Title: GeoData catalog record.
File Name: Web Page, url: https://geodata.nal.usda.gov/geonetwork/srv/eng/catalog.search#/metadata/SGP97NESOBblc_mpl_jjm_2015-05-07_0946
The Southern Great Plains 1997 (SGP97) Hydrology Experiment originated from an interdisciplinary investigation, \"Soil Moisture Mapping at Satellite Temporal and Spatial Scales\" (PI: Thomas J. Jackson, USDA Agricultural Research Service, Beltsville, MD) selected under the NASA Research Announcement 95-MTPE-03. The NESOB 1997 Daily Precipitation Composite is one of several precipitation datasets provided in the Global Energy and Water Cycle Experiment (GEWEX) Continental-Scale International Project (GCIP) Near-Surface Observation Data Set (NESOB) 1997. This precipitation composite is composed of data from several sources (i.e., National Weather Service (NWS) Cooperative Observers, National Centers for Environmental Prediction (NCEP), and the daily precipitation data extracted from the NESOB 1997 Hourly Precipitation Composite). Data from these sources were quality controlled and merged to form this precipitation composite. After the datasets were merged to form the NESOB 1997 Daily Precipitation Composite, a statistics program was executed to ensure that the quality of the individual datasets had been retained. This composite contains data for the NESOB 1997 domain (approximately 94.5 W to 100.5 W longitude and 34 N to 39 N latitude) and time period (01 April 1997 through 31 March 1998). The NCEP Daily Precipitation dataset was formed by extracting incremental precipitation values. The value reported for any daily observation represents data collected during the previous 24 hours. The Daily Precipitation Composite contains six metadata parameters and four data parameters. The metadata parameters describe the station location and time at which the data were collected. The four data parameters repeat once for each day in the monthly record. Every record has 31 days reported, regardless of the actual number of days in the month. For months with less than 31 days, the extra days are reported as missing (i.e., '-999.99 7 M'). Each 24 hour precipitation value has an associated observation hour. The observation hour is the ending UTC hour for the 24 hour period for which the precipitation value is valid.
Resource Title: GeoData catalog record.
File Name: Web Page, url: https://geodata.nal.usda.gov/geonetwork/srv/eng/catalog.search#/metadata/SGP97NESOBdailyPrecipComp_jjm_2015-05-07_1041
The Southern Great Plains 1997 (SGP97) Hydrology Experiment originated from an interdisciplinary investigation, \"Soil Moisture Mapping at Satellite Temporal and Spatial Scales\" (PI: Thomas J. Jackson, USDA Agricultural Research Service, Beltsville, MD) selected under the NASA Research Announcement 95-MTPE-03. The NESOB 1997 Daily Precipitation Composite is one of several precipitation datasets provided in the Global Energy and Water Cycle Experiment (GEWEX) Continental-Scale International Project (GCIP) Near-Surface Observation Data Set (NESOB) 1997. This precipitation composite is composed of data from several sources (i.e., National Weather Service (NWS) Cooperative Observers, National Centers for Environmental Prediction (NCEP), and the daily precipitation data extracted from the NESOB 1997 Hourly Precipitation Composite). Data from these sources were quality controlled and merged to form this precipitation composite. After the datasets were merged to form the NESOB 1997 Daily Precipitation Composite, a statistics program was executed to ensure that the quality of the individual datasets had been retained. This composite contains data for the NESOB 1997 domain (approximately 94.5 W to 100.5 W longitude and 34 N to 39 N latitude) and time period (01 April 1997 through 31 March 1998). The NCEP Daily Precipitation dataset was formed by extracting incremental precipitation values. The value reported for any daily observation represents data collected during the previous 24 hours. The Daily Precipitation Composite contains six metadata parameters and four data parameters. The metadata parameters describe the station location and time at which the data were collected. The four data parameters repeat once for each day in the monthly record. Every record has 31 days reported, regardless of the actual number of days in the month. For months with less than 31 days, the extra days are reported as missing (i.e., '-999.99 7 M'). Each 24 hour precipitation value has an associated observation hour. The observation hour is the ending UTC hour for the 24 hour period for which the precipitation value is valid.
Resource Title: GeoData catalog record.
File Name: Web Page, url: https://geodata.nal.usda.gov/geonetwork/srv/eng/catalog.search#/metadata/SGP97NESOBhourlyPrecipComp_jjm_2015-05-07_1212
The Southern Great Plains 1997 (SGP97) Hydrology Experiment originated from an interdisciplinary investigation, \"Soil Moisture Mapping at Satellite Temporal and Spatial Scales\" (PI: Thomas J. Jackson, USDA Agricultural Research Service, Beltsville, MD) selected under the NASA Research Announcement 95-MTPE-03. The region selected for investigation is the best instrumented site for surface soil moisture, hydrology and meteorology in the world. This includes the USDA/ARS Little Washita Watershed, the USDA/ARS facility at El Reno, Oklahoma, the ARM/CART central facility, as well as the Oklahoma Mesonet. The temporal coverage for this dataset is as follows: Begin datetime: 1997-06-01 00:00:00, End datetime: 1997-07-31 23:59:59. Using the volume extracted and the dry weight of the soil extracted, the bulk density was computed; the results obtained from sampling the soil surface layer (0-5 cm) bulk density are provided, and files are all ASCII text. This data set was developed by the EOS IDS Team at Penn State for the Southern Great Plains 1997 (SGP-97) project. The following data coverages are available: DEM, Landcover and Landuse, Gauge Stations, Available Water Capacity, Bulk Density, Depth to Bedrock, Hydrologic Soils Group, Mapunits, Percent Water, Porosity, Rock Fragment Class, Rock Volume, Soil Fractions, and Surface Soil Texture. Note that the data presented in the tables have had the tare weights removed.
Resource Title: GeoData catalog record.
File Name: Web Page, url: https://geodata.nal.usda.gov/geonetwork/srv/eng/catalog.search#/metadata/SGP97PSUbulk_jjm_2015-05-01_1158
The Southern Great Plains 1997 (SGP97) Hydrology Experiment originated from an interdisciplinary investigation, \"Soil Moisture Mapping at Satellite Temporal and Spatial Scales\" (PI: Thomas J. Jackson, USDA Agricultural Research Service, Beltsville, MD) selected under the NASA Research Announcement 95-MTPE-03. The region selected for investigation is the best instrumented site for surface soil moisture, hydrology and meteorology in the world. This includes the USDA/ARS Little Washita Watershed, the USDA/ARS facility at El Reno, Oklahoma, the ARM/CART central facility, as well as the Oklahoma Mesonet. The temporal coverage for this dataset is as follows: Begin datetime: 1997-06-01 00:00:00, End datetime: 1997-07-31 23:59:59. This data set was developed by the EOS IDS Team at Penn State for the Southern Great Plains 1997 (SGP-97) project. The following data coverages are available: DEM, Landcover and Landuse, Gauge Stations, Available Water Capacity, Bulk Density, Depth to Bedrock, Hydrologic Soils Group, Mapunits, Percent Water, Porosity, Rock Fragment Class, Rock Volume, Soil Fractions, and Surface Soil Texture. Note that the data presented in the tables have had the tare weights removed.
Resource Title: GeoData catalog record.
File Name: Web Page, url: https://geodata.nal.usda.gov/geonetwork/srv/eng/catalog.search#/metadata/SGP97PSUhydraulic_jjm_2015-05-01_1301
The Southern Great Plains 1997 (SGP97) Hydrology Experiment originated from an interdisciplinary investigation, \"Soil Moisture Mapping at Satellite Temporal and Spatial Scales\" (PI: Thomas J. Jackson, USDA Agricultural Research Service, Beltsville, MD) selected under the NASA Research Announcement 95-MTPE-03. The region selected for investigation is the best instrumented site for surface soil moisture, hydrology and meteorology in the world. This includes the USDA/ARS Little Washita Watershed, the USDA/ARS facility at El Reno, Oklahoma, the ARM/CART central facility, as well as the Oklahoma Mesonet. The temporal coverage for this dataset is as follows: Begin datetime: 1997-06-01 00:00:00, End datetime: 1997-07-31 23:59:59. This data set was developed by the EOS IDS Team at Penn State for the Southern Great Plains 1997 (SGP-97) project. The following data coverages are available: DEM, Landcover and Landuse, Gauge Stations, Available Water Capacity, Bulk Density, Depth to Bedrock, Hydrologic Soils Group, Mapunits, Percent Water, Porosity, Rock Fragment Class, Rock Volume, Soil Fractions, and Surface Soil Texture. Note that the data presented in the tables have had the tare weights removed.
Resource Title: GeoData catalog record.
File Name: Web Page, url: https://geodata.nal.usda.gov/geonetwork/srv/eng/catalog.search#/metadata/SGP97PSUroughness_jjm_2015-05-01_1330
The Southern Great Plains 1997 (SGP97) Hydrology Experiment originated from an interdisciplinary investigation, \"Soil Moisture Mapping at Satellite Temporal and Spatial Scales\" (PI: Thomas J. Jackson, USDA Agricultural Research Service, Beltsville, MD) selected under the NASA Research Announcement 95-MTPE-03. The temporal coverage for this dataset is as follows: Begin datetime: 1997-06-01 00:00:00, End datetime: 1997-07-31 23:59:59. The Department of Energy (DOE) Atmospheric Radiation Measurement (ARM) program operates a Baseline Surface Radiation Network (BSRN) station at the Central Facility (located near Lamont, in north-central Oklahoma) of its Southern Great Plains site. BSRN provides 1-min observations of direct-beam normal solar irradiance, downwelling hemispheric diffuse solar irradiance, downwelling hemispheric solar irradiance and downwelling hemispheric infrared irradiance.
Resource Title: GeoData catalog record.
File Name: Web Page, url: https://geodata.nal.usda.gov/geonetwork/srv/eng/catalog.search#/metadata/SGP97armRadiation_JJM_2015-04-24_1356
The Southern Great Plains 1997 (SGP97) Hydrology Experiment originated from an interdisciplinary investigation, \"Soil Moisture Mapping at Satellite Temporal and Spatial Scales\" (PI: Thomas J. Jackson, USDA Agricultural Research Service, Beltsville, MD) selected under the NASA Research Announcement 95-MTPE-03. The temporal coverage for this dataset is as follows: Begin datetime: 1997-06-01 00:00:00, End datetime: 1997-07-31 23:59:59. The Department of Energy (DOE) Atmospheric Radiation Measurement (ARM) program operates a network of 12 Energy Balance Bowen Ration (EBBR) stations at its Southern Great Plains site. EBBR provides 30-min observations of latent and sensible heat flux along with net radiation, atmospheric pressure, bowen ratio, wind speed and direction, and the following parameters at five locations surrounding the sites: soil moisture, soil temperature, soil heat flow, soil heat capacity and soil heat flow at the surface. The Energy Balance Bowen Ratio (EBBR) system is a ground-based system using in situ sensors to estimate the vertical fluxes of sensible and latent heat at the local surface. EBBR systems will be installed at up to 15 grassland locations within the SGP CART Site. Flux estimates are made from observations of net radiation, soil heat flow, and the vertical gradients of temperature and relative humidity; these data are used in the Bowen ratio energy balance technique.
Resource Title: GeoData catalog record.
File Name: Web Page, url: https://geodata.nal.usda.gov/geonetwork/srv/eng/catalog.search#/metadata/SGP97armEBBR_JJM_2015-04-24_1531
The Southern Great Plains 1997 (SGP97) Hydrology Experiment originated from an interdisciplinary investigation, \"Soil Moisture Mapping at Satellite Temporal and Spatial Scales\" (PI: Thomas J. Jackson, USDA Agricultural Research Service, Beltsville, MD) selected under the NASA Research Announcement 95-MTPE-03. The region selected for investigation is the best instrumented site for surface soil moisture, hydrology and meteorology in the world. This includes the USDA/ARS Little Washita Watershed, the USDA/ARS facility at El Reno, Oklahoma, the ARM/CART central facility, as well as the Oklahoma Mesonet. The High Plains Climate Network (HPCN) dataset is one of various datasets provided for the Southern Great Plains 1997 (SGP97) project. This dataset contains HPCN data from 15 stations in the SGP97 domain. This dataset covers the complete SGP97 time period (18 June 1997 through 18 July 1997) and for the SGP97 domain. The SGP97 domain is approximately 97W to 99W longitude and 34.5N to 37N latitude. The HPCN dataset contains different parameters depending upon the reporting station. Each station provides Station Name, State, and Identification Number preceding that station's data within the dataset. Each parameter column has a self explanatory title indicating the data available for that station and parameter units.
Resource Title: GeoData catalog record.
File Name: Web Page, url: https://geodata.nal.usda.gov/geonetwork/srv/eng/catalog.search#/metadata/SGP97HPCN_jjm_2015-05-04_0903
The Southern Great Plains 1997 (SGP97) Hydrology Experiment originated from an interdisciplinary investigation, \"Soil Moisture Mapping at Satellite Temporal and Spatial Scales\" (PI: Thomas J. Jackson, USDA Agricultural Research Service, Beltsville, MD) selected under the NASA Research Announcement 95-MTPE-03. The region selected for investigation is the best instrumented site for surface soil moisture, hydrology and meteorology in the world. This includes the USDA/ARS Little Washita Watershed, the USDA/ARS facility at El Reno, Oklahoma, the ARM/CART central facility, as well as the Oklahoma Mesonet. The National Climatic Data Center (NCDC) Summary of the Day Co-operative Dataset is one of several surface datasets provided for the Southern Great Plains (SGP) 1997 project. This NCDC Co-operative Observer (COOP) dataset contains data from sixty-two stations for the SGP 1997 time period (18 June 1997 through 18 July 1997) and in the SGP 1997 domain (approximately 97W to 99W longitude and 34.5N to 37N latitude). The primary thrust of the cooperative observing program is the recording of 24-hour precipitation amounts, but approximately 55% of the stations also record maximum and minimum temperatures. The observations are for the 24-hour period ending at the time of observation. Observer convenience or special program needs mean that observing times vary from station to station. However, the vast majority of observations are taken near either 7:00 AM or 7:00 PM local time. The NCDC Summary of the Day Co-operative Dataset (TD-3200) contains eight metadata parameters and fifteen data parameters and flags. The metadata parameters describe the date/time, network, station and location at which the data were collected. All times are UTC. Data values are valid for the 24 hours preceding the time of observation.
Resource Title: GeoData catalog record.
File Name: Web Page, url: https://geodata.nal.usda.gov/geonetwork/srv/eng/catalog.search#/metadata/SGP97COOP_jjm_2015-05-04_0918
The Southern Great Plains 1997 (SGP97) Hydrology Experiment originated from an interdisciplinary investigation, \"Soil Moisture Mapping at Satellite Temporal and Spatial Scales\" (PI: Thomas J. Jackson, USDA Agricultural Research Service, Beltsville, MD) selected under the NASA Research Announcement 95-MTPE-03. The region selected for investigation is the best instrumented site for surface soil moisture, hydrology and meteorology in the world. This includes the USDA/ARS Little Washita Watershed, the USDA/ARS facility at El Reno, Oklahoma, the ARM/CART central facility, as well as the Oklahoma Mesonet. The National Climatic Data Center (NCDC) Summary of the Day Co-operative Precipitation Dataset is one of several surface precipitation datasets provided in the Global Energy and Water Cycle Experiment (GEWEX) Continental-Scale International Project (GCIP) by UCAR/JOSS. The primary thrust of the cooperative observing program is the recording of 24-hour precipitation amounts. The observations are for the 24-hour period ending at the time of observation. Observer convenience or special program needs mean that observing times vary from station to station. However, the vast majority of observations are taken near either 7:00 AM or 7:00 PM local time. The National Weather Service (NWS) Cooperative Observer Daily Precipitation dataset was formed by extracting the daily incremental precipitation values provided in the National Climatic Data Center (NCDC) TD 3200 dataset. The Daily Precipitation data set contains six metadata parameters and four data parameters. The metadata parameters describe the station location and time at which the data were collected. The four data parameters repeat once for each day in the monthly record. Every record has 31 days reported, regardless of the actual number of days in the month. For months with less than 31 days, the extra days are reported as missing (i.e., '-999.99 7 M'). Each 24 hour precipitation value has an associated observation hour. The observation hour is the ending UTC hour for the 24 hour period for which the precipitation value is valid.
Resource Title: GeoData catalog record.
File Name: Web Page, url: https://geodata.nal.usda.gov/geonetwork/srv/eng/catalog.search#/metadata/SGP97COOPprecipitation_jjm_2015-05-04_0933
The Southern Great Plains 1997 (SGP97) Hydrology Experiment originated from an interdisciplinary investigation, \"Soil Moisture Mapping at Satellite Temporal and Spatial Scales\" (PI: Thomas J. Jackson, USDA Agricultural Research Service, Beltsville, MD) selected under the NASA Research Announcement 95-MTPE-03. The temporal coverage for this dataset is as follows: Begin datetime: 1997-05-31 00:00:00, End datetime: 1997-08-09 23:59:59. NOAA/ATDD (Tilden Meyers) started operation of a long term flux monitoring site near the Little Washita watershed in Oklahoma in 1996. Half-hourly observations of wind speed and direction, air temperature, relative humidity, pressure, incoming global radiation, incoming and outgoing visible radiation, net radiation, ground heat flux, precipitation, wetness, skin temperature, soil temperature (at 2, 4, 8, 16, 32 and 64 cm), average wind vector speed, kinematic shear stress, streamwise velocity variance, crosswind velocity variance, vertical velocity variance, sensible heat flux, latent energy flux, CO2 flux and soil moisture at 20 cm (started 5 June 1997).
Resource Title: GeoData catalog record.
File Name: Web Page, url: https://geodata.nal.usda.gov/geonetwork/srv/eng/catalog.search#/metadata/SGP97NOAAflux_JJM_2015-04-27_0942
The Department of Energy (DOE) Atmospheric Radiation Measurement (ARM) Southern Great Plains (SGP) 50 MHz Radar Wind Profiler and Radio Acoustic Sounding System (RASS) Vertical Profiles is one of various data sets provided for the Southern Great Plains 1997 (SGP97) project. This data set contains vertical profiles of virtual temperature and wind speed and direction every hour taken at the Central Facility. This data set covers the period from 1 June through 31 July 1997. The SGP97 domain is approximately 97W to 99W longitude and 34.5N to 37N latitude. These data are in their original NetCDF format. The 50-MHz Radar Wind Profiler/RASS (RWP50) measures wind profiles from (nominally) 2 to 12 km and virtual temperature profiles from 2 to 4 km. It operates by transmitting electromagnetic energy into the atmosphere and measuring the strength and frequency of backscattered energy. Virtual temperatures are recovered by transmitting an acoustic signal vertically and measuring the electromagnetic energy scattered from the acoustic wavefront. The propagation speed of the acoustic wave is proportional to the square root of the virtual temperature. The primary quantities measured with the system are the intensity and Doppler frequency of backscattered radiation. The wind speed is determined from the Doppler frequency of energy scattered from refractive index fluctuations (caused primarily by temperature fluctuations) embedded within the atmosphere; the virtual temperature is determined from the Doppler frequency of microwave energy scattered from acoustic energy propagating through the atmosphere. No additional quality control was performed by the University Corporation for Atmospheric Research/Joint Office for Science Support (JOSS).
Resource Title: GeoData catalog record.
File Name: Web Page, url: https://geodata.nal.usda.gov/geonetwork/srv/eng/catalog.search#/metadata/8a80ab85-3f5b-4a36-8e46-747452fd5929
The Department of Energy (DOE) Atmospheric Radiation Measurement (ARM) Southern Great Plains (SGP) 50 MHz Radar Wind Profiler and Radio Acoustic Sounding System (RASS) Vertical Profiles is one of various data sets provided for the Southern Great Plains 1997 (SGP97) project. This data set contains vertical profiles of virtual temperature and wind speed and direction every hour taken at the Central Facility. This data set covers the period from 1 June through 31 July 1997. The SGP97 domain is approximately 97W to 99W longitude and 34.5N to 37N latitude. These data are in their original NetCDF format. The 50-MHz Radar Wind Profiler/RASS (RWP50) measures wind profiles from (nominally) 2 to 12 km and virtual temperature profiles from 2 to 4 km. It operates by transmitting electromagnetic energy into the atmosphere and measuring the strength and frequency of backscattered energy. Virtual temperatures are recovered by transmitting an acoustic signal vertically and measuring the electromagnetic energy scattered from the acoustic wavefront. The propagation speed of the acoustic wave is proportional to the square root of the virtual temperature. The primary quantities measured with the system are the intensity and Doppler frequency of backscattered radiation. The wind speed is determined from the Doppler frequency of energy scattered from refractive index fluctuations (caused primarily by temperature fluctuations) embedded within the atmosphere; the virtual temperature is determined from the Doppler frequency of microwave energy scattered from acoustic energy propagating through the atmosphere. No additional quality control was performed by the University Corporation for Atmospheric Research/Joint Office for Science Support (JOSS).
Resource Title: GeoData catalog record.
File Name: Web Page, url: https://geodata.nal.usda.gov/geonetwork/srv/eng/catalog.search#/metadata/58f943c4-6d18-427b-a049-c142d118027c
The Department of Energy (DOE) Atmospheric Radiation Measurement (ARM) Southern Great Plains (SGP) 915 MHz Radar Wind Profiler and RASS Data Set is one of the various boundary layer data sets developed for the SGP97 project. This data set contains hourly average profiles of wind speed and direction, u and v wind components (from the Radar Wind Profiler), and virtual temperature (from the RASS [Radio Acoustic Sounding System]). The wind profiles have a vertical resolution of ~60 meters (m) in the low mode and ~200 m in the high mode. The RASS has a vertical resolution of ~100 m. The site is located at the DOE ARM SGP Central Facility near Lamont, Oklahoma. The SGP97 domain is approximately 97W to 99W longitude and 34.5N to 37N latitude. The radar wind profiler/RASS (RWP) measures wind profiles from (nominally) .1 km to 5 km and virtual temperature profiles from .1 km to 1.5 km. It operates by transmitting electromagnetic energy into the atmosphere and measuring the strength and frequency of backscattered energy. Virtual temperatures are recovered by transmitting an acoustic signal vertically and measuring the electromagnetic energy scattered from the acoustic wavefront. The propagation speed of the acoustic wave is proportional to the square root of the virtual temperature. The primary quantities measured with the system are the intensity and Doppler frequency of backscattered radiation. The wind speed is determined from the Doppler frequency of energy scattered from refractive index fluctuations (caused primarily by moisture fluctuations but also by temperature fluctuations) embedded within the atmosphere; the virtual temperature is determined from the Doppler frequency of microwave energy scattered from acoustic energy propagating through the atmosphere. No flags are applied during data ingest of the consensus averaged winds and virtual temperatures. However, a parallel data stream with the \".b2\" name field has data flags applied that look at relative values of temps or wind components. Neighboring values in space (height) and time (sequential profiles) are compared with predefined limits (given in the metadata of the NETCDF file). In addition to the unchanged wind component and temperature fields, a field of flags (on or off [1 or 0]) is supplied to \"point\" at suspect values. These data are in their original NetCDF format. No additional quality control was performed by the University Corporation for Atmospheric Research/Joint Office for Science Support (UCAR/JOSS).
Resource Title: GeoData catalog record.
File Name: Web Page, url: https://geodata.nal.usda.gov/geonetwork/srv/eng/catalog.search#/metadata/79f2777d-7074-49f3-ab12-b01ce90e80ef
The Department of Energy (DOE) Atmospheric Radiation Measurement (ARM) Southern Great Plains (SGP) 915 MHz Radar Wind Profiler and RASS Data Set is one of the various boundary layer data sets developed for the SGP97 project. This data set contains hourly average profiles of wind speed and direction, u and v wind components (from the Radar Wind Profiler), and virtual temperature (from the RASS [Radio Acoustic Sounding System]). The wind profiles have a vertical resolution of ~60 meters (m) in the low mode and ~200 m in the high mode. The RASS has a vertical resolution of ~100 m. The site is located at the DOE ARM SGP Central Facility near Lamont, Oklahoma. The radar wind profiler/RASS (RWP) measures wind profiles from (nominally) .1 km to 5 km and virtual temperature profiles from .1 km to 1.5 km. It operates by transmitting electromagnetic energy into the atmosphere and measuring the strength and frequency of backscattered energy. Virtual temperatures are recovered by transmitting an acoustic signal vertically and measuring the electromagnetic energy scattered from the acoustic wavefront. The propagation speed of the acoustic wave is proportional to the square root of the virtual temperature. The Primary quantities measured with the system are the intensity and Doppler frequency of backscattered radiation. The wind speed is determined from the Doppler frequency of energy scattered from refractive index fluctuations (caused primarily by moisture fluctuations but also by temperature fluctuations) embedded within the atmosphere; the virtual temperature is determined from the Doppler frequency of microwave energy scattered from acoustic energy propagating through the atmosphere. The 915 MHz radar wind profiler is manufactured by Radian Corp. It consists of a single-phased microstrip antenna array consisting of nine \"panels\" (most system have only four panels). The antenna is approximately 4 m square and is oriented in a horizontal plane so the \"in-phase\" beam travels vertically. Other components in the system include four stationary acoustic sources located at the corners of the antenna, a mobile acoustic source, a receiver, an interface module, and a computer for data analysis and processing. No flags are applied during data ingest of the consensus averaged winds and virtual temperatures. However, a parallel data stream with the \".b2\" name field has data flags applied that look at relative values of temps or wind components. Neighboring values in space (height) and time (sequential profiles) are compared with predefined limits (given in the metadata of the NETCDF file). In addition to the unchanged wind component and temperature fields, a field of flags (on or off [1 or 0]) is supplied to \"point\" at suspect values. These data are in their original NetCDF format. No additional quality control was performed by the University Corporation for Atmospheric Research/Joint Office for Science Support (UCAR/JOSS).
Resource Title: GeoData catalog record.
File Name: Web Page, url: https://geodata.nal.usda.gov/geonetwork/srv/eng/catalog.search#/metadata/e15ad525-a70f-47b0-982e-53eaf2e6ab8a
This data package was produced by researchers working on the Shortgrass Steppe Long Term Ecological Research (SGS-LTER) Project, administered at Colorado State University. Long-term datasets and background information (proposals, reports, photographs, etc.) on the SGS-LTER project are contained in a comprehensive project collection within the Digital Collections of Colorado (http://digitool.library.colostate.edu/R/?func=collections&collection_id=3429). The data table and associated metadata document, which is generated in Ecological Metadata Language, may be available through other repositories serving the ecological research community and represent components of the larger SGS-LTER project collection.\nMost investigators studying grasslands have assumed that the low standing biomass of the SGS created a system with a low probability of carrying fire, and thus a minimal historical role of fire. Nonetheless, there are years with aboveground biomass equivalent to the mixed grass prairie, and a high frequency of lightening storms. Regardless of the historical role of fire in SGS, there are new questions regarding its utility in managing for the presence of the threatened mountain plover, which only nests in areas of low plant biomass. United States Forest Service, Pawnee National Grassland recently initiated a burning program in the mid 1990s to address questions about using fire to increase plover habitat; we have collected data on some of these plots to investigate the influence of fire on SGS vegetation. Several datasets were created between 1999 and 2004 by SGS-LTER researchers, including measurements of shrub and cactus mortality rates, aboveground net primary production, amounts of litter and standing dead, and aboveground nitrogen dynamics in burned and control plots in the western section of the Pawnee National Grassland. Additional information and referenced materials can be found: http://hdl.handle.net/10217/83326.
Resource Title: Website Pointer to html file.
File Name: Web Page, url: https://portal.edirepository.org/nis/mapbrowse?scope=knb-lter-sgs&identifier=127
Webpage with information and links to data files for download
This data package was produced by researchers working on the Shortgrass Steppe Long Term Ecological Research (SGS-LTER) Project, administered at Colorado State University. Long-term datasets and background information (proposals, reports, photographs, etc.) on the SGS-LTER project are contained in a comprehensive project collection within the Digital Collections of Colorado. The data table and associated metadata document, which is in Ecological Metadata Language, may be available through other repositories serving the ecological research community and represent components of the larger SGS-LTER project collection.\nThe Breeding Bird Survey is a large-scale survey of North American birds. It is a roadside survey, primarily covering the continental United States and southern Canada, although survey routes have recently been initiated in Alaska and northern Mexico. The BBS was started in 1966, and the over 3,500 routes are surveyed in June by experienced birders. Routes 305, Nunn and 901, Rockport are located in the area of the SGS research site. The primary objective of the BBS has been the estimation of population change for songbirds. However, the data have many potential uses, and investigators have used the data to address a variety of research and management objectives. In the USGS-BBS Home Page, reults from the BBS are summarized, and pictures of birds and other species information. Data from 1966 - 2002 were managed by the SGS-LTER project. Additional information and referenced materials can be found: http://hdl.handle.net/10217/82150.
Resource Title: Website Pointer to html file.
File Name: Web Page, url: https://portal.edirepository.org/nis/mapbrowse?scope=knb-lter-sgs&identifier=107
Webpage with information and links to data files for download
This data package was produced by researchers working on the Shortgrass Steppe Long Term Ecological Research (SGS-LTER) Project, administered at Colorado State University. Long-term datasets and background information (proposals, reports, photographs, etc.) on the SGS-LTER project are contained in a comprehensive project collection within the Digital Collections of Colorado (http://digitool.library.colostate.edu/R/?func=collections&collection_id=3429). The data table and associated metadata document, which is generated in Ecological Metadata Language, may be available through other repositories serving the ecological research community and represent components of the larger SGS-LTER project collection.\nSix sites approximately 6 km apart were selected at the Central Plains Experimental Range in 1997. Within each site, there was a pair of adjacent ungrazed and moderately summer grazed (40-60% removal of annual aboveground production by cattle) locations. Grazed locations had been grazed from 1939 to present and ungrazed locations had been protected from 1991 to present by the establishment of exclosures. Within grazed and ungrazed locations, all tillers and root crowns of B. gracilis were removed from two treatment plots (3 m x 3 m) with all other vegetation undisturbed. Two control plots were established adjacent to the treatment plots. Plant density was measured annually by species in a fixed 1m x 1m quadrat in the center of treatment and control plots. For clonal species, an individual plant was defined as a group of tillers connected by a crown Coffin & Lauenroth 1988, Fair et al. 1999). Seedlings were counted as separate individuals. In the same quadrat, basal cover by species, bare soil, and litter were estimated annually using a point frame. A total of 40 points were read from four locations halfway between the center point and corners of the 1m x 1m quadrat. Density was measured from 1998 to 2005 and cover from 1997 to 2006. All measurements were taken in late June/early July.
Resource Title: Website Pointer to html file.
File Name: Web Page, url: https://portal.edirepository.org/nis/mapbrowse?scope=knb-lter-sgs&identifier=702
Webpage with information and links to data files for download
This data package was produced by researchers working on the Shortgrass Steppe Long Term Ecological Research (SGS-LTER) Project, administered at Colorado State University. Long-term datasets and background information (proposals, reports, photographs, etc.) on the SGS-LTER project are contained in a comprehensive project collection within the Digital Collections of Colorado (http://digitool.library.colostate.edu/R/?func=collections&collection_id=3429). The data table and associated metadata document, which is generated in Ecological Metadata Language, may be available through other repositories serving the ecological research community and represent components of the larger SGS-LTER project collection.\nSix sites approximately 6 km apart were selected at the Central Plains Experimental Range in 1997. Within each site, there was a pair of adjacent ungrazed and moderately summer grazed (40-60% removal of annual aboveground production by cattle) locations. Grazed locations had been grazed from 1939 to present and ungrazed locations had been protected from 1991 to present by the establishment of exclosures. Within grazed and ungrazed locations, all tillers and root crowns of B. gracilis were removed from two treatment plots (3 m x 3 m) with all other vegetation undisturbed. Two control plots were established adjacent to the treatment plots. Plant density was measured annually by species in a fixed 1m x 1m quadrat in the center of treatment and control plots. For clonal species, an individual plant was defined as a group of tillers connected by a crown (Coffin and Lauenroth 1988, Fair et al. 1999). Seedlings were counted as separate individuals. In the same quadrat, basal cover by species, bare soil, and litter were estimated annually using a point frame. A total of 40 points were read from four locations halfway between the center point and corners of the 1m x 1m quadrat. Density was measured from 1998 to 2005 and cover from 1997 to 2006. All measurements were taken in late June/early July.
Resource Title: Website Pointer to html file.
File Name: Web Page, url: https://portal.edirepository.org/nis/mapbrowse?scope=knb-lter-sgs&identifier=703
Webpage with information and links to data files for download
This data package was produced by researchers working on the Shortgrass Steppe Long Term Ecological Research (SGS-LTER) Project, administered at Colorado State University. Long-term datasets and background information (proposals, reports, photographs, etc.) on the SGS-LTER project are contained in a comprehensive project collection within the Digital Collections of Colorado (http://digitool.library.colostate.edu/R/?func=collections&collection_id=3429). The data table and associated metadata document, which is generated in Ecological Metadata Language, may be available through other repositories serving the ecological research community and represent components of the larger SGS-LTER project collection. Additional information and referenced materials can be found: http://hdl.handle.net/10217/82454.\nAt the end of the Open Top Chamber study, surface soil was removed from each of the 9 plots, and placed in flats in a greenhouse; mist irrigated frequently, and germinated seedlings were identified by species, to get an idea of the available seed bank after 5 years. There was a great amount of variability; overall there was an increase in seeds in the chambered plots. This research was conducted at the Central Plains Experimental Range, near Nunn, CO; lat.40degrees 40 minutes N; long. 104 degrees 45 minutes W in the shortgrass steppe region of NE Colorado, USA and as a collaboration between SGS-LTER and USDA-ARS researchers.
Resource Title: Website Pointer to html file.
File Name: Web Page, url: https://portal.edirepository.org/nis/mapbrowse?scope=knb-lter-sgs&identifier=162
Webpage with information and links to data files for download
This data package was produced by researchers working on the Shortgrass Steppe Long Term Ecological Research (SGS-LTER) Project, administered at Colorado State University. Long-term datasets and background information (proposals, reports, photographs, etc.) on the SGS-LTER project are contained in a comprehensive project collection within the Digital Collections of Colorado (http://digitool.library.colostate.edu/R/?func=collections&collection_id=3429). The data table and associated metadata document, which is generated in Ecological Metadata Language, may be available through other repositories serving the ecological research community and represent components of the larger SGS-LTER project collection. Additional information and referenced materials can be found: http://hdl.handle.net/10217/82454.\nSingle leaf gas exchange (CO2 & H2O) was measured several times per season on important grass species in the shortgrass steppe open-top-chamber experiment. Cuvette CO2 levels were varied to investigate physiological adaptations to elevated CO2. C3 grass displayed photosynthetic acclimation, while C4 grass did not. Leaf water-use-efficiency was improved under ECO2. Absolute assimilation rates were more dependent on soil and plant water status than on CO2. This research was conducted at the Central Plains Experimental Range, near Nunn, CO; lat.40degrees 40 minutes N; long. 104 degrees 45 minutes W in the shortgrass steppe region of NE Colorado, USA and as a collaboration between SGS-LTER and USDA-ARS researchers.
Resource Title: Website Pointer to html file.
File Name: Web Page, url: https://portal.edirepository.org/nis/mapbrowse?scope=knb-lter-sgs&identifier=153
Webpage with information and links to data files for download
This data package was produced by researchers working on the Shortgrass Steppe Long Term Ecological Research (SGS-LTER) Project, administered at Colorado State University. Long-term datasets and background information (proposals, reports, photographs, etc.) on the SGS-LTER project are contained in a comprehensive project collection within the Digital Collections of Colorado (http://digitool.library.colostate.edu/R/?func=collections&collection_id=3429). The data table and associated metadata document, which is generated in Ecological Metadata Language, may be available through other repositories serving the ecological research community and represent components of the larger SGS-LTER project collection. Additional information and referenced materials can be found: http://hdl.handle.net/10217/82454.\nAbove-ground plant material was harvested, by species, in July (PSC) in five years from ambient and elevated CO2 Open-top-chambers, and unchambered controls. There was a small difference in species composition, in the plots, in 1996; prior to any CO2 treatment; this data should be used as a covariate in looking at subsequent years. There was a consistent increase in plant productivity in the elevated CO2 chambers, primarily in the C3 grass group.
Resource Title: Website Pointer to html file.
File Name: Web Page, url: https://portal.edirepository.org/nis/mapbrowse?scope=knb-lter-sgs&identifier=165
Webpage with information and links to data files for download
This data package was produced by researchers working on the Shortgrass Steppe Long Term Ecological Research (SGS-LTER) Project, administered at Colorado State University. Long-term datasets and background information (proposals, reports, photographs, etc.) on the SGS-LTER project are contained in a comprehensive project collection within the Digital Collections of Colorado (http://digitool.library.colostate.edu/R/?func=collections&collection_id=3429). The data table and associated metadata document, which is generated in Ecological Metadata Language, may be available through other repositories serving the ecological research community and represent components of the larger SGS-LTER project collection. Additional information and referenced materials can be found: http://hdl.handle.net/10217/82454.\nSingle leaf gas exchange (CO2 & H2O) was measured several times per season on important grass species in the shortgrass steppe open-top-chamber experiment. Cuvette light levels were varied to investigate physiological adaptations to elevated CO2. This research was conducted at the Central Plains Experimental Range, near Nunn, CO; lat.40degrees 40 minutes N; long. 104 degrees 45 minutes W in the shortgrass steppe region of NE Colorado, USA and as a collaboration between SGS-LTER and USDA-ARS researchers.
Resource Title: Website Pointer to html file.
File Name: Web Page, url: https://portal.edirepository.org/nis/mapbrowse?scope=knb-lter-sgs&identifier=159
Webpage with information and links to data files for download
This data package was produced by researchers working on the Shortgrass Steppe Long Term Ecological Research (SGS-LTER) Project, administered at Colorado State University. Long-term datasets and background information (proposals, reports, photographs, etc.) on the SGS-LTER project are contained in a comprehensive project collection within the Digital Collections of Colorado (http://digitool.library.colostate.edu/R/?func=collections&collection_id=3429). The data table and associated metadata document, which is generated in Ecological Metadata Language, may be available through other repositories serving the ecological research community and represent components of the larger SGS-LTER project collection. Additional information and referenced materials can be found: http://hdl.handle.net/10217/82454.\nSingle leaf gas exchange (CO2 & H2O) was measured several times per season on important grass species in the shortgrass steppe open-top-chamber experiment, to investigate physiological adaptations to elevated CO2. C3 grass displayed photosynthetic acclimation, while C4 grass did not. Leaf water-use-efficiency was improved under ECO2. Absolute assimilation rates were more dependent on soil and plant water status than on CO2. This research was conducted at the Central Plains Experimental Range, near Nunn, CO; lat.40degrees 40 minutes N; long. 104 degrees 45 minutes W in the shortgrass steppe region of NE Colorado, USA and as a collaboration between SGS-LTER and USDA-ARS researchers.
Resource Title: Website Pointer to html file.
File Name: Web Page, url: https://portal.edirepository.org/nis/mapbrowse?scope=knb-lter-sgs&identifier=157
Webpage with information and links to data files for download
This data package was produced by researchers working on the Shortgrass Steppe Long Term Ecological Research (SGS-LTER) Project, administered at Colorado State University. Long-term datasets and background information (proposals, reports, photographs, etc.) on the SGS-LTER project are contained in a comprehensive project collection within the Digital Collections of Colorado (http://digitool.library.colostate.edu/R/?func=collections&collection_id=3429). The data table and associated metadata document, which is generated in Ecological Metadata Language, may be available through other repositories serving the ecological research community and represent components of the larger SGS-LTER project collection. Additional information and referenced materials can be found: http://hdl.handle.net/10217/82454.\nCarbon isotopes of elevated and ambient OTC plants were measured for use in isotope labeling and plant water-use-efficiency measures. Leaf N and C are associated parameters were also measured. This research was conducted at the Central Plains Experimental Range, near Nunn, CO; lat.40degrees 40 minutes N; long. 104 degrees 45 minutes W in the shortgrass steppe region of NE Colorado, USA and as a collaboration between SGS-LTER and USDA-ARS researchers.
Resource Title: Website Pointer to html file.
File Name: Web Page, url: https://portal.edirepository.org/nis/mapbrowse?scope=knb-lter-sgs&identifier=155
Webpage with information and links to data files for download
This data package was produced by researchers working on the Shortgrass Steppe Long Term Ecological Research (SGS-LTER) Project, administered at Colorado State University. Long-term datasets and background information (proposals, reports, photographs, etc.) on the SGS-LTER project are contained in a comprehensive project collection within the Digital Collections of Colorado (http://digitool.library.colostate.edu/R/?func=collections&collection_id=3429). The data table and associated metadata document, which is generated in Ecological Metadata Language, may be available through other repositories serving the ecological research community and represent components of the larger SGS-LTER project collection. Additional information and referenced materials can be found: http://hdl.handle.net/10217/82454.\nLeaf water potential of the three major grass species in ambient, elevated open-top-chambers and unchambered controls, was measured nearly weekly, from 1997-2001 using a Scholander-type pressure chamber. Water potential was improved under elevated CO2, very consistently and in all species. This research was conducted at the Central Plains Experimental Range, near Nunn, CO; lat.40degrees 40 minutes N; long. 104 degrees 45 minutes W in the shortgrass steppe region of NE Colorado, USA and as a collaboration between SGS-LTER and USDA-ARS researchers.
Resource Title: Website Pointer to html file.
File Name: Web Page, url: https://portal.edirepository.org/nis/mapbrowse?scope=knb-lter-sgs&identifier=158
Webpage with information and links to data files for download
This data package was produced by researchers working on the Shortgrass Steppe Long Term Ecological Research (SGS-LTER) Project, administered at Colorado State University. Long-term datasets and background information (proposals, reports, photographs, etc.) on the SGS-LTER project are contained in a comprehensive project collection within the Digital Collections of Colorado (http://digitool.library.colostate.edu/R/?func=collections&collection_id=3429). The data table and associated metadata document, which is generated in Ecological Metadata Language, may be available through other repositories serving the ecological research community and represent components of the larger SGS-LTER project collection. Additional information and referenced materials can be found: http://hdl.handle.net/10217/82454.\nAbove-ground plant material was harvested in July (PSC) and Oct. in five years of CO2 enrichment in Open-top-chambers. There was a consistent increase in plant productivity in the elevated CO2 chambers.
Resource Title: Website Pointer to html file.
File Name: Web Page, url: https://portal.edirepository.org/nis/mapbrowse?scope=knb-lter-sgs&identifier=154
Webpage with information and links to data files for download
This data package was produced by researchers working on the Shortgrass Steppe Long Term Ecological Research (SGS-LTER) Project, administered at Colorado State University. Long-term datasets and background information (proposals, reports, photographs, etc.) on the SGS-LTER project are contained in a comprehensive project collection within the Digital Collections of Colorado (http://digitool.library.colostate.edu/R/?func=collections&collection_id=3429). The data table and associated metadata document, which is generated in Ecological Metadata Language, may be available through other repositories serving the ecological research community and represent components of the larger SGS-LTER project collection. Additional information and referenced materials can be found: http://hdl.handle.net/10217/82454.\nSoil cores, divided at 7 depths, from the shortgrass steppe Open Top Chamber experiment were analyzed for percent sand, silt and clay. It was found that soils were fairly consistent across treatments. This research was conducted at the Central Plains Experimental Range, near Nunn, CO; lat.40degrees 40 minutes N; long. 104 degrees 45 minutes W in the shortgrass steppe region of NE Colorado, USA and as a collaboration between SGS-LTER and USDA-ARS researchers.
Resource Title: Website Pointer to html file.
File Name: Web Page, url: https://portal.edirepository.org/nis/mapbrowse?scope=knb-lter-sgs&identifier=163
Webpage with information and links to data files for download
This data package was produced by researchers working on the Shortgrass Steppe Long Term Ecological Research (SGS-LTER) Project, administered at Colorado State University. Long-term datasets and background information (proposals, reports, photographs, etc.) on the SGS-LTER project are contained in a comprehensive project collection within the Digital Collections of Colorado (http://digitool.library.colostate.edu/R/?func=collections&collection_id=3429). The data table and associated metadata document, which is generated in Ecological Metadata Language, may be available through other repositories serving the ecological research community and represent components of the larger SGS-LTER project collection. Additional information and referenced materials can be found: http://hdl.handle.net/10217/82454.\nPlant samples from ambient and elevated CO2 open-top chambers, and unchambered controls, were collected for nitrogen, carbon and carbohydrates analysis on many dates over a five year period. In general, under elevated CO2, nitrogen was decreased, carbon was increased and carbohydrates were increased. This research was conducted at the Central Plains Experimental Range, near Nunn, CO; lat.40degrees 40 minutes N; long. 104 degrees 45 minutes W in the shortgrass steppe region of NE Colorado, USA and as a collaboration between SGS-LTER and USDA-ARS researchers.
Resource Title: Website Pointer to html file.
File Name: Web Page, url: https://portal.edirepository.org/nis/mapbrowse?scope=knb-lter-sgs&identifier=160
Webpage with information and links to data files for download
This data package was produced by researchers working on the Shortgrass Steppe Long Term Ecological Research (SGS-LTER) Project, administered at Colorado State University. Long-term datasets and background information (proposals, reports, photographs, etc.) on the SGS-LTER project are contained in a comprehensive project collection within the Digital Collections of Colorado (http://digitool.library.colostate.edu/R/?func=collections&collection_id=3429). The data table and associated metadata document, which is generated in Ecological Metadata Language, may be available through other repositories serving the ecological research community and represent components of the larger SGS-LTER project collection. Additional information and referenced materials can be found: http://hdl.handle.net/10217/82454.\nAt the end of the Open Top Chamber experiment the number and basal size of Stipa comata plants in ambient and elevated (720ppm) chambered and unchambered plots was measured. There was a greater number of small plants and seedlings in the elevated CO2 plots. This research was conducted at the Central Plains Experimental Range, near Nunn, CO; lat.40degrees 40 minutes N; long. 104 degrees 45 minutes W in the shortgrass steppe region of NE Colorado, USA and as a collaboration between SGS-LTER and USDA-ARS researchers.
Resource Title: Website Pointer to html file.
File Name: Web Page, url: https://portal.edirepository.org/nis/mapbrowse?scope=knb-lter-sgs&identifier=166
Webpage with information and links to data files for download
This data package was produced by researchers working on the Shortgrass Steppe Long Term Ecological Research (SGS-LTER) Project, administered at Colorado State University. Long-term datasets and background information (proposals, reports, photographs, etc.) on the SGS-LTER project are contained in a comprehensive project collection within the Digital Collections of Colorado (http://digitool.library.colostate.edu/R/?func=collections&collection_id=3429). The data table and associated metadata document, which is generated in Ecological Metadata Language, may be available through other repositories serving the ecological research community and represent components of the larger SGS-LTER project collection. Additional information and referenced materials can be found: http://hdl.handle.net/10217/82454.\nEvery month, during the growing season, from 1997-2001, 10 small quadrats were placed in ambient and elevated CO2 open-top-chambers, and plant cover, by species, was visually estimated. In general, elevated CO2 caused an increase in one C3 grass species, Stipa comata, and a small increase in forbs.
Resource Title: Website Pointer to html file.
File Name: Web Page, url: https://portal.edirepository.org/nis/mapbrowse?scope=knb-lter-sgs&identifier=156
Webpage with information and links to data files for download
This data package was produced by researchers working on the Shortgrass Steppe Long Term Ecological Research (SGS-LTER) Project, administered at Colorado State University. Long-term datasets and background information (proposals, reports, photographs, etc.) on the SGS-LTER project are contained in a comprehensive project collection within the Digital Collections of Colorado (http://digitool.library.colostate.edu/R/?func=collections&collection_id=3429). The data table and associated metadata document, which is generated in Ecological Metadata Language, may be available through other repositories serving the ecological research community and represent components of the larger SGS-LTER project collection. Additional information and referenced materials can be found: http://hdl.handle.net/10217/82454.\nVolumetric soil water content was measured in the 0-15 cm soil depth layer using TDR probes, nearly weekly, in ambient and elevated CO2 open-top-chambers, and unchambered plots. A consistent improvement in SWC was seen in the elevated CO2 plots, while ambient-chambered plots often had lowest SWC. This research was conducted at the Central Plains Experimental Range, near Nunn, CO; lat.40degrees 40 minutes N; long. 104 degrees 45 minutes W in the shortgrass steppe region of NE Colorado, USA and as a collaboration between SGS-LTER and USDA-ARS researchers.
Resource Title: Website Pointer to html file.
File Name: Web Page, url: https://portal.edirepository.org/nis/mapbrowse?scope=knb-lter-sgs&identifier=164
Webpage with information and links to data files for download
This data package was produced by researchers working on the Shortgrass Steppe Long Term Ecological Research (SGS-LTER) Project, administered at Colorado State University. Long-term datasets and background information (proposals, reports, photographs, etc.) on the SGS-LTER project are contained in a comprehensive project collection within the Digital Collections of Colorado (http://digitool.library.colostate.edu/R/?func=collections&collection_id=3429). The data table and associated metadata document, which is generated in Ecological Metadata Language, may be available through other repositories serving the ecological research community and represent components of the larger SGS-LTER project collection. Additional information and referenced materials can be found: http://hdl.handle.net/10217/82454.\nAt the end of the 5-year OTC study, root cores were taken from ambient and elevated-CO2-chambered plots and unchambered controls and sectioned at 10cm intervals for root scanning and weighing. There was a trend for higher root weight under elevated CO2, which corresponded to greater root length, but only in the 0-10cm depth interval. This research was conducted at the Central Plains Experimental Range, near Nunn, CO; lat.40degrees 40 minutes N; long. 104 degrees 45 minutes W in the shortgrass steppe region of NE Colorado, USA and as a collaboration between SGS-LTER and USDA-ARS researchers.
Resource Title: Website Pointer to html file.
File Name: Web Page, url: https://portal.edirepository.org/nis/mapbrowse?scope=knb-lter-sgs&identifier=161
Webpage with information and links to data files for download
This data package was produced by researchers working on the Shortgrass Steppe Long Term Ecological Research (SGS-LTER) Project, administered at Colorado State University. Long-term datasets and background information (proposals, reports, photographs, etc.) on the SGS-LTER project are contained in a comprehensive project collection within the Digital Collections of Colorado (http://digitool.library.colostate.edu/R/?func=collections&collection_id=3429). The data table and associated metadata document, which is generated in Ecological Metadata Language, may be available through other repositories serving the ecological research community and represent components of the larger SGS-LTER project collection. Additional information and referenced materials can be found: http://hdl.handle.net/10217/83515.\nCPER Hillslope Soil Spatial Variability - Pedons were characterized along three parallel transects, spaced at approximate 40 m intervals perpendicular to a hillslope at the CPER. Pedons were described at 7 landscape positions along each transect: summit, shoulder, upper backslope, middle backslope, lower backslope, footslope, and toeslope. Pedons were described by genetic horizon according to the standards of the National Cooperative Soil Survey. Analyses included: particle size; organic C; total N; organic and total P. Bulk Density was estimated using particle size and organic C data, according to: Rawls, W.J. 1983. Estimating soil bulk density from particle size analysis and organic matter content. Soil Sci. 135: 123-125.
Resource Title: Website Pointer to html file.
File Name: Web Page, url: https://portal.edirepository.org/nis/mapbrowse?scope=knb-lter-sgs&identifier=131
Webpage with information and links to data files for download
This data package was produced by researchers working on the Shortgrass Steppe Long Term Ecological Research (SGS-LTER) Project, administered at Colorado State University. Long-term datasets and background information (proposals, reports, photographs, etc.) on the SGS-LTER project are contained in a comprehensive project collection within the Digital Collections of Colorado (http://digitool.library.colostate.edu/R/?func=collections&collection_id=3429). The data table and associated metadata document, which is generated in Ecological Metadata Language, may be available through other repositories serving the ecological research community and represent components of the larger SGS-LTER project collection. Additional information and referenced materials can be found: http://hdl.handle.net/10217/85633.
Resource Title: Website Pointer to html file.
File Name: Web Page, url: https://portal.edirepository.org/nis/mapbrowse?scope=knb-lter-sgs&identifier=545
Webpage with information and links to data files for download
This data package was produced by researchers working on the Shortgrass Steppe Long Term Ecological Research (SGS-LTER) Project, administered at Colorado State University. Long-term datasets and background information (proposals, reports, photographs, etc.) on the SGS-LTER project are contained in a comprehensive project collection within the Digital Collections of Colorado (http://digitool.library.colostate.edu/R/?func=collections&collection_id=3429). The data table and associated metadata document, which is generated in Ecological Metadata Language, may be available through other repositories serving the ecological research community and represent components of the larger SGS-LTER project collection. Additional information and referenced materials can be found: http://hdl.handle.net/10217/83444\nThe importance of disturbance intensity and herbivory by cattle and white grubs, or the larvae of June beetles to recovery of shortgrass steppe ecosystems in Colorado, USA were evaluated over a 14 year time period. Disturbance intensity was defined by survival of the dominant grass species (Bouteloua gracilis) after an outbreak of root feeding activity by white grubs. 16 patches of vegetation consisting of four pairs of adjacent ungrazed-grazed by cattle locations with 2 replicates that were recently affected by white grubs were selected in 1977. Disturbance intensity was determined in 1977 by the area in each patch that contained live tillers of B. gracilis. Permanent plots were lcoated both within and outside of each patch. Plant basal cover and density by species were estimated at time of peak aboveground biomass in 6 different years on each plot. Successional dynamics on patches was similar to areas affected by other types of disturbances, however, rate of recovery was faster for patches affected by grubs. Grazing by cattle was infrequently important to plant recovery, a result similar to effects of grazing on other aspects of shortgrass steppe. Disturbance intensity was important to recovery of B. gracilis since tiller survival in 1977 was linearly related to cover in each year of sampling. For ungrazed patches, initial conditions were important to recovery of B. gracilis for as many as 14 years. For grazed patches, initial conditions decreased and grazing increased in importance through time. Changes in resource quality and more uniform distribution of roots due to grazing likely resulted in more complete mortality of plants by grubs under grazed compared to ungrazed conditions. Persistance of shortgrass steppe ecosystems in spite of disturbances with different intensities are determined at least in part by characteristics of disturbances interacting with the ability ofplants to respond, and in part by the evolutionary history of the system. Although white grubs affect shortgrass communities infrequently, they have large and important effects on plant community structure through time, and represent an important class of disturbance defined by intensity.
Resource Title: Website Pointer to html file.
File Name: Web Page, url: https://portal.edirepository.org/nis/mapbrowse?scope=knb-lter-sgs&identifier=130
Webpage with information and links to data files for download
This data package was produced by researchers working on the Shortgrass Steppe Long Term Ecological Research (SGS-LTER) Project, administered at Colorado State University. Long-term datasets and background information (proposals, reports, photographs, etc.) on the SGS-LTER project are contained in a comprehensive project collection within the Digital Collections of Colorado (http://digitool.library.colostate.edu/R/?func=collections&collection_id=3429). The data table and associated metadata document, which is generated in Ecological Metadata Language, may be available through other repositories serving the ecological research community and represent components of the larger SGS-LTER project collection.\nOur objective in this study was to evaluate effects of land use on in situ net N mineralization in shortgrass steppe by comparing native and abandoned fields and cultivated fields, and by comparing soil under and between plants within native and abandoned fields. We also compared mineralization patterns between in situ and laboratory incubations to evaluate the role of environmental restrictions in determining N supply across management treatments and microsites. Additional information and referenced materials can be found: http://hdl.handle.net/10217/82140
Resource Title: Website Pointer to html file.
File Name: Web Page, url: https://portal.edirepository.org/nis/mapbrowse?scope=knb-lter-sgs&identifier=103
Webpage with information and links to data files for download
This data package was produced by researchers working on the Shortgrass Steppe Long Term Ecological Research (SGS-LTER) Project, administered at Colorado State University. Long-term datasets and background information (proposals, reports, photographs, etc.) on the SGS-LTER project are contained in a comprehensive project collection within the Digital Collections of Colorado (http://digitool.library.colostate.edu/R/?func=collections&collection_id=3429). The data table and associated metadata document, which is generated in Ecological Metadata Language, may be available through other repositories serving the ecological research community and represent components of the larger SGS-LTER project collection.\nOur research on abandoned fields at the CPER has two aspects,vegetation recovery and soil recovery. We wish to monitor these fields for the tem of the LTER project (decades or centuries), and to address some specific research questions. Our questions are: 1. Does vegetation on shortgrass steppe recover 55 years following cultivation? Specifically, does Bouteloua gracilis, the dominant shortgrass steppe species, recover? Prior results indicated that B. gracilis reovers on some fields, and does not on others. The fields that do not are dominated by buffalo grass. In this new work at the CPER, we ask an additional question: 2. What determines whether B. gracilis recovers? 3. Does soil organic matter recover following abandonment? Specifically, do indices of soil fertility such as nitrogen availability recover? 4. Does small-scale patterning associated with individual plants recover following disturbance? 5. Does the rate of soil recovery depend upon the rate of vegetation recovery? Past results on the Pawnee National Grasslands indicated that only small amounts of organic matter had accumulated following abandonment but that nitrogen availability had recovered to its original levels under B. gracilis plants on the abandoned fields. Specifically, we are interested in whether it makes a difference to soils if blue grama recovers or not. Additional information and referenced materials can be found: http://hdl.handle.net/10217/82140
Resource Title: Website Pointer to html file.
File Name: Web Page, url: https://portal.edirepository.org/nis/mapbrowse?scope=knb-lter-sgs&identifier=102
Webpage with information and links to data files for download
This data package was produced by researchers working on the Shortgrass Steppe Long Term Ecological Research (SGS-LTER) Project, administered at Colorado State University. Long-term datasets and background information (proposals, reports, photographs, etc.) on the SGS-LTER project are contained in a comprehensive project collection within the Digital Collections of Colorado (http://digitool.library.colostate.edu/R/?func=collections&collection_id=3429). The data table and associated metadata document, which is generated in Ecological Metadata Language, may be available through other repositories serving the ecological research community and represent components of the larger SGS-LTER project collection.\nOur objective in this study was to evaluate effects of land use on in situ net N mineralization in shortgrass steppe by comparing native and abandoned fields and cultivated fields, and by comparing soil under and between plants within native and abandoned fields. We also compared mineralization patterns between in situ and laboratory incubations to evaluate the role of environmental restrictions in determining N supply across management treatments and microsites. Additional information and referenced materials can be found: http://hdl.handle.net/10217/82140
Resource Title: Website Pointer to html file.
File Name: Web Page, url: https://portal.edirepository.org/nis/mapbrowse?scope=knb-lter-sgs&identifier=101
Webpage with information and links to data files for download
This data package was produced by researchers working on the Shortgrass Steppe Long Term Ecological Research (SGS-LTER) Project, administered at Colorado State University. Long-term datasets and background information (proposals, reports, photographs, etc.) on the SGS-LTER project are contained in a comprehensive project collection within the Digital Collections of Colorado (http://digitool.library.colostate.edu/R/?func=collections&collection_id=3429). The data table and associated metadata document, which is generated in Ecological Metadata Language, may be available through other repositories serving the ecological research community and represent components of the larger SGS-LTER project collection.\nThe effect of plant community structure on nutrient cycling is fundamental to our understanding of ecosystem function. We examined the importance of plant species and plant cover (i.e. plant covered microsites vs bare soil) on nutrient cycling in shortgrass steppe of northeastern Colorado. We tested the effects of both plant species and cover on soils in an area of undisturbed shortgrass steppe and an area that had undergone nitrogen and water additions from 1971 to 1974, resulting in significant shifts in plant species composition.
Resource Title: Website Pointer to html file.
File Name: Web Page, url: https://portal.edirepository.org/nis/mapbrowse?scope=knb-lter-sgs&identifier=120
Webpage with information and links to data files for download
This data package was produced by researchers working on the Shortgrass Steppe Long Term Ecological Research (SGS-LTER) Project, administered at Colorado State University. Long-term datasets and background information (proposals, reports, photographs, etc.) on the SGS-LTER project are contained in a comprehensive project collection within the Digital Collections of Colorado (http://digitool.library.colostate.edu/R/?func=collections&collection_id=3429). The data table and associated metadata document, which is generated in Ecological Metadata Language, may be available through other repositories serving the ecological research community and represent components of the larger SGS-LTER project collection.\nThe effect of plant community structure on nutrient cycling is fundamental to our understanding of ecosystem function. We examined the importance of plant species and plant cover (i.e. plant covered microsites vs bare soil) on nutrient cycling in shortgrass steppe of northeastern Colorado. We tested the effects of both plant species and cover on soils in an area of undisturbed shortgrass steppe and an area that had undergone nitrogen and water additions from 1971 to 1974, resulting in significant shifts in plant species composition. Additional information and referenced materials can be found: http://hdl.handle.net/10217/83317.
Resource Title: Website Pointer to html file.
File Name: Web Page, url: https://portal.edirepository.org/nis/mapbrowse?scope=knb-lter-sgs&identifier=121
Webpage with information and links to data files for download
This data package was produced by researchers working on the Shortgrass Steppe Long Term Ecological Research (SGS-LTER) Project, administered at Colorado State University. Long-term datasets and background information (proposals, reports, photographs, etc.) on the SGS-LTER project are contained in a comprehensive project collection within the Digital Collections of Colorado (http://digitool.library.colostate.edu/R/?func=collections&collection_id=3429). The data table and associated metadata document, which is generated in Ecological Metadata Language, may be available through other repositories serving the ecological research community and represent components of the larger SGS-LTER project collection.\nWater, nitrogen, and water-plus-nitrogen at levels beyond the range normally experience by shortgrass steppe communities were applied from 1971 through 1975, plant densities were sampled through 1977, and then sampling resumed in 1982, with sampling frequencies changing from annually to every other year. The initial sampling from 1970 to 1974 showed that the water and water plus nitrogen treatments had the strongest effect on plant community structure, both treatments increased biomass, and exotic weed species were noted on the water plus nitrogen treatment. Later sampling from 1982 to 1991 showed a ten-fold increase in exotic weed species on the water plus nitrogen plots as compared to the controls (Milchunas and Lauenroth 1995), a community change that has persisted on this site due to a chronic elevation of soil nitrogen caused by a plant tissue/soil organic matter feedback mechanism (Vinton and Burke 1995). In 1998, Six new treatments were superimposed on the historic study site. The six new treatments were: control, sugar, lignin, sawdust, lignin and sugar, and sawdust and sugar.In 2010, plots will be sampled every 5 years. Our objective in this study is to examine how plant communities change through time and explore implications of these changes for monitoring potentially stressed ecosystems. Additional information and referenced materials can be found: http://hdl.handle.net/10217/83317.
Resource Title: Website Pointer to html file.
File Name: Web Page, url: https://portal.edirepository.org/nis/mapbrowse?scope=knb-lter-sgs&identifier=179
Webpage with information and links to data files for download
This data package was produced by researchers working on the Shortgrass Steppe Long Term Ecological Research (SGS-LTER) Project, administered at Colorado State University. Long-term datasets and background information (proposals, reports, photographs, etc.) on the SGS-LTER project are contained in a comprehensive project collection within the Digital Collections of Colorado (http://digitool.library.colostate.edu/R/?func=collections&collection_id=3429). The data table and associated metadata document, which is generated in Ecological Metadata Language, may be available through other repositories serving the ecological research community and represent components of the larger SGS-LTER project collection.\nWater, nitrogen, and water-plus-nitrogen at levels beyond the range normally experience by shortgrass steppe communities were applied from 1971 through 1975, plant densities were sampled through 1977, and then sampling resumed in 1982, with sampling frequencies changing from annually to every other year. The initial sampling from 1970 to 1974 showed that the water and water plus nitrogen treatments had the strongest effect on plant community structure, both treatments increased biomass, and exotic weed species were noted on the water plus nitrogen treatment. Later sampling from 1982 to 1991 showed a ten-fold increase in exotic weed species on the water plus nitrogen plots as compared to the controls (Milchunas and Lauenroth 1995), a community change that has persisted on this site due to a chronic elevation of soil nitrogen caused by a plant tissue/soil organic matter feedback mechanism (Vinton and Burke 1995). In 1998, Six new treatments were superimposed on the historic study site. The six new treatments were: control, sugar, lignin, sawdust, lignin and sugar, and sawdust and sugar.In 2010, plots will be sampled every 5 years. Our objective in this study is to examine how plant communities change through time and explore implications of these changes for monitoring potentially stressed ecosystems. Additional information and referenced materials can be found: http://hdl.handle.net/10217/83317.
Resource Title: Website Pointer to html file.
File Name: Web Page, url: https://portal.edirepository.org/nis/mapbrowse?scope=knb-lter-sgs&identifier=180
Webpage with information and links to data files for download
This data package was produced by researchers working on the Shortgrass Steppe Long Term Ecological Research (SGS-LTER) Project, administered at Colorado State University. Long-term datasets and background information (proposals, reports, photographs, etc.) on the SGS-LTER project are contained in a comprehensive project collection within the Digital Collections of Colorado (http://digitool.library.colostate.edu/R/?func=collections&collection_id=3429). The data table and associated metadata document, which is generated in Ecological Metadata Language, may be available through other repositories serving the ecological research community and represent components of the larger SGS-LTER project collection.\nWater, nitrogen, and water-plus-nitrogen at levels beyond the range normally experience by shortgrass steppe communities were applied from 1971 through 1975, plant densities were sampled through 1977, and then sampling resumed in 1982, with sampling frequencies changing from annually to every other year. The initial sampling from 1970 to 1974 showed that the water and water plus nitrogen treatments had the strongest effect on plant community structure, both treatments increased biomass, and exotic weed species were noted on the water plus nitrogen treatment. Later sampling from 1982 to 1991 showed a ten-fold increase in exotic weed species on the water plus nitrogen plots as compared to the controls (Milchunas and Lauenroth 1995), a community change that has persisted on this site due to a chronic elevation of soil nitrogen caused by a plant tissue/soil organic matter feedback mechanism (Vinton and Burke 1995). In 1998, Six new treatments were superimposed on the historic study site. The six new treatments were: control, sugar, lignin, sawdust, lignin and sugar, and sawdust and sugar.In 2010, plots will be sampled every 5 years. Our objective in this study is to examine how plant communities change through time and explore implications of these changes for monitoring potentially stressed ecosystems. Additional information and referenced materials can be found: http://hdl.handle.net/10217/83317.
Resource Title: Website Pointer to html file.
File Name: Web Page, url: https://portal.edirepository.org/nis/mapbrowse?scope=knb-lter-sgs&identifier=181
Webpage with information and links to data files for download
This data package was produced by researchers working on the Shortgrass Steppe Long Term Ecological Research (SGS-LTER) Project, administered at Colorado State University. Long-term datasets and background information (proposals, reports, photographs, etc.) on the SGS-LTER project are contained in a comprehensive project collection within the Digital Collections of Colorado (http://digitool.library.colostate.edu/R/?func=collections&collection_id=3429). The data table and associated metadata document, which is generated in Ecological Metadata Language, may be available through other repositories serving the ecological research community and represent components of the larger SGS-LTER project collection.\nWater, nitrogen, and water-plus-nitrogen at levels beyond the range normally experience by shortgrass steppe communities were applied from 1971 through 1975, plant densities were sampled through 1977, and then sampling resumed in 1982, with sampling frequencies changing from annually to every other year. The initial sampling from 1970 to 1974 showed that the water and water plus nitrogen treatments had the strongest effect on plant community structure, both treatments increased biomass, and exotic weed species were noted on the water plus nitrogen treatment. Later sampling from 1982 to 1991 showed a ten-fold increase in exotic weed species on the water plus nitrogen plots as compared to the controls (Milchunas and Lauenroth 1995), a community change that has persisted on this site due to a chronic elevation of soil nitrogen caused by a plant tissue/soil organic matter feedback mechanism (Vinton and Burke 1995). In 1998, Six new treatments were superimposed on the historic study site. The six new treatments were: control, sugar, lignin, sawdust, lignin and sugar, and sawdust and sugar.In 2010, plots will be sampled every 5 years. Our objective in this study is to examine how plant communities change through time and explore implications of these changes for monitoring potentially stressed ecosystems. Additional information and referenced materials can be found: http://hdl.handle.net/10217/83317.
Resource Title: Website Pointer to html file.
File Name: Web Page, url: https://portal.edirepository.org/nis/mapbrowse?scope=knb-lter-sgs&identifier=520
Webpage with information and links to data files for download
This data package was produced by researchers working on the Shortgrass Steppe Long Term Ecological Research (SGS-LTER) Project, administered at Colorado State University. Long-term datasets and background information (proposals, reports, photographs, etc.) on the SGS-LTER project are contained in a comprehensive project collection within the Digital Collections of Colorado (http://digitool.library.colostate.edu/R/?func=collections&collection_id=3429). The data table and associated metadata document, which is generated in Ecological Metadata Language, may be available through other repositories serving the ecological research community and represent components of the larger SGS-LTER project collection.\nWater, nitrogen, and water-plus-nitrogen at levels beyond the range normally experience by shortgrass steppe communities were applied from 1971 through 1975, plant densities were sampled through 1977, and then sampling resumed in 1982, with sampling frequencies changing from annually to every other year. The initial sampling from 1970 to 1974 showed that the water and water plus nitrogen treatments had the strongest effect on plant community structure, both treatments increased biomass, and exotic weed species were noted on the water plus nitrogen treatment. Later sampling from 1982 to 1991 showed a ten-fold increase in exotic weed species on the water plus nitrogen plots as compared to the controls (Milchunas and Lauenroth 1995), a community change that has persisted on this site due to a chronic elevation of soil nitrogen caused by a plant tissue/soil organic matter feedback mechanism (Vinton and Burke 1995). In 1998, Six new treatments were superimposed on the historic study site. The six new treatments were: control, sugar, lignin, sawdust, lignin and sugar, and sawdust and sugar.In 2010, plots will be sampled every 5 years. Our objective in this study is to examine how plant communities change through time and explore implications of these changes for monitoring potentially stressed ecosystems. Additional information and referenced materials can be found: http://hdl.handle.net/10217/83317.
Resource Title: Website Pointer to html file.
File Name: Web Page, url: https://portal.edirepository.org/nis/mapbrowse?scope=knb-lter-sgs&identifier=521
Webpage with information and links to data files for download
This data package was produced by researchers working on the Shortgrass Steppe Long Term Ecological Research (SGS-LTER) Project, administered at Colorado State University. Long-term datasets and background information (proposals, reports, photographs, etc.) on the SGS-LTER project are contained in a comprehensive project collection within the Digital Collections of Colorado (http://digitool.library.colostate.edu/R/?func=collections&collection_id=3429). The data table and associated metadata document, which is generated in Ecological Metadata Language, may be available through other repositories serving the ecological research community and represent components of the larger SGS-LTER project collection.\nWhen the CPER was established in 1939, researchers constructed a .5-1 ha grazing exclosure in each of the pastures. These areas have remained protected from grazing for the past 70 years. The remaining areas have been grazed for the past 20+ years. This collection of pastures and exclosures provided an extraordinary opportunity to reinitiate grazing and protection, and evaluate the balance between degradation and aggradation. We proposed to rearrange fences and expose areas to grazing that have been protected for 50 years, and protect areas from grazing that had been grazed for 50 years. The combinations of grazing conditions were: 1. Long-term protection 2. Long-term grazing (moderate) 3. 50 years of protection followed by grazing 4. 50 years of grazing followed by protection Net primary production, nitrogen dynamics, cattle utilization, and community dynamics of vegetation were measured. Additional information and referenced materials can be found: http://hdl.handle.net/10217/85596.
Resource Title: Website Pointer to html file.
File Name: Web Page, url: https://portal.edirepository.org/nis/mapbrowse?scope=knb-lter-sgs&identifier=528
Webpage with information and links to data files for download
This data package was produced by researchers working on the Shortgrass Steppe Long Term Ecological Research (SGS-LTER) Project, administered at Colorado State University. Long-term datasets and background information (proposals, reports, photographs, etc.) on the SGS-LTER project are contained in a comprehensive project collection within the Digital Collections of Colorado (http://digitool.library.colostate.edu/R/?func=collections&collection_id=3429). The data table and associated metadata document, which is generated in Ecological Metadata Language, may be available through other repositories serving the ecological research community and represent components of the larger SGS-LTER project collection.\nWhen the CPER was established in 1939, researchers constructed a .5-1 ha grazing exclosure in each of the pastures. These areas have remained protected from grazing for the past 70 years. The remaining areas have been grazed for the past 20+ years. This collection of pastures and exclosures provided an extraordinary opportunity to reinitiate grazing and protection, and evaluate the balance between degradation and aggradation. We proposed to rearrange fences and expose areas to grazing that have been protected for 50 years, and protect areas from grazing that had been grazed for 50 years. The combinations of grazing conditions were: 1. Long-term protection 2. Long-term grazing (moderate) 3. 50 years of protection followed by grazing 4. 50 years of grazing followed by protection Net primary production, nitrogen dynamics, cattle utilization, and community dynamics of vegetation were measured. Additional information and referenced materials can be found: http://hdl.handle.net/10217/85596.
Resource Title: Website Pointer to html file.
File Name: Web Page, url: https://portal.edirepository.org/nis/mapbrowse?scope=knb-lter-sgs&identifier=531
Webpage with information and links to data files for download
This data package was produced by researchers working on the Shortgrass Steppe Long Term Ecological Research (SGS-LTER) Project, administered at Colorado State University. Long-term datasets and background information (proposals, reports, photographs, etc.) on the SGS-LTER project are contained in a comprehensive project collection within the Digital Collections of Colorado (http://digitool.library.colostate.edu/R/?func=collections&collection_id=3429). The data table and associated metadata document, which is generated in Ecological Metadata Language, may be available through other repositories serving the ecological research community and represent components of the larger SGS-LTER project collection.\nWhen the CPER was established in 1939, researchers constructed a .5-1 ha grazing exclosure in each of the pastures. These areas have remained protected from grazing for the past 70 years. The remaining areas have been grazed for the past 20+ years. This collection of pastures and exclosures provided an extraordinary opportunity to reinitiate grazing and protection, and evaluate the balance between degradation and aggradation. We proposed to rearrange fences and expose areas to grazing that have been protected for 50 years, and protect areas from grazing that had been grazed for 50 years. The combinations of grazing conditions were: 1. Long-term protection 2. Long-term grazing (moderate) 3. 50 years of protection followed by grazing 4. 50 years of grazing followed by protection Net primary production, nitrogen dynamics, cattle utilization, and community dynamics of vegetation were measured. Additional information and referenced materials can be found: http://hdl.handle.net/10217/85596.
Resource Title: Website Pointer to html file.
File Name: Web Page, url: https://portal.edirepository.org/nis/mapbrowse?scope=knb-lter-sgs&identifier=530
Webpage with information and links to data files for download
This data package was produced by researchers working on the Shortgrass Steppe Long Term Ecological Research (SGS-LTER) Project, administered at Colorado State University. Long-term datasets and background information (proposals, reports, photographs, etc.) on the SGS-LTER project are contained in a comprehensive project collection within the Digital Collections of Colorado (http://digitool.library.colostate.edu/R/?func=collections&collection_id=3429). The data table and associated metadata document, which is generated in Ecological Metadata Language, may be available through other repositories serving the ecological research community and represent components of the larger SGS-LTER project collection.\nWhen the CPER was established in 1939, researchers constructed a .5-1 ha grazing exclosure in each of the pastures. These areas have remained protected from grazing for the past 70 years. The remaining areas have been grazed for the past 20+ years. This collection of pastures and exclosures provided an extraordinary opportunity to reinitiate grazing and protection, and evaluate the balance between degradation and aggradation. We proposed to rearrange fences and expose areas to grazing that have been protected for 50 years, and protect areas from grazing that had been grazed for 50 years. The combinations of grazing conditions were: 1. Long-term protection 2. Long-term grazing (moderate) 3. 50 years of protection followed by grazing 4. 50 years of grazing followed by protection Net primary production, nitrogen dynamics, cattle utilization, and community dynamics of vegetation were measured. Additional information and referenced materials can be found: http://hdl.handle.net/10217/85596.
Resource Title: Website Pointer to html file.
File Name: Web Page, url: https://portal.edirepository.org/nis/mapbrowse?scope=knb-lter-sgs&identifier=527
Webpage with information and links to data files for download
This data package was produced by researchers working on the Shortgrass Steppe Long Term Ecological Research (SGS-LTER) Project, administered at Colorado State University. Long-term datasets and background information (proposals, reports, photographs, etc.) on the SGS-LTER project are contained in a comprehensive project collection within the Digital Collections of Colorado (http://digitool.library.colostate.edu/R/?func=collections&collection_id=3429). The data table and associated metadata document, which is generated in Ecological Metadata Language, may be available through other repositories serving the ecological research community and represent components of the larger SGS-LTER project collection.\nWhen the CPER was established in 1939, researchers constructed a .5-1 ha grazing exclosure in each of the pastures. These areas have remained protected from grazing for the past 70 years. The remaining areas have been grazed for the past 20+ years. This collection of pastures and exclosures provided an extraordinary opportunity to reinitiate grazing and protection, and evaluate the balance between degradation and aggradation. We proposed to rearrange fences and expose areas to grazing that have been protected for 50 years, and protect areas from grazing that had been grazed for 50 years. The combinations of grazing conditions were: 1. Long-term protection 2. Long-term grazing (moderate) 3. 50 years of protection followed by grazing 4. 50 years of grazing followed by protection Net primary production, nitrogen dynamics, cattle utilization, and community dynamics of vegetation were measured. Additional information and referenced materials can be found: http://hdl.handle.net/10217/85596.
Resource Title: Website Pointer to html file.
File Name: Web Page, url: https://portal.edirepository.org/nis/mapbrowse?scope=knb-lter-sgs&identifier=529
Webpage with information and links to data files for download
This data package was produced by researchers working on the Shortgrass Steppe Long Term Ecological Research (SGS-LTER) Project, administered at Colorado State University. Long-term datasets and background information (proposals, reports, photographs, etc.) on the SGS-LTER project are contained in a comprehensive project collection within the Digital Collections of Colorado (http://digitool.library.colostate.edu/R/?func=collections&collection_id=3429). The data table and associated metadata document, which is generated in Ecological Metadata Language, may be available through other repositories serving the ecological research community and represent components of the larger SGS-LTER project collection.\nThe objective of this research is to evaluate the long-term response of shortgrass ecosystems to additional water and nitrogen inputs. An experiment was conducted during the IBP project (1970-1975) in which water and nitrogen were applied (Lauenroth et al. 1978, Dodd and Lauenroth 1979, Milchunas and Lauenroth 1995). While we gained an enormous increment in our knowledge about shortgrass ecosystems from this experiment it raised as many questions as it answered. One of the problems was that the treatments were very high levels of nitrogen (100-150kg/ha N) and water (600 mm/growing season) additions. Additional information and referenced materials can be found: http://hdl.handle.net/10217/85629.
Resource Title: Website Pointer to html file.
File Name: Web Page, url: https://portal.edirepository.org/nis/mapbrowse?scope=knb-lter-sgs&identifier=542
Webpage with information and links to data files for download
This data package was produced by researchers working on the Shortgrass Steppe Long Term Ecological Research (SGS-LTER) Project, administered at Colorado State University. Long-term datasets and background information (proposals, reports, photographs, etc.) on the SGS-LTER project are contained in a comprehensive project collection within the Digital Collections of Colorado (http://digitool.library.colostate.edu/R/?func=collections&collection_id=3429). The data table and associated metadata document, which is generated in Ecological Metadata Language, may be available through other repositories serving the ecological research community and represent components of the larger SGS-LTER project collection.\nThe objective of this research is to evaluate the long-term response of shortgrass ecosystems to additional water and nitrogen inputs. An experiment was conducted during the IBP project (1970-1975) in which water and nitrogen were applied (Lauenroth et al. 1978, Dodd and Lauenroth 1979, Milchunas and Lauenroth 1995). While we gained an enormous increment in our knowledge about shortgrass ecosystems from this experiment it raised as many questions as it answered. One of the problems was that the treatments were very high levels of nitrogen (100-150kg/ha N) and water (600 mm/growing season) additions. Additional information and referenced materials can be found: http://hdl.handle.net/10217/85629.
Resource Title: Website Pointer to html file.
File Name: Web Page, url: https://portal.edirepository.org/nis/mapbrowse?scope=knb-lter-sgs&identifier=543
Webpage with information and links to data files for download
This data package was produced by researchers working on the Shortgrass Steppe Long Term Ecological Research (SGS-LTER) Project, administered at Colorado State University. Long-term datasets and background information (proposals, reports, photographs, etc.) on the SGS-LTER project are contained in a comprehensive project collection within the Digital Collections of Colorado (http://digitool.library.colostate.edu/R/?func=collections&collection_id=3429). The data table and associated metadata document, which is generated in Ecological Metadata Language, may be available through other repositories serving the ecological research community and represent components of the larger SGS-LTER project collection.\nThe objective of this research is to evaluate the long-term response of shortgrass ecosystems to additional water and nitrogen inputs. An experiment was conducted during the IBP project (1970-1975) in which water and nitrogen were applied (Lauenroth et al. 1978, Dodd and Lauenroth 1979, Milchunas and Lauenroth 1995). While we gained an enormous increment in our knowledge about shortgrass ecosystems from this experiment it raised as many questions as it answered. One of the problems was that the treatments were very high levels of nitrogen (100-150kg/ha N) and water (600 mm/growing season) additions. Additional information and referenced materials can be found: http://hdl.handle.net/10217/85629.
Resource Title: Website Pointer to html file.
File Name: Web Page, url: https://portal.edirepository.org/nis/mapbrowse?scope=knb-lter-sgs&identifier=544
Webpage with information and links to data files for download
This data package was produced by researchers working on the Shortgrass Steppe Long Term Ecological Research (SGS-LTER) Project, administered at Colorado State University. Long-term datasets and background information (proposals, reports, photographs, etc.) on the SGS-LTER project are contained in a comprehensive project collection within the Digital Collections of Colorado (http://digitool.library.colostate.edu/R/?func=collections&collection_id=3429). The data table and associated metadata document, which is generated in Ecological Metadata Language, may be available through other repositories serving the ecological research community and represent components of the larger SGS-LTER project collection.\nNo Abstract Available
Resource Title: Website Pointer to html file.
File Name: Web Page, url: https://portal.edirepository.org/nis/mapbrowse?scope=knb-lter-sgs&identifier=806
Webpage with information and links to data files for download
This data package was produced by researchers working on the Shortgrass Steppe Long Term Ecological Research (SGS-LTER) Project, administered at Colorado State University. Long-term datasets and background information (proposals, reports, photographs, etc.) on the SGS-LTER project are contained in a comprehensive project collection within the Digital Collections of Colorado (http://digitool.library.colostate.edu/R/?func=collections&collection_id=3429). The data table and associated metadata document, which is generated in Ecological Metadata Language, may be available through other repositories serving the ecological research community and represent components of the larger SGS-LTER project collection.\nNo Abstract Available
Resource Title: Website Pointer to html file.
File Name: Web Page, url: https://portal.edirepository.org/nis/mapbrowse?scope=knb-lter-sgs&identifier=813
Webpage with information and links to data files for download
This data package was produced by researchers working on the Shortgrass Steppe Long Term Ecological Research (SGS-LTER) Project, administered at Colorado State University. Long-term datasets and background information (proposals, reports, photographs, etc.) on the SGS-LTER project are contained in a comprehensive project collection within the Digital Collections of Colorado (http://digitool.library.colostate.edu/R/?func=collections&collection_id=3429). The data table and associated metadata document, which is generated in Ecological Metadata Language, may be available through other repositories serving the ecological research community and represent components of the larger SGS-LTER project collection.\nNo Abstract Available
Resource Title: Website Pointer to html file.
File Name: Web Page, url: https://portal.edirepository.org/nis/mapbrowse?scope=knb-lter-sgs&identifier=812
Webpage with information and links to data files for download
This data package was produced by researchers working on the Shortgrass Steppe Long Term Ecological Research (SGS-LTER) Project, administered at Colorado State University. Long-term datasets and background information (proposals, reports, photographs, etc.) on the SGS-LTER project are contained in a comprehensive project collection within the Digital Collections of Colorado (http://digitool.library.colostate.edu/R/?func=collections&collection_id=3429). The data table and associated metadata document, which is generated in Ecological Metadata Language, may be available through other repositories serving the ecological research community and represent components of the larger SGS-LTER project collection.\nNo Abstract Available
Resource Title: Website Pointer to html file.
File Name: Web Page, url: https://portal.edirepository.org/nis/mapbrowse?scope=knb-lter-sgs&identifier=502
Webpage with information and links to data files for download
This data package was produced by researchers working on the Shortgrass Steppe Long Term Ecological Research (SGS-LTER) Project, administered at Colorado State University. Long-term datasets and background information (proposals, reports, photographs, etc.) on the SGS-LTER project are contained in a comprehensive project collection within the Digital Collections of Colorado (http://digitool.library.colostate.edu/R/?func=collections&collection_id=3429). The data table and associated metadata document, which is generated in Ecological Metadata Language, may be available through other repositories serving the ecological research community and represent components of the larger SGS-LTER project collection.\nNo Abstract Available
Resource Title: Website Pointer to html file.
File Name: Web Page, url: https://portal.edirepository.org/nis/mapbrowse?scope=knb-lter-sgs&identifier=817
Webpage with information and links to data files for download
This data package was produced by researchers working on the Shortgrass Steppe Long Term Ecological Research (SGS-LTER) Project, administered at Colorado State University. Long-term datasets and background information (proposals, reports, photographs, etc.) on the SGS-LTER project are contained in a comprehensive project collection within the Digital Collections of Colorado (http://digitool.library.colostate.edu/R/?func=collections&collection_id=3429). The data table and associated metadata document, which is generated in Ecological Metadata Language, may be available through other repositories serving the ecological research community and represent components of the larger SGS-LTER project collection.\nNo Abstract Available
Resource Title: Website Pointer to html file.
File Name: Web Page, url: https://portal.edirepository.org/nis/mapbrowse?scope=knb-lter-sgs&identifier=814
Webpage with information and links to data files for download
This data package was produced by researchers working on the Shortgrass Steppe Long Term Ecological Research (SGS-LTER) Project, administered at Colorado State University. Long-term datasets and background information (proposals, reports, photographs, etc.) on the SGS-LTER project are contained in a comprehensive project collection within the Digital Collections of Colorado (http://digitool.library.colostate.edu/R/?func=collections&collection_id=3429). The data table and associated metadata document, which is generated in Ecological Metadata Language, may be available through other repositories serving the ecological research community and represent components of the larger SGS-LTER project collection.\nNo Abstract Available
Resource Title: Website Pointer to html file.
File Name: Web Page, url: https://portal.edirepository.org/nis/mapbrowse?scope=knb-lter-sgs&identifier=809
Webpage with information and links to data files for download
This data package was produced by researchers working on the Shortgrass Steppe Long Term Ecological Research (SGS-LTER) Project, administered at Colorado State University. Long-term datasets and background information (proposals, reports, photographs, etc.) on the SGS-LTER project are contained in a comprehensive project collection within the Digital Collections of Colorado (http://digitool.library.colostate.edu/R/?func=collections&collection_id=3429). The data table and associated metadata document, which is generated in Ecological Metadata Language, may be available through other repositories serving the ecological research community and represent components of the larger SGS-LTER project collection.\nNo Abstract Available
Resource Title: Website Pointer to html file.
File Name: Web Page, url: https://portal.edirepository.org/nis/mapbrowse?scope=knb-lter-sgs&identifier=815
Webpage with information and links to data files for download
This data package was produced by researchers working on the Shortgrass Steppe Long Term Ecological Research (SGS-LTER) Project, administered at Colorado State University. Long-term datasets and background information (proposals, reports, photographs, etc.) on the SGS-LTER project are contained in a comprehensive project collection within the Digital Collections of Colorado (http://digitool.library.colostate.edu/R/?func=collections&collection_id=3429). The data table and associated metadata document, which is generated in Ecological Metadata Language, may be available through other repositories serving the ecological research community and represent components of the larger SGS-LTER project collection.\nNo Abstract Available
Resource Title: Website Pointer to html file.
File Name: Web Page, url: https://portal.edirepository.org/nis/mapbrowse?scope=knb-lter-sgs&identifier=816
Webpage with information and links to data files for download
This data package was produced by researchers working on the Shortgrass Steppe Long Term Ecological Research (SGS-LTER) Project, administered at Colorado State University. Long-term datasets and background information (proposals, reports, photographs, etc.) on the SGS-LTER project are contained in a comprehensive project collection within the Digital Collections of Colorado (http://digitool.library.colostate.edu/R/?func=collections&collection_id=3429). The data table and associated metadata document, which is generated in Ecological Metadata Language, may be available through other repositories serving the ecological research community and represent components of the larger SGS-LTER project collection.\nNo Abstract Available
Resource Title: Website Pointer to html file.
File Name: Web Page, url: https://portal.edirepository.org/nis/mapbrowse?scope=knb-lter-sgs&identifier=802
Webpage with information and links to data files for download
This data package was produced by researchers working on the Shortgrass Steppe Long Term Ecological Research (SGS-LTER) Project, administered at Colorado State University. Long-term datasets and background information (proposals, reports, photographs, etc.) on the SGS-LTER project are contained in a comprehensive project collection within the Digital Collections of Colorado (http://digitool.library.colostate.edu/R/?func=collections&collection_id=3429). The data table and associated metadata document, which is generated in Ecological Metadata Language, may be available through other repositories serving the ecological research community and represent components of the larger SGS-LTER project collection.\nNo Abstract Available
Resource Title: Website Pointer to html file.
File Name: Web Page, url: https://portal.edirepository.org/nis/mapbrowse?scope=knb-lter-sgs&identifier=811
Webpage with information and links to data files for download
This data package was produced by researchers working on the Shortgrass Steppe Long Term Ecological Research (SGS-LTER) Project, administered at Colorado State University. Long-term datasets and background information (proposals, reports, photographs, etc.) on the SGS-LTER project are contained in a comprehensive project collection within the Digital Collections of Colorado (http://digitool.library.colostate.edu/R/?func=collections&collection_id=3429). The data table and associated metadata document, which is generated in Ecological Metadata Language, may be available through other repositories serving the ecological research community and represent components of the larger SGS-LTER project collection.\nNo Abstract Available
Resource Title: Website Pointer to html file.
File Name: Web Page, url: https://portal.edirepository.org/nis/mapbrowse?scope=knb-lter-sgs&identifier=804
Webpage with information and links to data files for download
This data package was produced by researchers working on the Shortgrass Steppe Long Term Ecological Research (SGS-LTER) Project, administered at Colorado State University. Long-term datasets and background information (proposals, reports, photographs, etc.) on the SGS-LTER project are contained in a comprehensive project collection within the Digital Collections of Colorado (http://digitool.library.colostate.edu/R/?func=collections&collection_id=3429). The data table and associated metadata document, which is generated in Ecological Metadata Language, may be available through other repositories serving the ecological research community and represent components of the larger SGS-LTER project collection.\nNo Abstract Available
Resource Title: Website Pointer to html file.
File Name: Web Page, url: https://portal.edirepository.org/nis/mapbrowse?scope=knb-lter-sgs&identifier=805
Webpage with information and links to data files for download
This data package was produced by researchers working on the Shortgrass Steppe Long Term Ecological Research (SGS-LTER) Project, administered at Colorado State University. Long-term datasets and background information (proposals, reports, photographs, etc.) on the SGS-LTER project are contained in a comprehensive project collection within the Digital Collections of Colorado (http://digitool.library.colostate.edu/R/?func=collections&collection_id=3429). The data table and associated metadata document, which is generated in Ecological Metadata Language, may be available through other repositories serving the ecological research community and represent components of the larger SGS-LTER project collection.\nNo Abstract Available
Resource Title: Website Pointer to html file.
File Name: Web Page, url: https://portal.edirepository.org/nis/mapbrowse?scope=knb-lter-sgs&identifier=807
Webpage with information and links to data files for download
This data package was produced by researchers working on the Shortgrass Steppe Long Term Ecological Research (SGS-LTER) Project, administered at Colorado State University. Long-term datasets and background information (proposals, reports, photographs, etc.) on the SGS-LTER project are contained in a comprehensive project collection within the Digital Collections of Colorado (http://digitool.library.colostate.edu/R/?func=collections&collection_id=3429). The data table and associated metadata document, which is generated in Ecological Metadata Language, may be available through other repositories serving the ecological research community and represent components of the larger SGS-LTER project collection.\nNo Abstract Available
Resource Title: Website Pointer to html file.
File Name: Web Page, url: https://portal.edirepository.org/nis/mapbrowse?scope=knb-lter-sgs&identifier=803
Webpage with information and links to data files for download
This data package was produced by researchers working on the Shortgrass Steppe Long Term Ecological Research (SGS-LTER) Project, administered at Colorado State University. Long-term datasets and background information (proposals, reports, photographs, etc.) on the SGS-LTER project are contained in a comprehensive project collection within the Digital Collections of Colorado (http://digitool.library.colostate.edu/R/?func=collections&collection_id=3429). The data table and associated metadata document, which is generated in Ecological Metadata Language, may be available through other repositories serving the ecological research community and represent components of the larger SGS-LTER project collection.\nNo Abstract Available
Resource Title: Website Pointer to html file.
File Name: Web Page, url: https://portal.edirepository.org/nis/mapbrowse?scope=knb-lter-sgs&identifier=801
Webpage with information and links to data files for download
This data package was produced by researchers working on the Shortgrass Steppe Long Term Ecological Research (SGS-LTER) Project, administered at Colorado State University. Long-term datasets and background information (proposals, reports, photographs, etc.) on the SGS-LTER project are contained in a comprehensive project collection within the Digital Collections of Colorado (http://digitool.library.colostate.edu/R/?func=collections&collection_id=3429). The data table and associated metadata document, which is generated in Ecological Metadata Language, may be available through other repositories serving the ecological research community and represent components of the larger SGS-LTER project collection.\nNo Abstract Available
Resource Title: Website Pointer to html file.
File Name: Web Page, url: https://portal.edirepository.org/nis/mapbrowse?scope=knb-lter-sgs&identifier=808
Webpage with information and links to data files for download
This data package was produced by researchers working on the Shortgrass Steppe Long Term Ecological Research (SGS-LTER) Project, administered at Colorado State University. Long-term datasets and background information (proposals, reports, photographs, etc.) on the SGS-LTER project are contained in a comprehensive project collection within the Digital Collections of Colorado (http://digitool.library.colostate.edu/R/?func=collections&collection_id=3429). The data table and associated metadata document, which is generated in Ecological Metadata Language, may be available through other repositories serving the ecological research community and represent components of the larger SGS-LTER project collection. Additional information and referenced materials can be found: http://hdl.handle.net/10217/83465.\nThirteen colonies of black-tailed prairie dogs were studied within a 264-km2 area of the Central Plains Experimental Range and the Pawnee National Grasslands in Weld County, Colorado. Tissue Collection, DNA Extraction, and microsatellite genotype scoring was performed.
Resource Title: Website Pointer to html file.
File Name: Web Page, url: https://portal.edirepository.org/nis/mapbrowse?scope=knb-lter-sgs&identifier=119
Webpage with information and links to data files for download
This data package was produced by researchers working on the Shortgrass Steppe Long Term Ecological Research (SGS-LTER) Project, administered at Colorado State University. Long-term datasets and background information (proposals, reports, photographs, etc.) on the SGS-LTER project are contained in a comprehensive project collection within the Digital Collections of Colorado (http://digitool.library.colostate.edu/R/?func=collections&collection_id=3429). The data table and associated metadata document, which is generated in Ecological Metadata Language, may be available through other repositories serving the ecological research community and represent components of the larger SGS-LTER project collection. Additional information and referenced materials can be found: http://hdl.handle.net/10217/85531.\nCarbon (C) sequestration potential in grasslands is thought to be high due to the large soil organic carbon pools characteristic of these ecosystems. Inputs of C (aboveground net primary productivity) are highly correlated to precipitation across the Great Plains region; however, changes in C pool size at a specific site are governed by the relative input and output rates across time. Our objective was to quantify the ecosystem C response of three grassland community types (shortgrass steppe, mixed grass and tallgrass prairie) to interannual variation in precipitation. At five sites across a precipitation gradient in the Great Plains, we measured net primary production (NPP), soil respiration (SRESP), and litter decomposition rates for three consecutive years. NPP, SRESP, and litter decomposition increased from shortgrass steppe (175, 454, and 47 g C m-2 yr-1) to tallgrass prairie (408, 1221, and 348 g C m-2 yr-1 for NPP, SRESP, and litter decomposition respectively). Increased growing season precipitation between study years resulted in increased NPP, SRESP, and litter decomposition at almost all sites. However, the regional patterns of the interannual NPP, SRESP, and litter decomposition responses differ from each other. This data suggests NPP and SRESP are more sensitive to interannual changes in precipitation than litter decomposition, and that shortgrass steppe sites are more responsive to interannual variability in precipitation than mixed grass and tallgrass prairie.
Resource Title: Website Pointer to html file.
File Name: Web Page, url: https://portal.edirepository.org/nis/mapbrowse?scope=knb-lter-sgs&identifier=532
Webpage with information and links to data files for download
This data package was produced by researchers working on the Shortgrass Steppe Long Term Ecological Research (SGS-LTER) Project, administered at Colorado State University. Long-term datasets and background information (proposals, reports, photographs, etc.) on the SGS-LTER project are contained in a comprehensive project collection within the Digital Collections of Colorado (http://digitool.library.colostate.edu/R/?func=collections&collection_id=3429). The data table and associated metadata document, which is generated in Ecological Metadata Language, may be available through other repositories serving the ecological research community and represent components of the larger SGS-LTER project collection. Additional information and referenced materials can be found: http://hdl.handle.net/10217/85531.\nCarbon (C) sequestration potential in grasslands is thought to be high due to the large soil organic carbon pools characteristic of these ecosystems. Inputs of C (aboveground net primary productivity) are highly correlated to precipitation across the Great Plains region; however, changes in C pool size at a specific site are governed by the relative input and output rates across time. Our objective was to quantify the ecosystem C response of three grassland community types (shortgrass steppe, mixed grass and tallgrass prairie) to interannual variation in precipitation. At five sites across a precipitation gradient in the Great Plains, we measured net primary production (NPP), soil respiration (SRESP), and litter decomposition rates for three consecutive years. NPP, SRESP, and litter decomposition increased from shortgrass steppe (175, 454, and 47 g C m-2 yr-1) to tallgrass prairie (408, 1221, and 348 g C m-2 yr-1 for NPP, SRESP, and litter decomposition respectively). Increased growing season precipitation between study years resulted in increased NPP, SRESP, and litter decomposition at almost all sites. However, the regional patterns of the interannual NPP, SRESP, and litter decomposition responses differ from each other. This data suggests NPP and SRESP are more sensitive to interannual changes in precipitation than litter decomposition, and that shortgrass steppe sites are more responsive to interannual variability in precipitation than mixed grass and tallgrass prairie.
Resource Title: Website Pointer to html file.
File Name: Web Page, url: https://portal.edirepository.org/nis/mapbrowse?scope=knb-lter-sgs&identifier=536
Webpage with information and links to data files for download
This data package was produced by researchers working on the Shortgrass Steppe Long Term Ecological Research (SGS-LTER) Project, administered at Colorado State University. Long-term datasets and background information (proposals, reports, photographs, etc.) on the SGS-LTER project are contained in a comprehensive project collection within the Digital Collections of Colorado (http://digitool.library.colostate.edu/R/?func=collections&collection_id=3429). The data table and associated metadata document, which is generated in Ecological Metadata Language, may be available through other repositories serving the ecological research community and represent components of the larger SGS-LTER project collection. Additional information and referenced materials can be found: http://hdl.handle.net/10217/85531.\nCarbon (C) sequestration potential in grasslands is thought to be high due to the large soil organic carbon pools characteristic of these ecosystems. Inputs of C (aboveground net primary productivity) are highly correlated to precipitation across the Great Plains region; however, changes in C pool size at a specific site are governed by the relative input and output rates across time. Our objective was to quantify the ecosystem C response of three grassland community types (shortgrass steppe, mixed grass and tallgrass prairie) to interannual variation in precipitation. At five sites across a precipitation gradient in the Great Plains, we measured net primary production (NPP), soil respiration (SRESP), and litter decomposition rates for three consecutive years. NPP, SRESP, and litter decomposition increased from shortgrass steppe (175, 454, and 47 g C m-2 yr-1) to tallgrass prairie (408, 1221, and 348 g C m-2 yr-1 for NPP, SRESP, and litter decomposition respectively). Increased growing season precipitation between study years resulted in increased NPP, SRESP, and litter decomposition at almost all sites. However, the regional patterns of the interannual NPP, SRESP, and litter decomposition responses differ from each other. This data suggests NPP and SRESP are more sensitive to interannual changes in precipitation than litter decomposition, and that shortgrass steppe sites are more responsive to interannual variability in precipitation than mixed grass and tallgrass prairie.
Resource Title: Website Pointer to html file.
File Name: Web Page, url: https://portal.edirepository.org/nis/mapbrowse?scope=knb-lter-sgs&identifier=533
Webpage with information and links to data files for download
This data package was produced by researchers working on the Shortgrass Steppe Long Term Ecological Research (SGS-LTER) Project, administered at Colorado State University. Long-term datasets and background information (proposals, reports, photographs, etc.) on the SGS-LTER project are contained in a comprehensive project collection within the Digital Collections of Colorado (http://digitool.library.colostate.edu/R/?func=collections&collection_id=3429). The data table and associated metadata document, which is generated in Ecological Metadata Language, may be available through other repositories serving the ecological research community and represent components of the larger SGS-LTER project collection. Additional information and referenced materials can be found: http://hdl.handle.net/10217/83512.\nWe investigated the use of prairie dog towns by cattle (Bos taurus) on the shortgrass steppe of northeastern Colorado by conducting surveys of cattle and vegetation from June to August 1999. Cattle presence and behavior were recorded 3 times a week during driving surveys of 15 black-tailed prairie dog (Cynomys ludovicianus) towns. A subset of 3 pastures with prairie dog towns was intensively surveyed twice weekly wherein the habitat and activity of a randomly chosen focal animal was recorded every 6 minutes for 3.5 hours. Bite and step counts of other individuals were recorded for 5-minute intervals. Vegetation height and cover data were collected monthly on each of 6 habitats. Results from driving surveys and intensively surveyed pastures were similar; cattle neither significantly preferred nor avoided prairie dog towns. Bare ground cover on prairie dog towns did not significantly differ from most other habitats, but vegetation on prairie dog towns was significantly shorter on (mean = 6.7 cm) than that off (mean = 11.9 cm) prairie dog towns. Nevertheless, foraging observations indicated that there was no significant difference between cattle foraging rates on swales (70.9 bites/min) and prairie dog towns (69.5 bites/min). Thus, cattle on the shortgrass steppe appear to use prairie dog towns in proportion to their availability and, while there, they graze as intensively as they do on habitats not inhabited by prairie dogs.
Resource Title: Website Pointer to html file.
File Name: Web Page, url: https://portal.edirepository.org/nis/mapbrowse?scope=knb-lter-sgs&identifier=525
Webpage with information and links to data files for download
This data package was produced by researchers working on the Shortgrass Steppe Long Term Ecological Research (SGS-LTER) Project, administered at Colorado State University. Long-term datasets and background information (proposals, reports, photographs, etc.) on the SGS-LTER project are contained in a comprehensive project collection within the Digital Collections of Colorado (http://digitool.library.colostate.edu/R/?func=collections&collection_id=3429). The data table and associated metadata document, which is generated in Ecological Metadata Language, may be available through other repositories serving the ecological research community and represent components of the larger SGS-LTER project collection. Additional information and referenced materials can be found: http://hdl.handle.net/10217/83512.\nWe investigated the use of prairie dog towns by cattle (Bos taurus) on the shortgrass steppe of northeastern Colorado by conducting surveys of cattle and vegetation from June to August 1999. Cattle presence and behavior were recorded 3 times a week during driving surveys of 15 black-tailed prairie dog (Cynomys ludovicianus) towns. A subset of 3 pastures with prairie dog towns was intensively surveyed twice weekly wherein the habitat and activity of a randomly chosen focal animal was recorded every 6 minutes for 3.5 hours. Bite and step counts of other individuals were recorded for 5-minute intervals. Vegetation height and cover data were collected monthly on each of 6 habitats. Results from driving surveys and intensively surveyed pastures were similar; cattle neither significantly preferred nor avoided prairie dog towns. Bare ground cover on prairie dog towns did not significantly differ from most other habitats, but vegetation on prairie dog towns was significantly shorter on (mean = 6.7 cm) than that off (mean = 11.9 cm) prairie dog towns. Nevertheless, foraging observations indicated that there was no significant difference between cattle foraging rates on swales (70.9 bites/min) and prairie dog towns (69.5 bites/min). Thus, cattle on the shortgrass steppe appear to use prairie dog towns in proportion to their availability and, while there, they graze as intensively as they do on habitats not inhabited by prairie dogs.
Resource Title: Website Pointer to html file.
File Name: Web Page, url: https://portal.edirepository.org/nis/mapbrowse?scope=knb-lter-sgs&identifier=526
Webpage with information and links to data files for download
This data package was produced by researchers working on the Shortgrass Steppe Long Term Ecological Research (SGS-LTER) Project, administered at Colorado State University. Long-term datasets and background information (proposals, reports, photographs, etc.) on the SGS-LTER project are contained in a comprehensive project collection within the Digital Collections of Colorado (http://digitool.library.colostate.edu/R/?func=collections&collection_id=3429). The data table and associated metadata document, which is generated in Ecological Metadata Language, may be available through other repositories serving the ecological research community and represent components of the larger SGS-LTER project collection. Additional information and referenced materials can be found: http://hdl.handle.net/10217/85531.\nCarbon (C) sequestration potential in grasslands is thought to be high due to the large soil organic carbon pools characteristic of these ecosystems. Inputs of C (aboveground net primary productivity) are highly correlated to precipitation across the Great Plains region; however, changes in C pool size at a specific site are governed by the relative input and output rates across time. Our objective was to quantify the ecosystem C response of three grassland community types (shortgrass steppe, mixed grass and tallgrass prairie) to interannual variation in precipitation. At five sites across a precipitation gradient in the Great Plains, we measured net primary production (NPP), soil respiration (SRESP), and litter decomposition rates for three consecutive years. NPP, SRESP, and litter decomposition increased from shortgrass steppe (175, 454, and 47 g C m-2 yr-1) to tallgrass prairie (408, 1221, and 348 g C m-2 yr-1 for NPP, SRESP, and litter decomposition respectively). Increased growing season precipitation between study years resulted in increased NPP, SRESP, and litter decomposition at almost all sites. However, the regional patterns of the interannual NPP, SRESP, and litter decomposition responses differ from each other. This data suggests NPP and SRESP are more sensitive to interannual changes in precipitation than litter decomposition, and that shortgrass steppe sites are more responsive to interannual variability in precipitation than mixed grass and tallgrass prairie.
Resource Title: Website Pointer to html file.
File Name: Web Page, url: https://portal.edirepository.org/nis/mapbrowse?scope=knb-lter-sgs&identifier=534
Webpage with information and links to data files for download
This data package was produced by researchers working on the Shortgrass Steppe Long Term Ecological Research (SGS-LTER) Project, administered at Colorado State University. Long-term datasets and background information (proposals, reports, photographs, etc.) on the SGS-LTER project are contained in a comprehensive project collection within the Digital Collections of Colorado (http://digitool.library.colostate.edu/R/?func=collections&collection_id=3429). The data table and associated metadata document, which is generated in Ecological Metadata Language, may be available through other repositories serving the ecological research community and represent components of the larger SGS-LTER project collection. Additional information and referenced materials can be found: http://hdl.handle.net/10217/85531.\nCarbon (C) sequestration potential in grasslands is thought to be high due to the large soil organic carbon pools characteristic of these ecosystems. Inputs of C (aboveground net primary productivity) are highly correlated to precipitation across the Great Plains region; however, changes in C pool size at a specific site are governed by the relative input and output rates across time. Our objective was to quantify the ecosystem C response of three grassland community types (shortgrass steppe, mixed grass and tallgrass prairie) to interannual variation in precipitation. At five sites across a precipitation gradient in the Great Plains, we measured net primary production (NPP), soil respiration (SRESP), and litter decomposition rates for three consecutive years. NPP, SRESP, and litter decomposition increased from shortgrass steppe (175, 454, and 47 g C m-2 yr-1) to tallgrass prairie (408, 1221, and 348 g C m-2 yr-1 for NPP, SRESP, and litter decomposition respectively). Increased growing season precipitation between study years resulted in increased NPP, SRESP, and litter decomposition at almost all sites. However, the regional patterns of the interannual NPP, SRESP, and litter decomposition responses differ from each other. This data suggests NPP and SRESP are more sensitive to interannual changes in precipitation than litter decomposition, and that shortgrass steppe sites are more responsive to interannual variability in precipitation than mixed grass and tallgrass prairie.
Resource Title: Website Pointer to html file.
File Name: Web Page, url: https://portal.edirepository.org/nis/mapbrowse?scope=knb-lter-sgs&identifier=537
Webpage with information and links to data files for download
This data package was produced by researchers working on the Shortgrass Steppe Long Term Ecological Research (SGS-LTER) Project, administered at Colorado State University. Long-term datasets and background information (proposals, reports, photographs, etc.) on the SGS-LTER project are contained in a comprehensive project collection within the Digital Collections of Colorado (http://digitool.library.colostate.edu/R/?func=collections&collection_id=3429). The data table and associated metadata document, which is generated in Ecological Metadata Language, may be available through other repositories serving the ecological research community and represent components of the larger SGS-LTER project collection. Additional information and referenced materials can be found: http://hdl.handle.net/10217/85531.\nCarbon (C) sequestration potential in grasslands is thought to be high due to the large soil organic carbon pools characteristic of these ecosystems. Inputs of C (aboveground net primary productivity) are highly correlated to precipitation across the Great Plains region; however, changes in C pool size at a specific site are governed by the relative input and output rates across time. Our objective was to quantify the ecosystem C response of three grassland community types (shortgrass steppe, mixed grass and tallgrass prairie) to interannual variation in precipitation. At five sites across a precipitation gradient in the Great Plains, we measured net primary production (NPP), soil respiration (SRESP), and litter decomposition rates for three consecutive years. NPP, SRESP, and litter decomposition increased from shortgrass steppe (175, 454, and 47 g C m-2 yr-1) to tallgrass prairie (408, 1221, and 348 g C m-2 yr-1 for NPP, SRESP, and litter decomposition respectively). Increased growing season precipitation between study years resulted in increased NPP, SRESP, and litter decomposition at almost all sites. However, the regional patterns of the interannual NPP, SRESP, and litter decomposition responses differ from each other. This data suggests NPP and SRESP are more sensitive to interannual changes in precipitation than litter decomposition, and that shortgrass steppe sites are more responsive to interannual variability in precipitation than mixed grass and tallgrass prairie.
Resource Title: Website Pointer to html file.
File Name: Web Page, url: https://portal.edirepository.org/nis/mapbrowse?scope=knb-lter-sgs&identifier=538
Webpage with information and links to data files for download
This data package was produced by researchers working on the Shortgrass Steppe Long Term Ecological Research (SGS-LTER) Project, administered at Colorado State University. Long-term datasets and background information (proposals, reports, photographs, etc.) on the SGS-LTER project are contained in a comprehensive project collection within the Digital Collections of Colorado (http://digitool.library.colostate.edu/R/?func=collections&collection_id=3429). The data table and associated metadata document, which is generated in Ecological Metadata Language, may be available through other repositories serving the ecological research community and represent components of the larger SGS-LTER project collection. Additional information and referenced materials can be found: http://hdl.handle.net/10217/85531.\nCarbon (C) sequestration potential in grasslands is thought to be high due to the large soil organic carbon pools characteristic of these ecosystems. Inputs of C (aboveground net primary productivity) are highly correlated to precipitation across the Great Plains region; however, changes in C pool size at a specific site are governed by the relative input and output rates across time. Our objective was to quantify the ecosystem C response of three grassland community types (shortgrass steppe, mixed grass and tallgrass prairie) to interannual variation in precipitation. At five sites across a precipitation gradient in the Great Plains, we measured net primary production (NPP), soil respiration (SRESP), and litter decomposition rates for three consecutive years. NPP, SRESP, and litter decomposition increased from shortgrass steppe (175, 454, and 47 g C m-2 yr-1) to tallgrass prairie (408, 1221, and 348 g C m-2 yr-1 for NPP, SRESP, and litter decomposition respectively). Increased growing season precipitation between study years resulted in increased NPP, SRESP, and litter decomposition at almost all sites. However, the regional patterns of the interannual NPP, SRESP, and litter decomposition responses differ from each other. This data suggests NPP and SRESP are more sensitive to interannual changes in precipitation than litter decomposition, and that shortgrass steppe sites are more responsive to interannual variability in precipitation than mixed grass and tallgrass prairie.
Resource Title: Website Pointer to html file.
File Name: Web Page, url: https://portal.edirepository.org/nis/mapbrowse?scope=knb-lter-sgs&identifier=535
Webpage with information and links to data files for download
This data package was produced by researchers working on the Shortgrass Steppe Long Term Ecological Research (SGS-LTER) Project, administered at Colorado State University. Long-term datasets and background information (proposals, reports, photographs, etc.) on the SGS-LTER project are contained in a comprehensive project collection within the Digital Collections of Colorado (http://digitool.library.colostate.edu/R/?func=collections&collection_id=3429). The data table and associated metadata document, which is generated in Ecological Metadata Language, may be available through other repositories serving the ecological research community and represent components of the larger SGS-LTER project collection.\nLong-term (1985-1992) dynamics and spatial variations in soil water below the evaporative zone were evaluated for a shortgrass steppe with a low and variable precipitation regime. Each of sandy loam, clay loam, and two sandy clay loam sites compromised a toposequence with upland, midslope, and lowland positions. Soil water was monitored at 15cm intervals providing estimates covering 22.5 to 97.5 cm depths. Soil water throughout the profile was highest in the clay loam and lowest in the sandy loam. However, stored soil water did not vary systematically among slope positions. Additional information and referenced materials can be found: http://hdl.handle.net/10217/82912
Resource Title: Website Pointer to html file.
File Name: Web Page, url: https://portal.edirepository.org/nis/mapbrowse?scope=knb-lter-sgs&identifier=152
Webpage with information and links to data files for download
This data package was produced by researchers working on the Shortgrass Steppe Long Term Ecological Research (SGS-LTER) Project, administered at Colorado State University. Long-term datasets and background information (proposals, reports, photographs, etc.) on the SGS-LTER project are contained in a comprehensive project collection within the Digital Collections of Colorado (http://digitool.library.colostate.edu/R/?func=collections&collection_id=3429). The data table and associated metadata document, which is generated in Ecological Metadata Language, may be available through other repositories serving the ecological research community and represent components of the larger SGS-LTER project collection.\nLong-term (1985-1992) dynamics and spatial variations in soil water below the evaporative zone were evaluated for a shortgrass steppe with a low and variable precipitation regime. Each of sandy loam, clay loam, and two sandy clay loam sites compromised a toposequence with upland, midslope, and lowland positions. Soil water was monitored at 15cm intervals providing estimates covering 22.5 to 97.5 cm depths. Soil water throughout the profile was highest in the clay loam and lowest in the sandy loam. However, stored soil water did not vary systematically among slope positions. Additional information and referenced materials can be found: http://hdl.handle.net/10217/82912
Resource Title: Website Pointer to html file.
File Name: Web Page, url: https://portal.edirepository.org/nis/mapbrowse?scope=knb-lter-sgs&identifier=147
Webpage with information and links to data files for download
This data package was produced by researchers working on the Shortgrass Steppe Long Term Ecological Research (SGS-LTER) Project, administered at Colorado State University. Long-term datasets and background information (proposals, reports, photographs, etc.) on the SGS-LTER project are contained in a comprehensive project collection within the Digital Collections of Colorado (http://digitool.library.colostate.edu/R/?func=collections&collection_id=3429). The data table and associated metadata document, which is generated in Ecological Metadata Language, may be available through other repositories serving the ecological research community and represent components of the larger SGS-LTER project collection.\nLong-term (1985-1992) dynamics and spatial variations in soil water below the evaporative zone were evaluated for a shortgrass steppe with a low and variable precipitation regime. Each of sandy loam, clay loam, and two sandy clay loam sites compromised a toposequence with upland, midslope, and lowland positions. Soil water was monitored at 15cm intervals providing estimates covering 22.5 to 97.5 cm depths. Soil water throughout the profile was highest in the clay loam and lowest in the sandy loam. However, stored soil water did not vary systematically among slope positions. Additional information and referenced materials can be found: http://hdl.handle.net/10217/82912
Resource Title: Website Pointer to html file.
File Name: Web Page, url: https://portal.edirepository.org/nis/mapbrowse?scope=knb-lter-sgs&identifier=150
Webpage with information and links to data files for download
This data package was produced by researchers working on the Shortgrass Steppe Long Term Ecological Research (SGS-LTER) Project, administered at Colorado State University. Long-term datasets and background information (proposals, reports, photographs, etc.) on the SGS-LTER project are contained in a comprehensive project collection within the Digital Collections of Colorado (http://digitool.library.colostate.edu/R/?func=collections&collection_id=3429). The data table and associated metadata document, which is generated in Ecological Metadata Language, may be available through other repositories serving the ecological research community and represent components of the larger SGS-LTER project collection.\nLong-term (1985-1992) dynamics and spatial variations in soil water below the evaporative zone were evaluated for a shortgrass steppe with a low and variable precipitation regime. Each of sandy loam, clay loam, and two sandy clay loam sites compromised a toposequence with upland, midslope, and lowland positions. Soil water was monitored at 15cm intervals providing estimates covering 22.5 to 97.5 cm depths. Soil water throughout the profile was highest in the clay loam and lowest in the sandy loam. However, stored soil water did not vary systematically among slope positions. Additional information and referenced materials can be found: http://hdl.handle.net/10217/82912
Resource Title: Website Pointer to html file.
File Name: Web Page, url: https://portal.edirepository.org/nis/mapbrowse?scope=knb-lter-sgs&identifier=151
Webpage with information and links to data files for download
This data package was produced by researchers working on the Shortgrass Steppe Long Term Ecological Research (SGS-LTER) Project, administered at Colorado State University. Long-term datasets and background information (proposals, reports, photographs, etc.) on the SGS-LTER project are contained in a comprehensive project collection within the Digital Collections of Colorado (http://digitool.library.colostate.edu/R/?func=collections&collection_id=3429). The data table and associated metadata document, which is generated in Ecological Metadata Language, may be available through other repositories serving the ecological research community and represent components of the larger SGS-LTER project collection.\nLong-term (1985-1992) dynamics and spatial variations in soil water below the evaporative zone were evaluated for a shortgrass steppe with a low and variable precipitation regime. Each of sandy loam, clay loam, and two sandy clay loam sites compromised a toposequence with upland, midslope, and lowland positions. Soil water was monitored at 15cm intervals providing estimates covering 22.5 to 97.5 cm depths. Soil water throughout the profile was highest in the clay loam and lowest in the sandy loam. However, stored soil water did not vary systematically among slope positions. Additional information and referenced materials can be found: http://hdl.handle.net/10217/82912
Resource Title: Website Pointer to html file.
File Name: Web Page, url: https://portal.edirepository.org/nis/mapbrowse?scope=knb-lter-sgs&identifier=149
Webpage with information and links to data files for download
This data package was produced by researchers working on the Shortgrass Steppe Long Term Ecological Research (SGS-LTER) Project, administered at Colorado State University. Long-term datasets and background information (proposals, reports, photographs, etc.) on the SGS-LTER project are contained in a comprehensive project collection within the Digital Collections of Colorado (http://digitool.library.colostate.edu/R/?func=collections&collection_id=3429). The data table and associated metadata document, which is generated in Ecological Metadata Language, may be available through other repositories serving the ecological research community and represent components of the larger SGS-LTER project collection.\nLong-term (1985-1992) dynamics and spatial variations in soil water below the evaporative zone were evaluated for a shortgrass steppe with a low and variable precipitation regime. Each of sandy loam, clay loam, and two sandy clay loam sites compromised a toposequence with upland, midslope, and lowland positions. Soil water was monitored at 15cm intervals providing estimates covering 22.5 to 97.5 cm depths. Soil water throughout the profile was highest in the clay loam and lowest in the sandy loam. However, stored soil water did not vary systematically among slope positions. Additional information and referenced materials can be found: http://hdl.handle.net/10217/82912
Resource Title: Website Pointer to html file.
File Name: Web Page, url: https://portal.edirepository.org/nis/mapbrowse?scope=knb-lter-sgs&identifier=148
Webpage with information and links to data files for download
This data package was produced by researchers working on the Shortgrass Steppe Long Term Ecological Research (SGS-LTER) Project, administered at Colorado State University. Long-term datasets and background information (proposals, reports, photographs, etc.) on the SGS-LTER project are contained in a comprehensive project collection within the Digital Collections of Colorado (http://digitool.library.colostate.edu/R/?func=collections&collection_id=3429). The data table and associated metadata document, which is generated in Ecological Metadata Language, may be available through other repositories serving the ecological research community and represent components of the larger SGS-LTER project collection.\nIn a 10-year study, we assessed the influence of five carbon (C) treatments on the labile C and nitrogen (N) pools of historically N enriched plots on the Shortgrass Steppe Long Term Ecological Research site located in northeastern Colorado. For eight years, we applied sawdust, sugar, industrial lignin, sawdust + sugar, and lignin + sugar to plots that had received N and water additions in the early 1970s. Previous work showed that past water and N additions altered plant species composition and enhanced rates of nutrient cycling; these effects were still apparent 25 years later. We hypothesized that labile C amendments would stimulate microbial activity and suppress rates of N mineralization, whereas complex forms of carbon (sawdust and lignin) could enhance humification and lead to longer-term reductions in N availability. Results indicated that of the five carbon treatments, sugar, sawdust, and sawdust + sugar suppressed N availability, with sawdust + sugar being the most effective treatment to reduce N availability. The year after treatments stopped, N availability remained less in the sawdust + sugar treatment plots than in the high-N control plots. Three years after treatments ended, reductions in N availability were smaller (40-60%). Our results suggest that highly labile forms of carbon generate strong short- term N sinks, but these effects dissipate within one year of application, and that more recalcitrant forms reduce N longer. Sawdust + sugar was the most effective treatment to decrease exotic species canopy cover and increase native species density over the long term. Labile carbon had neither short- nor long-term effects on exotic species. Even though the organic amendments did not contribute to recovery of the dominant native species Bouteloua gracilis, they were effective in increasing another native species, Carex eleocharis. These results indicate that organic amendments may be a useful tool for restoring some native species in the shortgrass steppe.
Resource Title: Website Pointer to html file.
File Name: Web Page, url: https://portal.edirepository.org/nis/mapbrowse?scope=knb-lter-sgs&identifier=540
Webpage with information and links to data files for download
This data package was produced by researchers working on the Shortgrass Steppe Long Term Ecological Research (SGS-LTER) Project, administered at Colorado State University. Long-term datasets and background information (proposals, reports, photographs, etc.) on the SGS-LTER project are contained in a comprehensive project collection within the Digital Collections of Colorado (http://digitool.library.colostate.edu/R/?func=collections&collection_id=3429). The data table and associated metadata document, which is generated in Ecological Metadata Language, may be available through other repositories serving the ecological research community and represent components of the larger SGS-LTER project collection. Additional information and referenced materials can be found: http://hdl.handle.net/10217/85547.\nIn a 10-year study, we assessed the influence of five carbon (C) treatments on the labile C and nitrogen (N) pools of historically N enriched plots on the Shortgrass Steppe Long Term Ecological Research site located in northeastern Colorado. For eight years, we applied sawdust, sugar, industrial lignin, sawdust + sugar, and lignin + sugar to plots that had received N and water additions in the early 1970s. Previous work showed that past water and N additions altered plant species composition and enhanced rates of nutrient cycling; these effects were still apparent 25 years later. We hypothesized that labile C amendments would stimulate microbial activity and suppress rates of N mineralization, whereas complex forms of carbon (sawdust and lignin) could enhance humification and lead to longer-term reductions in N availability. Results indicated that of the five carbon treatments, sugar, sawdust, and sawdust + sugar suppressed N availability, with sawdust + sugar being the most effective treatment to reduce N availability. The year after treatments stopped, N availability remained less in the sawdust + sugar treatment plots than in the high-N control plots. Three years after treatments ended, reductions in N availability were smaller (40-60%). Our results suggest that highly labile forms of carbon generate strong short- term N sinks, but these effects dissipate within one year of application, and that more recalcitrant forms reduce N longer. Sawdust + sugar was the most effective treatment to decrease exotic species canopy cover and increase native species density over the long term. Labile carbon had neither short- nor long-term effects on exotic species. Even though the organic amendments did not contribute to recovery of the dominant native species Bouteloua gracilis, they were effective in increasing another native species, Carex eleocharis. These results indicate that organic amendments may be a useful tool for restoring some native species in the shortgrass steppe.
Resource Title: Website Pointer to html file.
File Name: Web Page, url: https://portal.edirepository.org/nis/mapbrowse?scope=knb-lter-sgs&identifier=539
Webpage with information and links to data files for download
This data package was produced by researchers working on the Shortgrass Steppe Long Term Ecological Research (SGS-LTER) Project, administered at Colorado State University. Long-term datasets and background information (proposals, reports, photographs, etc.) on the SGS-LTER project are contained in a comprehensive project collection within the Digital Collections of Colorado (http://digitool.library.colostate.edu/R/?func=collections&collection_id=3429). The data table and associated metadata document, which is generated in Ecological Metadata Language, may be available through other repositories serving the ecological research community and represent components of the larger SGS-LTER project collection. Additional information and referenced materials can be found: http://hdl.handle.net/10217/85547.\nIn a 10-year study, we assessed the influence of five carbon (C) treatments on the labile C and nitrogen (N) pools of historically N enriched plots on the Shortgrass Steppe Long Term Ecological Research site located in northeastern Colorado. For eight years, we applied sawdust, sugar, industrial lignin, sawdust + sugar, and lignin + sugar to plots that had received N and water additions in the early 1970s. Previous work showed that past water and N additions altered plant species composition and enhanced rates of nutrient cycling; these effects were still apparent 25 years later. We hypothesized that labile C amendments would stimulate microbial activity and suppress rates of N mineralization, whereas complex forms of carbon (sawdust and lignin) could enhance humification and lead to longer-term reductions in N availability. Results indicated that of the five carbon treatments, sugar, sawdust, and sawdust + sugar suppressed N availability, with sawdust + sugar being the most effective treatment to reduce N availability. The year after treatments stopped, N availability remained less in the sawdust + sugar treatment plots than in the high-N control plots. Three years after treatments ended, reductions in N availability were smaller (40-60%). Our results suggest that highly labile forms of carbon generate strong short- term N sinks, but these effects dissipate within one year of application, and that more recalcitrant forms reduce N longer. Sawdust + sugar was the most effective treatment to decrease exotic species canopy cover and increase native species density over the long term. Labile carbon had neither short- nor long-term effects on exotic species. Even though the organic amendments did not contribute to recovery of the dominant native species Bouteloua gracilis, they were effective in increasing another native species, Carex eleocharis. These results indicate that organic amendments may be a useful tool for restoring some native species in the shortgrass steppe.
Resource Title: Website Pointer to html file.
File Name: Web Page, url: https://portal.edirepository.org/nis/mapbrowse?scope=knb-lter-sgs&identifier=541
Webpage with information and links to data files for download
This data package was produced by researchers working on the Shortgrass Steppe Long Term Ecological Research (SGS-LTER) Project, administered at Colorado State University. Long-term datasets and background information (proposals, reports, photographs, etc.) on the SGS-LTER project are contained in a comprehensive project collection within the Digital Collections of Colorado (http://digitool.library.colostate.edu/R/?func=collections&collection_id=3429). The data table and associated metadata document, which is generated in Ecological Metadata Language, may be available through other repositories serving the ecological research community and represent components of the larger SGS-LTER project collection.
Resource Title: Website Pointer to html file.
File Name: Web Page, url: https://portal.edirepository.org/nis/mapbrowse?scope=knb-lter-sgs&identifier=133
Webpage with information and links to data files for download
This data package was produced by researchers working on the Shortgrass Steppe Long Term Ecological Research (SGS-LTER) Project, administered at Colorado State University. Long-term datasets and background information (proposals, reports, photographs, etc.) on the SGS-LTER project are contained in a comprehensive project collection within the Digital Collections of Colorado (http://digitool.library.colostate.edu/R/?func=collections&collection_id=3429). The data table and associated metadata document, which is generated in Ecological Metadata Language, may be available through other repositories serving the ecological research community and represent components of the larger SGS-LTER project collection. Additional information and referenced materials can be found: http://hdl.handle.net/10217/83462.\nAboveground plant nitrogen dynamics monitoring consists of two separate data sets. a) Long-term peak-crop nitrogen concentrations have been sampled since 1983 annually from sites sampled for ANPP estimates across the CPER. Plots are clipped for ANPP in August each year and include moderately grazed sites in sections 24 and 25, ungrazed treatments at ESA and owl creek, coarse textured soils in owl creek, fine textured soils in section 25, as well as three catena topopositions in section 24. These datasets have been designed for monitoring and so it is advised to consider calcuating average based at the transect level. B) Seasonal dynamics of life-form (dominant grass, forb, shrub species) nitrogen concentrations were obtained from random grab samples of aboveground plant tissue are taken monthly from May-Aug. and in Oct., Dec., Feb., and April from 1983 – 2007 at sites where ANPP has been collected since 1983 (ESA, ridge, mid-slope and swale in section 24). The objectives are to assess annual/seasonal weather and site productivity/management with quantity and quality of forage and/or litter production. Combined, these two data sets also provide an estimate of nitrogen yield. These data can be linked with secondary producer data sets such as annual cattle weight gains, grasshopper abundance, small mammal monitoring, etc., to assess how forage/plant tissue quantity and quality drive population dynamics.
Resource Title: Website Pointer to html file.
File Name: Web Page, url: https://portal.edirepository.org/nis/mapbrowse?scope=knb-lter-sgs&identifier=143
Webpage with information and links to data files for download
This data package was produced by researchers working on the Shortgrass Steppe Long Term Ecological Research (SGS-LTER) Project, administered at Colorado State University. Long-term datasets and background information (proposals, reports, photographs, etc.) on the SGS-LTER project are contained in a comprehensive project collection within the Digital Collections of Colorado (http://digitool.library.colostate.edu/R/?func=collections&collection_id=3429). The data table and associated metadata document, which is generated in Ecological Metadata Language, may be available through other repositories serving the ecological research community and represent components of the larger SGS-LTER project collection. Additional information and referenced materials can be found: http://hdl.handle.net/10217/83462.\nAboveground plant nitrogen dynamics monitoring consists of two separate data sets. a) Long-term peak-crop nitrogen concentrations have been sampled since 1983 annually from sites sampled for ANPP estimates across the CPER. Plots are clipped for ANPP in August each year and include moderately grazed sites in sections 24 and 25, ungrazed treatments at ESA and owl creek, coarse textured soils in owl creek, fine textured soils in section 25, as well as three catena topopositions in section 24. These datasets have been designed for monitoring and so it is advised to consider calcuating average based at the transect level. B) Seasonal dynamics of life-form (dominant grass, forb, shrub species) nitrogen concentrations were obtained from random grab samples of aboveground plant tissue are taken monthly from May-Aug. and in Oct., Dec., Feb., and April from 1983 – 2007 at sites where ANPP has been collected since 1983 (ESA, ridge, mid-slope and swale in section 24). The objectives are to assess annual/seasonal weather and site productivity/management with quantity and quality of forage and/or litter production. Combined, these two data sets also provide an estimate of nitrogen yield. These data can be linked with secondary producer data sets such as annual cattle weight gains, grasshopper abundance, small mammal monitoring, etc., to assess how forage/plant tissue quantity and quality drive population dynamics.
Resource Title: Website Pointer to html file.
File Name: Web Page, url: https://portal.edirepository.org/nis/mapbrowse?scope=knb-lter-sgs&identifier=142
Webpage with information and links to data files for download
This data package was produced by researchers working on the Shortgrass Steppe Long Term Ecological Research (SGS-LTER) Project, administered at Colorado State University. Long-term datasets and background information (proposals, reports, photographs, etc.) on the SGS-LTER project are contained in a comprehensive project collection within the Digital Collections of Colorado (http://digitool.library.colostate.edu/R/?func=collections&collection_id=3429). The data table and associated metadata document, which is generated in Ecological Metadata Language, may be available through other repositories serving the ecological research community and represent components of the larger SGS-LTER project collection. Additional information and referenced materials can be found: http://hdl.handle.net/10217/83452.\nBody size is a fundamental biological measurement that is known to be related to an organism's physiology, life-history and ecology. Estimates of body size are also widely used in comparative evolutionary and ecological studies, including food web and diet studies that require estimates of biomass. Beginning in 1994, small mammals are live-trapped twice each year on the three grassland and three shrubland trapping webs. Individuals are weighed (to nearest 0.5 g using a Pesola spring scale) when first captured during a given trapping session but not upon recapture during the same session. Weights are calculated by subtracting the weight of an empty capture (ziploc) bag from the weight of animal in the bag. Individuals are classified into age classes (adult, subadult, juvenile) in the field based on a combination of size and pelage characteristics. This dataset gives means, standard deviations, minimum and maximum values for body weight, in grams, of small mammals captured between September 1994 and September 2008. All sites and sampling periods were combined. Most individuals (~93%) were classified as new captures, although a few individuals that were captured multiple times across different trapping sessions may appear in the dataset more than once. Values may differ from estimates calculated using the entire capture dataset because age and weight data were screened more closely to omit obvious errors and outliers.
Resource Title: Website Pointer to html file.
File Name: Web Page, url: https://portal.edirepository.org/nis/mapbrowse?scope=knb-lter-sgs&identifier=138
Webpage with information and links to data files for download
This data package was produced by researchers working on the Shortgrass Steppe Long Term Ecological Research (SGS-LTER) Project, administered at Colorado State University. Long-term datasets and background information (proposals, reports, photographs, etc.) on the SGS-LTER project are contained in a comprehensive project collection within the Digital Collections of Colorado (http://digitool.library.colostate.edu/R/?func=collections&collection_id=3429). The data table and associated metadata document, which is generated in Ecological Metadata Language, may be available through other repositories serving the ecological research community and represent components of the larger SGS-LTER project collection. Additional information and referenced materials can be found: http://hdl.handle.net/10217/83452.\nSmall mammals (rabbits, rodents) are integral components of semiarid ecosystems because of their roles as consumers of plants, seeds and arthropods, as soil disturbance agents, and as food for raptors, snakes and mammalian carnivores. Because of their vagility and intermediate trophic position, populations of small mammals may track changes in vegetation and the abiotic environment that may result from shifts in land-use and other anthropogenic disturbances. However, these populations are variable over space and time, and their response to environmental changes may not be immediately apparent given their behavioral flexibility and relatively long life-spans and generation times. Patterns in the distribution and abundance of small mammals thus may simultaneously reflect and affect the stability of the shortgrass-steppe ecosystem. Long-term studies of population and community dynamics therefore are needed to fully understand the role of small mammals in grassland ecosystems. In 1994, we implemented a sampling scheme to monitor long-term changes in relative abundance of small mammals in representative habitats of shortgrass steppe. We live-trapped nocturnal rodents twice each year (spring, late summer) on trapping webs in upland prairie (GRASS) and saltbush-dominated (SHRUB) habitats. Three 3.14-ha webs were established in each habitat. Each web had 124 Sherman traps, which were spaced 10-m apart on 12 100-m spokes, with 30 degrees between spokes. Four traps were set in the center of the web. Traps were set for four consecutive nights in each trapping session. Traps are baited with a mix of peanut butter and oats, set in the evening and checked (and closed) at dawn. We recorded sex, age and weight upon first capture of all individuals. In the early years of the study, individuals were batch-marked (Sharpie colored felt markers) to distinguish recaptures from new individuals, providing the minimum information necessary to use distance-sampling methods to estimate density. Most nocturnal species are now usually marked with aluminum ear tags, although we continue to mark very small (pocket mice) or small-eared (voles) species only with felt pens. For ear-tagged animals, we distinguish new captures (N) from individuals marked during previous sessions (old, O), versus those that are recaptured (R) on 2nd, 3rd or 4th nights of a trapping session. The location of one trapping web was changed from 13NE (1994-1997) to 13SW (1998- present) because of concerns about intensive cattle use in the pasture, as well as activity of CPER Site Manager’s cats.
Resource Title: Website Pointer to html file.
File Name: Web Page, url: https://portal.edirepository.org/nis/mapbrowse?scope=knb-lter-sgs&identifier=137
Webpage with information and links to data files for download
This data package was produced by researchers working on the Shortgrass Steppe Long Term Ecological Research (SGS-LTER) Project, administered at Colorado State University. Long-term datasets and background information (proposals, reports, photographs, etc.) on the SGS-LTER project are contained in a comprehensive project collection within the Digital Collections of Colorado (http://digitool.library.colostate.edu/R/?func=collections&collection_id=3429). The data table and associated metadata document, which is generated in Ecological Metadata Language, may be available through other repositories serving the ecological research community and represent components of the larger SGS-LTER project collection. Additional information and referenced materials can be found: http://hdl.handle.net/10217/83456.\nSmall mammals (rabbits, rodents) are integral components of semiarid ecosystems because of their roles as consumers of plants, seeds and arthropods, as soil disturbance agents, and as food for raptors, snakes and mammalian carnivores. Because of their vagility and intermediate trophic position, populations of small mammals may track changes in vegetation and the abiotic environment that may result from shifts in land-use and other anthropogenic disturbances. However, these populations are variable over space and time, and their response to environmental changes may not be immediately apparent given their behavioral flexibility and relatively long life-spans and generation times. Patterns in the distribution and abundance of small mammals thus may simultaneously reflect and affect the stability of the shortgrass-steppe ecosystem. Long-term studies of population and community dynamics therefore are needed to fully understand the role of small mammals in grassland ecosystems. Thirteen-lined ground squirrels (Spermophilus tridecemlineatus, SPTR) are the most widely distributed rodent species in shortgrass steppe and the most important in terms of abundance and biomass. Like most rodents in shortgrass steppe, they are omnivorous; unlike other species, however, they are diurnal and active aboveground only 5-6 months each year, and therefore required a separate sampling scheme from other rodents. In 1999, we initiated studies to track long-term changes in relative abundance of ground squirrels in representative habitats of shortgrass steppe. We live-trapped squirrels twice each year, which corresponded to periods of high aboveground activity of adults (early June, SPR) and the emergence of juveniles (mid-July, SUM). Three 3.14-ha webs were established in upland prairie (GRASS) and saltbush-dominated (SHRUB) habitats. Each web had 62 Sherman traps, which were spaced 20-m apart on 12 100-m spokes, with 30 degrees between spokes. Two traps were set in the center of the web. Traps were set for four consecutive mornings in each trapping session. Traps were baited with a mix of peanut butter and oats, set at dawn and closed 4-6 hours later. Traps were shaded with pieces of PVC pipe to reduce heat mortality in traps. We recorded sex, age and weight upon first capture of all individuals. Because the ears of squirrels are too small to consistently hold ear tags, all individuals were batch-marked with a colored Sharpie felt marker to distinguish recaptures ® from new (N) individuals, providing the minimum information necessary to use distance-sampling methods to estimate density. NOTE: In this dataset, ages and weights may not correspond well. Weight, combined with sampling date, can be used to better determine age class; contact Paul Stapp for more information.
Resource Title: Website Pointer to html file.
File Name: Web Page, url: https://portal.edirepository.org/nis/mapbrowse?scope=knb-lter-sgs&identifier=139
Webpage with information and links to data files for download
This data package was produced by researchers working on the Shortgrass Steppe Long Term Ecological Research (SGS-LTER) Project, administered at Colorado State University. Long-term datasets and background information (proposals, reports, photographs, etc.) on the SGS-LTER project are contained in a comprehensive project collection within the Digital Collections of Colorado (http://digitool.library.colostate.edu/R/?func=collections&collection_id=3429). The data table and associated metadata document, which is generated in Ecological Metadata Language, may be available through other repositories serving the ecological research community and represent components of the larger SGS-LTER project collection. Additional information and referenced materials can be found: http://hdl.handle.net/10217/83458.\nThe abundance and diversity of small mammals in shortgrass steppe is strongly influenced by the structure and composition of vegetation. Vegetation structure provides cover from predators and harsh abiotic conditions. Plant species composition affects the types of seeds and herbaceous material available to granivores and herbivores, and influences arthropod populations, which are important prey for the omnivorous species that dominate in shortgrass steppe. Both vegetation structure and plant community composition are sensitive to the availability of precipitation as well as the activity of large mammalian herbivores. In 1999, we began measuring vegetation structure and plant community composition on the three grassland and three shrubland trapping webs where we live-trap small mammals. Vegetation measurements are made once each year, usually in mid-July. Percent canopy cover of each plant species was estimated visually in 30 0.10-m2 Daubenmire quadrats on each web. To estimate habitat structure, we measured the height of grass, forb and shrub plants adjacent to each quadrat, the density of half-shrubs, small mammal mounds and burrows, harvester ant mounds and the dimensions of large shrubs and animal mounds.
Resource Title: Website Pointer to html file.
File Name: Web Page, url: https://portal.edirepository.org/nis/mapbrowse?scope=knb-lter-sgs&identifier=140
Webpage with information and links to data files for download
This data package was produced by researchers working on the Shortgrass Steppe Long Term Ecological Research (SGS-LTER) Project, administered at Colorado State University. Long-term datasets and background information (proposals, reports, photographs, etc.) on the SGS-LTER project are contained in a comprehensive project collection within the Digital Collections of Colorado (http://digitool.library.colostate.edu/R/?func=collections&collection_id=3429). The data table and associated metadata document, which is generated in Ecological Metadata Language, may be available through other repositories serving the ecological research community and represent components of the larger SGS-LTER project collection. Additional information and referenced materials can be found: http://hdl.handle.net/10217/83458.\nThe abundance and diversity of small mammals in shortgrass steppe is strongly influenced by the structure and composition of vegetation. Vegetation structure provides cover from predators and harsh abiotic conditions. Plant species composition affects the types of seeds and herbaceous material available to granivores and herbivores, and influences arthropod populations, which are important prey for the omnivorous species that dominate in shortgrass steppe. Both vegetation structure and plant community composition are sensitive to the availability of precipitation as well as the activity of large mammalian herbivores. In 1999, we began measuring vegetation structure and plant community composition on the three grassland and three shrubland trapping webs where we live-trap small mammals. Vegetation measurements are made once each year, usually in mid-July. Percent canopy cover of each plant species was estimated visually in 30 0.10-m2 Daubenmire quadrats on each web. To estimate habitat structure, we measured the height of grass, forb and shrub plants adjacent to each quadrat, the density of half-shrubs, small mammal mounds and burrows, harvester ant mounds and the dimensions of large shrubs and animal mounds.
Resource Title: Website Pointer to html file.
File Name: Web Page, url: https://portal.edirepository.org/nis/mapbrowse?scope=knb-lter-sgs&identifier=141
Webpage with information and links to data files for download
This data package was produced by researchers working on the Shortgrass Steppe Long Term Ecological Research (SGS-LTER) Project, administered at Colorado State University. Long-term datasets and background information (proposals, reports, photographs, etc.) on the SGS-LTER project are contained in a comprehensive project collection within the Digital Collections of Colorado (http://digitool.library.colostate.edu/R/?func=collections&collection_id=3429). The data table and associated metadata document, which is generated in Ecological Metadata Language, may be available through other repositories serving the ecological research community and represent components of the larger SGS-LTER project collection. Additional information and referenced materials can be found: http://hdl.handle.net/10217/83450.\nWith the exception of heteromyids, eg kangaroo rats and pocket mice, most small rodents in shortgrass steppe are omnivorous. Depending on season, arthropods (insects and arachnids) make up 40-85% of the diet of grasshopper mice and thirteen-lined ground squirrels, the most widespread rodents in northern shortgrass steppe. Small mammals are among the most important predators of ground-dwelling macroarthropods and herbivorous insects provide a direct resource link between weather and plant production. Understanding temporal variability in the abundance of arthropods is central to determining the mechanisms that drive small rodent populations. At present, there are no long-term studies of arthropods in shortgrass steppe, despite the important role that these taxa play in grassland food webs. Beginning in 1998, we implemented field protocols to track changes in relative abundance of terrestrial macroarthropods in grassland and shrub-dominated habitats of shortgrass steppe. Sampling was conducted on the six trapping webs (three upland prairie, three lowland saltbush) where we studied rodent populations, and was conducted approximately monthly from May-September (4-5 sessions/year). Ground-dwelling macroarthropods were sampled on each web using pitfall traps, set in one four-by-five grid, with 10 m between traps. Traps consisted of plastic cups (90-mm diameter, 120 mm deep), including a plastic funnel (90-mm diameter), buried flush with the ground surface. Traps were shaded with wooden covers held in place with nails; traps could be closed when not operational by nailing the cover flush to the ground. Traps were usually open for 4 consecutive days (ie 80 trap-days) during a trapping session. On the 4th day, captured arthropods were removed from the traps, identified and released. All arthropods were identified to the ordinal level; beetles (Coleoptera), crickets (Orthoptera), true bugs (Hemiptera) and spiders were identified to the familial level; and a few taxa, eg tenebrionid beetles, were identified to species. We also recorded any reptiles and amphibians captured. The number of individuals of each taxa captured per 100 trap-days was used as an index of relative abundance, with adjustments made for traps that were flooded or disturbed by cattle or for changes to the number of days that traps were open (range 4-7 days). We sampled grasshoppers by counting the numbers flushed from 0.78-m2 circular plots (hoops) placed on each web. Hoops were set out on the day that pitfall traps were opened and were surveyed on the day that traps were closed. A technician used a wooden lath to flush and count all grasshoppers from each hoop. Grasshoppers were not identified to species. Surveys were conducted in 1998, then were discontinued until 2002. In 1998 and from 2002-2005, nine hoops were sampled on each web. Beginning in 2006, we sampled a total of 20 hoops on each web.
Resource Title: Website Pointer to html file.
File Name: Web Page, url: https://portal.edirepository.org/nis/mapbrowse?scope=knb-lter-sgs&identifier=134
Webpage with information and links to data files for download
This data package was produced by researchers working on the Shortgrass Steppe Long Term Ecological Research (SGS-LTER) Project, administered at Colorado State University. Long-term datasets and background information (proposals, reports, photographs, etc.) on the SGS-LTER project are contained in a comprehensive project collection within the Digital Collections of Colorado (http://digitool.library.colostate.edu/R/?func=collections&collection_id=3429). The data table and associated metadata document, which is generated in Ecological Metadata Language, may be available through other repositories serving the ecological research community and represent components of the larger SGS-LTER project collection. Additional information and referenced materials can be found: http://hdl.handle.net/10217/83392\nCarnivores are among the most conspicuous, charismatic and economically important mammals in shortgrass steppe, yet relatively is little is known about their populations or of the ecological factors that determine their distribution and abundance, in part because densities tend to be low. Mammalian carnivores represent the top predators in grassland food webs, consuming rodents, rabbits, young ungulates and other small vertebrates. In addition, shortgrass steppe is the primary habitat of the swift fox (Vulpes velox), a species of special conservation concern throughout most of its range. Fox populations are thought to be limited by predation from coyotes (Canis latrans), the most common carnivore in these grasslands and a species of interest, both for its ecological roles and well as a target species for human exploitation, ie hunting and predator control. In 1994, we implemented a low-intensity sampling scheme to monitor long-term changes in relative abundance of mammalian carnivores and help us examine interactions between these predators and their small mammal prey, including rodents and rabbits. We estimated relative abundance of carnivores using scat surveys along a fixed route. Four times each year (January, April, July, October), we drove a 32-km route consisting of pasture two-track and gravel roads on the CPER. We first drove the route to remove all scats (‘PRE-census’); we then returned ~14 d later and counted the number of scats deposited on the route (‘CENSUS’). We recorded the species that deposited the scat and estimated the scat age based on external appearance (4 categories). Beginning in 1997, we recorded the vegetation (habitat) type and topographic position of all scat locations to describe habitat use. Latrines are indicated by locations containing multiple scats. We used the ‘CENSUS’ data to calculate a scat index, defined as the number of scats deposited per km of road per night. The scat index can be used to estimate population density using equations for coyotes (Knowlton 1982) and swift foxes (Schauster et al. 2002) that described the rate of scat deposition from surveys where density was known. To estimate density and compare trends among seasons and years, we omitted scats collected along the 8.3 km of the route that occurred on gravel county roads. These roads are graded sporadically, sometimes between pre-census and census surveys, which tended to remove scats. (NOTE: these observations are NOT omitted in the dataset).
Resource Title: Website Pointer to html file.
File Name: Web Page, url: https://portal.edirepository.org/nis/mapbrowse?scope=knb-lter-sgs&identifier=135
Webpage with information and links to data files for download
This data package was produced by researchers working on the Shortgrass Steppe Long Term Ecological Research (SGS-LTER) Project, administered at Colorado State University. Long-term datasets and background information (proposals, reports, photographs, etc.) on the SGS-LTER project are contained in a comprehensive project collection within the Digital Collections of Colorado (http://digitool.library.colostate.edu/R/?func=collections&collection_id=3429). The data table and associated metadata document, which is generated in Ecological Metadata Language, may be available through other repositories serving the ecological research community and represent components of the larger SGS-LTER project collection. Additional information and referenced materials can be found: http://hdl.handle.net/10217/83448.\nRabbits are the most important small-mammal herbivores in shortgrass steppe, and may significant influence the physiognomy and population dynamics of herbaceous plants and woody shrubs. Rabbits also are the most important prey of mammalian carnivores such as coyotes and large raptors such as golden eagles and great horned owls. Two hares (Lepus californicus, L. townsendii) and one cottontail rabbit (Sylvilagus audubonii) occur in shortgrass steppe. In 1994, we initiated long-term studies to track changes in relative abundance of rabbits on the Central Plains Experimental Range (CPER). On four nights each year (one night each season, usually on new moon nights in January, April, July, October), we drove a 32-km route consisting of pasture two-track and gravel roads on the CPER. This was the same route as that driven for carnivore scat counts. Surveys began at twilight. Observers with two spotlights sat in the back of a 4WD pick-up driven at
Resource Title: Website Pointer to html file.
File Name: Web Page, url: https://portal.edirepository.org/nis/mapbrowse?scope=knb-lter-sgs&identifier=136
Webpage with information and links to data files for download
This data package was produced by researchers working on the Shortgrass Steppe Long Term Ecological Research (SGS-LTER) Project, administered at Colorado State University. Long-term datasets and background information (proposals, reports, photographs, etc.) on the SGS-LTER project are contained in a comprehensive project collection within the Digital Collections of Colorado (http://digitool.library.colostate.edu/R/?func=collections&collection_id=3429). The data table and associated metadata document, which is generated in Ecological Metadata Language, may be available through other repositories serving the ecological research community and represent components of the larger SGS-LTER project collection.\nThe belowground system in arid and semiarid regions can be of relatively greater importance than in more mesic systems because plant competition is most often for soil water rather than for light in aboveground canopies. Belowground plant biomass in the shortgrass steppe represents approximately 80% of the total. These data, entitled Long-Term Seasonal Root Biomass, were obtained in section 21 of the Central Plains Experimental Range from 1985-2008 in conjunction with a 14C labeling experiment designed to test isotope methods of estimating root production. Paired plots for each of eight replicate 14C labeled plots were established and cored on average six times per year over 13 years (five cores each plot each date as above). There were two primary objectives for collecting these data, 1) to compare estimates of root production (or belowground net primary production - BNPP) obtained using the sequential coring of biomass methods with various isotope, minirhizotron, ingrowth, and other methods, and 2) to examine long-term controls on the temporal dynamics of root biomass. This shortgrass steppe LTER site is the only place we are aware of that has compared most methods of estimating BNPP, including sequential coring, ingrowth cores, and ingrowth donuts, 14C pulse-isotope dilution, 14C pulse-isotope turnover, rhizotron windows, and minirhizotron, and indirect methods including nitrogen budget, carbon flux, simulation carbon flow model, and regression model. All production methods are compared in Milchunas (2009), and more detailed comparisons among particular methods can be found in Milchunas and Lauenroth (1992, 2001), and Milchunas et al. (2005a, and 2005b). Results and conclusions concerning root biomass dynamics and relationships with precipitation, season, and aboveground biomass are reported primarily in Milchunas and Lauenroth (2001). If you are interested in using these data they are downloadable from the SGS website, however we encourage you to seek advice from the researchers on the SGS project before you apply this dataset. Milchunas D. G., and W. K. Lauenroth. 1992. Carbon dynamics and estimates of primary production by harvest, C14 dilution, and C14 turnover. Ecology 73:593-607. Milchunas, D. G., and W. K. Lauenroth. 2001. Belowground primary production by carbon isotope decay and long-term root biomass dynamics. Ecosystems 4:139-150. Milchunas, D. G., J. A. Morgan, A. R. Mosier, and D. LeCain. 2005a. Root dynamics and demography in shortgrass steppe under elevated CO2, and comments on minirhizotron methodology. Global Change Biology 11:1837-1855. Milchunas, D. G., A. R. Mosier, J. A. Morgan, D. LeCain, J. Y. King, and J. A. Nelson. 2005b. Root production and tissue quality in a shortgrass steppe exposed to elevated CO2: Using a new ingrowth method. Plant and Soil 268:111-122. Milchunas, D. G. 2009. Estimating root production: comparison of 11 methods in shortgrass steppe and review of biases. Ecosystems 12:1381-1402. Additional information and referenced materials can be found: http://hdl.handle.net/10217/85665.
Resource Title: Website Pointer to html file.
File Name: Web Page, url: https://portal.edirepository.org/nis/mapbrowse?scope=knb-lter-sgs&identifier=170
Webpage with information and links to data files for download
This data package was produced by researchers working on the Shortgrass Steppe Long Term Ecological Research (SGS-LTER) Project, administered at Colorado State University. Long-term datasets and background information (proposals, reports, photographs, etc.) on the SGS-LTER project are contained in a comprehensive project collection within the Digital Collections of Colorado (http://digitool.library.colostate.edu/R/?func=collections&collection_id=3429). The data table and associated metadata document, which is generated in Ecological Metadata Language, may be available through other repositories serving the ecological research community and represent components of the larger SGS-LTER project collection.\nMost investigators studying grasslands have assumed that the low standing biomass of the SGS created a system with a low probability of carrying fire, and thus a minimal historical role of fire. Nonetheless, there are years with aboveground biomass equivalent to the mixed grass prairie, and a high frequency of lightening storms. Regardless of the historical role of fire in SGS, there are new questions regarding its utility in managing for the presence of the threatened mountain plover, which only nests in areas of low plant biomass. United States Forest Service, Pawnee National Grassland recently initiated a burning program in the mid 1990s to address questions about using fire to increase plover habitat; we have collected data on some of these plots to investigate the influence of fire on SGS vegetation. Several datasets were created between 1999 and 2004 by SGS-LTER researchers, including measurements of shrub and cactus mortality rates, aboveground net primary production, amounts of litter and standing dead, and aboveground nitrogen dynamics in burned and control plots in the western section of the Pawnee National Grassland. Additional information and referenced materials can be found: http://hdl.handle.net/10217/83326.
Resource Title: Website Pointer to html file.
File Name: Web Page, url: https://portal.edirepository.org/nis/mapbrowse?scope=knb-lter-sgs&identifier=129
Webpage with information and links to data files for download
This data package was produced by researchers working on the Shortgrass Steppe Long Term Ecological Research (SGS-LTER) Project, administered at Colorado State University. Long-term datasets and background information (proposals, reports, photographs, etc.) on the SGS-LTER project are contained in a comprehensive project collection within the Digital Collections of Colorado (http://digitool.library.colostate.edu/R/?func=collections&collection_id=3429). The data table and associated metadata document, which is generated in Ecological Metadata Language, may be available through other repositories serving the ecological research community and represent components of the larger SGS-LTER project collection.\nMost investigators studying grasslands have assumed that the low standing biomass of the SGS created a system with a low probability of carrying fire, and thus a minimal historical role of fire. Nonetheless, there are years with aboveground biomass equivalent to the mixed grass prairie, and a high frequency of lightening storms. Regardless of the historical role of fire in SGS, there are new questions regarding its utility in managing for the presence of the threatened mountain plover, which only nests in areas of low plant biomass. United States Forest Service, Pawnee National Grassland recently initiated a burning program in the mid 1990s to address questions about using fire to increase plover habitat; we have collected data on some of these plots to investigate the influence of fire on SGS vegetation. Several datasets were created between 1999 and 2004 by SGS-LTER researchers, including measurements of shrub and cactus mortality rates, aboveground net primary production, amounts of litter and standing dead, and aboveground nitrogen dynamics in burned and control plots in the western section of the Pawnee National Grassland. Additional information and referenced materials can be found: http://hdl.handle.net/10217/83326.
Resource Title: Website Pointer to html file.
File Name: Web Page, url: https://portal.edirepository.org/nis/mapbrowse?scope=knb-lter-sgs&identifier=128
Webpage with information and links to data files for download
This data package was produced by researchers working on the Shortgrass Steppe Long Term Ecological Research (SGS-LTER) Project, administered at Colorado State University. Long-term datasets and background information (proposals, reports, photographs, etc.) on the SGS-LTER project are contained in a comprehensive project collection within the Digital Collections of Colorado (http://digitool.library.colostate.edu/R/?func=collections&collection_id=3429). The data table and associated metadata document, which is generated in Ecological Metadata Language, may be available through other repositories serving the ecological research community and represent components of the larger SGS-LTER project collection.\nCPER Paleopedology Study – Pedons - Forty-one pedons representing sites of contrasting geomorphic position (upland plain, upland ridge, dissected upland, terrace, dune) were chosen for pedologic and geomorphic analyses. These pedons are located on the major physiographic units at the CPER, and contain deposits of suspected fluvial and eolian origin. To examine spatial variability, the pedons were typically sampled along transects spaced at 30m intervals. Samples were taken with a hydraulic soil probe to the depth of probe refusal and from suitable stream and road cuts. All soils were described and sampled by genetic horizon (Soil Survey Staff, 1992), and analyzed at Colorado State University. Analyses included particle size and organic C. Nineteen of the 41 pedons were subjected to stable isotopic analysis of organic C and carbonate. Additional information and referenced materials can be found: http://hdl.handle.net/10217/85625.
Resource Title: Website Pointer to html file.
File Name: Web Page, url: https://portal.edirepository.org/nis/mapbrowse?scope=knb-lter-sgs&identifier=167
Webpage with information and links to data files for download
This data package was produced by researchers working on the Shortgrass Steppe Long Term Ecological Research (SGS-LTER) Project, administered at Colorado State University. Long-term datasets and background information (proposals, reports, photographs, etc.) on the SGS-LTER project are contained in a comprehensive project collection within the Digital Collections of Colorado (http://digitool.library.colostate.edu/R/?func=collections&collection_id=3429). The data table and associated metadata document, which is generated in Ecological Metadata Language, may be available through other repositories serving the ecological research community and represent components of the larger SGS-LTER project collection.\nCPER Paleopedology Study – Particle and Grain Size - Grain size data from 39 pedons were compared with modal fluvial (7) and eolian (3) samples in order to characterize the origin of CPER parent materials and distinguish the origin of CPER geomorphic features. The seven fluvial sites were located along Owl and Eastman Creeks. The three eolian sites were located on the nearest undisputed dune fields located approximately 5 km north of Roggen, CO (Muhs, 1985). For statistical analysis, the sand and coarse silt fractions were shaken in a nest of half phi(0) interval sieves ranging from -1.0 0 (10 mesh) to 4.5 0 (325 mesh) for 3 minutes. Phi intervals (-log2) were utilized to normalize the particle size data for use in conventional statistics (Krumbein, 1934). The silt and clay fractions were separated by sedimentation using the pipette method. Statistical methods adopted from Folk and Ward (1957) were applied to the -1.0 0 to 7.0 0 fractions using the Sedimentary Petrology Computer Program SEDPET (Warner, 1970) to determine mean grain size (Mz), sorting (Iz), skewness (Skz), and kurtosis (Kz). These parameters were then subjected to univariate and bivariate analysis. The clay fraction was not included in the statistical computations to avoid excessively fine skewing the sample. Additional information and referenced materials can be found: http://hdl.handle.net/10217/85625.
Resource Title: Website Pointer to html file.
File Name: Web Page, url: https://portal.edirepository.org/nis/mapbrowse?scope=knb-lter-sgs&identifier=168
Webpage with information and links to data files for download
This data package was produced by researchers working on the Shortgrass Steppe Long Term Ecological Research (SGS-LTER) Project, administered at Colorado State University. Long-term datasets and background information (proposals, reports, photographs, etc.) on the SGS-LTER project are contained in a comprehensive project collection within the Digital Collections of Colorado. The data table and associated metadata document, which is generated in Ecological Metadata Language, may be available through other repositories serving the ecological research community and represent components of the larger SGS-LTER project collection.\nThe Breeding Bird Survey is a large-scale survey of North American birds. It is a roadside survey, primarily covering the continental United States and southern Canada, although survey routes have recently been initiated in Alaska and northern Mexico. The BBS was started in 1966, and the over 3,500 routes are surveyed in June by experienced birders. Routes 305, Nunn and 901, Rockport are located in the area of the SGS research site. The primary objective of the BBS has been the estimation of population change for songbirds. However, the data have many potential uses, and investigators have used the data to address a variety of research and management objectives. In the USGS-BBS Home Page, results from the BBS are summarized and pictures of birds and other species are information. Data from 1966 - 2002 were managed by the SGS-LTER project. Additional information and referenced materials can be found: http://hdl.handle.net/10217/82150.
Resource Title: Website Pointer to html file.
File Name: Web Page, url: https://portal.edirepository.org/nis/mapbrowse?scope=knb-lter-sgs&identifier=108
Webpage with information and links to data files for download
This data package was produced by researchers working on the Shortgrass Steppe Long Term Ecological Research (SGS-LTER) Project, administered at Colorado State University. Long-term datasets and background information (proposals, reports, photographs, etc.) on the SGS-LTER project are contained in a comprehensive project collection within the Digital Collections of Colorado (http://digitool.library.colostate.edu/R/?func=collections&collection_id=3429). The data table and associated metadata document, which is generated in Ecological Metadata Language, may be available through other repositories serving the ecological research community and represent components of the larger SGS-LTER project collection.\nProduction of seeds of Bouteloua gracilis was evaluated for a semiarid grassland in northeastern Colorado. Ten locations were chosed to represent the range in soil textures and grazing intensities found at the Central Plains Experiemental Range research site. Number of flowering culms, inforescences and seeds, length of each flowering clum, total biomass or reproductive structures (culms, inforescences and seeds), and basal areas were assessed for each plant sampled. Community-level estimates of density of flowering culms and density of viable seeds are made for each location. Both soil texture and grazing intensity by cattle are important to spatial variability in seed production and other indicators of reproductive effort by B. gracilis. Additional information and referenced materials can be found: http://hdl.handle.net/10217/82281
Resource Title: Website Pointer to html file.
File Name: Web Page, url: https://portal.edirepository.org/nis/mapbrowse?scope=knb-lter-sgs&identifier=109
Webpage with information and links to data files for download
This data package was produced by researchers working on the Shortgrass Steppe Long Term Ecological Research (SGS-LTER) Project, administered at Colorado State University. Long-term datasets and background information (proposals, reports, photographs, etc.) on the SGS-LTER project are contained in a comprehensive project collection within the Digital Collections of Colorado (http://digitool.library.colostate.edu/R/?func=collections&collection_id=3429). The data table and associated metadata document, which is generated in Ecological Metadata Language, may be available through other repositories serving the ecological research community and represent components of the larger SGS-LTER project collection.\nThe objective of this study is to collect baseline meteorological data for the CPER. Datasets auto12_climdb and man11_climdb have been processed for quality and missing values. additional information and referenced materials can be found:http://hdl.handle.net/10217/82146.
Resource Title: Website Pointer to html file.
File Name: Web Page, url: https://portal.edirepository.org/nis/mapbrowse?scope=knb-lter-sgs&identifier=144
Webpage with information and links to data files for download
This data package was produced by researchers working on the Shortgrass Steppe Long Term Ecological Research (SGS-LTER) Project, administered at Colorado State University. Long-term datasets and background information (proposals, reports, photographs, etc.) on the SGS-LTER project are contained in a comprehensive project collection within the Digital Collections of Colorado (http://digitool.library.colostate.edu/R/?func=collections&collection_id=3429). The data table and associated metadata document, which is generated in Ecological Metadata Language, may be available through other repositories serving the ecological research community and represent components of the larger SGS-LTER project collection.\nDatasets auto12_climdb and man11_climdb have been processed for quality and missing values. Additional information and referenced materials can be found: http://hdl.handle.net/10217/82446.
Resource Title: Website Pointer to html file.
File Name: Web Page, url: https://portal.edirepository.org/nis/mapbrowse?scope=knb-lter-sgs&identifier=174
Webpage with information and links to data files for download
This data package was produced by researchers working on the Shortgrass Steppe Long Term Ecological Research (SGS-LTER) Project, administered at Colorado State University. Long-term datasets and background information (proposals, reports, photographs, etc.) on the SGS-LTER project are contained in a comprehensive project collection within the Digital Collections of Colorado (http://digitool.library.colostate.edu/R/?func=collections&collection_id=3429). The data table and associated metadata document, which is generated in Ecological Metadata Language, may be available through other repositories serving the ecological research community and represent components of the larger SGS-LTER project collection.\nThe objective of this study is to collect baseline meteorological data for the CPER. Datasets auto12_climdb and man11_climdb have been processed for quality and missing values. Additional information and referenced materials can be found: http://hdl.handle.net/10217/82446.
Resource Title: Website Pointer to html file.
File Name: Web Page, url: https://portal.edirepository.org/nis/mapbrowse?scope=knb-lter-sgs&identifier=112
Webpage with information and links to data files for download
This data package was produced by researchers working on the Shortgrass Steppe Long Term Ecological Research (SGS-LTER) Project, administered at Colorado State University. Long-term datasets and background information (proposals, reports, photographs, etc.) on the SGS-LTER project are contained in a comprehensive project collection within the Digital Collections of Colorado (http://digitool.library.colostate.edu/R/?func=collections&collection_id=3429). The data table and associated metadata document, which is generated in Ecological Metadata Language, may be available through other repositories serving the ecological research community and represent components of the larger SGS-LTER project collection.\nThe objective of this study is to collect baseline meteorological data for the CPER. Datasets auto12_climdb and man11_climdb have been processed for quality and missing values. Additional information and referenced materials can be found:http://hdl.handle.net/10217/82146.
Resource Title: Website Pointer to html file.
File Name: Web Page, url: https://portal.edirepository.org/nis/mapbrowse?scope=knb-lter-sgs&identifier=105
Webpage with information and links to data files for download
This data package was produced by researchers working on the Shortgrass Steppe Long Term Ecological Research (SGS-LTER) Project, administered at Colorado State University. Long-term datasets and background information (proposals, reports, photographs, etc.) on the SGS-LTER project are contained in a comprehensive project collection within the Digital Collections of Colorado (http://digitool.library.colostate.edu/R/?func=collections&collection_id=3429). The data table and associated metadata document, which is generated in Ecological Metadata Language, may be available through other repositories serving the ecological research community and represent components of the larger SGS-LTER project collection. Additional information and referenced materials can be found: http://hdl.handle.net/10217/82449.\nThe objective of this study is to collect baseline meteorological data for the CPER. Datasets auto12_climdb and man11_climdb have been processed for quality and missing values.
Resource Title: Website Pointer to html file.
File Name: Web Page, url: https://portal.edirepository.org/nis/mapbrowse?scope=knb-lter-sgs&identifier=118
Webpage with information and links to data files for download
This data package was produced by researchers working on the Shortgrass Steppe Long Term Ecological Research (SGS-LTER) Project, administered at Colorado State University. Long-term datasets and background information (proposals, reports, photographs, etc.) on the SGS-LTER project are contained in a comprehensive project collection within the Digital Collections of Colorado (http://digitool.library.colostate.edu/R/?func=collections&collection_id=3429). The data table and associated metadata document, which is generated in Ecological Metadata Language, may be available through other repositories serving the ecological research community and represent components of the larger SGS-LTER project collection. Additional information and referenced materials can be found: http://hdl.handle.net/10217/82449.\nThe objective of this study is to collect baseline meteorological data for the CPER. Datasets auto12_climdb and man11_climdb have been processed for quality and missing values.
Resource Title: Website Pointer to html file.
File Name: Web Page, url: https://portal.edirepository.org/nis/mapbrowse?scope=knb-lter-sgs&identifier=117
Webpage with information and links to data files for download
This data package was produced by researchers working on the Shortgrass Steppe Long Term Ecological Research (SGS-LTER) Project, administered at Colorado State University. Long-term datasets and background information (proposals, reports, photographs, etc.) on the SGS-LTER project are contained in a comprehensive project collection within the Digital Collections of Colorado (http://digitool.library.colostate.edu/R/?func=collections&collection_id=3429). The data table and associated metadata document, which is generated in Ecological Metadata Language, may be available through other repositories serving the ecological research community and represent components of the larger SGS-LTER project collection. Additional information and referenced materials can be found: http://hdl.handle.net/10217/82449.\nThe objective of this study is to collect baseline meteorological data for the CPER. Datasets auto12_climdb and man11_climdb have been processed for quality and missing values.
Resource Title: Website Pointer to html file.
File Name: Web Page, url: https://portal.edirepository.org/nis/mapbrowse?scope=knb-lter-sgs&identifier=116
Webpage with information and links to data files for download
This data package was produced by researchers working on the Shortgrass Steppe Long Term Ecological Research (SGS-LTER) Project, administered at Colorado State University. Long-term datasets and background information (proposals, reports, photographs, etc.) on the SGS-LTER project are contained in a comprehensive project collection within the Digital Collections of Colorado (http://digitool.library.colostate.edu/R/?func=collections&collection_id=3429). The data table and associated metadata document, which is generated in Ecological Metadata Language, may be available through other repositories serving the ecological research community and represent components of the larger SGS-LTER project collection. Additional information and referenced materials can be found: http://hdl.handle.net/10217/82449.\nThe objective of this study is to collect baseline meteorological data for the CPER. Datasets auto12_climdb and man11_climdb have been processed for quality and missing values.
Resource Title: Website Pointer to html file.
File Name: Web Page, url: https://portal.edirepository.org/nis/mapbrowse?scope=knb-lter-sgs&identifier=115
Webpage with information and links to data files for download
This data package was produced by researchers working on the Shortgrass Steppe Long Term Ecological Research (SGS-LTER) Project, administered at Colorado State University. Long-term datasets and background information (proposals, reports, photographs, etc.) on the SGS-LTER project are contained in a comprehensive project collection within the Digital Collections of Colorado (http://digitool.library.colostate.edu/R/?func=collections&collection_id=3429). The data table and associated metadata document, which is generated in Ecological Metadata Language, may be available through other repositories serving the ecological research community and represent components of the larger SGS-LTER project collection. Additional information and referenced materials can be found: http://hdl.handle.net/10217/83446.\nThe objective of this study is to collect baseline meteorological data for the CPER. Datasets auto12_climdb and man11_climdb have been processed for quality and missing values.
Resource Title: Website Pointer to html file.
File Name: Web Page, url: https://portal.edirepository.org/nis/mapbrowse?scope=knb-lter-sgs&identifier=122
Webpage with information and links to data files for download
This data package was produced by researchers working on the Shortgrass Steppe Long Term Ecological Research (SGS-LTER) Project, administered at Colorado State University. Long-term datasets and background information (proposals, reports, photographs, etc.) on the SGS-LTER project are contained in a comprehensive project collection within the Digital Collections of Colorado (http://digitool.library.colostate.edu/R/?func=collections&collection_id=3429). The data table and associated metadata document, which is generated in Ecological Metadata Language, may be available through other repositories serving the ecological research community and represent components of the larger SGS-LTER project collection.\nThe objective of the long-term ANPP study is to monitor long-term net above ground primary production of the shortgrass steppe community by species. There are 6 sites: ridgetop (ridge), midslope (mid), swale, ESA (replicate 1 not 2), Section 25 (SEC 25), and owl-creek (OC). Each site is located in a different landscape position or soil type on the shortgrass steppe and may be grazed or not. Ridgetop, midslope and swale are grazed and are sampled along a catena. Section 25 is grazed and is located in an upload grassland. ESA is an ungrazed upland grassland an is the control from the Ecosystem Stress Area experiment. Owl Creek is ungrazed and is located in the lowland along the owl creek drainage. There are 3 transects with 5 plots in each transect. Plots in the grazed locations are protected by cages. Because this is a monitoring effort, true replicates across the landscape are not available and it is recommended that the transect be used in calculating mean production at each sampling location.
Resource Title: Website Pointer to html file.
File Name: Web Page, url: https://portal.edirepository.org/nis/mapbrowse?scope=knb-lter-sgs&identifier=700
Webpage with information and links to data files for download
This data package was produced by researchers working on the Shortgrass Steppe Long Term Ecological Research (SGS-LTER) Project, administered at Colorado State University. Long-term datasets and background information (proposals, reports, photographs, etc.) on the SGS-LTER project are contained in a comprehensive project collection within the Digital Collections of Colorado (http://digitool.library.colostate.edu/R/?func=collections&collection_id=3429). The data table and associated metadata document, which is generated in Ecological Metadata Language, may be available through other repositories serving the ecological research community and represent components of the larger SGS-LTER project collection.\nThe objective of the long-term ANPP study is to monitor long-term net above ground primary production of the shortgrass steppe community by functional group. There are 6 sites: ridgetop (ridge), midslope (mid), swale, ESA (replicate 1 not 2), Section 25 (SEC 25), and owl-creek (OC). Each site is located in a different landscape position or soil type on the shortgrass steppe and may be grazed or not. Ridgetop, midslope and swale are grazed and are sampled along a catena. Section 25 is grazed and is located in an upload grassland. ESA is an ungrazed upland grassland an is the control from the Ecosystem Stress Area experiment. Owl Creek is ungrazed and is located in the lowland along the owl creek drainage. There are 3 transects with 5 plots in each transect. Plots in the grazed locations are protected by cages. Because this is a monitoring effort, true replicates across the landscape are not available and it is recommended that the transect be used in calculating mean production at each sampling location.
Resource Title: Website Pointer to html file.
File Name: Web Page, url: https://portal.edirepository.org/nis/mapbrowse?scope=knb-lter-sgs&identifier=701
Webpage with information and links to data files for download
This data package was produced by researchers working on the Shortgrass Steppe Long Term Ecological Research (SGS-LTER) Project, administered at Colorado State University. Long-term datasets and background information (proposals, reports, photographs, etc.) on the SGS-LTER project are contained in a comprehensive project collection within the Digital Collections of Colorado (http://digitool.library.colostate.edu/R/?func=collections&collection_id=3429). The data table and associated metadata document, which is generated in Ecological Metadata Language, may be available through other repositories serving the ecological research community and represent components of the larger SGS-LTER project collection.\nCPER SOC across Toposequences - Pedons and their corresponding topography were described along an 8 km transect oriented normal to the major drainages of the CPER. A total of 140 pedons representing 23 toposequences and 7 plains segments were characterized. Sampling sites were selected within toposequences according to slope position (summit, shoulder, backslope, footslope, toeslope) and within plains segments at approximate 100 m intervals. Pedons were described and sampled by genetic horizon according to the standards of the National Cooperative Soil Survey. Analyses, conducted at Colorado State University, included particle size and organic C. Bulk density was estimated empirically according to: Rawls, W.J. 1983. Estimating soil bulk density form particle size analysis and organic matter content. Soil Sci 135: 123-125. Organic C accumulation was measured along an 8 km transect at a site in the semiarid shortgrass steppe of northeastern Colorado. Specific objectives of the study were to (I) measure the quantity and distribution of organic C across toposequences, (ii) test the hypothesis that a disproportionate amount of soil organic C resides in the lowlands (as defined herein), and (iii) assess the role of geomorphic history as a determinant of contemporary rates of biogeochemical organic C transformations. Results of the study showed the surface (A) horizon organic C concentration did not vary systematically among slope positions of a given toposequence. Similarly, the mass of organic C within the surface meter of soil often did not increase with decreasing elevation across a toposequence. Mass of organic C was found to range from 2.5 kg m^-3 on terrace escarpments to 10.7 kg m^-3 on sandy uplands. The mass of organic C, as calculated to the BCk horizon, was highest in the lowlands. The mass of buried organic C, as calculated uniformly for a 50 cm thickness of material, represents 17% of the total organic C estimate for the site. In spite of buried soils, lowlands did not contain a disproportionate amount of total landscape organic C. Additional information and referenced materials can be found: http://hdl.handle.net/10217/85625.
Resource Title: Website Pointer to html file.
File Name: Web Page, url: https://portal.edirepository.org/nis/mapbrowse?scope=knb-lter-sgs&identifier=175
Webpage with information and links to data files for download
SHOOTGRO emphasizes the development and growth of the shoot apex of small-grain cereals such as winter and spring wheat (Triticum aestivum L.) and spring barley (Hordeum vulgare L.). To better incorporate the variability typical in the field, up to six cohorts, or age classes, of plants are followed using a daily time step.
\nAssessing the influence of nitrogen and water availability on development and growth of individual organs of winter wheat (Triticum aestivum L.) is critical in evaluating the response of wheat to environmental conditions. We constructed a simulation model (SHOOTGRO 2.0) of shoot vegetative development and growth from planting to early boot by adding nitrogen and water balances and response functions for seedling emergence, tiller and leaf appearance, leaf and internode growth, and leaf and tiller senescence to the existing wheat development and growth model, SHOOTGRO 1.0. Model inputs include daily maximum and minimum air temperature, rainfall, daily photosynthetically active radiation, soil characteristics necessary to compute soil N and water balances, and several factors describing the cultivar and soil conditions at planting. The model provides information on development and growth characteristics of up to six cohorts of plants within the canopy (cohort groupings are based on time of emergence). The cohort structure allows SHOOTGRO 2.0 to provide output on the frequency of occurrence of plants with specific features (tillers and leaves) within the canopy. The model was constructed so that only water availability limited seedling emergence. Resource availability (nitrogen and water) does not influence time of leaf appearance. Leaf and internode growth, and leaf and tiller senescence processes are limited by the interaction of N and water availability. Tiller appearance is influenced by the correspondence to: W.W. Wilhelm, USDA-ARS, Department of Agronomy, University of Nebraska-Lincoln, Lincoln, Nebraska 68583-0934, USA. 0304-3800/93/$06.00 0 1993 - Elsevier Science Publishers B.V. All rights reserved 184 W.W. WILHELM ET AL. interaction of N, radiation and water availability. Predicted and observed dates of emergence and appearance of the first tiller had correlation coefficients of 0.98 and 0.93, respectively. However, these events were, on average, predicted 3.2 and 5.2 days later than observed. SHOOTGRO 2.0 generally under-predicted the number of culms per unit land area, partially because the simulation is limited to a maximum of 16 culms/plant. Model output shows that the simulation is sensitive to N and water inputs. The model provides a tool for predicting vegetative development and growth of the winter wheat with individual culms identified and followed from emergence through boot. SHOOTGRO 2.0 can be used in evaluating alternative crop management strategies.
Resource Title: SHOOTGRO download page.
File Name: Web Page, url: https://www.ars.usda.gov/research/software/download/?softwareid=236&modecode=30-12-30-25
SMT Study for Greenhouse gas Reduction through Agricultural Carbon Enhancement network in St. Paul, Minnesota\nCarbon and Nitrogen Storage are Greater under Biennial Tillage in a Minnesota Corn-Soybean Rotation. Venterea, Rodney T., Baker, John M., Dolan, Michael S., Spokas, Kurt A., Soil Science Society of America Journal; Madison. http://search.proquest.com/assets/r20171.4.0.302.1590/core/spacer.gif70.5http://search.proquest.com/assets/r20171.4.0.302.1590/core/spacer.gif (Sep/Oct 2006): 1752-1762. Few studies have examined the impacts of rotational tillage regimes on soil carbon (C) and nitrogen (N). We measured the C and N content of soils managed under corn (Zea mays L.)-soybean (Glycine max L.) rotation following 10 and 15 yr of treatments. A conventional tillage (CT) regime employing moldboard and chisel plowing in alternate years was compared with both continuous no-till (NT) and biennial tillage (BT), which employed chisel plowing before soybean only. While masses of C and N in the upper 0.3 m under both BT and NT were higher than CT, only the BT treatment differed from CT when the entire sampled depth (0.6 m) was considered. Decreased C inputs, as indicated by reduced grain yields, may have limited C storage in the NT system. Thus, while more C was apparently retained under NT per unit of C input, some tillage appears necessary in this climate and cropping system to maximize C storage. Soil carbon dioxide (CO2) fluxes under NT were greater than CT during a drier than normal year, suggesting that C storage may also be partly constrained under NT due to wetter conditions that promote increased soil respiration. Increased temperature sensitivity of soil respiration with increasing soil moisture was also observed. These findings indicate that long-term biennial chisel plowing for corn-soybean in the upper mid-west USA can enhance C storage, reduce tillage-related fuel costs, and maintain yields compared with more intensive annual tillage. Urea Decreases Nitrous Oxide Emissions Compared with Anhydrous Ammonia in a Minnesota Corn Cropping System. Venterea, Rodney T; Dolan, Michael S; Ochsner, Tyson E. http://search.proquest.com/assets/r20171.4.0.302.1590/core/spacer.gif. Soil Science Society of AmericanJournal; Madison http://search.proquest.com/assets/r20171.4.0.302.1590/core/spacer.gif74.2http://search.proquest.com/assets/r20171.4.0.302.1590/core/spacer.gif (Mar/Apr 2010): 407-418. Quantifying N2O emissions from corn (Zea mays L.) and soybean [Glycine max (L.) Merr.] fields under different fertilizer regimes is essential to developing national inventories of greenhouse gas emissions. The objective of this study was to compare N2O emissions in plots managed for more than 15 yr under continuous corn (C/C) vs. a corn-soybean (C/S) rotation that were fertilized during the corn phase with either anhydrous NH 3 (AA) or urea (U). During three growing seasons, N2O emissions from corn following corn were nearly identical to corn following soybean. In both systems, however, N2O emissions with AA were twice the emissions with U. After accounting for N2O emissions during the soybean phase, it was estimated that a shift from C/S to C/C would result in an increase in annual emissions of 0.78 kg N ha-1 (equivalent to 0.11 Mg CO2-C ha-1) when AA was used, compared with only 0.21 kg N ha-1 (0.03 Mg CO2-C ha-1) with U. In light of trends toward increased use of U, these results suggest that fertilizer-induced soil N2O emissions may decline in the future, at least per unit of applied N, although further study is needed in different soils and cropping systems. While soil CO2 emissions were 20% higher under C/C, crop residue from the prior year did not affect soil inorganic N or dissolved organic C during the subsequent season. We also compared different flux-calculation schemes, including a new method for correcting chamber-induced errors, and found that selection of a calculation method altered N2O emissions estimates by as much as 35%.
Resource Title: GeoData catalog record.
File Name: Web Page, url: https://geodata.nal.usda.gov/geonetwork/srv/eng/catalog.search#/metadata/9fc80e52-8e34-44b7-8849-d82efdd6d73b
SNAP (Soil Nutrient Assessment Program), a component of the USDA/ARS Soil and Water Hub, is a web-based tool that provides an estimate of plant-available nutrients that the soil naturally provides.
\nSoil test fertilizer recommendations have long been predicated upon response curves generated from fertility trials across the country. These response curves have been compared to relative yield which provide probability ranges for a response to varying fertilizer inputs. Category responses include very low, low, adequate, high or very high inversely related to probability of a response to various inputs of nitrogen, phosphate, and potassium (N, P, and K).
\nNew soil test methods, increases in computing power and access to the internet have enabled development of an interactive tool that is based on plant available NPK from both the inorganic fraction and organic pool of the soil. The new methods provide an estimate of plant available nutrients that the soil naturally provides, which has largely been ignored for decades.
\nSince we have access to large datasets we can calculate the amounts of NPK required growing crops in lbs NPK per bu of the desired crop. For example, it requires 100 lbs of N, 50 lbs P2O5, 50 lbs K2O to grow 100 bu corn. These are the base numbers from which we subtract the soil test data after converting from the analytical ppm to Lbs P2O5 or lbs K2O. This is a straight subtraction. It also eliminates the need for \"calibration data\" since the soil tests reflect the soils inherent fertility. Using the example above, of 100, 50, 50 of N, P, and K required and soil test results of 25, 35, 45 then the fertilizer needed would be 75 N, 15 P2O5 and 5 K2O. This is a simple approach that doesn't get lost in relative yield-crop response curves that have been used for decades from differing geographical areas.
\nThis tool will include current fertilizer prices, soil test inputs, and crop based county averages for the last 15 years that will predict the chances of making the yield goal the user inputs compared to historical yield data for their county and calculate the fertilizer cost with and without soil testing compared to user input yield goal and county average. This tool will allow the user via the internet to produce a more straightforward approach to realistically planning next year's fertilizer inputs and associated cost. It will also show the benefits of soil testing for increased fertilizer efficiency and reduced environmental impact.
Resource Title: Website Pointer to SNAP - Soil Nutrient Assessment Program.
File Name: Web Page, url: https://snap.brc.tamus.edu/Home/Index
The web dashboard interface for estimating local yield based on field location (state/county), crop (, area, and yield goal; and soil NPK test results (lb/acre), Results returned illustrate local yield, fertilizer cost/acre, fertilizer needed (lb/acre), and overall chance of success (%).
This is a tool to discover and map single nucleotide polymorphisms in tetraploid and hexaploid wheat and to characterize genetics and structure of the genepools of wheat and wheat diploid ancestors.
Resource Title: Web Page.
File Name: Web Page, url: https://wheat.pw.usda.gov/snpworld/Search
Please note: This software is no longer being updated or maintained, and is out of date.
\nSPUR2 DOS ver. 2.2 is a general grassland ecosystem simulation model designed to determine beef cattle performance and production by simultaneously simulating production of up to 15 plant species on 36 heterogeneous grassland sites. SPUR2 simulates grassland hydrology, nitrogen cycling, and soil organic matter on grazed ecosystems as well as rangeland production under different climatic regimes, environmental conditions, and management alternatives.
Resource Title: SPUR2 download page.
File Name: Web Page, url: https://www.ars.usda.gov/research/software/download/?softwareid=241&modecode=30-12-30-25
STANMOD (STudio of ANalytical MODels) is a Windows based computer software package for evaluating solute transport in porous media using analytical solutions of the convection-dispersion solute transport equation. Version 1.0 of STANMOD includes the following models for one-dimensional transport problems:
\n
\n
\n
Version 2.0 of STANMOD also includes the following models for two- and three-dimensional transport problems:
\n
\n
System Requirements: Intel Pentium processor, 16 Mb RAM, hard disk with at least 20 Mb free disk space, VGA graphics (SVGA with 256 colors recommended), MS Windows 95 or higher.
Resource Title: STANMOD download page.
File Name: Web Page, url: https://www.ars.usda.gov/research/software/download/?softwareid=102&modecode=20-36-15-00
Landsat 30m resolution observations provide sufficient spatial details for monitoring land surface and changes. However, the 16-day revisit cycle and cloud contamination have limited its use for studying global biophysical processes, which evolve rapidly during the growing season. Meanwhile, MODIS sensors aboard the NASA EOS Terra and Aqua satellites provide daily global observations valuable for capturing rapid surface changes. However, the spatial resolution of 250m to 1000m may not good enough for heterogeneous areas. To better utilize Landsat and MODIS data, the Spatial and Temporal Adaptive Reflectance Fusion Model (STARFM) was developed (Gao et al., 2006). The STARFM algorithm uses spatial information from fine-resolution Landsat imagery and temporal information from coarse-resolution MODIS imagery to produce estimates of surface reflectance that are high resolution in both space and time. In essence, the collection of daily MODIS imagery and seasonal Landsat imagery allows the generation of synthetic daily Landsat-like views of the Earth’s surface.
\nThe STARFM algorithm uses comparisons of one or more pairs of observed Landsat/MODIS maps, collected on the same day, to predict maps at Landsat-scale on other MODIS observation dates. STARFM was initially developed at the NASA Goddard Space Flight Center by Dr. Feng Gao. This version (v1.2) has been greatly improved in computing efficiency (e.g. one run for multiple dates and parallel computing) for large-area processing (Gao et al., 2015). Additional improvements (e.g. Landsat and MODIS images co-registration, daily MODIS nadir BRDF-adjusted reflectance) in the operational data fusion system (Wang et al., 2014) are beyond the STARFM program and are not included in this package. Improvement and continuous maintenance are being undertaken in the USDA-ARS Hydrology and Remote Sensing Laboratory (HRSL), Beltsville, MD by Dr. Feng Gao.
\nResource Title: STARFM.
File Name: Web Page, url: https://www.ars.usda.gov/research/software/download/?softwareid=432&modecode=80-42-05-10
download page
A data delivery application that provides web-based access to of soil, water, climate, land management, and geospatial data produced by Conservation Effects Assessment Project (CEAP) watershed research sites across the United States.
\nResource Title: STEWARDS - A data delivery application for the USDA/ARS Conservation Effects Assessment Project.
File Name: Web Page, url: https://www.nrrig.mwa.ars.usda.gov/stewards/stewards.html
Effectively managing salt affected irrigated lands and judicially using irrigation water of marginal salinity quality requires understanding the interactions among many inputs. They include soil salinity, crop salt tolerances, soil physical properties, irrigation water quality, irrigation management, water table depth and quality, climatic factors and crop yield. Visualizing the simultaneous interactions among this many factors over a cropping season extends beyond the capacity of the human mind.
\nAn interactive computer program was developed to simulate the interactions among the above factors. It shows how changing one factor impacts the outcome of the other factors for a single growing season. The user selects a climate, a crop, and soil characteristics from menu lists, and then sets the water table depth and quality, irrigation (river or well) water quality and then develops an irrigation schedule. On execution, the relative yield reductions due to over irrigation, under irrigation, and salinity, water table rise or fall and surface runoff are shown numerically for the growing season. Soil water content, soil salinity, water table depth changes and rain and irrigation events during the season are also shown graphically.
\nThis is an educational tool designed to teach the concepts of salinity and irrigation management and IS NOT an irrigation scheduling program nor a management tool. Two versions have been developed, one using metric units, southern hemisphere growing seasons and Australian terminology, and a second using northern hemisphere growing seasons, with units and terminology currently used in US irrigated agriculture. An option in the US version also allows use of metric units.
\nThe SWAGMAN acronym and the SWAGMAN-Whatif program copyrights are owned by Commonwealth Scientific and Industrial Research Organization (CSIRO) of Australia. The SWAGMAN acronym is not to be used for other programs.
\nResource Title: SWAGMAN.
File Name: Web Page, url: https://www.ars.usda.gov/research/software/download/?softwareid=207
download page
The Soil and Water Assessment Tool (SWAT) is a public domain model jointly developed by USDA Agricultural Research Service (USDA-ARS) and Texas A&M AgriLife Research, part of The Texas A&M University System. SWAT is a small watershed to river basin-scale model to simulate the quality and quantity of surface and ground water and predict the environmental impact of land use, land management practices, and climate change. SWAT is widely used in assessing soil erosion prevention and control, non-point source pollution control and regional management in watersheds.
Resource Title: Website Pointer to SWAT - Soil and Water Assessment Tool .
File Name: Web Page, url: https://swat.tamu.edu/
Soil and Water Assessment Tool (SWAT) website, including software tools, documentation, events, publications, and developer resources.
SWIFT (Small Watershed Nutrient Forecasting Tool), a component of the USDA/ARS Soil and Water Hub, is a web-based tool that allows the rapid estimation of sediment and nutrient loads from small watersheds for a given ecoregion in the US.
\nSWIFT can be used to estimate loads given relatively common information such as watershed size, landuse, and location. Estimated loads are provided as a distribution to illustrate the relative uncertainty inherent in the methods used. The web interface supports charting of precipitation, runoff, water yield, sediment, phosphorus, and nitrogen forecasts by ecoregion, watershed, and landuse (rangeland, cropland, urban, forest, pasture/hay) across the contiguous United States as annual averages.
\nSWIFT is based on the concept of export coefficients and delivery ratios. SWIFT uses export coefficients for major landuse categories in the US derived from SWAT (Soil and Water Assessment Tool) predictions. Delivery components are based on data derived from the CEAP (Conservation Effects and Assessment Project).
\nResource Title: Website Pointer to SWIFT - Small Watershed nutrIent Forecasting Tool.
File Name: Web Page, url: https://swift.brc.tamus.edu/Home/About
The web dashboard interface for charting of precipitation, runoff, water yield, sediment, phosphorus, and nitrogen forecasts by ecoregion, watershed, and landuse (rangeland, cropland, urban, forest, pasture/hay) across the contiguous United States as annual averages.
SWMS_2D is a computer program for simulating water and solute movement in two-dimensional variably saturated media. The program numerically solves the Richards' equation for saturated-unsaturated water flow and the convection-dispersion equation for solute transport. The flow equation incorporates a sink term to account for water uptake by plant roots. The transport equation includes provisions for linear equilibrium adsorption, zero-order production, and first-order degradation. The program may be used to analyze water and solute movement in unsaturated, partially saturated, or fully saturated porous media.
\nSWMS_2D can handle flow regions delineated by irregular boundaries. The flow region itself may be composed of nonuniform soils having an arbitrary degree of local anisotropy. Flow and transport can occur in the vertical plane, the horizontal plane, or in a three-dimensional region exhibiting radial symmetry about the vertical axis. The water flow part of the model can deal with prescribed head and flux boundaries, as well as boundaries controlled by atmospheric conditions.
\nNew features of the present version 1.21 include the implementation of free drainage boundary conditions, and a simplified representation of nodal drains using results of electric analog experiments.
\nThe governing flow and transport equations are solved numerically using Galerkin-type linear finite element schemes. Depending upon the size of the problem, the matrix equations resulting from discretization of the governing equation are solved using either Gaussian elimination for banded matrices, or a conjugate gradient method for symmetric matrices and the ORTHOMIN method for asymmetric matrices.
\nThe program is written in ANSI standard FORTRAN 77. Computer memory is a function of the problem definition. This report serves as both a user manual and reference document. The program comes with a manual containing instructions for data input preparation. Example input and selected output files are also provided as is a listing of the source code.
Resource Title: SWMS-2D download page.
File Name: Web Page, url: https://www.ars.usda.gov/research/software/download/?softwareid=103&modecode=20-36-15-00
SWMS_3D is a computer program for simulating water and solute movement in three-dimensional variably saturated media. The program numerically solves the Richards' equation for saturated-unsaturated water flow and the convection-dispersion equation for solute transport. The flow equation incorporates a sink term to account for water uptake by plant roots. The transport equation includes provisions for linear equilibrium adsorption, zero-order production, and first-order degradation. The program may be used to analyze water and solute movement in unsaturated, partially saturated, or fully saturated porous media. SWMS_3D can handle flow regions delineated by irregular boundaries. The flow region itself may be composed of nonuniform soils having an arbitrary degree of local anisotropy. The water flow part of the model can deal with prescribed head and flux boundaries, as well as boundaries controlled by atmospheric conditions. The governing flow and transport equations are solved numerically using Galerkin-type linear finite element schemes. Depending upon the size of the problem, the matrix equations resulting from discretization of the governing equations are solved using either Gaussian elimination for banded matrices, or a conjugate gradient method for symmetric matrices and the ORTHOMIN method for asymmetric matrices. The program is written in ANSI standard FORTRAN 77. Computer memory is a function of the problem definition, mainly the total number of nodes and elements.
\nThe program comes with a user manual giving detailed instructions for data input preparation. Example input and selected output files are also provided.
Resource Title: SWMS-3D download page.
File Name: Web Page, url: https://www.ars.usda.gov/research/software/download/?softwareid=104&modecode=20-36-15-00
This database aims to provide comprehensive information on the scale insects (Coccoidea) of the world, of which there are about about 7,800 species.
\nScale insects vary dramatically in their appearance from very small organisms (1-2mm) that occur under wax covers (some look like oyster shells), to shiny pearl-like objects (about 5mm), to creatures covered with mealy wax. They spend most or all of their lives feeding on plants and are primarily important as plant pests in greenhouses, backyards, and on fruit trees.\nScale insects damage millions of dollars worth of food, ornamental, fiber and greenhouse crops each year. Until ScaleNet, information about the pests was buried in thousands of scientific journals and books, making it difficult for the average person to locate.
\nThe Agricultural Research Service developed ScaleNet with colleagues in Israel and Canada. It will allow anyone to locate every scale insect that experts over the centuries have found and named.
\nThrough keyword searches and other queries, ScaleNet provides comprehensive information including the insects' biology, classification, naming history, distribution, plant hosts, economic importance, controls and scientific literature about them.
\nCurrently, information can be retrieved for 49 families, namely Aclerdidae (grass scales), Albicoccidae, Arnoldidae, Asterolecaniidae (pit scales), Beesoniidae, Burmacoccidae, Callipappidae, Carayonemidae, Cerococcidae (ornate pit scales), Coccidae (soft scales), Coelostomidiidae, Conchaspididae (false armoured scales), Dactylopiidae (cochineal scales), Diaspididae (armoured scale insects), Electrococcidae, Eriococcidae (felt scales), Grimaldiellidae, Grohnidae, Halimococcidae, Hammanococcidae, Inkaidae, Jersicoccidae, Kermesidae (gall-like scales), Kerriidae (lac scales), Kukaspididae, Kuwaniidae, Labiococcidae, Lebanococcidae, Lecanodiaspididae (false pit scales), Lithuanicoccidae, Marchalinidae, Margarodidae (ground pearls), Matsucoccidae (bast scales), Micrococcidae, Monophlebidae, Ortheziidae (ensign scales), Pennygullaniidae, Phenacoleachiidae, Phoenicococcidae (date scales), Pityococcidae, Pseudococcidae (mealybugs), Putoidae, Rhizoecidae, Serafinidae, Steingeliidae, Stictococcidae, Stigmacoccidae, Weitschatidae, and Xylococcidae.
\nThe Reference database of ScaleNet includes about 25,000 references, the majority of which have been published since Linnaeus (1758). However, it also contains several pre-Linnean publications that are relevant to the nomenclature and systematics of the Coccoidea.
\nThis is a re-implementation of the original version of ScaleNet, a FoxPro application developed by Yair Ben-Dov, Douglass R. Miller and Gary A. P. Gibson with major support from the United States-Israel Binational Agricultural Research and Development Fund. The original application was heavily used by insect scientists and insect identifiers for close to two decades. This version was built by Mayrolin García and Nate Hardy using open source software (Linux, SQLite, Django (a Python web framework), and Apache2). Its development is supported by a Specific Cooperative Research agreement between Gary Miller at the USDA Systematic Entomology Lab and Nate Hardy at Auburn University. As part of the re-implementation, the data model was normalized, and the scientific names and classifications of ecological associates were updated and standardized.
\nResource Title: ScaleNet : Scale insects (Coccoidea) database (web site) .
File Name: Web Page, url: http://scalenet.info/
The objective of this site is to provide comprehensive information on the scale insects of\nthe world, including queriable information on their classification, nomenclatural history,\ndistribution, hosts, and literature.
\nThis data package contains reference harvest measurements for the long-term Net Primary Production (NPP) study at the Jornada Basin LTER. Data here include horizontal cover, vertical height, and aboveground biomass of plants harvested near, but outside, a grid of permanent NPP quadrats at each of 15 NPP sites. These sites were selected to represent the 5 major ecosystem types in the Chihuahuan Desert (upland grasslands, playa grasslands, mesquite-dominated shrublands, creosotebush-dominated shrublands, tarbush-dominated shrublands). For each ecosystem type, three sites were selected to represent the range in variability in production and plant diversity; thus the locations are not replicates. At each site, a 1 hectare area was fenced in 1988 and a grid of 49 (48 at one playa location) 1m x 1m replicate quadrats was laid out when sampling began in 1989. Harvests are made outside the quadrat grid, but inside the fence. Height and cover are recorded in the field. Live biomass is weighed in the lab and all measurements are recorded as reference harvest data. Subsequently, regressions between the harvested biomass and plant volume values are used to derive allometric equations that determine biomass from non-destructive volume measurements in the permanent NPP quadrats. Further details are described in the methods metadata. This is an ongoing study with new harvest data (from selected species) collected in the spring, fall, and winter each year.Attention:These data are not appropriate for estimates of percentage cover because of the way the data are collected.
Resource Title: Website Pointer to html file.
File Name: Web Page, url: https://portal.edirepository.org/nis/mapbrowse?scope=knb-lter-jrn&identifier=210011004
Webpage with information and links to data files for download
Knowledge of the vertical distribution of surface residues, chemicals, or seeds following tillage operations is of paramount importance to a wide variety of soil research areas. SeedChaser is a 1-D empirical vertical soil tillage distribution model with 1 cm grid spacing that predicts vertical redistribution of weed seeds following user selected (a) sequences of tillage implements, and (b) initial seed distribution values. Results of this model are particularly suited for weed seed emergence modeling. However, the model can be adapted easily to any surface broadcasted agrochemical or incorporated residues. The present model can handle up to twenty passes of user selected sequences of sixteen different implements.
\nMajority of prior models examined only the impact of a more limited list of implements at much larger depth intervals, which reduced the predictability of fine-scale vertical movement that may be needed for simulating movements of seeds or chemical granules. SeedChaser consolidates the results from these previous models along with new data on conservation tillage implements into a prediction tool that would have applications both in weed science, as well as other soil research areas.
\nThis model was developed in JAVA, is simple to use, and runs on multiple platforms (e.g. Mac, PC, Sun).
Resource Title: SeedChaser - Version 2.0.
File Name: Web Page, url: https://www.ars.usda.gov/research/software/download/?softwareid=84&modecode=50-60-05-00
download page
This dataset contains growing season precipitation data collected from an extensive rain gauge network with thirty catch cans distributed on the USDA-Central Plains Experimental Range (CPER) in Nunn, Colorado from 1982-2013. The CPER is a site in the USDA Long-term Agroecosystem Research Network. These data provide records of long-term observations, which can be applied to assess responses to naturally occurring deluges across the 62.7 km2 CPER in NE Colorado, a SGS ecosystem with significant spatial variation in precipitation received during the growing season, soils and grazing management, and where several small-scale deluge experiments have been conducted.
Resource Title: Raw Precipitation Data .
File Name: PrecipitationData_1982_2013_Raw.csv
Resource Description: Raw Precipitation Data from thirty catch can gauges on the Central Plains Experimental Range
Resource Title: Processed precipitation data to identify deluges.
File Name: PrecipitationData_Processed.csv
Resource Description: Processed precipitation data to identify deluges on the Central Plain Experimental Range
Resource Title: Data Dictionary for raw and processed data.
File Name: DataDictionary_PrecipitationData_Raw_Processed_CPER.csv
Resource Description: Data dictionary for processed precipitation data to identify deluges and for raw precipitation data from thirty catch can gauges on the Central Plains Experimental Range.\n
Shortgrass Steppe for Greenhouse gas Reduction through Agricultural Carbon Enhancement network in Nunn, Colorado\nCattle play a major role in nutrient cycling of grassland ecosystems through biomass removal and excrement deposition (urine and feces). We studied the effects of cattle excrement patches (urine at 430 and feces at 940 kg N ha-1) on nitrous oxide (N2O) and methane (CH4) fluxes using semi-static chambers on cool-season (C3), Bozoisky-select (*Psathyrostachys juncea*) pasture, and warm-season (C4)-dominated native rangeland of the shortgrass steppe (SGS) in northeastern Colorado. Nitrous oxide emission factors (EF; i.e., percent of added N emitted as N2O-N) did not differ between urine and feces on the C4-dominated native rangeland (0.11 and 0.10%) and C3 pasture (0.13 and 0.10%). These EFs are substantially less than the Intergovernmental Panel on Climate Change (IPCC) Tier 1 Default EF (2%) for manure deposited on pasture, indicating that during dry years the IPCC Tier 1 Default EF would result in a significant overestimation of emissions from excrement patches deposited on SGS C4-dominated native rangeland and C3 pasture. Over the first year of the study (19 June 2012 to 18 June 2013), cumulative CH4 uptake was 38% greater for urine (-1.49 vs. -1.08 kg CH4-C ha-1) and 28% greater for control plots (-2.09 vs. -1.63 kg CH4-C ha-1) on C4-dominated native rangeland compared to C3 pasture. In contrast, feces patches were net sources of CH4 with emissions from the C3 pasture (0.64 kg CH4-C ha-1) 113% greater than the C4-dominated native rangeland (0.30 kg CH4-C ha-1). Conversion of C4-dominated native rangeland to C3 pasture can have short and long term effects on CH4 uptake; therefore consideration should be taken before implementing this management practice.
Resource Title: Nunn, CO Shortgrass Steppe (CONUNRBS) CSV data.
File Name: CONUNRBS_csv_data.zip
Resource Description: CSV format data on Experimental Units, Field Sites, Greenhouse Gas Flux, Soil Chemistry, Soil Physics, Amendments, Planting, Persons, Treatments, Weather Daily, Weather Station.
WinTR-55 is a single-event rainfall-runoff small watershed hydrologic model. The model generates hydrographs from both urban and agricultural areas and at selected points along the stream system. Hydrographs are routed downstream through channels and/or reservoirs. Multiple sub-areas can be modeled within the watershed.
\nHistorical Background
\nTechnical Release 55 (TR-55) Urban Hydrology for Small Watersheds was first issued in January 1975 as a simplified procedure to calculate the storm runoff volume, peak rate of discharge, hydrographs and storage volumes required for storm water management structures (SCS, 1975). The first issue involved manual methods and assumed the NRCS Type II rainfall distribution for all calculations.
\nIn June 1986 major revisions were made in TR-55 by adding three rainfall distributions (Type I, IA and III) and programming the computations. Time of concentration was estimated by splitting the hydraulic flow path into separate flow phases (SCS, 1986). The computer program became a standard tool to analyze peak flow changes caused by urbanization in many locations. Its wide acceptance by public and private users has also indicated where improvements could be made in the procedures and the computer program.
\nA WinTR-55 work group was formed in the spring of 1998 to modernize and revise the Technical Release and the computer software. The current changes include: upgrade the source code to Visual Basic, change the philosophy of data input, develop a Windows interface and output post- processor, enhance the hydrograph-generation capability of the software and flood route hydrographs through stream reaches and reservoirs.
\nThe availability and technical capabilities of the personal computer have significantly changed the philosophy of problem-solving for the engineer. Computer availability eliminated the need for WinTR-55 Guide methods, thus the guide portions (graphs and tables) of the user document have been eliminated. This user guide covers the procedures used in and the operation of the WinTR-55 computer program. Part 630 of the Natural Resources Conservation Service (NRCS) National Engineering Handbook provides detailed information on NRCS hydrology and is the technical reference for this document. Appendix C of the WinTR-55 User Guide (part of the install package) contains a list of the Part 630 chapters and their subjects. Users who are not familiar with NRCS hydrologic procedures should refer to the appropriate chapters for background information and the details of procedural techniques.
Resource Title: Small Watershed Hydrology (WinTR-55).
File Name: Web Page, url: https://www.ars.usda.gov/research/software/download/?softwareid=8&modecode=80-42-05-10
download page
The Snowmelt-Runoff Model (WinSRM) is designed to simulate and forecast daily streamflow in mountain basins where snowmelt is a major runoff factor. The Snowmelt Runoff Model (SRM) is a simple degree-day model that requires remote sensing input in the form of basin or zonal snow cover extent. The model has been tested successfully on over 60 basins worldwide in the simulation and forecast modes. Model variables are derived from actual observations of temperature, precipitation, and snow covered area. Model parameters can either be derived from measurements or estimated by hydrological judgement taking into account the basin characteristics, physical laws, and theoretical or empirical relationships. To facilitate use of SRM, a microcomputer version of the program has been developed for IBM compatible personal computers. The program itself features user-oriented input and multiple self-help screens which allow the user to select the kind of data input employed and the output products desired.
Resource Title: Snowmelt Runoff Model for Windows (WinSRM).
File Name: Web Page, url: https://www.ars.usda.gov/research/software/download/?softwareid=7&modecode=80-42-05-10
download page
The Agricultural Research Service of the US Department of Agriculture (USDA) in collaboration with other government agencies has a program to track changes in the sodium content of commercially processed and restaurant foods. This monitoring program includes these activities:
\nThe Sodium Monitoring Dataset is downloadable in Excel spreadsheet format.
Resource Title: Data Dictionary.
File Name: SodiumMonitoringDataset_datadictionary.csv
Resource Description: Defines variables, descriptions, data types, character length, etc. for each of the spreadsheets in this Excel data file: Sentinel Foods - Baseline; Priority-2 Foods - Baseline; Sentinel Foods - Monitoring; Priority-2 Foods - Monitoring.
Resource Title: Sodium Monitoring Dataset (MS Excel download).
File Name: SodiumMonitoringDatasetUpdatedJuly2616.xlsx
Resource Description: Microsoft Excel : Sentinel Foods - Baseline; Priority-2 Foods - Baseline; Sentinel Foods - Monitoring; Priority Foods - Monitoring.
SPAW is a daily hydrologic budget model for agricultural fields and ponds (wetlands, lagoons, ponds and reservoirs). Included are irrigation scheduling and soil nitrogen. Data input and results are graphical screens.
\nThe SPAW (Soil-Plant-Air-Water) computer model simulates the daily hydrologic water budgets of agricultural landscapes by two connected routines, one for farm fields and a second for impoundments such as wetland ponds, lagoons or reservoirs. Climate, soil and vegetation data files for field and pond projects are selected from those prepared and stored with a system of interactive screens. Various combinations of the data files readily represent multiple landscape and ponding variations.
\nResource Title: Soil Water Characteristics - Equations.
File Name: Soil Water Characteristics-Equations.xls
Resource Title: Instructions for Access to USDA / NRCS Soils Data.
File Name: Accessing USDA Soils Data.pdf
Resource Title: Evaporation default files for USA.
File Name: SPAW Evaporation Default Files.zip
Resource Description: These *.djvu files require a free reader plug-in available from : http://www.djvuzone.org/download.html.
Soil Dynamics Research for Greenhouse gas Reduction through Agricultural Carbon Enhancement network in Auburn, Alabama\nThis study provides data on soil C and N dynamics and subsequent trace gas emissions at the landscape scale. Evaluates effects of landscape and soil management on 1) methane (CH4), nitrous oxide (N2O) and carbon dioxide (CO2) fluxes, 2) soil carbon (C) and nitrogen (N) mineralization and 3) cover crop decomposition and mineralization. Gas fluxes, C and N mineralization, and cover crop decomposition were determined on a 9-ha field at the E.V. Smith Research Center near Shorter, in AL. Consists of six replications of agroecosystem management [(corn (Zea mays L.)-cotton (Gossypium hirsutum L). rotation] that traverse the landscape. Soil managements included CsT, conventional tillage (CT), conservation tillage with dairy manure (CsTM), and conventional tillage with dairy manure (CTM) treatments. The soil management treatments were within summit, sideslope and the drainageway landscape positions. The drainageway landscape position emitted 46, 251, 59, and 185 mg CH4-C ha-1 h-1 from CT, CTM, CsT and CsTM treatments, respectively. The summit position was a CH4 consumer with CT and CsT treatments. Significant soil management treatment differences in N2O-N flux were observed only within the drainageway landscape position. Averaged across seasons, CT and CsT emitted similar N2O-N in the drainageway. Within the drainageway, dairy manure decreased N2O-N emission on CT treatments. Carbon dioxide emission in winter 2005 from CsT treatments (averaged across landscape positions) was 1304 g ha-1 h-1 CO2-C compared to 227 g ha-1 h-1 CO2-C from CT treatments. CsT and CsTM treatments increased soil organic C and total soil N after six years. This resulted in higher C and N mineralization on soils from CsT and CsTM treatments, with no differences between landscape positions. Potential C mineralization was similar for crimson clover, spring forage rape and white lupin amended soil while black oat amended soil immobilized N. Buried cover crops decomposed and mineralized faster than surface applied materials, with no differences in cover crop decomposition and mineralization k across landscape positions. Overall, landscape variability had minimal effect on C and N dynamics and cover crop decomposition compared to soil management effects. Conservation tillage, dairy manure applications, and cover crops showed potential to sequester soil organic C and increase total soil N in these systems.The study site is located at the Alabama Agricultural Experiment Station’s E.V. Smith Research Center, near Shorter. Four management treatments were established in late summer of2000 on a corn and cotton rotation that has both crops present each year. The management systems included a conventional tillage system (chisel- followed by disc-plow) with (CT+M) and without (CT) manure, and a conservation tillage system (non- inversion tillage) that incorporated the use of winter cover crops with (NT+M) and without manure (NT). A mixture of rye (Secale cereale L.) with black oat (Avena strigosa Schreb.), and a mixture of crimson clover (Trifolium incarnatum L.) with white lupin (Lupinus albus L.) and fodder radish (Raphanus sativus L.) were typically used as winter cover before cotton (Gossypium hirsutum L.) and corn (Zea mays L.), respectively. Four strips with an average length of 800 ft were established across the landscape to represent the four management systems for each crop per each replication. Each strip was further divided into cells to simplify sampling and field measurements. A total of six replications were established on the 22 ac field. Maximum slope is 8% and 9 soil map units are contained within this landscape. Prior research work at the same field site delineated four distinct zones using a digital elevation map, electrical conductivity survey, and traditional soil mapping techniques. For this study, three of these zones were selected and recognized as summit, backslope, and accumulation zones in the landscape. Two cells per management and zone were selected to conduct soil physical properties characterization (Fig. 1). Soil properties studied included total soil C by dry combustion at three depths, water infiltration with a mini-disk infiltrometer (Decagon Devices Inc., Pullman, WA)1, and water stable aggregates (Nimmo and Perkings, 2002). Data were analyzed with the MIXED model procedure in SAS (SAS Institute Inc., Cary, NC). Management system, landscape position, depth, and their interactions were considered as fixed effects.
Resource Title: Auburn, AL Soil Dynamics Research (ALAUSDR) CSV data.
File Name: ALAUSDR_csv_data.zip
Resource Description: CSV format data on Experimental Units, Field Sites, Greenhouse Gas Flux, Residue Management, Soil Chemistry, Soil Physics, Amendments, Planting, Tillage, Persons, Treatments, Weather Daily, Weather Station.
Purpose: The STM2 model predicts the soil temperature and moisture conditions based on very limited user inputs. The input requirements are:
\nThere is a help file that describes the program included in the file list below (STM2_description.doc).
\nDisclaimer: The USDA-ARS makes no warranties as to the merchantability or fitness of STM2 for any particular purpose, or any other warranties expressed or implied. Since some portions of STM2 have been validated with only limited data sets, it should not be used to make operational management decisions. The USDA-ARS is not liable for any damages resulting from the use or misuse of STM2, its output and its accompanying documentation.
\nSTM2 was written in Java, and therefore can run on multiple platforms (e.g. Windows, Mac, Unix).
Resource Title: Soil Temperature and Moisture Model.
File Name: Web Page, url: https://www.ars.usda.gov/research/software/download/?softwareid=209&modecode=50-60-05-00
download page
[NOTE - 2022-09-07: this dataset is superseded by an updated version https://doi.org/10.15482/USDA.ADC/1526332 ]
\nThis dataset contains soil water content data developed from neutron probe readings taken in access tubes in each of the four large, precision weighing lysimeters and in the fields surrounding each lysimeter at the USDA-ARS Conservation and Production Laboratory (CPRL), Soil and Water Management Research Unit (SWMRU), Bushland, Texas (Lat. 35.186714°, Long. -102.094189°, elevation 1170 m above MSL) beginning in 1989. Readings were taken periodically with a field-calibrated neutron probe at depths from 10 cm to 230 cm (maximum of 190 cm depth in the lysimeters) in 20-cm depth increments. Periods between readings were typically one to two weeks, sometimes longer according to experimental design and need for data. Field calibrations in the Pullman soil series were done every few years. Calibrations typically produced a regression equation with RMSE <= 0.01 m3 m-3 (e.g., Evett and Steiner, 1995). Data were used to guide irrigation scheduling to achieve full or deficit irrigation as required by the experimental design. Data may be used to calculate the soil profile water content in mm of water from the surface to the maximum depth of reading. Profile water content differences between reading times in the same access tube are considered the change in soil water storage during the period in question and may be used to compute evapotranspiration (ET) using the soil water balance equation: ET = (change in storage + P + I + F + R, where P is precipitation during the period, I is irrigation during the period, F is soil water flux (drainage) out of the bottom of the soil profile during the period, and R is the sum of runon and runoff during the period. Typically, R is taken as zero because the fields were furrow diked to prevent runon and runoff during most of each growing season.
Resource Title: 1995 Bushland, TX, east alfalfa volumetric soil water content data.
File Name: 1995_East_Alfalfa_Soil-water.xlsx
Resource Description: Contains periodic volumetric soil water content data from neutron probe readings in 20-cm depth increments from 10-cm depth to 230-cm depth in access tubes in fields around each of the Bushland, TX, large, precision weighing lysimeters, and to 190-cm depth in each lysimeter. The excel file contains a data dictionary for each tab containing data. There is also a tab named Introduction that lists the authors, equipment used, relevant citations, and explains the other tabs, which contain either data dictionaries, data, geographical coordinates of access tube locations, or data visualization tools. Tab names are unique so that tabs may be saved as individual CSV files.
Resource Title: 1996 Bushland, TX, east alfalfa volumetric soil water content data.
File Name: 1996_East_Alfalfa_Soil-water.xlsx
Resource Description: Contains periodic volumetric soil water content data from neutron probe readings in 20-cm depth increments from 10-cm depth to 230-cm depth in access tubes in fields around each of the Bushland, TX, large, precision weighing lysimeters, and to 190-cm depth in each lysimeter. The excel file contains a data dictionary for each tab containing data. There is also a tab named Introduction that lists the authors, equipment used, relevant citations, and explains the other tabs, which contain either data dictionaries, data, geographical coordinates of access tube locations, or data visualization tools. Tab names are unique so that tabs may be saved as individual CSV files.
Resource Title: 1997 Bushland, TX, east alfalfa volumetric soil water content data.
File Name: 1997_East_Alfalfa_Soil-water.xlsx
Resource Description: Contains periodic volumetric soil water content data from neutron probe readings in 20-cm depth increments from 10-cm depth to 230-cm depth in access tubes in fields around each of the Bushland, TX, large, precision weighing lysimeters, and to 190-cm depth in each lysimeter. The excel file contains a data dictionary for each tab containing data. There is also a tab named Introduction that lists the authors, equipment used, relevant citations, and explains the other tabs, which contain either data dictionaries, data, geographical coordinates of access tube locations, or data visualization tools. Tab names are unique so that tabs may be saved as individual CSV files.
Resource Title: 1998 Bushland, TX, east alfalfa volumetric soil water content data.
File Name: 1998_East_Alfalfa_Soil-water.xlsx
Resource Description: Contains periodic volumetric soil water content data from neutron probe readings in 20-cm depth increments from 10-cm depth to 230-cm depth in access tubes in fields around each of the Bushland, TX, large, precision weighing lysimeters, and to 190-cm depth in each lysimeter. The excel file contains a data dictionary for each tab containing data. There is also a tab named Introduction that lists the authors, equipment used, relevant citations, and explains the other tabs, which contain either data dictionaries, data, geographical coordinates of access tube locations, or data visualization tools. Tab names are unique so that tabs may be saved as individual CSV files.
Resource Title: 1999 Bushland, TX, east alfalfa volumetric soil water content data.
File Name: 1999_East_Alfalfa_Soil-water.xlsx
Resource Description: Contains periodic volumetric soil water content data from neutron probe readings in 20-cm depth increments from 10-cm depth to 230-cm depth in access tubes in fields around each of the Bushland, TX, large, precision weighing lysimeters, and to 190-cm depth in each lysimeter. The excel file contains a data dictionary for each tab containing data. There is also a tab named Introduction that lists the authors, equipment used, relevant citations, and explains the other tabs, which contain either data dictionaries, data, geographical coordinates of access tube locations, or data visualization tools. Tab names are unique so that tabs may be saved as individual CSV files.
This dataset contains soil water content data developed from neutron probe readings taken in access tubes in each of the four large, precision weighing lysimeters and in the fields surrounding each lysimeter at the USDA-ARS Conservation and Production Laboratory (CPRL), Soil and Water Management Research Unit (SWMRU), Bushland, Texas (Lat. 35.186714°, Long. -102.094189°, elevation 1170 m above MSL) beginning in 1989. Readings were taken periodically with a field-calibrated neutron probe at depths from 10 cm to 230 cm (maximum of 190 cm depth in the lysimeters) in 20-cm depth increments. Periods between readings were typically one to two weeks, sometimes longer according to experimental design and need for data. Field calibrations in the Pullman soil series were done every few years. Calibrations typically produced a regression equation with RMSE <= 0.01 m3 m-3. Data were used to guide irrigation scheduling to achieve full or deficit irrigation as required by the experimental design. Data may be used to calculate the soil profile water content in mm of water from the surface to the maximum depth of reading. Profile water content differences between reading times in the same access tube are considered the change in soil water storage during the period in question and may be used to compute evapotranspiration (ET) using the soil water balance equation: ET = (change in storage + P + I + F + R, where P is precipitation during the period, I is irrigation during the period, F is soil water flux (drainage) out of the bottom of the soil profile during the period, and R is the sum of runon and runoff during the period. Typically, R is taken as zero because the fields were furrow diked to prevent runon and runoff during most of each growing season.
\nSee the README for descriptions of each data file.
", "title": "Soil Water Content Data for The Bushland, Texas Large Weighing Lysimeter Experiments", "distribution": [ { "@type": "dcat:Distribution", "downloadURL": "https://ndownloader.figshare.com/files/44531285", "format": "xlsx", "mediaType": "application/vnd.openxmlformats-officedocument.spreadsheetml.sheet", "title": "1989_East_Maize_Soil-water.xlsx" }, { "@type": "dcat:Distribution", "downloadURL": "https://ndownloader.figshare.com/files/44531288", "format": "xlsx", "mediaType": "application/vnd.openxmlformats-officedocument.spreadsheetml.sheet", "title": "1990_East_Maize_Soil-water.xlsx" }, { "@type": "dcat:Distribution", "downloadURL": "https://ndownloader.figshare.com/files/44531291", "format": "xlsx", "mediaType": "application/vnd.openxmlformats-officedocument.spreadsheetml.sheet", "title": "1994_East_Maize_Soil-water.xlsx" }, { "@type": "dcat:Distribution", "downloadURL": "https://ndownloader.figshare.com/files/44531294", "format": "xlsx", "mediaType": "application/vnd.openxmlformats-officedocument.spreadsheetml.sheet", "title": "1994_West_Maize_Soil-water.xlsx" }, { "@type": "dcat:Distribution", "downloadURL": "https://ndownloader.figshare.com/files/44531297", "format": "xlsx", "mediaType": "application/vnd.openxmlformats-officedocument.spreadsheetml.sheet", "title": "2013_East_Maize_Soil-water.xlsx" }, { "@type": "dcat:Distribution", "downloadURL": "https://ndownloader.figshare.com/files/44531300", "format": "xlsx", "mediaType": "application/vnd.openxmlformats-officedocument.spreadsheetml.sheet", "title": "2013_West_Maize_Soil-water.xlsx" }, { "@type": "dcat:Distribution", "downloadURL": "https://ndownloader.figshare.com/files/44531303", "format": "xlsx", "mediaType": "application/vnd.openxmlformats-officedocument.spreadsheetml.sheet", "title": "2016_East_Maize_Soil-water.xlsx" }, { "@type": "dcat:Distribution", "downloadURL": "https://ndownloader.figshare.com/files/44531306", "format": "xlsx", "mediaType": "application/vnd.openxmlformats-officedocument.spreadsheetml.sheet", "title": "2016_West_Maize_Soil-water.xlsx" }, { "@type": "dcat:Distribution", "downloadURL": "https://ndownloader.figshare.com/files/44531309", "format": "xlsx", "mediaType": "application/vnd.openxmlformats-officedocument.spreadsheetml.sheet", "title": "2018_East_Maize_Soil-water.xlsx" }, { "@type": "dcat:Distribution", "downloadURL": "https://ndownloader.figshare.com/files/44531312", "format": "xlsx", "mediaType": "application/vnd.openxmlformats-officedocument.spreadsheetml.sheet", "title": "2018_West_Maize_Soil-water.xlsx" }, { "@type": "dcat:Distribution", "downloadURL": "https://ndownloader.figshare.com/files/44531315", "format": "xlsx", "mediaType": "application/vnd.openxmlformats-officedocument.spreadsheetml.sheet", "title": "1989-90_West_Winter-Wheat_Soil-water_0.xlsx" }, { "@type": "dcat:Distribution", "downloadURL": "https://ndownloader.figshare.com/files/44531318", "format": "xlsx", "mediaType": "application/vnd.openxmlformats-officedocument.spreadsheetml.sheet", "title": "1991-92_East_Winter-Wheat_Soil-water_0.xlsx" }, { "@type": "dcat:Distribution", "downloadURL": "https://ndownloader.figshare.com/files/44531321", "format": "xlsx", "mediaType": "application/vnd.openxmlformats-officedocument.spreadsheetml.sheet", "title": "1992-93_West_Winter-Wheat_Soil-water_0.xlsx" }, { "@type": "dcat:Distribution", "downloadURL": "https://ndownloader.figshare.com/files/44531327", "format": "xlsx", "mediaType": "application/vnd.openxmlformats-officedocument.spreadsheetml.sheet", "title": "2009_East_Sunflower_Soil-water.xlsx" }, { "@type": "dcat:Distribution", "downloadURL": "https://ndownloader.figshare.com/files/44531330", "format": "xlsx", "mediaType": "application/vnd.openxmlformats-officedocument.spreadsheetml.sheet", "title": "2011_East_Sunflower_Soil-water.xlsx" }, { "@type": "dcat:Distribution", "downloadURL": "https://ndownloader.figshare.com/files/44531333", "format": "xlsx", "mediaType": "application/vnd.openxmlformats-officedocument.spreadsheetml.sheet", "title": "2003_East_Soybean_Soil-water.xlsx" }, { "@type": "dcat:Distribution", "downloadURL": "https://ndownloader.figshare.com/files/44531336", "format": "xlsx", "mediaType": "application/vnd.openxmlformats-officedocument.spreadsheetml.sheet", "title": "2004_East_Soybean_Soil-water.xlsx" }, { "@type": "dcat:Distribution", "downloadURL": "https://ndownloader.figshare.com/files/44531339", "format": "xlsx", "mediaType": "application/vnd.openxmlformats-officedocument.spreadsheetml.sheet", "title": "2010_West_Soybean_Soil-water.xlsx" }, { "@type": "dcat:Distribution", "downloadURL": "https://ndownloader.figshare.com/files/44531342", "format": "xlsx", "mediaType": "application/vnd.openxmlformats-officedocument.spreadsheetml.sheet", "title": "2019_East_Soybean_Soil-water.xlsx" }, { "@type": "dcat:Distribution", "downloadURL": "https://ndownloader.figshare.com/files/44531345", "format": "xlsx", "mediaType": "application/vnd.openxmlformats-officedocument.spreadsheetml.sheet", "title": "2019_West_Soybean_Soil-water.xlsx" }, { "@type": "dcat:Distribution", "downloadURL": "https://ndownloader.figshare.com/files/44531348", "format": "xlsx", "mediaType": "application/vnd.openxmlformats-officedocument.spreadsheetml.sheet", "title": "1995_West_Soybean_Soil-water_0.xlsx" }, { "@type": "dcat:Distribution", "downloadURL": "https://ndownloader.figshare.com/files/44531357", "format": "xlsx", "mediaType": "application/vnd.openxmlformats-officedocument.spreadsheetml.sheet", "title": "2000_East_Cotton_Soil-water.xlsx" }, { "@type": "dcat:Distribution", "downloadURL": "https://ndownloader.figshare.com/files/44531360", "format": "xlsx", "mediaType": "application/vnd.openxmlformats-officedocument.spreadsheetml.sheet", "title": "2000_West_Cotton_Soil-water.xlsx" }, { "@type": "dcat:Distribution", "downloadURL": "https://ndownloader.figshare.com/files/44531363", "format": "xlsx", "mediaType": "application/vnd.openxmlformats-officedocument.spreadsheetml.sheet", "title": "2001_East_Cotton_Soil-water.xlsx" }, { "@type": "dcat:Distribution", "downloadURL": "https://ndownloader.figshare.com/files/44531366", "format": "xlsx", "mediaType": "application/vnd.openxmlformats-officedocument.spreadsheetml.sheet", "title": "2001_West_Cotton_Soil-water.xlsx" }, { "@type": "dcat:Distribution", "downloadURL": "https://ndownloader.figshare.com/files/44531372", "format": "xlsx", "mediaType": "application/vnd.openxmlformats-officedocument.spreadsheetml.sheet", "title": "2002_East_Cotton_Soil-water.xlsx" }, { "@type": "dcat:Distribution", "downloadURL": "https://ndownloader.figshare.com/files/44531375", "format": "xlsx", "mediaType": "application/vnd.openxmlformats-officedocument.spreadsheetml.sheet", "title": "2004_West_Cotton-sorghum_Soil-water.xlsx" }, { "@type": "dcat:Distribution", "downloadURL": "https://ndownloader.figshare.com/files/44531378", "format": "xlsx", "mediaType": "application/vnd.openxmlformats-officedocument.spreadsheetml.sheet", "title": "2008_East_Cotton_Soil-water.xlsx" }, { "@type": "dcat:Distribution", "downloadURL": "https://ndownloader.figshare.com/files/44531381", "format": "xlsx", "mediaType": "application/vnd.openxmlformats-officedocument.spreadsheetml.sheet", "title": "2008_West_Cotton_Soil-water.xlsx" }, { "@type": "dcat:Distribution", "downloadURL": "https://ndownloader.figshare.com/files/44531384", "format": "xlsx", "mediaType": "application/vnd.openxmlformats-officedocument.spreadsheetml.sheet", "title": "2010_East_Cotton_Soil-water.xlsx" }, { "@type": "dcat:Distribution", "downloadURL": "https://ndownloader.figshare.com/files/44531387", "format": "xlsx", "mediaType": "application/vnd.openxmlformats-officedocument.spreadsheetml.sheet", "title": "2012_West_Cotton_Soil-water.xlsx" }, { "@type": "dcat:Distribution", "downloadURL": "https://ndownloader.figshare.com/files/44531390", "format": "xlsx", "mediaType": "application/vnd.openxmlformats-officedocument.spreadsheetml.sheet", "title": "2020_East_Cotton_Soil-water.xlsx" }, { "@type": "dcat:Distribution", "downloadURL": "https://ndownloader.figshare.com/files/44531393", "format": "xlsx", "mediaType": "application/vnd.openxmlformats-officedocument.spreadsheetml.sheet", "title": "2020_West_Cotton_Soil-water.xlsx" }, { "@type": "dcat:Distribution", "downloadURL": "https://ndownloader.figshare.com/files/44531396", "format": "xlsx", "mediaType": "application/vnd.openxmlformats-officedocument.spreadsheetml.sheet", "title": "2021_East_Cotton_Soil-water.xlsx" }, { "@type": "dcat:Distribution", "downloadURL": "https://ndownloader.figshare.com/files/44531399", "format": "xlsx", "mediaType": "application/vnd.openxmlformats-officedocument.spreadsheetml.sheet", "title": "2021_West_Cotton_Soil-water.xlsx" }, { "@type": "dcat:Distribution", "downloadURL": "https://ndownloader.figshare.com/files/44531402", "format": "xlsx", "mediaType": "application/vnd.openxmlformats-officedocument.spreadsheetml.sheet", "title": "2003_West_Sorghum-cotton_Soil-water.xlsx" }, { "@type": "dcat:Distribution", "downloadURL": "https://ndownloader.figshare.com/files/44531405", "format": "xlsx", "mediaType": "application/vnd.openxmlformats-officedocument.spreadsheetml.sheet", "title": "1988_West_Sorghum_Soil-water.xlsx" }, { "@type": "dcat:Distribution", "downloadURL": "https://ndownloader.figshare.com/files/44531408", "format": "xlsx", "mediaType": "application/vnd.openxmlformats-officedocument.spreadsheetml.sheet", "title": "1991_West_Sorghum_Soil-water.xlsx" }, { "@type": "dcat:Distribution", "downloadURL": "https://ndownloader.figshare.com/files/44531411", "format": "xlsx", "mediaType": "application/vnd.openxmlformats-officedocument.spreadsheetml.sheet", "title": "1993_East_Sorghum_Soil-water.xlsx" }, { "@type": "dcat:Distribution", "downloadURL": "https://ndownloader.figshare.com/files/44531414", "format": "xlsx", "mediaType": "application/vnd.openxmlformats-officedocument.spreadsheetml.sheet", "title": "1997_West_Sorghum_Soil-water.xlsx" }, { "@type": "dcat:Distribution", "downloadURL": "https://ndownloader.figshare.com/files/44531417", "format": "xlsx", "mediaType": "application/vnd.openxmlformats-officedocument.spreadsheetml.sheet", "title": "1998_West_Sorghum_Soil-water.xlsx" }, { "@type": "dcat:Distribution", "downloadURL": "https://ndownloader.figshare.com/files/44531420", "format": "xlsx", "mediaType": "application/vnd.openxmlformats-officedocument.spreadsheetml.sheet", "title": "1999_West_Sorghum_Soil-water.xlsx" }, { "@type": "dcat:Distribution", "downloadURL": "https://ndownloader.figshare.com/files/44531423", "format": "xlsx", "mediaType": "application/vnd.openxmlformats-officedocument.spreadsheetml.sheet", "title": "2005_East_Sorghum_Soil-water.xlsx" }, { "@type": "dcat:Distribution", "downloadURL": "https://ndownloader.figshare.com/files/44531426", "format": "xlsx", "mediaType": "application/vnd.openxmlformats-officedocument.spreadsheetml.sheet", "title": "2006_West_Sorghum_Soil-water.xlsx" }, { "@type": "dcat:Distribution", "downloadURL": "https://ndownloader.figshare.com/files/44531429", "format": "xlsx", "mediaType": "application/vnd.openxmlformats-officedocument.spreadsheetml.sheet", "title": "2007_East_maize-sorghum-forage_Soil-water.xlsx" }, { "@type": "dcat:Distribution", "downloadURL": "https://ndownloader.figshare.com/files/44531432", "format": "xlsx", "mediaType": "application/vnd.openxmlformats-officedocument.spreadsheetml.sheet", "title": "2007_West_Sorghum_Soil-water.xlsx" }, { "@type": "dcat:Distribution", "downloadURL": "https://ndownloader.figshare.com/files/44531435", "format": "xlsx", "mediaType": "application/vnd.openxmlformats-officedocument.spreadsheetml.sheet", "title": "2014_East_Sorghum_Soil-water.xlsx" }, { "@type": "dcat:Distribution", "downloadURL": "https://ndownloader.figshare.com/files/44531438", "format": "xlsx", "mediaType": "application/vnd.openxmlformats-officedocument.spreadsheetml.sheet", "title": "2014_West_Sorghum_Soil-water.xlsx" }, { "@type": "dcat:Distribution", "downloadURL": "https://ndownloader.figshare.com/files/44531441", "format": "xlsx", "mediaType": "application/vnd.openxmlformats-officedocument.spreadsheetml.sheet", "title": "2015_East_Sorghum_Soil-water.xlsx" }, { "@type": "dcat:Distribution", "downloadURL": "https://ndownloader.figshare.com/files/44531444", "format": "xlsx", "mediaType": "application/vnd.openxmlformats-officedocument.spreadsheetml.sheet", "title": "2015_West_Sorghum_Soil-water.xlsx" }, { "@type": "dcat:Distribution", "downloadURL": "https://ndownloader.figshare.com/files/44531450", "format": "xlsx", "mediaType": "application/vnd.openxmlformats-officedocument.spreadsheetml.sheet", "title": "1996_East_Alfalfa_Soil-water (1).xlsx" }, { "@type": "dcat:Distribution", "downloadURL": "https://ndownloader.figshare.com/files/44531453", "format": "xlsx", "mediaType": "application/vnd.openxmlformats-officedocument.spreadsheetml.sheet", "title": "1997_East_Alfalfa_Soil-water_0.xlsx" }, { "@type": "dcat:Distribution", "downloadURL": "https://ndownloader.figshare.com/files/44531456", "format": "xlsx", "mediaType": "application/vnd.openxmlformats-officedocument.spreadsheetml.sheet", "title": "1998_East_Alfalfa_Soil-water_0.xlsx" }, { "@type": "dcat:Distribution", "downloadURL": "https://ndownloader.figshare.com/files/44531459", "format": "xlsx", "mediaType": "application/vnd.openxmlformats-officedocument.spreadsheetml.sheet", "title": "1999_East_Alfalfa_Soil-water_0.xlsx" }, { "@type": "dcat:Distribution", "downloadURL": "https://ndownloader.figshare.com/files/44531462", "format": "xlsx", "mediaType": "application/vnd.openxmlformats-officedocument.spreadsheetml.sheet", "title": "1995_East_Alfalfa_Soil-water_0.xlsx" }, { "@type": "dcat:Distribution", "downloadURL": "https://ndownloader.figshare.com/files/44531465", "format": "txt", "mediaType": "text/plain", "title": "README_Evett.txt" } ], "license": "https://creativecommons.org/publicdomain/zero/1.0/", "bureauCode": [ "005:18" ], "modified": "2024-02-15", "publisher": { "@type": "org:Organization", "name": "Agricultural Research Service" }, "accrualPeriodicity": "irregular", "keyword": [ "NP211", "Evapotranspiration", "Agroecosystems & Environment Soil", "Agroecosystems & Environment Water", "data.gov", "ARS" ], "spatial": "{\"type\": \"Polygon\", \"coordinates\": [[[-102.09906463948, 35.191719970106], [-102.07671433134, 35.19121493622], [-102.07678299485, 35.1865853205], [-102.07609634934, 35.177044674547], [-102.09913330298, 35.177072738625], [-102.09906463948, 35.191719970106]]]}" }, { "identifier": "10.15482/USDA.ADC/1526466", "accessLevel": "public", "contactPoint": { "hasEmail": "mailto:steve.evett@usda.gov", "fn": "Evett, Steven R." }, "programCode": [ "005:040" ], "description": "[NOTE - 2022-09-07: this dataset is superseded by an updated version https://doi.org/10.15482/USDA.ADC/1526332 ]
\nThis dataset contains soil water content data developed from neutron probe readings taken in access tubes in two of the four large, precision weighing lysimeters and in the fields surrounding each lysimeter that were planted to winter wheat at the USDA-ARS Conservation and Production Laboratory (CPRL), Soil and Water Management Research Unit (SWMRU), Bushland, Texas (Lat. 35.186714°, Long. -102.094189°, elevation 1170 m above MSL) beginning in 1989. Data in each spreadsheet are for one winter wheat growing season, either 1989-1990, 1991-1992, or 1992-1993. Other readings taken in those years for other crops are reported elsewhere. Data for the 1989-1990 season and the 1992-1993 season are from the northwest (NW) and southwest (SW) weighing lysimeters and surrounding fields. Data for the 1991-1992 season are from the northeast (NE) and southeast (SE) weighing lysimeters and surrounding fields. Readings were taken periodically with a field-calibrated neutron probe at depths from 10 cm to 230 cm (maximum of 190 cm depth in the lysimeters) in 20-cm depth increments. Periods between readings were typically one to two weeks, sometimes longer according to experimental design and need for data. Field calibrations in the Pullman soil series were done every few years. Calibrations typically produced a regression equation with RMSE <= 0.01 m3 m-3 (e.g., Evett and Steiner, 1995). Data were used to guide irrigation scheduling to achieve full or deficit irrigation as required by the experimental design. Data may be used to calculate the soil profile water content in mm of water from the surface to the maximum depth of reading. Profile water content differences between reading times in the same access tube are considered the change in soil water storage during the period in question and may be used to compute evapotranspiration (ET) using the soil water balance equation: ET = (change in storage + P + I + F + R, where P is precipitation during the period, I is irrigation during the period, F is soil water flux (drainage) out of the bottom of the soil profile during the period, and R is the sum of runon and runoff during the period. Typically, R is taken as zero because the fields were furrow diked to prevent runon and runoff during most of each growing season.
Resource Title: 1989-90 Bushland, TX, west winter wheat volumetric soil water content data.
File Name: 1989-90_West_Winter-Wheat_Soil-water.xlsx
Resource Description: Contains periodic volumetric soil water content data from neutron probe readings in 20-cm depth increments from 10-cm depth to 230-cm depth in access tubes in fields around the Bushland, TX, northwest (NW) and southwest (SW) large, precision weighing lysimeters, and to 190-cm depth in each lysimeter. The excel file contains a data dictionary for each tab containing data. There is also a tab named Introduction that lists the authors, equipment used, relevant citations, and explains the other tabs, which contain either data dictionaries, data, geographical coordinates of access tube locations, or data visualization tools. Tab names are unique so that tabs may be saved as individual CSV files.
Resource Title: 1991-92 Bushland, TX, east winter wheat volumetric soil water content data.
File Name: 1991-92_East_Winter-Wheat_Soil-water.xlsx
Resource Description: Contains periodic volumetric soil water content data from neutron probe readings in 20-cm depth increments from 10-cm depth to 230-cm depth in access tubes in fields around the Bushland, TX, large, northeast (NE) and southeast (SE) precision weighing lysimeters, and to 190-cm depth in each lysimeter. The excel file contains a data dictionary for each tab containing data. There is also a tab named Introduction that lists the authors, equipment used, relevant citations, and explains the other tabs, which contain either data dictionaries, data, geographical coordinates of access tube locations, or data visualization tools. Tab names are unique so that tabs may be saved as individual CSV files.
Resource Title: 1992-93 Bushland, TX, west winter wheat volumetric soil water content data.
File Name: 1992-93_West_Winter-Wheat_Soil-water.xlsx
Resource Description: Contains periodic volumetric soil water content data from neutron probe readings in 20-cm depth increments from 10-cm depth to 230-cm depth in access tubes in fields around the Bushland, TX, northwest (NW) and southwest (SW) large, precision weighing lysimeters, and to 190-cm depth in each lysimeter. The excel file contains a data dictionary for each tab containing data. There is also a tab named Introduction that lists the authors, equipment used, relevant citations, and explains the other tabs, which contain either data dictionaries, data, geographical coordinates of access tube locations, or data visualization tools. Tab names are unique so that tabs may be saved as individual CSV files.
The Soil and Water Hub is jointly developed by USDA Agricultural Research Service (USDA-ARS) and Texas A&M AgriLife Research, part of The Texas A&M University System. Modeling dataset resources are available for download for use with software tools Agricultural Policy/Environmental eXtender Model (APEX), Soil and Water Assessment Tool (SWAT), ArcSWAT, and related Conservation practices.
Resource Title: Website Pointer to Soil and Water Hub Modeling Datasets.
File Name: Web Page, url: https://soilandwaterhub.brc.tamus.edu/Home/Download
Modeling datasets for APEX, SWAT, ArcSWAT, and Conservation
This data package contains soil disturbance data from plots with various levels of herbivore exclusion on the Jornada Experimental Range. Study sites were established in 1995; one in black grama grassland and the other in creosotebush shrubland to compare the impact of herbivores on ecosystem processes between these vegetation types. Parallel studies were established at the Sevilleta LTER site (New Mexico, USA) and Mapimi Biosphere Reserve (Durango, Mexico). Each study site is 1 km by 0.5 km in area. Four replicate experimental blocks were randomly located at the grassland study site to measure vegetation responses using exclusion treatments including a) all mammalian herbivores, including cattle, lagomorphs, and rodents, b) lagomorphs and cattle only, c) cattle only, and d) control accessible to all herbivores. Because grazing cattle are excluded from the entire creosote site, only three replicate experimental blocks were randomly located there including a) all mammalian herbivores, including lagomorphs, and rodents, b) lagomorphs only, and c) control accessible to all herbivores. Thirty-six sampling points were positioned at 5.8-meter intervals on a systematically located 6 by 6 point grid within each plot. A permanent one-meter by one-meter vegetation measurement quadrat is located at each of the 36 points. Each year in spring and fall from 1995-2005, various forms of disturbances (human, rabbit, cow, antelope, rodent, etc) were measured by depth . After 2005, sampling frequency changed to every 5 years. This study is ongoing.
Resource Title: Website Pointer to html file.
File Name: Web Page, url: https://portal.edirepository.org/nis/mapbrowse?scope=knb-lter-jrn&identifier=210086007
Webpage with information and links to data files for download
This study examined average annual changes in soil erosion from rainfall and wind forces, and trends in soil organic carbon (SOC).
\nThe diversity of geo-climatic land bases and potential feedstocks within the United States Central Great Plains (CGP) requires sustainable production that provides optimal resource utilization while maintaining or enhancing localized soil and environmental quality as much as possible. This study examined average annual changes in soil erosion from rainfall and wind forces and trends in soil organic carbon (SOC) as a function of commodity and/or bioenergy-based crop rotations, yield variations, and different field management practices, including residue removal across all land capability class (LCC) I-VIII soils in select areas of the CGP. Soil erosion and SOC (proxied by a soil conditioning index, or SCI) were analyzed on individual soil map unit components using the Revised Universal Soil Loss Equation, Version 2 (RUSLE2) and Wind Erosion Prediction System (WEPS) models.
\nResource Title: Data Field Definitions READ ME.
File Name: definitions.csv
Resource Title: Fig. 1. USDA-NRCS Crop Management Zones (CMZs) used in this study.
File Name: Figure 1 CMZ Map expl.jpg
Resource Description:
The six CMZ's used in this study are indicated on a map of the lower 48 United States with USDA-NRCS Crop Management Zones indicated by number. Note that CMZs 15 and 15.1 were combined into one crop management zone (15), as their crops and rotations were similar.
\nResource Title: Crop Management Zone 5 2011 Yields.
File Name: cmz-5-2011-yields.csv
Resource Description:
Data for simulation by yield for CMZ 5 2011, using the RUSLE2 and WEPS simulation models to explore changes in soil erosion (water and wind) and SOC for select commodity and bioenergy-based rotations pertinent to the CGP, which are subject to both reduced tillage and no-till practices under residue removal and no residue removal.
\nResource Title: Crop Management Zone 5 2030 Yields.
File Name: cmz-5-2030-yields.csv
Resource Description:
Data for simulation by yield for CMZ 5 2030, using the RUSLE2 and WEPS simulation models to explore changes in soil erosion (water and wind) and SOC for select commodity and bioenergy-based rotations pertinent to the CGP, which are subject to both reduced tillage and no-till practices under residue removal and no residue removal.
\nResource Title: Crop Management Zone 15 2011 Yields.
File Name: cmz-15-2011-yields.csv
Resource Description:
Data for simulation by yield for CMZ 15 2011, using the RUSLE2 and WEPS simulation models to explore changes in soil erosion (water and wind) and SOC for select commodity and bioenergy-based rotations pertinent to the CGP, which are subject to both reduced tillage and no-till practices under residue removal and no residue removal.
\nResource Title: Crop Management Zone 15 2030 Yields.
File Name: cmz-15-2030-yields.csv
Resource Description:
Data for simulation by yield for CMZ 15 2030, using the RUSLE2 and WEPS simulation models to explore changes in soil erosion (water and wind) and SOC for select commodity and bioenergy-based rotations pertinent to the CGP, which are subject to both reduced tillage and no-till practices under residue removal and no residue removal.
\nResource Title: Crop Management Zone 19 2030 Yields.
File Name: CMZ 19 2030 Yields.csv
Resource Description:
Data for simulation by yield for CMZ 19 2030, using the RUSLE2 and WEPS simulation models to explore changes in soil erosion (water and wind) and SOC for select commodity and bioenergy-based rotations pertinent to the CGP, which are subject to both reduced tillage and no-till practices under residue removal and no residue removal.
\nResource Title: Crop Management Zone 19 2011 Yields.
File Name: CMZ 19 2011 Yields.csv
Resource Description:
Data for simulation by yield for CMZ 19 2011, using the RUSLE2 and WEPS simulation models to explore changes in soil erosion (water and wind) and SOC for select commodity and bioenergy-based rotations pertinent to the CGP, which are subject to both reduced tillage and no-till practices under residue removal and no residue removal.
\nResource Title: Crop Management Zone 24 2011 Yields.
File Name: cmz-24-2011-yields.csv
Resource Description:
Data for simulation by yield for CMZ 24 2011, using the RUSLE2 and WEPS simulation models to explore changes in soil erosion (water and wind) and SOC for select commodity and bioenergy-based rotations pertinent to the CGP, which are subject to both reduced tillage and no-till practices under residue removal and no residue removal.
\nResource Title: Crop Management Zone 24 2030 Yields.
File Name: cmz-24-2030-yields.csv
Resource Description:
Data for simulation by yield for CMZ 24 2030, using the RUSLE2 and WEPS simulation models to explore changes in soil erosion (water and wind) and SOC for select commodity and bioenergy-based rotations pertinent to the CGP, which are subject to both reduced tillage and no-till practices under residue removal and no residue removal.
\nResource Title: Crop Management Zone 40 2011 Yields.
File Name: cmz-40-2011-yields_0.csv
Resource Description:
Data for simulation by yield for CMZ 40 2011, using the RUSLE2 and WEPS simulation models to explore changes in soil erosion (water and wind) and SOC for select commodity and bioenergy-based rotations pertinent to the CGP, which are subject to both reduced tillage and no-till practices under residue removal and no residue removal.
\nResource Title: Crop Management Zone 40 2030 Yields.
File Name: cmz-40-2030-yields.csv
Resource Description:
Data for simulation by yield for CMZ 40 2030, using the RUSLE2 and WEPS simulation models to explore changes in soil erosion (water and wind) and SOC for select commodity and bioenergy-based rotations pertinent to the CGP, which are subject to both reduced tillage and no-till practices under residue removal and no residue removal.
\nResource Title: Crop Management Zone 48 2011 Yields.
File Name: cmz-48-2011-yields.csv
Resource Description:
Data for simulation by yield for CMZ 48 2011, using the RUSLE2 and WEPS simulation models to explore changes in soil erosion (water and wind) and SOC for select commodity and bioenergy-based rotations pertinent to the CGP, which are subject to both reduced tillage and no-till practices under residue removal and no residue removal.
\nResource Title: Crop Management Zone 48 2030 Yields.
File Name: cmz-48-2030-yields.csv
Resource Description:
Data for simulation by yield for CMZ 48 2030, using the RUSLE2 and WEPS simulation models to explore changes in soil erosion (water and wind) and SOC for select commodity and bioenergy-based rotations pertinent to the CGP, which are subject to both reduced tillage and no-till practices under residue removal and no residue removal.
\nThis package contains data from a study that measured long-term soil movement in areas undergoing mesquite invasion on the Jornada Experimental Range from 1933-2011. Data consist of height measurements of soil on two long-term transects established in the Natural Revegetation Exclosure (NatReveg) in 1933 and an exclosure in Pasture 8b in 1935. In 1933, about half of the NatReveg exclosure was covered with mesquite dunes. Grasses dominated the non-dune portion, but mesquite plants were present. Approximately one-third of the NatReveg site exclosure was sprayed with 2,4,5-T herbicide for mesquite control in 1966-68. Additional herbicide treatments were conducted upon the sprayed portion in 1969-72. The 1731-m NatReveg exclosure transect runs north-south through the center of the exclosure and extends 61 m (200ft) beyond the boundary fence on either end. The 457-m Pasture 8b transect is oriented WSW-ENE and was established in an area where mesquite dunes were large and well established. The predominant soils in this exclosure are deep loamy sands. Soil movement was measured by the distance between the soil surface and a notch in 50 cm T-posts located every 15.2 m (50 ft). Transects were measured in 1950 (8b only), 1955 (8b only), every five years from 1980-2000, and most recently in 2011. Most steel posts were re-measured at these intervals, but some were lost due to excavation or burial. These were replaced with a new baseline notch height initiated on the posts. Data correspond to each year of collection, as well as measures (in cm) of soil deposition or deflation during the intervals. This study is complete.For further information, see:Gibbens, R.P., J.M. Tromble, J.T. Hennessy, and M. Cardenas, 1983. \"Soil movement in mesquite dunelands and former grasslands of southern New Mexico from 1933 to 1980.\" Journal of Range Management 36:145-148.
Resource Title: Website Pointer to html file.
File Name: Web Page, url: https://portal.edirepository.org/nis/mapbrowse?scope=knb-lter-jrn&identifier=210365001
Webpage with information and links to data files for download
In the early 1970’s, it was determined that the most feasible way to reclaim lands disturbed by coal surface mining in the Northern Great Plains region was through the respreading of salvaged soil. In 1974, scientists at the Northern Great Plains Research Laboratory of the Agricultural Research Service -- U. S. Department of Agriculture (USDA-ARS) initiated two experiments designed to determine the thicknesses of respread soil necessary to restore productivity to difficult-to-reclaim sodic minespoils in central North Dakota (ND). In both experiments, motorscraper and other earthmoving equipment was used to construct wedge-shaped masses of subsoil materials over leveled minespoils and then to cover these with uniform thicknesses of topsoil material. Topsoil consisted of predominately A horizon material from Haplustoll soils, and subsoil consisted of B and C horizon material.
\nIn one experiment near the town of Stanton ND, a subsoil wedge was constructed on leveled minespoil and consisted of 12 long contiguous blocks of material (which were the main plots), three replications of four topsoil thickness treatments. For each replication, three of the main treatment blocks consisted of subsoil material, and one was a 3:1 subsoil – topsoil mix. The topsoil treatments consisted of no topsoil, 20 cm, 60 cm, and no topsoil on the mixed soil block. Each main treatment block was split into four long strips and seeded to crops of alfalfa, crested wheatgrass, spring wheat, and warm-season grass mix. The wedge was 240 m long, 65 m wide, and 2.1 m high at the summit.
\nIn another experiment near the town of Zap ND, a double subsoil wedge was constructed on leveled minespoil and consisted of six long contiguous blocks of material (which were the main plots), two replications on each side of the wedge, for a total of four replications with three subsoil quality treatments. The subsoils varied in soil texture, salinity and sodicity. The wedge was covered with a uniform 20 cm thickness of topsoil. Each main treatment block was split into four long strips and seeded to the same crops as the Stanton site with the exception of warm-season grass mix, which was replaced with Russian wildrye. The double wedge was 124 m long, and about 50 m from each toe to summit for a total width of 102 m and was 2.1 m high at the summit.
\nResources in this dataset:
\nResource Title: Experimental Details\nFile Name: Experimental Details.docx\nResource Description: Background information for Stanton and Zap experimental sites, including figures of constructed wedges.
\nResource Title: Wedge Data Dictionary\nFile Name: Wedge Data Dictionary.xlsx\nResource Description: Data dictionary for soil data collected from minespoil experiments near Stanton and Zap, North Dakota, 1976-1981.
\nResource Title: Stanton site ionic soil solution data\nFile Name: Stanton site ionic soil solution data.csv\nResource Description: Data for soil pH, electrical conductivity, exchangeable Ca, Mg, and Na, sodium adsorption ratio, and saturation percentage.
\nResource Title: Stanton site soil C, N and P data\nFile Name: Stanton site soil C, N and P data.csv\nResource Description: Data for soil organic C, total N, ammonium-N, nitrate-N, and extractable P.
\nResource Title: Stanton site soil physical data\nFile Name: Stanton site soil physical data.csv\nResource Description: Data for soil water content at 0.33 and 15 bar.
\nResource Title: Zap site ionic soil solution data\nFile Name: Zap site ionic soil solution data.csv\nResource Description: Data for soil pH, electrical conductivity, exchangeable Ca, Mg, and Na, sodium adsorption ratio, and saturation percentage.
\nResource Title: Zap site soil C, N and P data\nFile Name: Zap site C, N and P data.csv\nResource Description: Data for soil organic C, total N, ammonium-N, nitrate-N, and extractable P.
\nResource Title: Zap site soil physical data\nFile Name: Zap site soil physical data.csv\nResource Description: Data for soil water content at 0.33 and 15 bar, sand, silt, and clay content, and textural class.
\nResource Title: Aggregated ionic soil solution data\nFile Name: Wedge curation aggregated ionic soil solution data.xlsx\nResource Description: Data shared in separate tabs organized by year, location, and metric.
\nResource Title: Aggregated soil C, N and P data\nFile Name: Wedge curation aggregated C, N and P data.xlsx\nResource Description: Data shared in separate tabs organized by year, location, and metric.
\nResource Title: Aggregated soil physical data\nFile Name: Wedge curation aggregated soil physical data.xlsx\nResource Description: Data shared in separate tabs organized by year, location, and metric.
\nThe Sol Genomics Network (SGN) is a clade-oriented database dedicated to the biology of the Solanaceae family which includes a large number of closely related and many agronomically important species such as tomato, potato, tobacco, eggplant, pepper, and the ornamental Petunia hybrida. SGN is part of the International Solanaceae Initiative (SOL), which has the long-term goal of creating a network of resources and information to address key questions in plant adaptation and diversification. A key problem of the post-genomic era is the linking of the phenome to the genome, and SGN allows to track and help discover new such linkages.
\nData:
\nThe data in SGN have been submitted by many different research groups around the world. A web form is available to submit data for display on SGN.
\nSGN community-driven gene and phenotype database:
\nSimple web interfaces have been developed for the SGN user-community to submit, annotate, and curate the Solanaceae locus and phenotype databases. The goal is to share biological information, and have the experts in their field review existing data and submit information about their favorite genes and phenotypes.
Resource Title: Website Pointer to Sol Genomics Network.
File Name: Web Page, url: https://solgenomics.net/
Specialized Search interfaces are provided for: Organisms/Taxon; Genes and Loci; Genomic sequences and annotations; QTLs, Mutants & Accessions, Traits; Transcripts: Unigenes, ESTs, & Libraries; Unigene families; Markers; Genomic clones; Images; Expression: Templates, Experiments, Platforms; Traits.
SolarCalQ • Version 1.0 - Java model to simulate spectral quality at any location on the globe.
\nThe purpose of this JAVA model is to simulate the spectral quality of incident solar radiation for any location on the globe, down to one minute time steps. This JAVA model is an adaptation of existing NREL (National Renewable Energy Laboratory) solar spectral quality (Bird and Riordan 1984, 1986) and solar position models (Reda and Andreas, 2003), with significant modifications that are outlined below. The solar position model of Reda and Andreas (2003) has been shown to be accurate within the time period from the year -2000 to 6000, with uncertainties of +/- 0.0003 degrees in the solar zenith and azimuth angles based on the date, time, and location on the Earth. Additional modifications that were added into the SolarCalQ model are:
\nThe atmospheric optical depth has been linked to 3 components: Clear sky + clouds + aerosols
\nSpectral intensity is predicted either in integrated units (W m-2) or raw intensity units (W m-2um-1). The wavelength spacing is irregular, covering 122 wavelengths from 305 nm to 4000 nm.
\nUser Input:
\nUser input is handled through tabbed entry windows. An example of one of these windows is shown below. There are help screens included in the program to guide the user through the necessary input parameters.
\nThe time step is set under the •Program Options• tab. (Number of minutes per time step)
\nSolarCalQ \"Program Options\" Tab
\nIn the advanced tab (enabled under PREFERENCES) the geometry of the receiving surface (or incident surface) is described. Default is a solar tracking surface (e.g. plant leaf or flower), but any geometric arrangement can be handled by the model.
\n\"Advanced tab\" (enabled under PREFERENCES)
\nAfter settings have been edited select Update Options button and then Run Model from the File menu.
\nThe output file generated (if selected under FILE) is the instantaneous output at the interval set in the program options tab.
\nOutput file generated (if selected under FILE)
\nThis model was developed in JAVA, is simple to use, and runs on multiple platforms (e.g. Mac, PC, Sun).
Resource Title: SolarCalQ - Version 1.0.
File Name: Web Page, url: https://www.ars.usda.gov/research/software/download/?softwareid=157&modecode=50-60-05-00
download page
Solar Calc: Estimating Hourly Incoming Solar Radiation from Limited Meteorological Data
\nTwo major properties which determine weed seed germination are soil temperature and moisture content. Incident radiation is the primary variable controlling energy input to the soil system and thereby influences both moisture and temperature profiles. However, a majority of agricultural field sites lack proper instrumentation to measure solar radiation directly. To overcome this shortcoming, an empirical model was developed to estimate total incident solar radiation (beam and diffuse) with hourly time steps.
\nInput parameters for the model are latitude, longitude, and elevation of the field site, along with daily precipitation (mm) with daily minimum and maximum air temperatures (degrees C). The file format for this weather data file is a comma spaced value file (CSV) with the following format:
\nDOY, MIN, MAX, PREC
\nWhere DOY is day of year, MIN is the minimum air temperature, MAX is the maximum air temperature, and PREC is the total daily rainfall. Each day has a separate line in the file. Field validation of this model was conducted at a total of 18 sites, where sufficient meteorological data were available for validation, allowing a total of 42 individual yearly comparisons.
\nThe model performed well, with an average Pearson correlation of 0.92, d-index of 0.95, modeling efficiency of 0.80, root mean square error of 111 W m-2, and a mean absolute error of 56 W m-2. These results compare favorably to other developed empirical solar radiation models, but with the advantage of predicting hourly solar radiation for the entire year based on limited climatic data and no site-specific calibration requirement. This solar radiation prediction tool can be integrated into dormancy, germination and growth models to improve microclimate-based simulation of development of weeds and other plants.
\nDisclaimer: The USDA-ARS makes no warranties as to the merchantability or fitness of SolarCalc 1.0 for any particular purpose, or any other warranties expressed or implied. Since some portions of SolarCalc 1.0 have been validated with only limited data sets, it should not be used to make operational management decisions. The USDA-ARS is not liable for any damages resulting from the use or misuse of SolarCalc 1.0, its output and its accompanying documentation.
\nSolarCalc 1.0 was written in Java, and therefore can run on multiple platforms (e.g. Windows, Mac, Unix).
Resource Title: SolarCalc 1.0.
File Name: Web Page, url: https://www.ars.usda.gov/research/software/download/?softwareid=62&modecode=50-60-05-00
download page
Spreadsheet from the paper entitled: On the Use of Linearized Langmuir Equations by C.H. Bolster and G.M. Hornberger, Soil Science Society of America Journal, 2007, 71(6): 1796-1806.
\nSpreadsheet has been modified to correct the following errors:
\n(11/01/12)
\nIn earlier versions the initial guess for the n parameter in the Freundlich model did not update when data were added to spreadsheet. This has now been corrected in the new vesrion (1.6)
\n(3/17/10)
\na and therefore is not applicable to current spreadsheet)
\nThis research was originally part of the former USDA-ARS National Program 206: Manure and By-product Utilization.
Resource Title: Sorption Isotherm Spreadsheet.
File Name: Web Page, url: https://www.ars.usda.gov/research/software/download/?softwareid=201&modecode=50-40-05-00
download page
The Co-operative Agency Reservoir dataset is one of various hydrological datasets provided for the Southern Great Plains 1997 (SGP97) Project. This dataset contains reservoir data from 26 Co-operative Agency stations within the Enhanced Observing Period (EOP) domain and time period. No additional quality control was performed by the University Corporation for Atmospheric Research/Joint Office for Science Support (UCAR/JOSS). The Co-operative Agency reservoir dataset is provided \"as is\" in the original format. The Co-operative Agency data is in a non-consistent, ASCII format.
Resource Title: GeoData catalog record.
File Name: Web Page, url: https://geodata.nal.usda.gov/geonetwork/srv/eng/catalog.search#/metadata/9a0ba33e-9475-4d72-962e-edbb77400e90
The United States Geological Survey (USGS) Reservoir dataset is one of various hydrological datasets provided for the Southern Great Plains 1997 (SGP97) project. This dataset contains reservoir data from stations in SGP97 domain. The data collected at USGS gaging stations consist of records of stage and measurements of discharge of streams or canals, and stage, surface area, and contents of lakes or reservoirs. This dataset contains only the USGS reservoir data. For a lake or reservoir, capacity tables giving the contents for any stage are prepared from stage-area relation curves defined by surveys. The application of the stage to the capacity table gives the contents, from which the daily, monthly, or yearly change in contents is computed. If the stage-capacity curve is subject to changes because of deposition of sediment in the reservoir, periodic resurveys of the reservoir are necessary to define new stage-capacity curves. During the period between reservoir surveys, the computed contents may be increasingly in error due to the gradual accumulation of sediments. For some gaging stations there are periods when no gage-height record is obtained or the recorded gage height is so faulty that it cannot be used to compute daily discharge or contents. This happens when the recorder stops or otherwise fails to operate properly, intakes are plugged, the float is frozen in the well, or for various other reasons. For such periods, the daily contents may be estimated on the basis of operator's log, prior and subsequent records, inflow-outflow studies, and other information. The USGS reservoir data are provided in a single file and are provided \"as is\" in their original card image format. There are six different types of \"cards images\" which appear in the USGS reservoir dataset. Each card has a unique format, but the first character of a card image always indicates the card type. Depending upon the card type, the card image may contain metadata and/or data. No additional quality control was performed by the University Corporation for Atmospheric Research/Joint Office for Science Support (UCAR/JOSS).
Resource Title: GeoData catalog record.
File Name: Web Page, url: https://geodata.nal.usda.gov/geonetwork/srv/eng/catalog.search#/metadata/04dfde8e-77ca-47c4-bd48-5fe7a1c3f12b
The United States Geological Survey (USGS) stream flow dataset is one of various datasets provided for the Southern Great Plains 1997 (SGP97) project. This dataset contains stream flow data from 997 USGS stations in the SGP97 domain. The data collected at USGS gaging stations consist of records of stage and measurements of discharge of streams or canals, and stage, surface area, and contents of lakes or reservoirs. This dataset contains only the USGS stream flow data. For USGS stream-gaging stations, the daily mean discharge is computed from gage heights and rating tables. These rating tables are prepared from stage-discharge-relation curves and give the discharge for any stage. If the stage-discharge relation for a station is temporarily changed by the presence of aquatic growth or debris on the control, the daily mean discharge is computed by what is basically the shifting-control method. At some USGS gaging stations, acoustic velocity meter (AVM) systems are used to compute discharge. The AVM system measures the stream's velocity at one or more paths in the cross section. Coefficients are developed to relate this path velocity to the mean velocity in the cross section. Cross-sectional area curves are developed to relate stage to cross section area. Discharge is computed by multiplying path velocity by the appropriate stage related coefficient and area. Changing stage, backwater from reservoirs, tributary streams, or other sources, and ice in the winter affect the stage-discharge relation. Special methods, such as using comparable records of discharge for other stations, are then used to compute discharge. If no gage-height record can be obtained from a gaging station due to failed equipment, etc., daily discharge values are estimated using various means. The USGS stream flow dataset contains three metadata parameters and three data parameters. The metadata parameters identify the network, station, and time at which the data was collected. Each record contains one month's data. The three data parameters (stream flow, stage, and hour of observation) are repeated once for each UTC day (0000 to 2300). All records contain data for 31 days regardless of the actual number of days in a month. Months with less than 31 days are padded with missing values (e.g., -999.99). The stream flow values are reported in cubic meters per second and are 24 hour averages. There are no stage values in this dataset, so the stage values are shown as missing. The hour of observation is the beginning UTC hour for the 24 hour period for which the stream flow value is valid. No additional quality control was performed by the University Corporation for Atmospheric Research/Joint Office for Science Support (JOSS).
Resource Title: GeoData catalog record.
File Name: Web Page, url: https://geodata.nal.usda.gov/geonetwork/srv/eng/catalog.search#/metadata/98fa787b-ccd2-458d-9ff5-f0926f1da1c2
The Eta Model Location Time Series is one of the model output datasets provided in the Southern Great Plains - 1997 (SGP97). The full Eta MOLTS dataset covers most of North America east of the Rocky Mountains (up to 574 locations). MOLTS are hourly time series output at selected locations that contain values for various surface parameters and ‘sounding’ profiles at Eta model levels, and are derived from the Eta model output. The MOLTS output files were converted into Joint Office for Science Support (JOSS) Quality Control Format (QCF), the same format used for atmospheric rawinsonde soundings processed by JOSS. The MOLTS output provided by JOSS on-line includes only the initial analysis output (i.e. no forecast MOLTS) and only state parameters (pressure, temperature, humidity, and wind). The full output, including the forecast MOLTS and all output parameters, in its original format (Binary Universal Form for the Representation of meteorological data, or BUFR) is available from the National Center for Atmospheric Research (NCAR)/Scientific Computing Division. The National Centers for Environmental Prediction (NCEP) began operations for the Eta model in June 1993 with a resolution of 80 km and 38 levels; the top level was 50 mb. In late 1994, the domain of the Eta model was increased and the resolution became 48 km with 38 levels. The Eta analysis and forecast fields are generated every 12 hours at 0000 and 1200 UTC daily. MOLTS are hourly vertical profile and surface time series derived from the Eta model output. The complete MOLTS output includes a changable number of informational items, parameters for each level, and parameters at the surface. Output are available each hour beginning at the initial analysis (the only output available from JOSS) and ending at the 48 hour forecast. JOSS converts the raw format files into JOSS QCF format which is the same format used for atmospheric sounding data such as National Weather Service (NWS) soundings. JOSS calculated the total wind speed and direction from the u and v wind components. JOSS calculated the mixing ratio from the specific humidity (Pruppacher and Klett 1980) and the dew point from the mixing ratio (Wallace and Hobbs 1977). Then the relative humidity was calculated from the dew point (Bolton 1980). The altitude was not one of the available output parameters from the Eta MOLTS. JOSS did not conduct any quality control on this output. The header records (15 total records) contain output type, project ID, the location of the nearest station to the MOLTS location (this can be a rawinsonde station, an Atmospheric Radiation Measurement (ARM)/Cloud and Radiation Testbed (CART) station, a wind profiler station, a surface station, or just the nearest town), the location of the MOLTS output, and the valid time for the MOLTS output. The five header lines contain information identifying the sounding, and have a rigidly defined form. The following 6 header lines are used for auxiliary information and comments about the sounding, and they vary significantly from dataset to dataset. The last 3 header records contain header information for the data columns. Line 13 holds the field names, line 14 the field units, and line 15 contains dashes ('-' characters) delineating the extent of the field.
Resource Title: GeoData catalog record.
File Name: Web Page, url: https://geodata.nal.usda.gov/geonetwork/srv/eng/catalog.search#/metadata/2aaa6f76-9a41-4a08-8ce2-461b539a4fad
The GEM Model Location Time Series is one of the model output data sets provided in the Southern Great Plains - 1997 (SGP97). The full GEM MOLTS data set covers most of North America (up to 252 locations). MOLTS are hourly time series output at selected locations that contain values for various surface parameters and `sounding' profiles at GEM model levels and are derived from the GEM model output. The MOLTS output files were converted into Joint Office for Science Support (JOSS) Quality Control Format (QCF), the same format used for atmospheric rawinsonde soundings processed by JOSS. The MOLTS output provided by JOSS on-line includes only the initial analysis output (i.e. no forecast MOLTS) and only state parameters (pressure, altitude, temperature, humidity, and wind). The full output, including the forecast MOLTS and all output parameters, in its original format (Binary Universal Form for the Representation of meteorological data, or BUFR) is available from the National Center for Atmospheric Research (NCAR)/Scientific Computing Division. The Atmospheric Environment Service/Canadian Meteorological Centre (AES/CMC) operates the GEM model with a resolution of 35 km and 28 vertical levels. The GEM analysis and forecast fields are generated every 12 hours at 0000 and 1200 UTC daily. MOLTS are hourly vertical profile and surface time series derived from the GEM model output. The complete MOLTS output includes 13 informational items, 27 parameters for each level and 28 parameters at the surface. Output are available each hour beginning at the initial analysis (the only output available from JOSS) and ending at the 36 hour forecast. JOSS converts the raw format (BUFR) files into JOSS QCF format which is the same format used for atmospheric sounding data such as National Weather Service (NWS) soundings. JOSS calculated the total wind speed and direction from the u and v wind components. JOSS calculated the mixing ratio from the specific humidity (Pruppacher and Klett 1980) and the dew point from the mixing ratio (Wallace and Hobbs 1977). Then the relative humidity was calculated from the dew point (Bolton 1980). JOSS did not conduct any quality control on this output. The header records (15 total records) contain output type, project ID, the location of the nearest station to the MOLTS location (this can be a rawinsonde station, an Atmospheric Radiation Measurement (ARM)/Cloud and Radiation Testbed (CART) station, a wind profiler station, a surface station, or just the nearest town), the location of the MOLTS output, and the valid time for the MOLTS output. The five header lines contain information identifying the sounding, and have a rigidly defined form. The following 6 header lines are used for auxiliary information and comments about the sounding, and they vary significantly from dataset to dataset. The last 3 header records contain header information for the data columns. Line 13 holds the field names, line 14 the field units, and line 15 contains dashes ('-' characters) delineating the extent of the field.
Resource Title: GeoData catalog record.
File Name: Web Page, url: https://geodata.nal.usda.gov/geonetwork/srv/eng/catalog.search#/metadata/c820066c-f44a-464b-9187-bfeead49855d
The MAPS Model Location Time Series (MOLTS) is one of the model output datasets provided in the Southern Great Plains - 1997 (SGP97). The full MAPS MOLTS dataset covers most of North America east of the Rocky Mountains (283 locations). MOLTS are hourly time series output at selected locations that contain values for various surface parameters and ‘sounding' profiles at MAPS model levels and are derived from the MAPS model output. The MOLTS output files were converted into Joint Office for Science Support (JOSS) Quality Control Format (QCF), the same format used for atmospheric rawinsonde soundings processed by JOSS. The MOLTS output provided by JOSS online includes only the initial analysis output (i.e. no forecast MOLTS) and only state parameters (pressure, altitude, temperature, humidity, and wind). The full output, including the forecast MOLTS and all output parameters, in its original format (Binary Universal Form for the Representation of meteorological data, or BUFR) is available from the National Center for Atmospheric Research (NCAR)/Scientific Computing Division. The Forecast Systems Laboratory (FSL) operates the MAPS model with a resolution of 40 km and 40 vertical levels. The MAPS analysis and forecast fields are generated every 3 hours at 0000, 0300, 0600, 0900, 1200, 1500, 1800, and 2100 UTC daily. MOLTS are hourly vertical profile and surface time series derived from the MAPS model output. The complete MOLTS output includes six informational items, 16 parameters for each level and 27 parameters at the surface. Output are available each hour beginning at the initial analysis (the only output available from JOSS) and ending at the 48 hour forecast. JOSS converts the raw format files into JOSS QCF format which is the same format used for atmospheric sounding data such as National Weather Service (NWS) soundings. JOSS calculated the total wind speed and direction from the u and v wind components. JOSS calculated the mixing ratio from the specific humidity (Pruppacher and Klett 1980) and the dew point from the mixing ratio (Wallace and Hobbs 1977). Then the relative humidity was calculated from the dew point (Bolton 1980). JOSS did not conduct any quality control on this output. The header records (15 total records) contain output type, project ID, the location of the nearest station to the MOLTS location (this can be a rawinsonde station, an Atmospheric Radiation Measurement (ARM)/Cloud and Radiation Testbed (CART) station, a wind profiler station, a surface station, or just the nearest town), the location of the MOLTS output, and the valid time for the MOLTS output. The five header lines contain information identifying the sounding, and have a rigidly defined form. The following 6 header lines are used for auxiliary information and comments about the sounding, and they vary significantly from dataset to dataset. The last 3 header records contain header information for the data columns. Line 13 holds the field names, line 14 the field units, and line 15 contains dashes ('-' characters) delineating the extent of the field.
Resource Title: GeoData catalog record.
File Name: Web Page, url: https://geodata.nal.usda.gov/geonetwork/srv/eng/catalog.search#/metadata/2ad09880-6439-440c-9829-c4653ec12a4f
Temporal (5 minute or daily) data from the Little Washita and Ft. Cobb watersheds. Includes precipitation and net radiation (discontinued) along with soil temperature and volumetric water content at 3 depths, 5, 25, and 45 centimeters.
Resource Title: GeoData Catalog record.
File Name: Web Page, url: https://geodata.nal.usda.gov/geonetwork/srv/eng/catalog.search#/metadata/f7ce55b6-84bd-4410-b21a-fe43ce40a06c
SoyBase is a repository for genetics, genomics and related data resources for soybean. It contains current genetic, physical and genomic sequence maps integrated with qualitative and quantitative traits.
\nSoyBase database was established in the 1990s as the USDA Soybean Genetics Database. Originally, it contained only genetic information about soybeans such as genetic maps and information about the Mendelian genetics of soybean. In time SoyBase was expanded to include molecular data regarding soybean genes and sequences as they became available. In 2010, the soybean genome sequence was published and it and supporting gene sequences have been integrated into the SoyBase sequence browser. SoyBase genetic maps were used in the assembly of both the Williams 82 2010 assembly (Wm82.a1.v1) and the newest genome assembly (Wm82.a2.v1).
\nSoyBase also incorporates information about mutant and other soybean genetic stocks and serves as a contact point for ordering strains from those populations. As association analyses continue due to various re-sequencing efforts SoyBase will also incorporate those data into the soybean genome browser as they become available. Gene expression patterns are also available at SoyBase through the SoyBase expression pages and the Soybean Gene Atlas. Other expression/transcriptome/methylomic data sets also have been and continue to be incorporated into the SoyBase genome browser.
\nProject No:3625-21000-062-00D Accession No: 0425040
\nResource Title: SoyBase, the USDA-ARS soybean genetics and genomics database web site.
File Name: Web Page, url: https://soybase.org
SoyBase database was established in the 1990s as the USDA Soybean Genetics Database. Originally, it contained only genetic information about soybeans such as genetic maps and information about the Mendelian genetics of soybean. In time SoyBase was expanded to include molecular data regarding soybean genes and sequences as they became available. In 2010, the soybean genome sequence was published and it and supporting gene sequences have been integrated into the SoyBase sequence browser. SoyBase genetic maps were used in the assembly of both the Williams 82 2010 assembly (Wm82.a1.v1) and the newest genome assembly (Wm82.a2.v1).
\n\nSoybean Pods and Seeds \nSoyBase also incorporates information about mutant and other soybean genetic stocks and serves as a contact point for ordering strains from those populations. As association analyses continue due to various re-sequencing efforts SoyBase will also incorporate those data into the soybean genome browser as they become available. Gene expression patterns are also available at SoyBase through the SoyBase expression pages and the Soybean Gene Atlas. Other expression/transcriptome/methylomic data sets also have been and continue to be incorporated into the SoyBase genome browser.
\nThe soybean aphid (Aphis glycines) is an insect pest of cultivated soybeans (Glycine max). Several genes with resistance to A. glycines (i.e. Rag genes) have been identified in soybean. Virulent strains of soybean aphid are able to overcome the resistance and colonize soybeans having one or more Rag genes. It is important to classify virulent strains of soybean aphids in evaluating soybean lines in order to develop cultivars with durable resistance. The files presented here report the number of soybean aphids on soybean lines that differed in the Rag genes they contained. Two colonies of soybean aphid were tested.
\nTests were conducted separately against the two soybean aphid colonies, which were maintained on soybean plants at North Central Agricultural Research Laboratory (NCARL), USDA-ARS, Brookings, South Dakota, USA, largely according to procedures described in Hesler and Tilmon (2018). The first colony was established from a single aphid collected near Volga, South Dakota, USA in 2016 and designated as ‘Volga16’ (Conzemius et al. 2019). It was reared on soybean cultivar ‘LD12R12-15805Ra’ (Rag1+Rag2 pyramid; University of Illinois, Urbana-Champaign, IL, USA).
\nA second colony designated ‘Accrue’ was derived from a colony originally established from a single first instar isolated from aphids collected at Urbana, IL, USA, and initially reared in Urbana (‘Urbana clone’; Hill et al. 2004). This colony was established as an avirulent soybean aphid colony (Hill et al. 2004). A series of sequential colonies from the initial colony was established, in order, at The Ohio State University, Wooster, OH, USA; Iowa State University, Ames, IA, USA; South Dakota State University, Brookings, SD, USA; and finally, in 2018 at NCARL. Although established as an ostensibly avirulent colony derived from the ‘Urbana clone’ colony, it was unexpectedly virulent against a known resistant accession, LD05R-16137 (containing Rag1), in initial screening tests.
\nTwo separate no-choice tests were run for each soybean aphid colony. Each test consisted of seven soybean lines. Six had one or more Rag genes: 19APH18 (Rag1), 19APH25 (Rag2), 19INC (Rag3), 19APH29 (Rag4), 19APH30 (Rag6), 19APH09Rag12 (a Rag1+Rag2 pyramid); and ‘Titan,’ an aphid-susceptible soybean cultivar (Diers et al. 1999). Two-week-old, unifoliate-stage soybean plants growing in plastic pots (6 cm top diameter, 4 cm bottom diameter, 5.7 cm height) were each infested with 10 apterous adult soybean aphids and covered with a clear plastic, ventilated, cylindrical tube. After 20 days in an environmental chamber, the shoots of test plants were clipped at soil level, placed individually in sealable plastic bags, and stored in a freezer. Plants were removed over the next few days, and the aphids on them were counted.\nThe data are contained in separate files—one for each of two soybean aphid colonies.
\nResource Title: Number of Soybean Aphids Accrue Colony vs Rag Lines.
File Name: Number of Soybean Aphids Accrue Colony vs Rag Lines.xlsx
Resource Description: Number of Accrue colony soybean aphids per plant on various Rag soybean lines from no-choice laboratory tests.
Resource Title: Number of Soybean Aphids Volga16 Colony vs Rag Lines.
File Name: Number of Soybean Aphids Volga16 Colony vs Rag Lines.xlsx
Spatial Modeling for Resources Framework (SMRF) was developed at the USDA Agricultural Research Service (ARS) in Boise, ID, and was designed to increase the flexibility of taking measured weather data and distributing the point measurements across a watershed. SMRF was developed to be used as an operational or research framework, where ease of use, efficiency, and ability to run in near real time are high priorities.
\nHighlights
\nFeatures\nSMRF was developed as a modular framework to enable new modules to be easily intigrated and utilized.
\nResource Title: SMRF GitHub repository.
File Name: Web Page, url: https://github.com/USDA-ARS-NWRC/smrf
SMRF was designed to increase the flexibility of taking measured weather data, or atmospheric models, and distributing the data across a watershed.
[ NOTE – 2022/05/06: this dataset supersedes the earlier versions https://doi.org/10.15482/USDA.ADC/1482548 and https://doi.org/10.15482/USDA.ADC/1526329 ].
\nThis dataset contains 15-minute mean weather data from the USDA-ARS Conservation and Production Laboratory (CPRL), Soil and Water Management Research Unit (SWMRU) research weather station, Bushland, Texas (Lat. 35.186714°, Long. -102.094189°, elevation 1170 m above MSL) for all days in each year. The data are from sensors placed at 2-m height over a level, grass surface mowed to not exceed 12 cm height and irrigated and fertilized to maintain reference conditions as promulgated by Allen et al. (2005, 1998). Irrigation was by surface flood in 1989 through 1994, and by subsurface drip irrigation after 1994. Sensors were replicated and intercompared between replicates and with data from nearby weather stations, which were sometimes used for gap filling. Quality control and assurance methods are described by Evett et al. (2018). Data from a duplicate sensor were used to fill gaps in data from the primary sensor using appropriate regression relationships. Gap filling was also accomplished using sensors deployed at one of the four large weighing lysimeters immediately west of the weather station, or using sensors at other nearby stations when reliable regression relationships could be developed. The primary paper describes details of the sensors used and methods of testing, calibration, inter-comparison, and use. The weather data include air temperature (C) and relative humidity (%), wind speed (m/s), solar irradiance (W m-2), barometric pressure (kPa), and precipitation (rain and snow in mm). Because the large (3 m by 3 m surface area) weighing lysimeters are better rain gages than are tipping bucket gages, the 15-minute precipitation data are derived for each lysimeter from changes in lysimeter mass. The land slope is <0.3% and flat. The mean annual precipitation is ~470 mm, the 20-year pan evaporation record indicates ~2,600 mm Class A pan evaporation per year, and winds are typically from the South and Southwest. The climate is semi-arid with ~70% (350 mm) of the annual precipitation occurring from May to September, during which period the pan evaporation averages ~1520 mm.\nThese datasets originate from research aimed at determining crop water use (ET), crop coefficients for use in ET-based irrigation scheduling based on a reference ET, crop growth, yield, harvest index, and crop water productivity as affected by irrigation method, timing, amount (full or some degree of deficit), agronomic practices, cultivar, and weather. The data have utility for testing simulation models of crop ET, growth, and yield and have been used by the Agricultural Model Intercomparison and Improvement Project (AgMIP), by OPENET, and by many others for testing, and calibrating models of ET that use satellite and/or weather data.
\nSee the README for details of each data resource.
", "title": "Standard Quality Controlled Research Weather Data – USDA-ARS, Bushland, Texas", "distribution": [ { "@type": "dcat:Distribution", "downloadURL": "https://ndownloader.figshare.com/files/44194454", "format": "xlsx", "mediaType": "application/vnd.openxmlformats-officedocument.spreadsheetml.sheet", "title": "1989_15-min_weather_SWMRU_CPRL_1.xlsx" }, { "@type": "dcat:Distribution", "downloadURL": "https://ndownloader.figshare.com/files/44194457", "format": "xlsx", "mediaType": "application/vnd.openxmlformats-officedocument.spreadsheetml.sheet", "title": "1990_15-min_weather_SWMRU_CPRL_1.xlsx" }, { "@type": "dcat:Distribution", "downloadURL": "https://ndownloader.figshare.com/files/44194460", "format": "xlsx", "mediaType": "application/vnd.openxmlformats-officedocument.spreadsheetml.sheet", "title": "1996_15-min_weather_SWMRU_CPRL_1.xlsx" }, { "@type": "dcat:Distribution", "downloadURL": "https://ndownloader.figshare.com/files/44194463", "format": "xlsx", "mediaType": "application/vnd.openxmlformats-officedocument.spreadsheetml.sheet", "title": "1997_15-min_weather_SWMRU_CPRL_0.xlsx" }, { "@type": "dcat:Distribution", "downloadURL": "https://ndownloader.figshare.com/files/44194466", "format": "xlsx", "mediaType": "application/vnd.openxmlformats-officedocument.spreadsheetml.sheet", "title": "1998_15-min_weather_SWMRU_CPRL_0.xlsx" }, { "@type": "dcat:Distribution", "downloadURL": "https://ndownloader.figshare.com/files/44194469", "format": "xlsx", "mediaType": "application/vnd.openxmlformats-officedocument.spreadsheetml.sheet", "title": "1999_15-min_weather_SWMRU_CPRL_0.xlsx" }, { "@type": "dcat:Distribution", "downloadURL": "https://ndownloader.figshare.com/files/44194472", "format": "xlsx", "mediaType": "application/vnd.openxmlformats-officedocument.spreadsheetml.sheet", "title": "2013_15-min_weather_SWMRU_CPRL_1.xlsx" }, { "@type": "dcat:Distribution", "downloadURL": "https://ndownloader.figshare.com/files/44194475", "format": "xlsx", "mediaType": "application/vnd.openxmlformats-officedocument.spreadsheetml.sheet", "title": "2014_15-min_weather_SWMRU_CPRL_0.xlsx" }, { "@type": "dcat:Distribution", "downloadURL": "https://ndownloader.figshare.com/files/44194478", "format": "xlsx", "mediaType": "application/vnd.openxmlformats-officedocument.spreadsheetml.sheet", "title": "2015_15-min_weather_SWMRU_CPRL_0.xlsx" }, { "@type": "dcat:Distribution", "downloadURL": "https://ndownloader.figshare.com/files/44194481", "format": "xlsx", "mediaType": "application/vnd.openxmlformats-officedocument.spreadsheetml.sheet", "title": "2016_15-min_weather_SWMRU_CPRL_1.xlsx" }, { "@type": "dcat:Distribution", "downloadURL": "https://ndownloader.figshare.com/files/44194484", "format": "xlsx", "mediaType": "application/vnd.openxmlformats-officedocument.spreadsheetml.sheet", "title": "2018_15-min_weather_SWMRU_CPRL_1.xlsx" }, { "@type": "dcat:Distribution", "downloadURL": "https://ndownloader.figshare.com/files/44194487", "format": "xlsx", "mediaType": "application/vnd.openxmlformats-officedocument.spreadsheetml.sheet", "title": "1991_15-min_weather_SWMRU_CPRL.xlsx" }, { "@type": "dcat:Distribution", "downloadURL": "https://ndownloader.figshare.com/files/44194490", "format": "xlsx", "mediaType": "application/vnd.openxmlformats-officedocument.spreadsheetml.sheet", "title": "1992_15-min_weather_SWMRU_CPRL.xlsx" }, { "@type": "dcat:Distribution", "downloadURL": "https://ndownloader.figshare.com/files/44194493", "format": "xlsx", "mediaType": "application/vnd.openxmlformats-officedocument.spreadsheetml.sheet", "title": "1993_15-min_weather_SWMRU_CPRL.xlsx" }, { "@type": "dcat:Distribution", "downloadURL": "https://ndownloader.figshare.com/files/44194499", "format": "xlsx", "mediaType": "application/vnd.openxmlformats-officedocument.spreadsheetml.sheet", "title": "1994_15-min_weather_SWMRU_CPRL_0.xlsx" }, { "@type": "dcat:Distribution", "downloadURL": "https://ndownloader.figshare.com/files/44194502", "format": "xlsx", "mediaType": "application/vnd.openxmlformats-officedocument.spreadsheetml.sheet", "title": "2009_15-min_weather_SWMRU_CPRL.xlsx" }, { "@type": "dcat:Distribution", "downloadURL": "https://ndownloader.figshare.com/files/44194505", "format": "xlsx", "mediaType": "application/vnd.openxmlformats-officedocument.spreadsheetml.sheet", "title": "2011_15-min_weather_SWMRU_CPRL.xlsx" }, { "@type": "dcat:Distribution", "downloadURL": "https://ndownloader.figshare.com/files/44194508", "format": "xlsx", "mediaType": "application/vnd.openxmlformats-officedocument.spreadsheetml.sheet", "title": "2004_15-min_weather_SWMRU_CPRL.xlsx" }, { "@type": "dcat:Distribution", "downloadURL": "https://ndownloader.figshare.com/files/44194511", "format": "xlsx", "mediaType": "application/vnd.openxmlformats-officedocument.spreadsheetml.sheet", "title": "2010_15-min_weather_SWMRU_CPRL.xlsx" }, { "@type": "dcat:Distribution", "downloadURL": "https://ndownloader.figshare.com/files/44194514", "format": "xlsx", "mediaType": "application/vnd.openxmlformats-officedocument.spreadsheetml.sheet", "title": "1995_15-min_weather_SWMRU_CPRL.xlsx" }, { "@type": "dcat:Distribution", "downloadURL": "https://ndownloader.figshare.com/files/44194517", "format": "xlsx", "mediaType": "application/vnd.openxmlformats-officedocument.spreadsheetml.sheet", "title": "2003_15-min_weather_SWMRU_CPRL.xlsx" }, { "@type": "dcat:Distribution", "downloadURL": "https://ndownloader.figshare.com/files/44194520", "format": "xlsx", "mediaType": "application/vnd.openxmlformats-officedocument.spreadsheetml.sheet", "title": "2019_15-min_weather_SWMRU_CPRL.xlsx" }, { "@type": "dcat:Distribution", "downloadURL": "https://ndownloader.figshare.com/files/44194523", "format": "pdf", "mediaType": "application/pdf", "title": "README_Standard_Quality_Controlled_Research_Weather_Data_Bushland_TX.pdf" } ], "license": "https://creativecommons.org/publicdomain/zero/1.0/", "bureauCode": [ "005:18" ], "modified": "2024-03-01", "publisher": { "@type": "org:Organization", "name": "Agricultural Research Service" }, "accrualPeriodicity": "irregular", "keyword": [ "NP211", "Weather", "solar irradiance", "wind speed", "air temperature", "Relative Humidity", "barometric pressure", "data.gov", "ARS" ], "spatial": "{\"type\": \"Polygon\", \"coordinates\": [[[-102.09906463948, 35.191719970106], [-102.07671433134, 35.19121493622], [-102.07678299485, 35.1865853205], [-102.07609634934, 35.177044674547], [-102.09913330298, 35.177072738625], [-102.09906463948, 35.191719970106]]]}" }, { "identifier": "10.15482/USDA.ADC/1526329", "accessLevel": "public", "contactPoint": { "hasEmail": "mailto:steve.evett@usda.gov", "fn": "Evett, Steven R." }, "programCode": [ "005:040" ], "description": "[NOTE - 2022-09-07: this dataset is superseded by an updated version https://doi.org/10.15482/USDA.ADC/1526433 ]
\nThis dataset consists of weather data for each year when maize was grown for grain at the USDA-ARS Conservation and Production Laboratory (CPRL), Soil and Water Management Research Unit (SWMRU) research weather station, Bushland, Texas (Lat. 35.186714°, Long. -102.094189°, elevation 1170 m above MSL). Maize was grown for grain on four large, precision weighing lysimeters, each in the center of a 4.44 ha square field. The four square fields are themselves arranged in a larger square with the fields in four adjacent quadrants of the larger square. Fields and lysimeters within each field are thus designated northeast (NE), southeast (SE), northwest (NW), and southwest (SW). Irrigation was by linear move sprinkler system in 1989, 1990, and 1994. In 2013, 2016, and 2018, two lysimeters and their respective fields (NE and SE) were irrigated using subsurface drip irrigation (SDI), and two lysimeters and their respective fields (NW and SW) were irrigated by a linear move sprinkler system. Irrigations were managed to replenish soil water used by the crop on a weekly or more frequent basis as determined by soil profile water content readings made with a neutron probe to 2.4-m depth in the field.\nThe weather data include solar irradiance, barometric pressure, air temperature and relative humidity, and wind speed determined using sensors placed at 2-m height over a level, grass surface mowed to not exceed 12 cm height and irrigated and fertilized to maintain reference conditions as promulgated by ASCE (2005) and FAO (1996). Irrigation was by surface flood in 1989 through 1994, and by subsurface drip irrigation after 1994. Sensors were replicated and intercompared between replicates and with data from nearby weather stations, which were sometimes used for gap filling. Quality control and assurance methods are described by Evett et al. (2018).\nThese datasets originate from research aimed at determining crop water use (ET), crop coefficients for use in ET-based irrigation scheduling based on a reference ET, crop growth, yield, harvest index, and crop water productivity as affected by irrigation method, timing, amount (full or some degree of deficit), agronomic practices, cultivar, and weather. Prior publications have focused on maize ET, crop coefficients, and crop water productivity. Crop coefficients have been used by ET networks. The data have utility for testing simulation models of crop ET, growth, and yield and have been used by the Agricultural Model Intercomparison and Improvement Project (AgMIP), by OPENET, and by many others for testing, and calibrating models of ET that use satellite and/or weather data.
\nResources in this dataset:
\nResource Title: 1989 Bushland, TX, standard 15-minute weather data.\nFile Name: 1989_15-min_weather_SWMRU_CPRL.xlsx.\nResource Description: The weather data are presented as 15-minute mean values of solar irradiance, air temperature, relative humidity, wind speed, and barometric pressure; and as 15-minute totals of precipitation (rain and snow). Daily total precipitation as determined by mass balance at each of the four large, precision weighing lysimeters is given in a separate tab along with the mean daily value of precipitation. Data dictionaries are in separate tabs with names corresponding to those of tabs containing data. A separate tab contains a visualization tool for missing data. Another tab contains a visualization tool for the weather data in five-day increments of the 15-minute data. An Introduction tab explains the other tabs, lists the authors, explains data time conventions, explains symbols, lists the sensors, and datalogging systems used, and gives geographic coordinates of sensing locations.
\nResource Title: 1990 Bushland, TX, standard 15-minute weather data.\nFile Name: 1990_15-min_weather_SWMRU_CPRL.xlsx.\nResource Description: As above for 1990.
\nResource Title: 1994 Bushland, TX, standard 15-minute weather data.\nFile Name: 1994_15-min_weather_SWMRU_CPRL.xlsx.\nResource Description: As above for 1994.
\nResource Title: 2013 Bushland, TX, standard 15-minute weather data.\nFile Name: 2013_15-min_weather_SWMRU_CPRL.xlsx.\nResource Description: As above for 2013.
\nResource Title: 2016 Bushland, TX, standard 15-minute weather data.\nFile Name: 2016_15-min_weather_SWMRU_CPRL.xlsx.\nResource Description: As above for 2016.
\nResource Title: 2018 Bushland, TX, standard 15-minute weather data.\nFile Name: 2018_15-min_weather_SWMRU_CPRL.xlsx.\nResource Description: As above for 2018.
\nResource Title: 1996 Bushland, TX, standard 15-minute weather data.\nFile Name: 1996_15-min_weather_SWMRU_CPRL.xlsx.\nResource Description: As above for 1996.
\nResource Title: 1997 Bushland, TX, standard 15-minute weather data.\nFile Name: 1997_15-min_weather_SWMRU_CPRL.xlsx.\nResource Description: As above for 1997.
\nResource Title: 1998 Bushland, TX, standard 15-minute weather data.\nFile Name: 1998_15-min_weather_SWMRU_CPRL.xlsx.\nResource Description: As above for 1998.
\nResource Title: 1999 Bushland, TX, standard 15-minute weather data.\nFile Name: 1999_15-min_weather_SWMRU_CPRL.xlsx.\nResource Description: As above for 1999.
\nThe data set contains stream water concentrations of herbicides and nutrients for 153 sites in the northern Missouri/southern Iowa region from 1994 to 1995. The data are available in Microsoft Excel 2010 format. Sheet 1 (Metadata) of the file contains supporting information regarding the length of record, site locations, parameters measured, concentrations units, method detection limits, describes the meaning of zero and blank cells, defines the major land resource areas (MLRAs) of the region, and provides a link to the U. S. Geological Survey discharge data. Sheet 2 (Site names and locations) has a list of the site names by MLRA, river system, and site name. It also contains site locations, provided as Universal Transverse Mercator coordinates, drainage areas, and indicates which sites were co-located at U. S. Geological Survey gauge sites. Sheet 3 (Concentration Data) contains data for 15 herbicide and nutrient analytes along with the corresponding site name, river system, and MLRA.\n\n Atrazine concentrations in Goodwater Creek Experimental Watershed (GCEW) were shown to be among the very highest of any watershed in the United States based on comparisons using the national Watershed Regressions for Pesticides (WARP) model and by direct comparison with the 112 watersheds used in the development of WARP. The herbicide data collected in GCEW are documented at plot, field, and watershed scales. This 20-yr-long (1991-2010) effort was augmented with a spatially broad effort within the Central Mississippi River Basin encompassing 12 related claypan watersheds in the Salt River Basin, two cave streams on the fringe of the Central Claypan Areas in the Bonne Femme watershed, and 95 streams in northern Missouri and southern Iowa. The research effort on herbicide transport has highlighted the importance of restrictive soil layers with smectitic mineralogy to the risk of transport vulnerability. Near-surface soil features, such as claypans and argillic horizons, result in greater herbicide transport than soils with high saturated hydraulic conductivities and low smectitic clay content.
Resource Title: GeoData catalog record.
File Name: Web Page, url: https://geodata.nal.usda.gov/geonetwork/srv/eng/catalog.search#/metadata/GoodwaterNutrient_jjm_2015-03-12_1534
Weather data from two weather stations at Stuttgart Rice Research and Extension center are archived. Current air temperature, relative humidity, wind speed, solar radiation and soil temperature data are provided by station and are displayed and archived either hourly or daily. Historical weather data goes back to 2008.
Resource Title: Weather Station Data.
File Name: Web Page, url: https://www.ars.usda.gov/southeast-area/stuttgart-ar/dale-bumpers-national-rice-research-center/docs/weather-station-data/
The United States Department of Agriculture-Agricultural Research Service (USDA-ARS) North Central Soil Conservation Research Laboratory - Soil Management Unit established a weather data collection system at the Swan Lake Research Farm in 1997. Weather data collected include wind speed and direction, barometric pressure, relative humidity, air temperature, soil temperatures, soil heat flux, solar radiation, photosynthetic active radiation, and precipitation. In 2015 the site became part of the Long Term Agroecosystem Research (LTAR) project. The Swan Lake Research Farm is located in Stevens County Minnesota, in the Upper Mississippi River Basin (UMRB) watershed.
Resource Title: GeoData catalog record.
File Name: Web Page, url: https://geodata.nal.usda.gov/geonetwork/srv/eng/catalog.search#/metadata/ad80c14b-f4a0-41b2-8592-3a5b6bbebcc7
As part of our project, “Developing Association Mapping in Polyploid Perennial Biofuel Grasses” (DOE-USDA Plant Feedstock Genomics for Bioenergy Program grant DE-A102-07ER64454)*, two SNP discovery initiatives were carried out. The earlier one (2009) was an approach based on EST sequences. The latest initiative (2011-12) adopted a more powerful approach, based on GBS (Genotyping by Sequencing). We believe that the SNP markers identified in these studies will greatly enhance breeding efforts that target the improvement of key biofuel traits and the development of new switchgrass cultivars.
\nTo enable genome-wide association study (GWAS) and genomic selection (GS) in switchgrass, we genotyped a full-sib population (n =130), a half-sib population (n =168) and association populations (66 pops, n =540). The parents of the linkage populations are upland tetraploids. The association populations are primarily of the upland ecotype, both tetraploid and octoploid, with a few lowland tetraploids as well. A total of 350 GB of sequence was generated from 840 individuals using GBS. Over 1.2 million putative SNPs were discovered with the UNEAK pipeline. In addition, ultra-high density paternal and maternal linkage maps, of 41K and 46K SNPs, respectively, were also constructed based on the conserved synteny between switchgrass and foxtail millet.
\nThe data associated with this study are listed here:
\nPaternal and maternal linkage maps of the full-sib population [8 MB]
\nResource Title: Switchgrass Data.
File Name: Web Page, url: http://datacommons.cyverse.org/browse/iplant/home/shared/panzea/genotypes/GBS/switchgrass/Lu_PLoSGenet_2013_switchgrassGenos20150612.zip
CyVerse Data Store - the current path to the data until the links on the main site are fixed
This data is collected from two experiments, one in 2018 and one in 2019, that left untreated or inoculated grapevines with Diplodia seriata, Neofusicoccum parvum, Phaeomoniella chlamydospora, or mock-inoculated, and then two months later inoculated with one of the three pathogens. Grapevine stem phenolic levels were measured at the time of the second inoculation on a different branch, and comparisons were made between pathogen infected plants or those left non-inoculated. Lesion sizes of the second inoculations also were compared to examine the effects on the first inoculation on these. Lesion lengths were measured in mm, and all phenolic compound levels were measured in mg/g FW amounts.
Resource Title: Fungal Pathogen Induction of Grapevine Stem Phenolics.
File Name: Fungal Pathogen Induction of Stem Phenolics.xlsx
Resource Description: Data from experiments conducted in 2018 and 2019, available on different tabs. Data from 2018 was from an experiment that had potentially compromised effects due to loss of greenhouse environmental controls and issues establishing fungal canker pathogen infections. Lesion lengths are provided in mm, and all phenolic levels are provided in mg/g FW stem tissues.
The Triticeae Toolbox Barley (T3 Barley) is an extension of The Hordeum Toolbox (THT), which was created by the preceding Barley CAP. T3 Barley incorporates all of the THT data.
\nThe Triticeae Toolbox (T3) is the web portal for data generated by the Triticeae Coordinated Agricultural Project (T-CAP), funded by the National Institute for Food and Agriculture (NIFA) of the United States Department of Agriculture (USDA). It also contains data from US Uniform Regional Nurseries, supported by the US Wheat and Barley Scab Initiative. The database was initially developed as The Hordeum Toolbox (THT) to hold barley data generated by the Barley CAP project (2006-2010). T3 Barley hods data generated for Hordeum vulgare L. T3 Wheat holds data generated for Triticum spp. T3 Oat holds data generated for Avena. All are being enhanced in database performance, community curation and user tools. T3 contains germplasm line information, pedigree, genotype and phenotypic data from breeding programs participating in the CAP and core germplasm collections maintained by the USDA National Small Grains Collection.
Resource Title: T3 Barley.
File Name: Web Page, url: https://barley.triticeaetoolbox.org
T3 Barley is an extension of The Hordeum Toolbox (THT), which was created by the preceding Barley CAP. T3 Barley incorporates all of the THT data.
The Triticeae Toolbox Oat (T3 Oat) is the repository of oat phenotype and genotype data for the Global Oat Genetics Database.
\nThe Triticeae Toolbox (T3) is the web portal for data generated by the Triticeae Coordinated Agricultural Project (T-CAP), funded by the National Institute for Food and Agriculture (NIFA) of the United States Department of Agriculture (USDA). It also contains data from US Uniform Regional Nurseries, supported by the US Wheat and Barley Scab Initiative. The database was initially developed as The Hordeum Toolbox (THT) to hold barley data generated by the Barley CAP project (2006-2010). T3 Barley hods data generated for Hordeum vulgare L. T3 Wheat holds data generated for Triticum spp. T3 Oat holds data generated for Avena. All are being enhanced in database performance, community curation and user tools. T3 contains germplasm line information, pedigree, genotype and phenotypic data from breeding programs participating in the CAP and core germplasm collections maintained by the USDA National Small Grains Collection.
Resource Title: T3 Oat.
File Name: Web Page, url: https://oat.triticeaetoolbox.org
T3/Oat is the repository of oat phenotype and genotype data for the Global Oat Genetics Database, a project initiated in January 2014 by
\nThe Triticeae Toolbox Wheat (T3 Wheat) is a repository for public wheat data generated by the Wheat Coordinated Agricultural Project (Wheat CAP). Funding is provided by the National Institute for Food and Agriculture (NIFA) and the United States Department of Agriculture (USDA). The current project is funded through NIFA's International Wheat Yield Partnership (IWYP) and part of the Agriculture and Food Research Initiative (AFRI).
Resource Title: T3 Wheat.
File Name: Web Page, url: https://wheat.triticeaetoolbox.org
T3 Wheat holds data generated for Triticum spp. It is being enhanced in database performance, community curation and user tools. T3 contains germplasm line information, pedigree, genotype and phenotypic data from breeding programs participating in the CAP and core germplasm collections maintained by the USDA National Small Grains Collection.
TPAC Study for Greenhouse gas Reduction through Agricultural Carbon Enhancement network in West Lafayette, Indiana\nRecent efforts have attempted to establish emission estimates for greenhouse gases (GHG) from agricultural soils in the United States. This research project was conducted to assess the influence of cropping system management on non-carbon dioxide (non-CO2) GHG emissions from an eastern cornbelt alfisol. Corn (Zea mays L.) and soybean (Glycine max (L.) Merr.) rotation plots were established, as were plots in continuous management of native grasses or Sorghum/Sudan grass. GHG fluxes were monitored throughout each growing season from 2004 through 2007. Fluxes of N2O were significantly correlated with soil temperature (P < 0.001), and thus a Q10 correction was made (3.48 for N2O). Nitrous oxide emissions from corn were lowest from the precision tillage treatment (2.4 kg N ha-1 yr-1), significantly lower than the conventional tillage (4.9 kg N ha-1 yr-1) or cover crop corn treatments (5.0 kg N ha-1 yr-1). Corn-soybean and biomass-based cropping systems resulted in significantly greater N2O emissions than native grasses. There was a positive correlation between N fertilization rate and N2O emissions when comparing all treatments in this study. These soils were typically a sink for atmospheric CH4 for these cropping systems, and thus N2O is the primary non-CO2 GHG of concern. When evaluating the entire cropping system, native grasses resulted in the lowest N2O emissions, while corn-soybean rotation planted with precision tillage resulted in similar N2O emissions as bare soil and were significantly lower than emissions from the other cropping systems assessed.
Resource Title: GeoData catalog record.
File Name: Web Page, url: https://geodata.nal.usda.gov/geonetwork/srv/eng/catalog.search#/metadata/87f505d7-9c43-4082-a2f2-329a838be6c9
Tennessee Valley Study for Resilient Economic Agricultural Practices in Auburn, Alabama\nMaize ( Zea mays L.) produced in narrow rows can increase yields and accelerate canopy closure. Costly equipment modifications make narrow rows impractical, but a twin-row configuration may boost pro duction with fewer equipment modifications. Four field experiments were conducted to measure weed biomass, leaf area index (LAI), and yield for a conventional (CN) and a glyphosate-resistant (GR) hybrid across three plant densities (low 4.0–4.4 plants m - 2 ; medium 5.9–6.4 plants m - 2 ; and high 7.9–8.4 plants m - 2 ) and two row configurations (single vs. twin) in a conservation tillage system during the 2005 grow ing season. The experimental design was a split–split plot with a RCB arrangement of whole plots where hybrids were assigned to main plots, row configurations to subplots, and plant density to sub-subplots with four replications. Row configuration had little effect on weed biomass compared to plant density and hybrid. Leaf area index increased with higher plant density at all locations. In general, LAI increased with the twin-row configuration, but LAI also varied with hybrid based on interactions between hybrid and plant density or row configuration. Row configuration had little impact on maize yields, while plant density had the most effect on yields. Plant density also interacted with hybrid or row configuration at multiple locations, although maize yields did not always increase with higher plant density. Conventional hybrids may also provide an alternative to GR hybrids, particularly at lower plant densities. Maize yield increases with twin rows were minimal and may not justify twin row conversion under dryland condi tions, but growers that already utilize twin-row equipment will not suffer yield decreases by planting twin rows.
Resource Title: Auburn, AL Tennessee Valley Study (ALAUTVS) CSV data.
File Name: ALAUTVS_csv_data.zip
Resource Description: CSV format data on Experimental Units, Field Sites, Residue Management, Persons, Treatments, Weather Daily, Weather Station.
This data package contains termite activity data in plots with a range of herbivore exclusion treatments on Jornada Experimental Range (JER) and Chihuahuan Desert Rangeland Research Center (CDRRC) lands. Study sites were established in 1995; one in black grama grassland and the other in creosotebush shrubland to compare the impact of herbivores on ecosystem processes between these vegetation types. Parallel studies were established at the Sevilleta LTER site (New Mexico, USA) and Mapimi Biosphere Reserve (Durango, Mexico). Each study site is 1 km by 0.5 km in area. Four replicate experimental blocks were randomly located at each study site to measure vegetation responses using exclusion treatments including a) all mammalian herbivores, including cattle, lagomorphs, and rodents, b) lagomorphs and cattle only, c) cattle only, and d) control accessible to all herbivores. Thirty-six sampling points were positioned at 5.8-meter intervals on a systematically located 6 by 6 point grid within each plot. A permanent one-meter by one-meter vegetation measurement quadrat is located at each of the 36 points. Each spring and fall from 1995-2005, a tape measure was used to measure the length, diameter, and height in centimeters of each termite casing in these vegetation quadrats. This study is complete.
Resource Title: Website Pointer to html file.
File Name: Web Page, url: https://portal.edirepository.org/nis/mapbrowse?scope=knb-lter-jrn&identifier=210086008
Webpage with information and links to data files for download
Dr. Kevin Bronson provides this unique nitrogen and water management in cotton agricultural research dataset for compute, including notation of field events and operations, an intermediate analysis mega-table of correlated and calculated parameters generated during the experimentation, high resolution plot level data intermediate analysis tables, plus SAS process output intermediate tables, as well as the complete raw sensor recorded outputs.
\nThis data was collected during the beginning time period of our USDA Maricopa terrestrial proximal high-throughput plant phenotyping tri-metric method generation, where a 5Hz crop canopy height, temperature and spectral signature are recorded coincident to indicate a plant health status. In this early development period, our Proximal Sensing Cart Mark1 (PSCM1) platform supplants people carrying the CropCircle (CC) sensors, and with an improved view mechanical performance result.
\nSee included README file for operational details and further description of the measured data signals.
\nSummary:\nActive optical proximal cotton canopy sensing spatial data and including additional related metrics such as thermal are presented.\nAgronomic nitrogen and irrigation management related field operations are listed.\nUnique research experimentation intermediate analysis table is made available, along with raw data.\nThe raw data recordings, and annotated table outputs with calculated VIs are made available.\nPlot polygon coordinate designations allow a re-intersection spatial analysis.\nData was collected in the 2012 season at Maricopa Agricultural Center, Arizona, USA.\nHigh throughput proximal plant phenotyping via electronic sampling and data processing method approach is exampled.\nAcquired data using USDA Maricopa first mobile platforms, such as the Proximal Sensing Cart Mark 1, and via people.\nSAS and GIS compute processing output tables, including Excel formatted examples are presented, where data tabulation and analysis is available.\nThe weekly proximal sensing data collected include canopy reflectance at six wavelengths, ultrasonic distance sensing of canopy height, and infrared thermometry. Lint and seed yields, first open boll biomass, and nitrogen uptake were also determined. Soil profile nitrate to 1.8 m depth was determined in 30-cm increments, before planting and after harvest. Nitrous oxide emissions were determined 20 or more weeks in the season with 1-L vented chambers (samples taken at 0, 12, and 24 minutes). Nitrous oxide was determined by gas chromatography (electron detection detector).
", "title": "The Bronson Files, Dataset 1, Field 17, 2012", "distribution": [ { "@type": "dcat:Distribution", "downloadURL": "https://ndownloader.figshare.com/files/44529269", "format": "csv", "mediaType": "application/csv", "title": "Data Dictionary3.csv" }, { "@type": "dcat:Distribution", "downloadURL": "https://ndownloader.figshare.com/files/44529272", "format": "csv", "mediaType": "text/plain", "title": "2012_F017_ActivitiesLog.csv" }, { "@type": "dcat:Distribution", "downloadURL": "https://ndownloader.figshare.com/files/44529275", "format": "csv", "mediaType": "application/csv", "title": "F17 2012 plot corner point coordinates_0.csv" }, { "@type": "dcat:Distribution", "downloadURL": "https://ndownloader.figshare.com/files/44529278", "format": "xlsx", "mediaType": "application/vnd.openxmlformats-officedocument.spreadsheetml.sheet", "title": "2012_F17_CottonN_megatable.xlsx" }, { "@type": "dcat:Distribution", "downloadURL": "https://ndownloader.figshare.com/files/44529281", "format": "csv", "mediaType": "text/plain", "title": "2012_05_18_HS_data.csv" }, { "@type": "dcat:Distribution", "downloadURL": "https://ndownloader.figshare.com/files/44529284", "format": "csv", "mediaType": "application/csv", "title": "2012_05_29_HS_data.csv" }, { "@type": "dcat:Distribution", "downloadURL": "https://ndownloader.figshare.com/files/44529287", "format": "csv", "mediaType": "text/plain", "title": "2012_06_04_HS_data.csv" }, { "@type": "dcat:Distribution", "downloadURL": "https://ndownloader.figshare.com/files/44529290", "format": "csv", "mediaType": "application/csv", "title": "2012_06_12_HS_data.csv" }, { "@type": "dcat:Distribution", "downloadURL": "https://ndownloader.figshare.com/files/44529293", "format": "csv", "mediaType": "text/plain", "title": "2012_06_13_HS_data.csv" }, { "@type": "dcat:Distribution", "downloadURL": "https://ndownloader.figshare.com/files/44529296", "format": "csv", "mediaType": "application/csv", "title": "2012_06_19_HS_data.csv" }, { "@type": "dcat:Distribution", "downloadURL": "https://ndownloader.figshare.com/files/44529299", "format": "csv", "mediaType": "text/plain", "title": "2012_06_22_HS_data.csv" }, { "@type": "dcat:Distribution", "downloadURL": "https://ndownloader.figshare.com/files/44529302", "format": "csv", "mediaType": "application/csv", "title": "2012_06_25_HS_data.csv" }, { "@type": "dcat:Distribution", "downloadURL": "https://ndownloader.figshare.com/files/44529305", "format": "csv", "mediaType": "text/plain", "title": "2012_07_02_HS_data.csv" }, { "@type": "dcat:Distribution", "downloadURL": "https://ndownloader.figshare.com/files/44529308", "format": "csv", "mediaType": "text/plain", "title": "2012_07_02_CS_data.csv" }, { "@type": "dcat:Distribution", "downloadURL": "https://ndownloader.figshare.com/files/44529317", "format": "csv", "mediaType": "application/csv", "title": "CS_GPS.csv" }, { "@type": "dcat:Distribution", "downloadURL": "https://ndownloader.figshare.com/files/44529320", "format": "csv", "mediaType": "text/plain", "title": "2012_07_09_HS_data.csv" }, { "@type": "dcat:Distribution", "downloadURL": "https://ndownloader.figshare.com/files/44529323", "format": "csv", "mediaType": "application/csv", "title": "2012_07_18_HS_data.csv" }, { "@type": "dcat:Distribution", "downloadURL": "https://ndownloader.figshare.com/files/44529329", "format": "csv", "mediaType": "text/plain", "title": "2012_07_27_HS_data.csv" }, { "@type": "dcat:Distribution", "downloadURL": "https://ndownloader.figshare.com/files/44529332", "format": "csv", "mediaType": "application/csv", "title": "2012_08_03_HS_data.csv" }, { "@type": "dcat:Distribution", "downloadURL": "https://ndownloader.figshare.com/files/44529341", "format": "csv", "mediaType": "text/plain", "title": "2012_08_03_CS_data.csv" }, { "@type": "dcat:Distribution", "downloadURL": "https://ndownloader.figshare.com/files/44529344", "format": "csv", "mediaType": "application/csv", "title": "2012_08_03_CS_GPS.csv" }, { "@type": "dcat:Distribution", "downloadURL": "https://ndownloader.figshare.com/files/44529347", "format": "xlsx", "mediaType": "application/vnd.openxmlformats-officedocument.spreadsheetml.sheet", "title": "18052012.xlsx" }, { "@type": "dcat:Distribution", "downloadURL": "https://ndownloader.figshare.com/files/44529350", "format": "xlsx", "mediaType": "application/vnd.openxmlformats-officedocument.spreadsheetml.sheet", "title": "29052012.xlsx" }, { "@type": "dcat:Distribution", "downloadURL": "https://ndownloader.figshare.com/files/44529353", "format": "xlsx", "mediaType": "application/vnd.openxmlformats-officedocument.spreadsheetml.sheet", "title": "04062012.xlsx" }, { "@type": "dcat:Distribution", "downloadURL": "https://ndownloader.figshare.com/files/44529356", "format": "xlsx", "mediaType": "application/vnd.openxmlformats-officedocument.spreadsheetml.sheet", "title": "13062012.xlsx" }, { "@type": "dcat:Distribution", "downloadURL": "https://ndownloader.figshare.com/files/44529359", "format": "xlsx", "mediaType": "application/vnd.openxmlformats-officedocument.spreadsheetml.sheet", "title": "22062012.xlsx" }, { "@type": "dcat:Distribution", "downloadURL": "https://ndownloader.figshare.com/files/44529362", "format": "xlsx", "mediaType": "application/vnd.openxmlformats-officedocument.spreadsheetml.sheet", "title": "25062012.xlsx" }, { "@type": "dcat:Distribution", "downloadURL": "https://ndownloader.figshare.com/files/44529365", "format": "xlsx", "mediaType": "application/vnd.openxmlformats-officedocument.spreadsheetml.sheet", "title": "02072012.xlsx" }, { "@type": "dcat:Distribution", "downloadURL": "https://ndownloader.figshare.com/files/44529371", "format": "xlsx", "mediaType": "application/vnd.openxmlformats-officedocument.spreadsheetml.sheet", "title": "2012_07_02_CS_GPS.xlsx" }, { "@type": "dcat:Distribution", "downloadURL": "https://ndownloader.figshare.com/files/44529374", "format": "xlsx", "mediaType": "application/vnd.openxmlformats-officedocument.spreadsheetml.sheet", "title": "09072012.xlsx" }, { "@type": "dcat:Distribution", "downloadURL": "https://ndownloader.figshare.com/files/44529377", "format": "xlsx", "mediaType": "application/vnd.openxmlformats-officedocument.spreadsheetml.sheet", "title": "18072012.xlsx" }, { "@type": "dcat:Distribution", "downloadURL": "https://ndownloader.figshare.com/files/44529380", "format": "xlsx", "mediaType": "application/vnd.openxmlformats-officedocument.spreadsheetml.sheet", "title": "270712.xlsx" }, { "@type": "dcat:Distribution", "downloadURL": "https://ndownloader.figshare.com/files/44529383", "format": "xlsx", "mediaType": "application/vnd.openxmlformats-officedocument.spreadsheetml.sheet", "title": "030812.xlsx" }, { "@type": "dcat:Distribution", "downloadURL": "https://ndownloader.figshare.com/files/44529386", "format": "xlsx", "mediaType": "application/vnd.openxmlformats-officedocument.spreadsheetml.sheet", "title": "2012_08_03_CS_GPS_tableoutput.dat.xlsx" }, { "@type": "dcat:Distribution", "downloadURL": "https://ndownloader.figshare.com/files/44529389", "format": "JPG", "mediaType": "image/jpeg", "title": "P8030592.JPG" }, { "@type": "dcat:Distribution", "downloadURL": "https://ndownloader.figshare.com/files/44529419", "format": "MOV", "mediaType": "video/quicktime", "title": "P7020454.MOV" }, { "@type": "dcat:Distribution", "downloadURL": "https://ndownloader.figshare.com/files/44529422", "format": "txt", "mediaType": "text/plain", "title": "README_The Bronson Files, Dataset 1, Field 17, 2012.txt" }, { "@type": "dcat:Distribution", "downloadURL": "https://ndownloader.figshare.com/files/44529425", "format": "txt", "mediaType": "text/plain", "title": "file-list_The Bronson Files, Dataset 1, Field 17, 2012.txt" } ], "license": "https://www.usa.gov/publicdomain/label/1.0/", "bureauCode": [ "005:18" ], "modified": "2024-02-15", "publisher": { "@type": "org:Organization", "name": "Agricultural Research Service" }, "keyword": [ "EARTH SCIENCE > BIOSPHERE > VEGETATION > PLANT PHENOLOGY", "EARTH SCIENCE > AGRICULTURE > SOILS > NITROGEN", "Field-based high-throughput phenotyping", "plant phenotyping", "Agroecosystems & Environment Weather and Climate", "NP211", "data.gov", "ARS" ], "spatial": "{\"type\": \"Polygon\", \"coordinates\": [[[-111.97890043259, 33.080087064259], [-111.97890043259, 33.082424376658], [-111.97701215744, 33.082424376658], [-111.97701215744, 33.080087064259], [-111.97890043259, 33.080087064259]]]}" }, { "identifier": "10.15482/USDA.ADC/1526424", "accessLevel": "public", "contactPoint": { "hasEmail": "mailto:matthew.conley@usda.gov", "fn": "Conley, Matthew" }, "programCode": [ "005:040" ], "description": "Dr. Kevin Bronson provides a dataset representing the third of three consecutive years of cotton and nitrogen management experimentation in Field 113 of the Maricopa Agricultural Center, Arizona USA. Included is an intermediate analysis mega-table of correlated and calculated parameters, laboratory analysis results generated during the experimentation, plus high-resolution plot level intermediate data analysis tables of SAS process output, as well as the complete raw data sensor recorded logger outputs.
\nSee included README file for operational details and further description of the measured data signals.
\nSummary -\nActive optical proximal cotton canopy sensing spatial data and including additional related metrics are presented.\nAgronomic nitrogen and irrigation management related field operations are listed.\nUnique research experimentation intermediate analysis table is made available, along with raw data.\nThe raw data recordings, and annotated table outputs with calculated VIs are made available.\nPlot polygon coordinate designations allow a re-intersection spatial analysis.\nData was collected in the 2018 cotton season at Maricopa Agricultural Center, Arizona, USA.\nHigh throughput proximal plant phenotyping via electronic sampling and data processing method approach is exampled using a modified high-clearance Hamby spray-rig.\nAcquired data conforms to location standard methodologies of high-throughput plant phenotyping.\nThe weekly proximal sensing data collected include the primary canopy reflectance at six wavelengths. Lint and seed yields, first open boll biomass, and nitrogen uptake was also determined. Soil profile nitrate to 1.8 m depth was determined in 30-cm increments, before planting and after harvest. Nitrous oxide emissions were determined with 1-L vented chambers (samples taken at 0, 12, and 24 minutes). Nitrous oxide was determined by gas chromatography (electron detection detector).
", "title": "The Bronson Files, Dataset 10, Field 113, 2018 Cotton", "distribution": [ { "@type": "dcat:Distribution", "downloadURL": "https://ndownloader.figshare.com/files/44531810", "format": "csv", "mediaType": "text/plain", "title": "F113_2018_Data_Dictionary.csv" }, { "@type": "dcat:Distribution", "downloadURL": "https://ndownloader.figshare.com/files/44531813", "format": "csv", "mediaType": "text/plain", "title": "F113_2018_ActivitiesLog_0.csv" }, { "@type": "dcat:Distribution", "downloadURL": "https://ndownloader.figshare.com/files/44531819", "format": "xlsx", "mediaType": "application/vnd.openxmlformats-officedocument.spreadsheetml.sheet", "title": "F113_2018_MegaTable.xlsx" }, { "@type": "dcat:Distribution", "downloadURL": "https://ndownloader.figshare.com/files/44531822", "format": "zip", "mediaType": "application/zip", "title": "F113_2018_Inter files.zip" }, { "@type": "dcat:Distribution", "downloadURL": "https://ndownloader.figshare.com/files/44531825", "format": "zip", "mediaType": "application/zip", "title": "F113_2018_HS data.zip" }, { "@type": "dcat:Distribution", "downloadURL": "https://ndownloader.figshare.com/files/44531828", "format": "zip", "mediaType": "application/zip", "title": "F113_2018_CS data.zip" }, { "@type": "dcat:Distribution", "downloadURL": "https://ndownloader.figshare.com/files/44531831", "format": "zip", "mediaType": "application/zip", "title": "F113_BF_Plot_Coordinates.zip" }, { "@type": "dcat:Distribution", "downloadURL": "https://ndownloader.figshare.com/files/44531834", "format": "pdf", "mediaType": "application/pdf", "title": "F113_2018_Cotton_Season_Chart_Bill_Luckett.pdf" }, { "@type": "dcat:Distribution", "downloadURL": "https://ndownloader.figshare.com/files/44531837", "format": "txt", "mediaType": "text/plain", "title": "README_The Bronson Files, Dataset 10, Field 113, 2018 Cotton.txt" }, { "@type": "dcat:Distribution", "downloadURL": "https://ndownloader.figshare.com/files/44531840", "format": "txt", "mediaType": "text/plain", "title": "file_list_The Bronson Files, Dataset 10, Field 113, 2018 Cotton_0.txt" } ], "license": "https://www.usa.gov/publicdomain/label/1.0/", "bureauCode": [ "005:18" ], "modified": "2024-02-21", "publisher": { "@type": "org:Organization", "name": "Agricultural Research Service" }, "keyword": [ "EARTH SCIENCE > BIOSPHERE > VEGETATION > PLANT PHENOLOGY", "EARTH SCIENCE > AGRICULTURE > SOILS > NITROGEN", "Field-based high-throughput phenotyping", "plant phenotyping", "Agroecosystems & Environment Weather and Climate", "NP211", "data.gov", "ARS" ], "spatial": "{\"type\": \"Polygon\", \"coordinates\": [[[-111.97890043259, 33.080087064259], [-111.97890043259, 33.082424376658], [-111.97701215744, 33.082424376658], [-111.97701215744, 33.080087064259], [-111.97890043259, 33.080087064259]]]}" }, { "identifier": "10.15482/USDA.ADC/1523088", "accessLevel": "public", "contactPoint": { "hasEmail": "mailto:matthew.conley@usda.gov", "fn": "Conley, Matthew" }, "programCode": [ "005:040" ], "description": "Dr. Kevin Bronson provides this unique nitrogen and water management in cotton agricultural research dataset for compute, including notation of field events and operations, an intermediate analysis mega-table of correlated and calculated parameters, and laboratory analysis results generated during the experimentation, plus high resolution plot level intermediate data analysis tables of SAS process output, as well as the complete raw sensor recorded logger outputs.
\nThis data was collected during the beginning time period of our USDA Maricopa terrestrial proximal high-throughput plant phenotyping tri-metric method generation, where a 5Hz crop canopy height, temperature and spectral signature are recorded coincident to indicate a plant health status. In this early development period, our Proximal Sensing Cart Mark1 (PSCM1) platform supplants people carrying the CropCircle (CC) sensors, and with an improved view mechanical performance result.
\nSee included README file for operational details and further description of the measured data signals.
\nSummary:\nActive optical proximal cotton canopy sensing spatial data and including additional related metrics such as thermal are presented.\nAgronomic nitrogen and irrigation management related field operations are listed.\nUnique research experimentation intermediate analysis table is made available, along with raw data.\nThe raw data recordings, and annotated table outputs with calculated VIs are made available.\nPlot polygon coordinate designations allow a re-intersection spatial analysis.\nData was collected in the 2013 season at Maricopa Agricultural Center, Arizona, USA.\nHigh throughput proximal plant phenotyping via electronic sampling and data processing method approach is exampled.\nAcquired data using USDA Maricopa first mobile platforms, such as the Proximal Sensing Cart Mark 1, where the first dual sliding arm configuration was deployed and platform clearance raised successfully as design improvements.\nSAS and GIS compute processing output tables, including Excel formatted examples are presented, where intermediate data tabulation and analysis is available.\nThe weekly proximal sensing data collected include canopy reflectance at six wavelengths, ultrasonic distance sensing of canopy height, and infrared thermometry. Lint and seed yields, first open boll biomass, and nitrogen uptake were also determined. Soil profile nitrate to 1.8 m depth was determined in 30-cm increments, before planting and after harvest. Nitrous oxide emissions were determined 20 or more weeks in the season with 1-L vented chambers (samples taken at 0, 12, and 24 minutes). Nitrous oxide was determined by gas chromatography (electron detection detector).
", "title": "The Bronson Files, Dataset 2, Field 17, 2013", "distribution": [ { "@type": "dcat:Distribution", "downloadURL": "https://ndownloader.figshare.com/files/44529809", "format": "csv", "mediaType": "application/csv", "title": "2013_F17_Data_Dictionary.csv" }, { "@type": "dcat:Distribution", "downloadURL": "https://ndownloader.figshare.com/files/44529812", "format": "csv", "mediaType": "text/plain", "title": "2013_F17_ActivitiesLog.csv" }, { "@type": "dcat:Distribution", "downloadURL": "https://ndownloader.figshare.com/files/44529815", "format": "xlsx", "mediaType": "application/vnd.openxmlformats-officedocument.spreadsheetml.sheet", "title": "2013_F17_Cotton_MegaTable.xlsx" }, { "@type": "dcat:Distribution", "downloadURL": "https://ndownloader.figshare.com/files/44529818", "format": "pdf", "mediaType": "application/pdf", "title": "2013_F17_Example_GIS_Map.pdf" }, { "@type": "dcat:Distribution", "downloadURL": "https://ndownloader.figshare.com/files/44529821", "format": "xlsx", "mediaType": "application/vnd.openxmlformats-officedocument.spreadsheetml.sheet", "title": "F017_2013_05_23_Cotton_SAS_Output.xlsx" }, { "@type": "dcat:Distribution", "downloadURL": "https://ndownloader.figshare.com/files/44529827", "format": "xlsx", "mediaType": "application/vnd.openxmlformats-officedocument.spreadsheetml.sheet", "title": "F017_2013_05_28_Cotton_SAS_GeoScoutOnly.xlsx" }, { "@type": "dcat:Distribution", "downloadURL": "https://ndownloader.figshare.com/files/44529830", "format": "xlsx", "mediaType": "application/vnd.openxmlformats-officedocument.spreadsheetml.sheet", "title": "F017_2013_06_04_Cotton_SAS_GeoScoutOnly.xlsx" }, { "@type": "dcat:Distribution", "downloadURL": "https://ndownloader.figshare.com/files/44529833", "format": "xlsx", "mediaType": "application/vnd.openxmlformats-officedocument.spreadsheetml.sheet", "title": "F017_2013_06_05_Cotton_SAS_GeoScoutOnly.xlsx" }, { "@type": "dcat:Distribution", "downloadURL": "https://ndownloader.figshare.com/files/44529836", "format": "xlsx", "mediaType": "application/vnd.openxmlformats-officedocument.spreadsheetml.sheet", "title": "F017_2013_06_14_Cotton_SAS_Output.xlsx" }, { "@type": "dcat:Distribution", "downloadURL": "https://ndownloader.figshare.com/files/44529839", "format": "xlsx", "mediaType": "application/vnd.openxmlformats-officedocument.spreadsheetml.sheet", "title": "F017_2013_06_19_Cotton_SAS_Output.xlsx" }, { "@type": "dcat:Distribution", "downloadURL": "https://ndownloader.figshare.com/files/44529842", "format": "xlsx", "mediaType": "application/vnd.openxmlformats-officedocument.spreadsheetml.sheet", "title": "F017_2013_06_26_Cotton_SAS_Output.xlsx" }, { "@type": "dcat:Distribution", "downloadURL": "https://ndownloader.figshare.com/files/44529845", "format": "xlsx", "mediaType": "application/vnd.openxmlformats-officedocument.spreadsheetml.sheet", "title": "F017_2013_07_09_Cotton_SAS_Output.xlsx" }, { "@type": "dcat:Distribution", "downloadURL": "https://ndownloader.figshare.com/files/44529851", "format": "xlsx", "mediaType": "application/vnd.openxmlformats-officedocument.spreadsheetml.sheet", "title": "F017_2013_07_19_Cotton_SAS_Output.xlsx" }, { "@type": "dcat:Distribution", "downloadURL": "https://ndownloader.figshare.com/files/44529854", "format": "xlsx", "mediaType": "application/vnd.openxmlformats-officedocument.spreadsheetml.sheet", "title": "F017_2013_07_25_Cotton_SAS_Output.xlsx" }, { "@type": "dcat:Distribution", "downloadURL": "https://ndownloader.figshare.com/files/44529857", "format": "xlsx", "mediaType": "application/vnd.openxmlformats-officedocument.spreadsheetml.sheet", "title": "F017_2013_08_05_Cotton_SAS_Output.xlsx" }, { "@type": "dcat:Distribution", "downloadURL": "https://ndownloader.figshare.com/files/44529860", "format": "xlsx", "mediaType": "application/vnd.openxmlformats-officedocument.spreadsheetml.sheet", "title": "F017_2013_08_19_Cotton_SAS_Output.xlsx" }, { "@type": "dcat:Distribution", "downloadURL": "https://ndownloader.figshare.com/files/44529863", "format": "csv", "mediaType": "text/plain", "title": "2013_F017_Plot_Coordinates.csv" }, { "@type": "dcat:Distribution", "downloadURL": "https://ndownloader.figshare.com/files/44529869", "format": "csv", "mediaType": "application/csv", "title": "F017_2013_05_23_HS_data.csv" }, { "@type": "dcat:Distribution", "downloadURL": "https://ndownloader.figshare.com/files/44529872", "format": "csv", "mediaType": "text/plain", "title": "F017_2013_05_28_HS_data.csv" }, { "@type": "dcat:Distribution", "downloadURL": "https://ndownloader.figshare.com/files/44529875", "format": "csv", "mediaType": "application/csv", "title": "F017_2013_06_04_HS_data.csv" }, { "@type": "dcat:Distribution", "downloadURL": "https://ndownloader.figshare.com/files/44529878", "format": "csv", "mediaType": "text/plain", "title": "F017_2013_06_05_HS_data.csv" }, { "@type": "dcat:Distribution", "downloadURL": "https://ndownloader.figshare.com/files/44529881", "format": "csv", "mediaType": "application/csv", "title": "F017_2013_06_14_HS_data.csv" }, { "@type": "dcat:Distribution", "downloadURL": "https://ndownloader.figshare.com/files/44529884", "format": "csv", "mediaType": "text/plain", "title": "F017_2013_06_19_HS_data.csv" }, { "@type": "dcat:Distribution", "downloadURL": "https://ndownloader.figshare.com/files/44529887", "format": "csv", "mediaType": "application/csv", "title": "F017_2013_06_26_HS_data.csv" }, { "@type": "dcat:Distribution", "downloadURL": "https://ndownloader.figshare.com/files/44529890", "format": "csv", "mediaType": "text/plain", "title": "F017_2013_07_09_HS_data.csv" }, { "@type": "dcat:Distribution", "downloadURL": "https://ndownloader.figshare.com/files/44529899", "format": "csv", "mediaType": "application/csv", "title": "F017_2013_07_19_HS_data.csv" }, { "@type": "dcat:Distribution", "downloadURL": "https://ndownloader.figshare.com/files/44529902", "format": "csv", "mediaType": "text/plain", "title": "F017_2013_07_25_HS_data.csv" }, { "@type": "dcat:Distribution", "downloadURL": "https://ndownloader.figshare.com/files/44529905", "format": "csv", "mediaType": "text/plain", "title": "F017_2013_08_05_HS_data.csv" }, { "@type": "dcat:Distribution", "downloadURL": "https://ndownloader.figshare.com/files/44529908", "format": "csv", "mediaType": "application/csv", "title": "F017_2013_08_19_HS_data.csv" }, { "@type": "dcat:Distribution", "downloadURL": "https://ndownloader.figshare.com/files/44529911", "format": "csv", "mediaType": "text/plain", "title": "F017_2013_05_23_CS_data.csv" }, { "@type": "dcat:Distribution", "downloadURL": "https://ndownloader.figshare.com/files/44529914", "format": "csv", "mediaType": "application/csv", "title": "F017_2013_06_14_CS_data.csv" }, { "@type": "dcat:Distribution", "downloadURL": "https://ndownloader.figshare.com/files/44529917", "format": "csv", "mediaType": "text/plain", "title": "F017_2013_06_19_CS_data.csv" }, { "@type": "dcat:Distribution", "downloadURL": "https://ndownloader.figshare.com/files/44529920", "format": "csv", "mediaType": "text/plain", "title": "F017_2013_06_26_CS_data.csv" }, { "@type": "dcat:Distribution", "downloadURL": "https://ndownloader.figshare.com/files/44529923", "format": "csv", "mediaType": "application/csv", "title": "F017_2013_07_09_CS_data.csv" }, { "@type": "dcat:Distribution", "downloadURL": "https://ndownloader.figshare.com/files/44529926", "format": "csv", "mediaType": "text/plain", "title": "F017_2013_07_19_CS_data.csv" }, { "@type": "dcat:Distribution", "downloadURL": "https://ndownloader.figshare.com/files/44529929", "format": "csv", "mediaType": "application/csv", "title": "F017_2013_07_25_CS_data.csv" }, { "@type": "dcat:Distribution", "downloadURL": "https://ndownloader.figshare.com/files/44529932", "format": "csv", "mediaType": "text/plain", "title": "F017_2013_08_05_CS_data.csv" }, { "@type": "dcat:Distribution", "downloadURL": "https://ndownloader.figshare.com/files/44529935", "format": "csv", "mediaType": "application/csv", "title": "F017_2013_08_19_CS_data.csv" }, { "@type": "dcat:Distribution", "downloadURL": "https://ndownloader.figshare.com/files/44529938", "format": "JPG", "mediaType": "image/jpeg", "title": "PSCM1_Field_17_2013 Cotton.JPG" }, { "@type": "dcat:Distribution", "downloadURL": "https://ndownloader.figshare.com/files/44529941", "format": "MOV", "mediaType": "video/quicktime", "title": "PSCM1_Field_17_2013 Cotton.MOV" }, { "@type": "dcat:Distribution", "downloadURL": "https://ndownloader.figshare.com/files/44529944", "format": "txt", "mediaType": "text/plain", "title": "README_The Bronson Files, Dataset 2, Field 17, 2013.txt" }, { "@type": "dcat:Distribution", "downloadURL": "https://ndownloader.figshare.com/files/44529947", "format": "txt", "mediaType": "text/plain", "title": "file_list_The Bronson Files, Dataset 2, Field, 17, 2013.txt" } ], "license": "https://www.usa.gov/publicdomain/label/1.0/", "bureauCode": [ "005:18" ], "modified": "2024-02-16", "publisher": { "@type": "org:Organization", "name": "Agricultural Research Service" }, "keyword": [ "EARTH SCIENCE > BIOSPHERE > VEGETATION > PLANT PHENOLOGY", "EARTH SCIENCE > AGRICULTURE > SOILS > NITROGEN", "Field-based high-throughput phenotyping", "plant phenotyping", "Agroecosystems & Environment Weather and Climate", "NP211", "data.gov", "ARS" ], "spatial": "{\"type\": \"Polygon\", \"coordinates\": [[[-111.97890043259, 33.080087064259], [-111.97890043259, 33.082424376658], [-111.97701215744, 33.082424376658], [-111.97701215744, 33.080087064259], [-111.97890043259, 33.080087064259]]]}" }, { "identifier": "10.15482/USDA.ADC/1523138", "accessLevel": "public", "contactPoint": { "hasEmail": "mailto:matthew.conley@usda.gov", "fn": "Conley, Matthew" }, "programCode": [ "005:040" ], "description": "Dr. Kevin Bronson provides a small area nitrogen and water management in Guayule agricultural research dataset for compute, including notation of field events and operations, an intermediate analysis table of correlated and calculated parameters with laboratory analysis results generated during the experimentation, plus high resolution plot level intermediate data analysis tables of SAS process output, as well as the complete raw sensor recorded logger outputs.
\nThis data was collected during the beginning time period of our USDA Maricopa terrestrial proximal high-throughput plant phenotyping tri-metric method generation, where a 5Hz crop canopy height, temperature and spectral signature are recorded coincident to indicate a plant health status. In this early development period, our Proximal Sensing Cart Mark1 (PSCM1) platform supplants people carrying the CropCircle (CC) sensors, and with an improved view mechanical performance result.
\nSummary:\nActive optical proximal cotton canopy sensing spatial data and including additional related metrics such as thermal are presented.\nAgronomic nitrogen and irrigation management related field operations are listed.\nUnique research experimentation intermediate analysis table is made available, along with raw data.\nThe raw data recordings, and annotated table outputs with calculated VIs are made available.\nPlot polygon coordinate designations allow a re-intersection spatial analysis.\nData was collected in the 2013 season at Maricopa Agricultural Center, Arizona, USA.\nHigh throughput proximal plant phenotyping via electronic sampling and data processing method approach is exampled.\nAcquired data using USDA Maricopa first mobile platforms, such as the Proximal Sensing Cart Mark 1, where the first dual sliding arm configuration was deployed and platform clearance raised successfully as design improvements.\nSAS and GIS compute processing output tables, including Excel formatted examples are presented, where intermediate data tabulation and analysis is available.\nThe weekly proximal sensing data collected include canopy reflectance at six wavelengths, ultrasonic distance sensing of canopy height, and infrared thermometry. Lint and seed yields, first open boll biomass, and nitrogen uptake were also determined. Soil profile nitrate to 1.8 m depth was determined in 30-cm increments, before planting and after harvest. Nitrous oxide emissions were determined 20 or more weeks in the season with 1-L vented chambers (samples taken at 0, 12, and 24 minutes). Nitrous oxide was determined by gas chromatography (electron detection detector).
", "title": "The Bronson Files, Dataset 3, Field 107, 2013", "distribution": [ { "@type": "dcat:Distribution", "downloadURL": "https://ndownloader.figshare.com/files/44530034", "format": "csv", "mediaType": "text/plain", "title": "F107_2013_Data_Dictionary.csv" }, { "@type": "dcat:Distribution", "downloadURL": "https://ndownloader.figshare.com/files/44530037", "format": "csv", "mediaType": "application/csv", "title": "Field_107_2013_Activities_Log.csv" }, { "@type": "dcat:Distribution", "downloadURL": "https://ndownloader.figshare.com/files/44530040", "format": "xlsx", "mediaType": "application/vnd.openxmlformats-officedocument.spreadsheetml.sheet", "title": "F107_2013_Guayule_Table.xlsx" }, { "@type": "dcat:Distribution", "downloadURL": "https://ndownloader.figshare.com/files/44530043", "format": "zip", "mediaType": "application/zip", "title": "F107_2013_Inter_files.zip" }, { "@type": "dcat:Distribution", "downloadURL": "https://ndownloader.figshare.com/files/44530046", "format": "csv", "mediaType": "application/csv", "title": "F107_2013_PlotCoordinates.csv" }, { "@type": "dcat:Distribution", "downloadURL": "https://ndownloader.figshare.com/files/44530049", "format": "zip", "mediaType": "application/zip", "title": "F107_2013_HS_data.zip" }, { "@type": "dcat:Distribution", "downloadURL": "https://ndownloader.figshare.com/files/44530052", "format": "zip", "mediaType": "application/zip", "title": "F107_2013_CS_data.zip" }, { "@type": "dcat:Distribution", "downloadURL": "https://ndownloader.figshare.com/files/44530055", "format": "JPG", "mediaType": "image/jpeg", "title": "P4102004a_R1.JPG" }, { "@type": "dcat:Distribution", "downloadURL": "https://ndownloader.figshare.com/files/44530058", "format": "txt", "mediaType": "text/plain", "title": "README_The Bronson Files, Dataset 3, Field 107, 2013.txt" }, { "@type": "dcat:Distribution", "downloadURL": "https://ndownloader.figshare.com/files/44530061", "format": "txt", "mediaType": "text/plain", "title": "file_list_The Bronson Files, Dataset 3, Field, 107, 2013.txt" } ], "license": "https://www.usa.gov/publicdomain/label/1.0/", "bureauCode": [ "005:18" ], "modified": "2024-02-16", "publisher": { "@type": "org:Organization", "name": "Agricultural Research Service" }, "keyword": [ "EARTH SCIENCE > BIOSPHERE > VEGETATION > PLANT PHENOLOGY", "EARTH SCIENCE > AGRICULTURE > SOILS > NITROGEN", "Field-based high-throughput phenotyping", "plant phenotyping", "Agroecosystems & Environment Weather and Climate", "NP211", "data.gov", "ARS" ], "spatial": "{\"type\": \"Polygon\", \"coordinates\": [[[-111.97890043259, 33.080087064259], [-111.97890043259, 33.082424376658], [-111.97701215744, 33.082424376658], [-111.97701215744, 33.080087064259], [-111.97890043259, 33.080087064259]]]}" }, { "identifier": "10.15482/USDA.ADC/1523339", "accessLevel": "public", "contactPoint": { "hasEmail": "mailto:matthew.conley@usda.gov", "fn": "Conley, Matthew" }, "programCode": [ "005:040" ], "description": "Dr. Kevin Bronson provides this unique nitrogen and water management in wheat agricultural research dataset for compute. Ten irrigation treatments from a linear sprinkler were combined with nitrogen treatments. This dataset includes notation of field events and operations, an intermediate analysis mega-table of correlated and calculated parameters, including laboratory analysis results generated during the experimentation, plus high resolution plot level intermediate data tables of SAS process output, as well as the complete raw sensors records and logger outputs.
\nThis data was collected during the beginning time period of our USDA Maricopa terrestrial proximal high-throughput plant phenotyping tri-metric method generation, where a 5Hz crop canopy height, temperature and spectral signature are recorded coincident to indicate a plant health status. In this early development period, our Proximal Sensing Cart Mark1 (PSCM1) platform supplants people carrying the CropCircle (CC) sensors, and with an improved view mechanical performance result.
\nSee included README file for operational details and further description of the measured data signals.
\nSummary:\nActive optical proximal wheat canopy sensing spatial data and including additional related metrics such as thermal are presented.\nAgronomic nitrogen and irrigation management related field operations are listed.\nUnique research experimentation intermediate analysis table is made available, along with raw data.\nThe raw data recordings, and annotated table outputs with calculated VIs are made available.\nPlot polygon coordinate designations allow a re-intersection spatial analysis.\nData was collected in the 2013 season at Maricopa Agricultural Center, Arizona, USA.\nHigh throughput proximal plant phenotyping via electronic sampling and data processing method approach is exampled.\nAcquired data using USDA Maricopa first mobile platforms, such as the Proximal Sensing Cart Mark 1, where the first cluster sensor bracket design and rickshaw inspired operator's handle were successfully employed.\nSAS and GIS compute processing output tables, including Excel formatted examples are presented, where intermediate data tabulation and analysis is available.\nThe weekly proximal sensing data collected include canopy reflectance at six wavelengths, ultrasonic distance sensing of canopy height, and infrared thermometry.
\nTen levels gradient irrigation application from linear move sprinkler system were applied.\nSoil physical texture and fertility chemistry results are available.\nYield and seed information is presented.
Dr. Kevin Bronson provides a second year of nitrogen and water management in wheat agricultural research dataset for compute. Ten irrigation treatments from a linear sprinkler were combined with nitrogen treatments. This dataset includes notation of field events and operations, an intermediate analysis mega-table of correlated and calculated parameters, including laboratory analysis results generated during the experimentation, plus high resolution plot level intermediate data tables of SAS process output, as well as the complete raw data sensor records and logger outputs.
\nThis proximal terrestrial high-throughput plant phenotyping data examples our early tri-metric field method, where a geo-referenced 5Hz crop canopy height, temperature and spectral signature are recorded coincident to indicate a plant health status. In this development period, our Proximal Sensing Cart Mark1 (PSCM1) platform suspends a single cluster of sensors on a dual sliding vertical placement armature.
\nSee included README file for operational details and further description of the measured data signals.
\nSummary:\nActive optical proximal wheat canopy sensing spatial data and including additional related metrics such as thermal are presented.\nAgronomic nitrogen and irrigation management related field operations are listed.\nUnique research experimentation intermediate analysis table is made available, along with raw data.\nThe raw data recordings, and annotated table outputs with calculated VIs are made available.\nPlot polygon coordinate designations allow a re-intersection spatial analysis.\nData was collected in the 2014 season at Maricopa Agricultural Center, Arizona, USA.\nHigh throughput proximal plant phenotyping via electronic sampling and data processing method approach is exampled.\nAcquired data using USDA Maricopa first mobile platforms, such as the Proximal Sensing Cart Mark 1, where the first cluster sensor bracket design and rickshaw inspired operator's handle were successfully employed.\nSAS and GIS compute processing output tables, including Excel formatted examples are presented, where intermediate data tabulation and analysis is available.\nThe weekly proximal sensing data collected include canopy reflectance at six wavelengths, ultrasonic distance sensing of canopy height, and infrared thermometry.
\nTen levels gradient irrigation application from linear move sprinkler system were applied.\nSoil physical texture and fertility chemistry results are available.\nDurum wheat data includes in-season biomass and plant N content, final total biomass, grain yield, grain nitrogen, and yellow berry assessment.
Dr. Kevin Bronson provides a unique nitrogen and water management in cotton agricultural research dataset for compute, including notation of field events and operations, an intermediate analysis mega-table of correlated and calculated parameters, and laboratory analysis results generated during the experimentation, plus high-resolution plot level intermediate data analysis tables of SAS process output, as well as the complete raw data sensor recorded logger outputs.
\nThis data was collected using a Hamby rig as a high-throughput proximal plant phenotyping platform.
\nThe Hamby 6000 rig\nEllis W. Chenault, & Allen F. Wiese. (1989). Construction of a High-Clearance Plot Sprayer. Weed Technology, 3(4), 659–662. http://www.jstor.org/stable/3987560
\nDr. Bronson modified an old high-clearance Hamby 6000 rig, adding a tank and pump with a rear boom, to perform precision liquid N applications. A Raven control unit with GPS supplied variable rate delivery options.
\nThe 12 volt Holland Scientific GeoScoutX data recorder and associated CropCircle ACS-470 sensors with GPS signal, was easy to mount and run on the vehicle as an attached rugged data acquisition module, and allowed the measuring of plants using custom proximal active optical reflectance sensing. The HS data logger was positioned near the operator, and sensors were positioned in front of the rig, on forward protruding armature attached to a hydraulic front boom assembly, facing downward in nadir view 1 m above the average canopy height. A 34-size class AGM battery sat under the operator and provided the data system electrical power supply.
\nData suffered reduced input from Conley. Although every effort was afforded to capture adequate quality across all metrics, experiment exterior considerations were such that canopy temperature data is absent, and canopy height is weak due to technical underperformance. Thankfully, reflectance data quality was maintained or improved through the implementation of new hardware by Bronson.
\nSee included README file for operational details and further description of the measured data signals.
\nSummary:\nActive optical proximal cotton canopy sensing spatial data and including few additional related metrics and weak low-frequency ultrasonic derived height are presented.\nAgronomic nitrogen and irrigation management related field operations are listed.\nUnique research experimentation intermediate analysis table is made available, along with raw data.\nThe raw data recordings, and annotated table outputs with calculated VIs are made available.\nPlot polygon coordinate designations allow a re-intersection spatial analysis.\nData was collected in the 2014 season at Maricopa Agricultural Center, Arizona, USA.\nHigh throughput proximal plant phenotyping via electronic sampling and data processing method approach is exampled using a modified high-clearance Hamby spray-rig.\nAcquired data conforms to location standard methodologies of the plant phenotyping.\nSAS and GIS compute processing output tables, including Excel formatted examples are presented, where data tabulation and analysis is available. Additional ultrasonic data signal explanation is offered as annotated time-series charts.\nThe weekly proximal sensing data collected include the primary canopy reflectance at six wavelengths. Lint and seed yields, first open boll biomass, and nitrogen uptake were also determined. Soil profile nitrate to 1.8 m depth was determined in 30-cm increments, before planting and after harvest. Nitrous oxide emissions were determined with 1-L vented chambers (samples taken at 0, 12, and 24 minutes). Nitrous oxide was determined by gas chromatography (electron detection detector).
", "title": "The Bronson Files, Dataset 6, Field 13, 2014", "distribution": [ { "@type": "dcat:Distribution", "downloadURL": "https://ndownloader.figshare.com/files/44530367", "format": "csv", "mediaType": "text/plain", "title": "F013_2014_Data_Dictionary_1.csv" }, { "@type": "dcat:Distribution", "downloadURL": "https://ndownloader.figshare.com/files/44530370", "format": "csv", "mediaType": "application/csv", "title": "F013_2014_Activies_Log.csv" }, { "@type": "dcat:Distribution", "downloadURL": "https://ndownloader.figshare.com/files/44530373", "format": "xlsx", "mediaType": "application/vnd.openxmlformats-officedocument.spreadsheetml.sheet", "title": "F013_2014_MegaTable.xlsx" }, { "@type": "dcat:Distribution", "downloadURL": "https://ndownloader.figshare.com/files/44530376", "format": "jpg", "mediaType": "image/jpeg", "title": "F013_2014_PlotsMap_Image.jpg" }, { "@type": "dcat:Distribution", "downloadURL": "https://ndownloader.figshare.com/files/44530379", "format": "zip", "mediaType": "application/zip", "title": "F013_2014_Inter Data.zip" }, { "@type": "dcat:Distribution", "downloadURL": "https://ndownloader.figshare.com/files/44530382", "format": "zip", "mediaType": "application/zip", "title": "F013_2014_HS Data.zip" }, { "@type": "dcat:Distribution", "downloadURL": "https://ndownloader.figshare.com/files/44530385", "format": "zip", "mediaType": "application/zip", "title": "F013_2014_CS Data.zip" }, { "@type": "dcat:Distribution", "downloadURL": "https://ndownloader.figshare.com/files/44530388", "format": "pdf", "mediaType": "application/pdf", "title": "F013_2014_Cotton.pdf" }, { "@type": "dcat:Distribution", "downloadURL": "https://ndownloader.figshare.com/files/44530391", "format": "zip", "mediaType": "application/zip", "title": "PlotCoordinates.zip" }, { "@type": "dcat:Distribution", "downloadURL": "https://ndownloader.figshare.com/files/44530394", "format": "xlsx", "mediaType": "application/vnd.openxmlformats-officedocument.spreadsheetml.sheet", "title": "F013_06_23_2014_Manual_Plant_Heights.xlsx" }, { "@type": "dcat:Distribution", "downloadURL": "https://ndownloader.figshare.com/files/44530397", "format": "txt", "mediaType": "text/plain", "title": "README_The Bronson Files, Dataset 6, Field 13, 2014.txt" }, { "@type": "dcat:Distribution", "downloadURL": "https://ndownloader.figshare.com/files/44530400", "format": "txt", "mediaType": "text/plain", "title": "file_list_The Bronson Files, Dataset 6, Field, 13, 2014.txt" } ], "license": "https://www.usa.gov/publicdomain/label/1.0/", "bureauCode": [ "005:18" ], "modified": "2024-02-16", "publisher": { "@type": "org:Organization", "name": "Agricultural Research Service" }, "keyword": [ "EARTH SCIENCE > BIOSPHERE > VEGETATION > PLANT PHENOLOGY", "EARTH SCIENCE > AGRICULTURE > SOILS > NITROGEN", "Field-based high-throughput phenotyping", "plant phenotyping", "Agroecosystems & Environment Weather and Climate", "NP211", "data.gov", "ARS" ], "spatial": "{\"type\": \"Polygon\", \"coordinates\": [[[-111.97890043259, 33.080087064259], [-111.97890043259, 33.082424376658], [-111.97701215744, 33.082424376658], [-111.97701215744, 33.080087064259], [-111.97890043259, 33.080087064259]]]}" }, { "identifier": "10.15482/USDA.ADC/1524303", "accessLevel": "public", "contactPoint": { "hasEmail": "mailto:matthew.conley@usda.gov", "fn": "Conley, Matthew" }, "programCode": [ "005:040" ], "description": "Dr. Kevin Bronson provides a second experiment year of Field 13 nitrogen and water management in cotton agricultural research data for compute, including notation of field events and operations, an intermediate analysis mega-table of correlated and calculated parameters, and laboratory analysis results generated during the experimentation, plus high-resolution plot level intermediate data analysis tables of SAS process output, as well as the complete raw data sensor recorded logger outputs.
\nThe reflectance data is good. There are some errors in the CS data.
\nSee included README file for operational details and further description of the measured data signals.
\nSummary:\nActive optical proximal cotton canopy sensing spatial data and including additional related metrics are presented.\nAgronomic nitrogen and irrigation management related field operations are listed.\nUnique research experimentation intermediate analysis table is made available, along with raw data.\nThe raw data recordings, and annotated table outputs with calculated VIs are made available.\nPlot polygon coordinate designations allow a re-intersection spatial analysis.\nData was collected in the 2015 cotton season at Maricopa Agricultural Center, Arizona, USA.\nHigh throughput proximal plant phenotyping via electronic sampling and data processing method approach is exampled using a modified high-clearance Hamby spray-rig.\nAcquired data conforms to location standard methodologies of the plant phenotyping.\nSAS and GIS compute processing output tables, including Excel formatted examples are presented, where data tabulation and analysis is available. Additional data illustration is offered as a report file with annotated time-series charts.\nThe weekly proximal sensing data collected include the primary canopy reflectance at six wavelengths. Lint and seed yields, first open boll biomass, and nitrogen uptake were also determined. Soil profile nitrate to 1.8 m depth was determined in 30-cm increments, before planting and after harvest. Nitrous oxide emissions were determined with 1-L vented chambers (samples taken at 0, 12, and 24 minutes). Nitrous oxide was determined by gas chromatography (electron detection detector).
", "title": "The Bronson Files, Dataset 7, Field 13, 2015", "distribution": [ { "@type": "dcat:Distribution", "downloadURL": "https://ndownloader.figshare.com/files/44530418", "format": "csv", "mediaType": "application/csv", "title": "F013_2015_Data_Dictionary.csv" }, { "@type": "dcat:Distribution", "downloadURL": "https://ndownloader.figshare.com/files/44530421", "format": "csv", "mediaType": "text/plain", "title": "F013_2015_Activities_Log.csv" }, { "@type": "dcat:Distribution", "downloadURL": "https://ndownloader.figshare.com/files/44530424", "format": "xlsx", "mediaType": "application/vnd.openxmlformats-officedocument.spreadsheetml.sheet", "title": "F013_2015_MegaTable.xlsx" }, { "@type": "dcat:Distribution", "downloadURL": "https://ndownloader.figshare.com/files/44530427", "format": "zip", "mediaType": "application/zip", "title": "F013_2015_Inter Data.zip" }, { "@type": "dcat:Distribution", "downloadURL": "https://ndownloader.figshare.com/files/44530430", "format": "zip", "mediaType": "application/zip", "title": "F013_2015_HS Data.zip" }, { "@type": "dcat:Distribution", "downloadURL": "https://ndownloader.figshare.com/files/44530433", "format": "zip", "mediaType": "application/zip", "title": "F013_2015_CS Data.zip" }, { "@type": "dcat:Distribution", "downloadURL": "https://ndownloader.figshare.com/files/44530436", "format": "pdf", "mediaType": "application/pdf", "title": "F013_2015_Cotton_Charts_Report.pdf" }, { "@type": "dcat:Distribution", "downloadURL": "https://ndownloader.figshare.com/files/44530439", "format": "xlsx", "mediaType": "application/vnd.openxmlformats-officedocument.spreadsheetml.sheet", "title": "F013_2015_Manual_Plant_Height.xlsx" }, { "@type": "dcat:Distribution", "downloadURL": "https://ndownloader.figshare.com/files/44530442", "format": "JPG", "mediaType": "image/jpeg", "title": "F013_2015_Hamby_In-Field_Image.JPG" }, { "@type": "dcat:Distribution", "downloadURL": "https://ndownloader.figshare.com/files/44530445", "format": "pdf", "mediaType": "application/pdf", "title": "F013_2015_MetaNotes.pdf" }, { "@type": "dcat:Distribution", "downloadURL": "https://ndownloader.figshare.com/files/44530472", "format": "txt", "mediaType": "text/plain", "title": "README_The Bronson Files, Dataset 7, Field 13, 2015.txt" }, { "@type": "dcat:Distribution", "downloadURL": "https://ndownloader.figshare.com/files/44530493", "format": "txt", "mediaType": "text/plain", "title": "file_list_The Bronson Files, Dataset 7, Field, 13, 2015.txt" } ], "license": "https://www.usa.gov/publicdomain/label/1.0/", "bureauCode": [ "005:18" ], "modified": "2024-02-16", "publisher": { "@type": "org:Organization", "name": "Agricultural Research Service" }, "keyword": [ "EARTH SCIENCE > BIOSPHERE > VEGETATION > PLANT PHENOLOGY", "EARTH SCIENCE > AGRICULTURE > SOILS > NITROGEN", "Field-based high-throughput phenotyping", "plant phenotyping", "Agroecosystems & Environment Weather and Climate", "NP211", "data.gov", "ARS" ], "spatial": "{\"type\": \"Polygon\", \"coordinates\": [[[-111.97890043259, 33.080087064259], [-111.97890043259, 33.082424376658], [-111.97701215744, 33.082424376658], [-111.97701215744, 33.080087064259], [-111.97890043259, 33.080087064259]]]}" }, { "identifier": "10.15482/USDA.ADC/1524800", "accessLevel": "public", "contactPoint": { "hasEmail": "mailto:matthew.conley@usda.gov", "fn": "Conley, Matthew" }, "programCode": [ "005:040" ], "description": "Dr. Kevin Bronson provides this dataset representing the first of three consecutive years of cotton and nitrogen management experimentation in Field 113. Included, is an intermediate analysis mega-table of correlated and calculated parameters, laboratory analysis results generated during the experimentation, plus high-resolution plot level intermediate data analysis tables of SAS process output, as well as the complete raw data sensor recorded logger outputs.
\nSee included README file for operational details and further description of the measured data signals.
\nSummary -\nActive optical proximal cotton canopy sensing spatial data and including additional related metrics are presented.\nAgronomic nitrogen and irrigation management related field operations are listed.\nUnique research experimentation intermediate analysis table is made available, along with raw data.\nThe raw data recordings, and annotated table outputs with calculated VIs are made available.\nPlot polygon coordinate designations allow a re-intersection spatial analysis.\nData was collected in the 2016 cotton season at Maricopa Agricultural Center, Arizona, USA.\nHigh throughput proximal plant phenotyping via electronic sampling and data processing method approach is exampled using a modified high-clearance Hamby spray-rig.\nAcquired data conforms to location standard methodologies of high-throughput plant phenotyping.\nThe weekly proximal sensing data collected include the primary canopy reflectance at six wavelengths. Lint and seed yields, first open boll biomass, and nitrogen uptake was also determined. Soil profile nitrate to 1.8 m depth was determined in 30-cm increments, before planting and after harvest. Nitrous oxide emissions were determined with 1-L vented chambers (samples taken at 0, 12, and 24 minutes). Nitrous oxide was determined by gas chromatography (electron detection detector).
", "title": "The Bronson Files, Dataset 8, Field 113, 2016", "distribution": [ { "@type": "dcat:Distribution", "downloadURL": "https://ndownloader.figshare.com/files/44530700", "format": "csv", "mediaType": "text/plain", "title": "F113_2016_Data_Dictionary.csv" }, { "@type": "dcat:Distribution", "downloadURL": "https://ndownloader.figshare.com/files/44530703", "format": "csv", "mediaType": "application/csv", "title": "F113_2016_Activities_Log.csv" }, { "@type": "dcat:Distribution", "downloadURL": "https://ndownloader.figshare.com/files/44530706", "format": "xlsx", "mediaType": "application/vnd.openxmlformats-officedocument.spreadsheetml.sheet", "title": "F113_2016_MegaTable.xlsx" }, { "@type": "dcat:Distribution", "downloadURL": "https://ndownloader.figshare.com/files/44530709", "format": "zip", "mediaType": "application/zip", "title": "F113_2016_Inter files.zip" }, { "@type": "dcat:Distribution", "downloadURL": "https://ndownloader.figshare.com/files/44530712", "format": "zip", "mediaType": "application/zip", "title": "F113_2016_HS data.zip" }, { "@type": "dcat:Distribution", "downloadURL": "https://ndownloader.figshare.com/files/44530715", "format": "zip", "mediaType": "application/zip", "title": "F113_2016_CS data.zip" }, { "@type": "dcat:Distribution", "downloadURL": "https://ndownloader.figshare.com/files/44530718", "format": "pdf", "mediaType": "application/pdf", "title": "F113_2016_maps.pdf" }, { "@type": "dcat:Distribution", "downloadURL": "https://ndownloader.figshare.com/files/44530724", "format": "txt", "mediaType": "text/plain", "title": "README_The Bronson Files, Dataset 8, Field 113, 2016.txt" }, { "@type": "dcat:Distribution", "downloadURL": "https://ndownloader.figshare.com/files/44530727", "format": "txt", "mediaType": "text/plain", "title": "file_list_The Bronson Files, Dataset 8, Field 113, 2016.txt" }, { "@type": "dcat:Distribution", "downloadURL": "https://ndownloader.figshare.com/files/45020524", "format": "xml", "mediaType": "text/plain", "conformsTo": "http://www.isotc211.org/2005/gmd", "title": "Metadata_BronsonFiles_ISO_1524800.xml" } ], "license": "https://www.usa.gov/publicdomain/label/1.0/", "bureauCode": [ "005:18" ], "modified": "2024-03-13", "publisher": { "@type": "org:Organization", "name": "Agricultural Research Service" }, "theme": [ "geospatial" ], "keyword": [ "EARTH SCIENCE > BIOSPHERE > VEGETATION > PLANT PHENOLOGY", "EARTH SCIENCE > AGRICULTURE > SOILS > NITROGEN", "Field-based high-throughput phenotyping", "plant phenotyping", "Agroecosystems & Environment Weather and Climate", "NP211", "theme:geospatial", "data.gov", "ARS" ], "spatial": "{\"type\": \"Polygon\", \"coordinates\": [[[-111.97890043259, 33.080087064259], [-111.97890043259, 33.082424376658], [-111.97701215744, 33.082424376658], [-111.97701215744, 33.080087064259], [-111.97890043259, 33.080087064259]]]}" }, { "identifier": "10.15482/USDA.ADC/1526358", "accessLevel": "public", "contactPoint": { "hasEmail": "mailto:matthew.conley@usda.gov", "fn": "Conley, Matthew" }, "programCode": [ "005:040" ], "description": "Dr. Kevin Bronson provides a dataset representing the second of three consecutive years of cotton and nitrogen management experimentation in Field 113. Included is an intermediate analysis mega-table of correlated and calculated parameters, laboratory analysis results generated during the experimentation, plus high-resolution plot level intermediate data analysis tables of SAS process output, as well as the complete raw data sensor recorded logger outputs.
\nSee included README file for operational details and further description of the measured data signals.
\nSummary -\nActive optical proximal cotton canopy sensing spatial data and including additional related metrics are presented.\nAgronomic nitrogen and irrigation management related field operations are listed.\nUnique research experimentation intermediate analysis table is made available, along with raw data.\nThe raw data recordings, and annotated table outputs with calculated VIs are made available.\nPlot polygon coordinate designations allow a re-intersection spatial analysis.\nData was collected in the 2017 cotton season at Maricopa Agricultural Center, Arizona, USA.\nHigh throughput proximal plant phenotyping via electronic sampling and data processing method approach is exampled using a modified high-clearance Hamby spray-rig.\nAcquired data conforms to location standard methodologies of high-throughput plant phenotyping.\nThe weekly proximal sensing data collected include the primary canopy reflectance at six wavelengths. Lint and seed yields, first open boll biomass, and nitrogen uptake was also determined. Soil profile nitrate to 1.8 m depth was determined in 30-cm increments, before planting and after harvest. Nitrous oxide emissions were determined with 1-L vented chambers (samples taken at 0, 12, and 24 minutes). Nitrous oxide was determined by gas chromatography (electron detection detector).
", "title": "The Bronson Files, Dataset 9, Field 113, 2017 Cotton", "distribution": [ { "@type": "dcat:Distribution", "downloadURL": "https://ndownloader.figshare.com/files/44531660", "format": "csv", "mediaType": "application/csv", "title": "F113_2017_Data_Dictionary.csv" }, { "@type": "dcat:Distribution", "downloadURL": "https://ndownloader.figshare.com/files/44531663", "format": "csv", "mediaType": "text/plain", "title": "F113_2017_ActivitiesLog.csv" }, { "@type": "dcat:Distribution", "downloadURL": "https://ndownloader.figshare.com/files/44531666", "format": "xlsx", "mediaType": "application/vnd.openxmlformats-officedocument.spreadsheetml.sheet", "title": "F113_2017_MegaTable.xlsx" }, { "@type": "dcat:Distribution", "downloadURL": "https://ndownloader.figshare.com/files/44531669", "format": "zip", "mediaType": "application/zip", "title": "F113_2017_Inter files.zip" }, { "@type": "dcat:Distribution", "downloadURL": "https://ndownloader.figshare.com/files/44531672", "format": "zip", "mediaType": "application/zip", "title": "F113_2017_HS data.zip" }, { "@type": "dcat:Distribution", "downloadURL": "https://ndownloader.figshare.com/files/44531675", "format": "zip", "mediaType": "application/zip", "title": "F113_2017_CS data.zip" }, { "@type": "dcat:Distribution", "downloadURL": "https://ndownloader.figshare.com/files/44531678", "format": "xlsx", "mediaType": "application/vnd.openxmlformats-officedocument.spreadsheetml.sheet", "title": "F113_2017_Manual_Plant_Heights.xlsx" }, { "@type": "dcat:Distribution", "downloadURL": "https://ndownloader.figshare.com/files/44531681", "format": "docx", "mediaType": "application/vnd.openxmlformats-officedocument.wordprocessingml.document", "title": "Operation Note F113 2017_05_30 Run6.docx" }, { "@type": "dcat:Distribution", "downloadURL": "https://ndownloader.figshare.com/files/44531684", "format": "txt", "mediaType": "text/plain", "title": "README_The Bronson Files, Dataset 9, Field 113, 2017 Cotton.txt" }, { "@type": "dcat:Distribution", "downloadURL": "https://ndownloader.figshare.com/files/44531687", "format": "txt", "mediaType": "text/plain", "title": "file_list_The Bronson Files, Dataset 9, Field 113, 2017 Cotton.txt" } ], "license": "https://www.usa.gov/publicdomain/label/1.0/", "bureauCode": [ "005:18" ], "modified": "2024-02-21", "publisher": { "@type": "org:Organization", "name": "Agricultural Research Service" }, "keyword": [ "EARTH SCIENCE > BIOSPHERE > VEGETATION > PLANT PHENOLOGY", "EARTH SCIENCE > AGRICULTURE > SOILS > NITROGEN", "Field-based high-throughput phenotyping", "plant phenotyping", "Agroecosystems & Environment Weather and Climate", "NP211", "data.gov", "ARS" ], "spatial": "{\"type\": \"Polygon\", \"coordinates\": [[[-111.97890043259, 33.080087064259], [-111.97890043259, 33.082424376658], [-111.97701215744, 33.082424376658], [-111.97701215744, 33.080087064259], [-111.97890043259, 33.080087064259]]]}" }, { "identifier": "10.15482/USDA.ADC/1526317", "accessLevel": "public", "contactPoint": { "hasEmail": "mailto:steve.evett@usda.gov", "fn": "Evett, Steven R." }, "programCode": [ "005:040" ], "description": "This parent dataset (collection of datasets) describes the general organization of data in the datasets for each growing season (year) when maize (Zea mays, L., also known as corn in the United States) was grown for grain at the USDA-ARS Conservation and Production Laboratory (CPRL), Soil and Water Management Research Unit (SWMRU), Bushland, Texas (Lat. 35.186714°, Long. -102.094189°, elevation 1170 m above MSL). Maize was grown for grain on between two and four large, precision weighing lysimeters, each in the center of a 4.44 ha square field. The four fields were contiguous and arranged in four quadrants, which were labeled northeast (NE), southeast (SE), northwest (NW), and southwest (SW). See the resource titled \"Geographic Coordinates, USDA, ARS, Bushland, Texas\" for UTM geographic coordinates for field and lysimeter locations. Maize was grown on only the NE and SE fields in 1989 and 1990, and on all four fields in 1994, 2013, 2016, and 2018. Irrigation was by linear move sprinkler system in 1989, 1990, and 1994, although the system was equipped with various application technologies such as high-pressure impact sprinklers, low pressure spray applications, and low energy precision applicators (LEPA). In 2013, 2016, and 2018, two lysimeters and their respective fields were irrigated using subsurface drip irrigation (SDI), and two lysimeters and their respective fields were irrigated by a linear move sprinkler system equipped with spray applicators. Irrigations were managed to replenish soil water used by the crop on a weekly or more frequent basis as determined by soil profile water content readings made with a neutron probe from 0.10- to 2.4-m depth in the field. The number and spacing of neutron probe reading locations changed through the years (additional sites were added), which is one reason why subsidiary datasets and data dictionaries are needed. The lysimeters and fields were planted to the same plant density, row spacing, tillage depth (by hand on the lysimeters and by machine in the fields), and fertilizer and pesticide applications. The weighing lysimeters were used to measure relative soil water storage to 0.05 mm accuracy at 5-minute intervals, and the 5-minute change in soil water storage was used along with precipitation, dew and frost accumulation, and irrigation amounts to calculate crop evapotranspiration (ET), which is reported at 15-minute intervals. Each lysimeter was equipped with a suite of instruments to sense wind speed, air temperature and humidity, radiant energy (incoming and reflected, typically both shortwave and longwave), surface temperature, soil heat flux, and soil temperature, all of which are reported at 15-minute intervals. Instruments used changed from season to season, which is another reason that subsidiary datasets and data dictionaries for each season are required.
Important conventions concerning the data-time correspondence, sign conventions, and terminology specific to the USDA ARS, Bushland, TX, field operations are given in the resource titled \"Conventions for Bushland, TX, Weighing Lysimeter Datasets\".
There are six datasets in this collection. Common symbols and abbreviations used in the datasets are defined in the resource titled, \"Symbols and Abbreviations for Bushland, TX, Weighing Lysimeter Datasets\". Datasets consist of Excel (xlsx) files. Each xlsx file contains an Introductory tab that explains the other tabs, lists the authors, describes conventions and symbols used and lists any instruments used. The remaining tabs in a file consist of dictionary and data tabs. There is a dictionary tab for every data tab. The name of the dictionary tab contains the name of the corresponding data tab. Tab names are unique so that if individual tabs were saved to CSV files, each CSV file in the entire collection would have a different name. The six datasets, according to their titles, are as follows:
See the README for descriptions of each dataset.
The land slope is <1% and topography is flat. The mean annual precipitation is ~470 mm, the 20-year pan evaporation record indicates ~2,600 mm Class A pan evaporation per year, and winds are typically from the South and Southwest. The climate is semi-arid with ~70% (350 mm) of the annual precipitation occurring from May to September, during which period the pan evaporation averages ~1520 mm.
These datasets originate from research aimed at determining crop water use (ET), crop coefficients for use in ET-based irrigation scheduling based on a reference ET, crop growth, yield, harvest index, and crop water productivity as affected by irrigation method, timing, amount (full or some degree of deficit), agronomic practices, cultivar, and weather. Prior publications have described the facilities and research methods, and have focused on maize ET, crop coefficients, and crop water productivity. Crop coefficients have been used by ET networks for irrigation management. The data have utility for testing simulation models of crop ET, growth, and yield and have been used by the Agricultural Model Intercomparison and Improvement Project (AgMIP), by OPENET, and by many others for testing, and calibrating models of ET that use satellite and/or weather data.
Resources in this dataset:
This parent dataset (collection of datasets) describes the general organization of data in the datasets for the 1995, 2003, 2004, 2010 and 2019 growing seasons (years) when soybean [Glycine max (L.) Merr.] was grown for seed grain at the USDA-ARS Conservation and Production Laboratory (CPRL), Soil and Water Management Research Unit (SWMRU), Bushland, Texas (Lat. 35.186714°, Long. -102.094189°, elevation 1170 m above MSL). In 1995, 2003, 2004, and 2010, soybean was grown for seed grain on two large, precision weighing lysimeters, each in the center of a 4.44 ha square field also seeded to soybean. The two fields were contiguous, arranged along a north-south axis, and were labeled northeast (NE), and southeast (SE). In 2019, soybean was grown on four large, precision weighing lysimeters, and on the 4.44 ha square fields surrounding each lysimeter, which were contiguous and labeled NE, SE, and northwest (NW), and southwest (SW). See the resource titled \"Geographic Coordinates, USDA, ARS, Bushland, Texas\" for UTM geographic coordinates for field and lysimeter locations. In 1995, 2003, 2004, and 2010, the fields were irrigated by a linear move sprinkler system equipped with mid elevation spray applicators (MESA). In 2019, the NW and SW fields were irrigated with the linear move sprinkler system equipped with low elevation spray applicators (LESA), while the NE and SE lysimeters and fields were irrigated by subsurface drip irrigation (SDI) with drip tape spaced at 1.52 m in the middle of every other interrow and buried at 0.30 to 0.32 m. Both full and deficit irrigations were applied to fields in 1995, 2003, and 2004. The 2010 crop was grown as a dryland crop with no irrigation other than an initial irrigation to establish the crop. In 2019, full irrigation was applied to all four lysimeters and fields. Except for 2010 and 2019, irrigations on a least one lysimeter were managed to replenish soil water used by the crop on a weekly or more frequent basis as determined by soil profile water content readings made with a neutron probe from 0.10- to 2.4-m depth in the field. The number and spacing of neutron probe reading locations changed through the years (additional sites were added), which is one reason why subsidiary datasets and data dictionaries are needed. The lysimeters and fields were planted to the same plant density, row spacing, tillage depth (by hand on the lysimeters and by machine in the fields), and fertilizer and pesticide applications. The weighing lysimeters were used to measure relative soil water storage to 0.05 mm accuracy at 5-minute intervals, and the 5-minute change in soil water storage was used along with precipitation, dew and frost accumulation, and irrigation amounts to calculate crop evapotranspiration (ET), which is reported at 15-minute intervals. Each lysimeter was equipped with a suite of instruments to sense wind speed, air temperature and humidity, radiant energy (incoming and reflected, typically both shortwave and longwave), surface temperature, soil heat flux, and soil temperature, all of which are reported at 15-minute intervals. Instruments used changed from season to season, which is another reason that subsidiary datasets and data dictionaries for each season are required.
\nImportant conventions concerning the data-time correspondence, sign conventions, and terminology specific to the USDA ARS, Bushland, TX, field operations are given in the resource titled \"Conventions for Bushland, TX, Weighing Lysimeter Datasets\".
\nThere are six datasets in this collection. Common symbols and abbreviations used in the datasets are defined in the resource titled, \"Symbols and Abbreviations for Bushland, TX, Weighing Lysimeter Datasets\". Datasets consist of Excel (xlsx) files. Each xlsx file contains an Introductory tab that explains the other tabs, lists the authors, describes conventions and symbols used and lists any instruments used. The remaining tabs in a file consist of dictionary and data tabs. There is a dictionary tab for every data tab. The name of the dictionary tab contains the name of the corresponding data tab. Tab names are unique so that if individual tabs were saved to CSV files, each CSV file in the entire collection would have a different name. The six datasets, according to their titles, are as follows:
\nSee the README for descriptions of each dataset.
\nThe soil is a Pullman series fine, mixed, superactive, thermic Torrertic Paleustoll. Soil properties are given in the resource titled \"Soil Properties for the Bushland, TX, Weighing Lysimeter Datasets\". The land slope is <1% and topography is flat. The mean annual precipitation is ~470 mm, the 20-year pan evaporation record indicates ~2,600 mm Class A pan evaporation per year, and winds are typically from the South and Southwest. The climate is semi-arid with ~70% (350 mm) of the annual precipitation occurring from May to September, during which period the pan evaporation averages ~1520 mm.
\nThese datasets originate from research aimed at determining crop water use (ET), crop coefficients for use in ET-based irrigation scheduling based on a reference ET, crop growth, yield, harvest index, and crop water productivity as affected by irrigation method, timing, amount (full or some degree of deficit), agronomic practices, cultivar, and weather. Prior publications have described the facilities and research methods, and have focused on ET, crop coefficients, and crop water productivity. Crop coefficients have been used by ET networks for irrigation management. The data have utility for testing simulation models of crop ET, growth, and yield.
\nResources in this dataset:
\nThis parent dataset (collection of datasets) describes the general organization of data in the datasets for the 2009 and 2011 growing seasons (year) when sunflower (Helianthus annuus L.) was grown for seed grain at the USDA-ARS Conservation and Production Laboratory (CPRL), Soil and Water Management Research Unit (SWMRU), Bushland, Texas (Lat. 35.186714°, Long. -102.094189°, elevation 1170 m above MSL). Sunflower was grown for seed grain on two large, precision weighing lysimeters, each in the center of a 4.44 ha square field. The two fields were contiguous, arranged along a north-south axis, and were labeled northeast (NE), and southeast (SE). See the resource titled \"Geographic Coordinates, USDA, ARS, Bushland, Texas\" for UTM geographic coordinates for field and lysimeter locations. The fields were irrigated by a linear move sprinkler system equipped with spray applicators. Irrigations were managed to replenish soil water used by the crop on a weekly or more frequent basis as determined by soil profile water content readings made with a neutron probe from 0.10- to 2.4-m depth in the field. The number and spacing of neutron probe reading locations changed through the years (additional sites were added), which is one reason why subsidiary datasets and data dictionaries are needed. The lysimeters and fields were planted to the same plant density, row spacing, tillage depth (by hand on the lysimeters and by machine in the fields), and fertilizer and pesticide applications. The weighing lysimeters were used to measure relative soil water storage to 0.05 mm accuracy at 5-minute intervals, and the 5-minute change in soil water storage was used along with precipitation, dew and frost accumulation, and irrigation amounts to calculate crop evapotranspiration (ET), which is reported at 15-minute intervals. Each lysimeter was equipped with a suite of instruments to sense wind speed, air temperature and humidity, radiant energy (incoming and reflected, typically both shortwave and longwave), surface temperature, soil heat flux, and soil temperature, all of which are reported at 15-minute intervals. Instruments used changed from season to season, which is another reason that subsidiary datasets and data dictionaries for each season are required.
\nImportant conventions concerning the data-time correspondence, sign conventions, and terminology specific to the USDA ARS, Bushland, TX, field operations are given in the resource titled \"Conventions for Bushland, TX, Weighing Lysimeter Datasets\".
\nThere are six datasets in this collection. Common symbols and abbreviations used in the datasets are defined in the resource titled, \"Symbols and Abbreviations for Bushland, TX, Weighing Lysimeter Datasets\". Datasets consist of Excel (xlsx) files. Each xlsx file contains an Introductory tab that explains the other tabs, lists the authors, describes conventions and symbols used and lists any instruments used. The remaining tabs in a file consist of dictionary and data tabs. There is a dictionary tab for every data tab. The name of the dictionary tab contains the name of the corresponding data tab. Tab names are unique so that if individual tabs were saved to CSV files, each CSV file in the entire collection would have a different name. The six datasets, according to their titles, are as follows:
\nSee the README for descriptions of each dataset.
\nThe land slope is <1% and topography is flat. The mean annual precipitation is ~470 mm, the 20-year pan evaporation record indicates ~2,600 mm Class A pan evaporation per year, and winds are typically from the South and Southwest. The climate is semi-arid with ~70% (350 mm) of the annual precipitation occurring from May to September, during which period the pan evaporation averages ~1520 mm.
\nThese datasets originate from research aimed at determining crop water use (ET), crop coefficients for use in ET-based irrigation scheduling based on a reference ET, crop growth, yield, harvest index, and crop water productivity as affected by irrigation method, timing, amount (full or some degree of deficit), agronomic practices, cultivar, and weather. Prior publications have described the facilities and research methods, and have focused on ET, crop coefficients, and crop water productivity. Crop coefficients have been used by ET networks for irrigation management. The data have utility for testing simulation models of crop ET, growth, and yield.
\nResources in this dataset:
\nResource Title: Geographic Coordinates of Experimental Assets, Weighing Lysimeter Experiments, USDA, ARS, Bushland, Texas.\nFile Name: Geographic Coordinates, USDA, ARS, Bushland, Texas.xlsx.\nResource Description: The file gives the UTM latitude and longitude of important experimental assets of the Bushland, Texas, USDA, ARS, Conservation & Production Research Laboratory (CPRL). Locations include weather stations [Soil and Water Management Research Unit (SWMRU) and CPRL], large weighing lysimeters, and corners of fields within which each lysimeter was centered. There were four fields designated NE, SE, NW, and SW, and a weighing lysimeter was centered in each field. The SWMRU weather station was adjacent to and immediately east of the NE and SE lysimeter fields.
\nResource Title: Conventions for Bushland, TX, Weighing Lysimeter Datasets.\nFile Name: Conventions for Bushland, TX, Weighing Lysimeter Datasets.xlsx.\nResource Description: Descriptions of conventions and terminology used in the Bushland, TX, weighing lysimeter research program.
\nResource Title: Symbols and Abbreviations for Bushland, TX, Weighing Lysimeter Datasets.\nFile Name: Symbols and Abbreviations for Bushland, TX, Weighing Lysimeter Datasets.xlsx.\nResource Description: Definitions of symbols and abbreviations used in the Bushland, TX, weighing lysimeter research datasets.
\nResource Title: README - Bushland Texas Sunflower collection.\nFile Name: README_Bushland_sunflower_collection.pdf.\nResource Description: Descriptions of the datasets in the Bushland Texas Sunflower collection.
\nThis parent dataset (collection of datasets) describes the general organization of data in the datasets for each growing season (year) when alfalfa (Medicago sativa L.) was grown as a reference evapotranspiration (ETr) crop at the USDA-ARS Conservation and Production Laboratory (CPRL), Soil and Water Management Research Unit (SWMRU), Bushland, Texas (Lat. 35.186714°, Long. -102.094189°, elevation 1170 m above MSL). Alfalfa was grown on two large, precision weighing lysimeters, calibrated to NIST standards (Howell et al., 1995). Each lysimeter was in the center of a 4.44 ha square field on which alfalfa was also grown (Evett et al., 2000). The two fields were contiguous and arranged with one (labeled northeast, NE) directly north of the other (labeled southeast, SE). See the resource \"Geographic Coordinates, USDA, ARS, Bushland, Texas\" for UTM geographic coordinates for field and lysimeter locations. Alfalfa was planted in Autumn 1995 and grown for hay in 1996, 1997, 1998, and 1999. The resource \"Agronomic Calendar for the Bushland, Texas Alfalfa Datasets\", gives a calendar listing by date the agronomic practices applied, severe weather, and activities (e.g. planting, thinning, fertilization, pesticide application, lysimeter maintenance, harvest) in and on lysimeters that could influence crop growth, water use, and lysimeter data. These include fertilizer and pesticide applications. There is one calendar, from before planting in autumn 1995 to after final harvest in 1999, for the NE and SE lysimeters and fields. There were 4 harvests each year except 1998 when 5 harvests were taken. Irrigation was by linear move sprinkler system equipped with pressure regulated low pressure sprays (mid-elevation spray application, MESA). Irrigations were managed to replenish soil water used by the crop on a weekly or more frequent basis as determined by soil profile water content readings via field-calibrated (Evett and Steiner, 1995) neutron probe from 0.10- to 2.4-m depth in the field. Lysimeters and fields were planted to the same plant density, row spacing, tillage depth (by hand on the lysimeters and by machine in the fields), and fertilizer and pesticide applications. Weighing lysimeters measured relative soil water storage to 0.05 mm accuracy at 5-min intervals, and the 5-min change in soil water storage was used along with precipitation, dew and frost accumulation, and irrigation amounts to calculate crop evapotranspiration (ET), reported at 15-min intervals. Each lysimeter was instrumented to sense wind speed, air temperature and humidity, radiant energy (incoming and reflected, typically both shortwave and longwave), surface temperature, soil heat flux, and soil temperature, all at 15-min intervals. Instruments used changed from season to season, thus subsidiary datasets and data dictionaries for each season are required. The Bushland weighing lysimeter research program is described by Evett et al. (2016), and lysimeter design is described by Marek et al. (1988). Important conventions concerning the data-time correspondence, sign conventions, and terminology specific to the USDA ARS, Bushland, TX, field operations are given in the resource \"Conventions for Bushland, TX, Weighing Lysimeter Datasets\".
\nThere are 5 datasets in this collection. Common symbols and abbreviations used are defined in the resource \"Symbols and Abbreviations for Bushland, TX, Weighing Lysimeter Datasets\". Datasets consist of Excel (xlsx) files. Each xlsx file contains an Introductory tab that explains the other tabs, lists the authors, describes conventions and symbols used, and lists instruments used. The remaining tabs in a file consist of dictionary and data tabs. The 5 datasets are:
\nSee README for descriptions of each dataset.
\nThe soil is a Pullman series fine, mixed, superactive, thermic Torrertic Paleustoll. Soil properties are given in the resource titled \"Soil Properties for the Bushland, TX, Weighing Lysimeter Datasets\". Land slope in the lysimeter fields is <0.3% and topography is flat. Mean annual precipitation is ~470 mm, the 20-year pan evaporation record indicates ~2,600 mm Class A pan evaporation per year, and winds are typically from the South and Southwest. Climate is semi-arid with ~70% (350 mm) of the annual precipitation occurring from May to Sep, during which period the pan evaporation averages ~1520 mm. These datasets originate from research on crop water use (ET), reference ET methods for irrigation scheduling, crop coefficients for use in ET-based irrigation scheduling based on a reference ET, crop growth, yield, harvest index, and crop water productivity as affected by irrigation method, timing, amount (full or some degree of deficit), agronomic practices, cultivar, and weather. Prior publications have described the facilities and research methods (Evett et al., 2016), and have focused on alfalfa ET (Todd et al., 1998), the Bowen ratio method applied to alfalfa ET (Todd et al., 2000), comparison of alfalfa ET to ETr calculated from weather data (Evett et al., 1998, 2000), new methods of calculating ETr (Evett et al., 2010, 2012; Lascano and Evett, 2007, 2010; Lascano et al, 2010), and crop water productivity. Crop coefficients (Howell et al., 2006) have been used by ET networks for irrigation management. The data have utility for testing simulation models of crop ET (Colaizzi et al., 2005; Thorp et al., 2019), growth, and yield by several universities and for testing, and calibrating models of ET that use satellite and/or weather data.
\nResources in this dataset:
\nResource Title: Geographic Coordinates of Experimental Assets, Weighing Lysimeter Experiments, USDA, ARS, Bushland, Texas.\nFile Name: Geographic Coordinates, USDA, ARS, Bushland, Texas.xlsx\nResource Description: The file gives the UTM latitude and longitude of important experimental assets of the CPRL. Locations include weather stations (SWMRU and CPRL), large weighing lysimeters, and corners of fields within which each lysimeter was centered. There were four fields designated NE, SE, NW, and SW, and a weighing lysimeter was centered in each field. The SWMRU weather station was adjacent to and immediately east of the NE and SE lysimeter fields.
\nResource Title: Conventions for Bushland, TX, Weighing Lysimeter Datasets.\nFile Name: Conventions for Bushland, TX, Weighing Lysimeter Datasets.xlsx\nResource Description: Descriptions of conventions and terminology used in the Bushland, TX, weighing lysimeter research program.
\nResource Title: Symbols and Abbreviations for Bushland, TX, Weighing Lysimeter Datasets.\nFile Name: Symbols and Abbreviations for Bushland, TX, Weighing Lysimeter Datasets.xlsx\nResource Description: Definitions of symbols and abbreviations used in the Bushland, TX, weighing lysimeter research datasets.
\nResource Title: Agronomic Calendar for the Bushland, Texas Alfalfa Datasets.\nFile Name: 1995-1999 Alfalfa Calendar.xlsx\nResource Description: The calendar lists by date the agronomic practices applied, severe weather, and activities (e.g., planting, thinning, fertilization, pesticide application, lysimeter maintenance, harvest) in and on lysimeters that could influence crop growth, water use, and lysimeter data. These include fertilizer and pesticide applications. There is one calendar, from before planting in autumn 1995 to after final harvest in 1999, for the NE and SE lysimeters and fields.
\nResource Title: Soil Properties for the Bushland, TX, Weighing Lysimeter Datasets.\nFile Name: Bushland_TX_soil_properties.xlsx\nResource Description: Soil properties useful for simulation modeling and describing the soil are given for the Pullman soil series at the CPRL. For each soil layer, soil horizon designation and texture according to USDA Soil Taxonomy, bulk density, porosity, water content at field capacity (33 kPa) and permanent wilting point (1500 kPa), percent sand, percent silt, percent clay, percent organic matter, pH, and van Genuchten-Mualem characteristic curve parameters describing the soil hydraulic properties are given. A separate table describes the soil horizon thicknesses, designations, and textures according to USDA Soil Taxonomy. Another table describes important aspects of the soil hydrology and rooting behavior.
\nResource Title: README - Bushland Texas Alfalfa collection.\nFile Name: README_Bushland_alfalfa_collection.pdf\nResource Description: Descriptions of the datasets in the Bushland Texas Alfalfa collection.
\nThis parent dataset (collection of datasets) describes the general organization of data in the datasets for each growing season (two-year period) when winter wheat (Triticum aestivum L.) was grown for grain at the USDA-ARS Conservation and Production Laboratory (CPRL), Soil and Water Management Research Unit (SWMRU), Bushland, Texas (Lat. 35.186714°, Long. -102.094189°, elevation 1170 m above MSL). Winter wheat was grown on two large, precision weighing lysimeters, calibrated to NIST standards (Howell et al., 1995). Each lysimeter was in the center of a 4.44 ha square field on which wheat was also grown (Evett et al., 2000). The two fields were contiguous and arranged with one directly north of the other. See the resource titled \"Geographic Coordinates, USDA, ARS, Bushland, Texas\" for UTM geographic coordinates for field and lysimeter locations. Wheat was planted in Autumn and grown over the winter in 1989-1990, 1991-1992, and 1992-1993. Agronomic calendar for the each of the three growing seasons list by date the agronomic practices applied, severe weather, and activities (e.g., planting, thinning, fertilization, pesticide application, lysimeter maintenance, harvest) in and on lysimeters that could influence crop growth, water use, and lysimeter data. These include fertilizer and pesticide applications. Irrigation was by linear move sprinkler system equipped with pressure regulated low pressure sprays (mid-elevation spray application, MESA). Irrigations were managed to replenish soil water used by the crop on a weekly or more frequent basis as determined by soil profile water content readings made with a field-calibrated (Evett and Steiner, 1995) neutron probe from 0.10- to 2.4-m depth in the field. The lysimeters and fields were planted to the same plant density, row spacing, tillage depth (by hand on the lysimeters and by machine in the fields), and fertilizer and pesticide applications. The weighing lysimeters were used to measure relative soil water storage to 0.05 mm accuracy at 5-min intervals, and the 5-min change in soil water storage was used along with precipitation, dew and frost accumulation, and irrigation amounts to calculate crop evapotranspiration (ET), which is reported at 15-min intervals. Each lysimeter was equipped with a suite of instruments to sense wind speed, air temperature and humidity, radiant energy (incoming and reflected, typically both shortwave and longwave), surface temperature, soil heat flux, and soil temperature, all of which are reported at 15-min intervals. Instruments used changed from season to season, which is another reason that subsidiary datasets and data dictionaries for each season are required. The Bushland weighing lysimeter research program was described by Evett et al. (2016), and lysimeter design is described by Marek et al. (1988). Important conventions concerning the data-time correspondence, sign conventions, and terminology specific to the USDA ARS, Bushland, TX, field operations are given in the resource titled \"Conventions for Bushland, TX, Weighing Lysimeter Datasets\".
\nThere are six datasets in this collection. Common symbols and abbreviations used in the datasets are defined in the resource titled, \"Symbols and Abbreviations for Bushland, TX, Weighing Lysimeter Datasets\". Datasets consist of Excel (xlsx) files. Each xlsx file contains an Introductory tab that explains the other tabs, lists the authors, describes conventions and symbols used and lists any instruments used. The remaining tabs in a file consist of dictionary and data tabs. The six datasets are as follows:
\nAgronomic Calendars for the Bushland, Texas Winter Wheat Datasets
\nGrowth and Yield Data for the Bushland, Texas Winter Wheat Datasets
\nWeighing Lysimeter Data for The Bushland, Texas Winter Wheat Datasets
\nSoil Water Content Data for The Bushland, Texas, Large Weighing Lysimeter Experiments
\nStandard Quality Controlled Research Weather Data – USDA-ARS, Bushland, Texas
\nSee the README for descriptions of each dataset.
\nThe soil is a Pullman series fine, mixed, superactive, thermic Torrertic Paleustoll. Soil properties are given in the resource titled \"Soil Properties for the Bushland, TX, Weighing Lysimeter Datasets\". The land slope in the lysimeter fields is <0.3% and topography is flat. The mean annual precipitation is ~470 mm, the 20-year pan evaporation record indicates ~2,600 mm Class A pan evaporation per year, and winds are typically from the South and Southwest. The climate is semi-arid with ~70% (350 mm) of the annual precipitation occurring from May to September, during which period the pan evaporation averages ~1520 mm.\nThese datasets originate from research aimed at determining crop water use (ET), crop coefficients for use in ET-based irrigation scheduling based on a reference ET, crop growth, yield, harvest index, and crop water productivity as affected by irrigation method, timing, amount (full or some degree of deficit), agronomic practices, cultivar, and weather. Prior publications have described the facilities and research methods (Evett et al., 2016), and have focused on winter wheat ET (Howell et al., 1995, 1997, 1998), and crop coefficients (Howell et al., 2006; Schneider and Howell, 1997, 2001) that have been used by ET networks for irrigation management. The data have utility for developing, calibrating, and testing simulation models of crop ET, growth, and yield (Evett et al., 1994; Kang et al., 2009), and have been used by several universities and for testing, and calibrating models of ET that use satellite and/or weather data.
\nResources in this dataset:
\nResource Title: Geographic Coordinates of Experimental Assets, Weighing Lysimeter Experiments, USDA, ARS, Bushland, Texas.\nFile Name: Geographic Coordinates, USDA, ARS, Bushland, Texas.xlsx.\nResource Description: The file gives the UTM latitude and longitude of important experimental assets of the Bushland, Texas, USDA, ARS, Conservation & Production Research Laboratory (CPRL). Locations include weather stations [Soil and Water Management Research Unit (SWMRU) and CPRL], large weighing lysimeters, and corners of fields within which each lysimeter was centered. There were four fields designated NE, SE, NW, and SW, and a weighing lysimeter was centered in each field. The SWMRU weather station was adjacent to and immediately east of the NE and SE lysimeter fields.
\nResource Title: Conventions for Bushland, TX, Weighing Lysimeter Datasets.\nFile Name: Conventions for Bushland, TX, Weighing Lysimeter Datasets.xlsx.\nResource Description: Descriptions of conventions and terminology used in the Bushland, TX, weighing lysimeter research program.
\nResource Title: Symbols and Abbreviations for Bushland, TX, Weighing Lysimeter Datasets.\nFile Name: Symbols and Abbreviations for Bushland, TX, Weighing Lysimeter Datasets.xlsx.\nResource Description: Definitions of symbols and abbreviations used in the Bushland, TX, weighing lysimeter research datasets.
\nResource Title: Soil Properties for the Bushland, TX, Weighing Lysimeter Datasets.\nFile Name: Bushland_TX_soil_properties.xlsx.\nResource Description: Soil properties useful for simulation modeling and for describing the soil are given for the Pullman soil series at the USDA, ARS, Conservation & Production Research Laboratory, Bushland, TX, USA. For each soil layer, soil horizon designation and texture according to USDA Soil Taxonomy, bulk density, porosity, water content at field capacity (33 kPa) and permanent wilting point (1500 kPa), percent sand, percent silt, percent clay, percent organic matter, pH, and van Genuchten-Mualem characteristic curve parameters describing the soil hydraulic properties are given. A separate table describes the soil horizon thicknesses, designations, and textures according to USDA Soil Taxonomy. Another table describes important aspects of the soil hydrologic and rooting behavior.
\nResource Title: README - Bushland Texas Winter Wheat collection.\nFile Name: README_Bushland_winter_wheat_collection.pdf.\nResource Description: Descriptions of the datasets in the Bushland Texas Winter Wheat collection
\nPrevious research conducted in Costa Rica determined that Trichoderma ovalisporum, when applied in a water-in-oil emulsion to Theobroma cacao pods, had less Moniliophthora roreri (frosty pod rot) than in water. The current research was conducted to determine why bio-control agents when applied to cacao pods were more effective in a water-in-oil emulsion than water for controlling frosty pod rot. The experiments were conducted in Ecuador in 2011 and 2012. Two formulations were used: water-in-oil emulsion and water. Water-sensitive cards were attached to the lower branches of the cacao trees. There were four trees per treatment and six cards per tree. One hundred and eighty ml of formulation were applied to each tree with a Stihl SR 420 backpack mist-blower. The cards underwent droplet analysis with the DepositScan software package. Droplet analysis determined that the increased efficacy of water-in-oil emulsion was the result of the micro-environment advantage of the water-in-oil emulsion.
Resource Title: Rc139MetaData.
File Name: RC139MetaData.zip
Resource Description: RC139MetaData is composed of five files. (1) RC139Readme: is a description of the files in the RC139MetaData.zip. (2) RC139CodeBook: Is a description of the experiment, how it was conducted, what variables are in the RC139Data with their description. (3) & (5) SAS satistical program code for analysis of RC139data. (5) RC139Data: Dataset containing results of experiments.
\nResource Title: RC139 Data Dictionary.
File Name: RC139-data-dictionary.csv
Resource Description: Defines variables, origination, data type, etc. for each column in RC139Data.csv data. (NOTE: Also contained in the markdown Code book RC139CodeBook.md file within the RC139MetaData.zip.)
GRIN-Global is an ongoing international collaborative project to develop shared and open-source applications that help manage plant germplasm collections. The software was jointly developed by the Agricultural Research Service of USDA, Global Crop Diversity Trust, and Bioversity International, with the first version released in December 2011. The ARS has used GRIN-Global to manage its plant germplasm collections, the U.S. National Plant Germplasm System, since November 2015. GRIN-Global is an extension of Germplasm Resources Information Network (GRIN) information management system, which was first developed by ARS beginning in the mid-1980s.
\nGRIN-Global is comprised of a suite of computer applications that are used internally by genebank staff to curate collections, as well as a public website through which scientists can query the database and request samples of germplasm through a shopping cart process.
\nResource Title: The GRIN-Global Project website pointer.
File Name: Web Page, url: https://www.grin-global.org/
The USDA Long-Term Agroecosystem Research was established to develop national strategies for sustainable intensification of agricultural production. As part of the Agricultural Research Service, the LTAR Network incorporates numerous geographies consisting of experimental areas and locations where data are being gathered. Starting in early 2019, two working groups of the LTAR Network (Remote Sensing and GIS, and Data Management) set a major goal to jointly develop a geodatabase of LTAR Standard GIS Data Layers. The purpose of the geodatabase was to enhance the Network's ability to utilize coordinated, harmonized datasets and reduce redundancy and potential errors associated with multiple copies of similar datasets. Project organizers met at least twice with each of the 18 LTAR sites from September 2019 through December 2020, compiling and editing a set of detailed geospatial data layers comprising a geodatabase, describing essential data collection areas within the LTAR Network.
\nThe LTAR Standard GIS Data Layers geodatabase consists of geospatial data that represent locations and areas associated with the LTAR Network as of late 2020, including LTAR site locations, addresses, experimental plots, fields and watersheds, eddy flux towers, and phenocams. There are six data layers in the geodatabase available to the public. This geodatabase was created in 2019-2020 by the LTAR network as a national collaborative effort among working groups and LTAR sites. The creation of the geodatabase began with initial requests to LTAR site leads and data managers for geospatial data, followed by meetings with each LTAR site to review the initial draft. Edits were documented, and the final draft was again reviewed and certified by LTAR site leads or their delegates. Revisions to this geodatabase will occur biennially, with the next revision scheduled to be published in 2023.
\nResource Title: LTAR Standard GIS Data Layers, 2020 version, File Geodatabase.
File Name: LTAR_Standard_GIS_Layers_v2020.zip
Resource Description: This file geodatabase consists of authoritative GIS data layers of the Long-Term Agroecosystem Research Network. Data layers include: LTAR site locations, LTAR site points of contact and street addresses, LTAR experimental boundaries, LTAR site \"legacy region\" boundaries, LTAR eddy flux tower locations, and LTAR phenocam locations.
Resource Software Recommended: ArcGIS,url: esri.com
Resource Title: LTAR Standard GIS Data Layers, 2020 version, GeoJSON files.
File Name: LTAR_Standard_GIS_Layers_v2020_GeoJSON_ADC.zip
Resource Description: The contents of the LTAR Standard GIS Data Layers includes geospatial data that represent locations and areas associated with the LTAR Network as of late 2020. This collection of geojson files includes spatial data describing LTAR site locations, addresses, experimental plots, fields and watersheds, eddy flux towers, and phenocams. There are six data layers in the geodatabase available to the public. This dataset was created in 2019-2020 by the LTAR network as a national collaborative effort among working groups and LTAR sites.
Resource Software Recommended: QGIS,url: https://qgis.org/en/site/
The Ogallala Agro-Climate Tool is a Visual Basic application that estimates irrigation demand and crop water use over the Ogallala Aquifer region. The application's meteorological database consists of daily precipitation and temperature data from 141 U.S. Historical Climatology Network stations during 1976-2005. From that daily data the program calculates climate and crop evapotranspiration (ETc) statistics over arbitrarily defined periods within summer or winter growing seasons at user-selected latitude-longitude coordinates. The statistics reported include: ETc estimates derived from the FAO-56 single crop coefficient algorithm, probabilities of exceedance of cumulative rainfall, irrigation demand and growing degree days, the probability that minimum and maximum daily temperatures will exceed user-defined temperature thresholds, and the probability of heat stress, cold stress and dry periods of varying duration.
Resource Title: Ogallala Agro-Climate Tool.
File Name: Web Page, url: https://www.ars.usda.gov/research/software/download/?softwareid=485&modecode=30-96-05-00
download page
The data in the Porcine Translational Research Database is supported by >5800 references, and contains 65 data fields for each entry, including >9700 full length (5′ and 3′) unambiguous pig sequences, >2400 real time PCR assays and reactivity information on >1700 antibodies. It also contains gene and/or protein expression data for >2200 genes and identifies and corrects errors (gene duplications artifacts, mis-assemblies, mis-annotations, and incorrect species assignments) for >2,000 porcine genes. This database is the largest manually curated database for any single veterinary species and is unique among porcine gene databases in regard to linking gene expression to gene function, identifying related gene pathways, and connecting data with other porcine gene database.
Resource Title: The Porcine Translational Research Database.
File Name: Web Page, url: https://www.ars.usda.gov/northeast-area/beltsville-md/beltsville-human-nutrition-research-center/diet-genomics-and-immunology-laboratory/docs/dgil-porcine-translational-research-database/
The RHEM Web Tool is a web-based interface for the Rangeland Hydrology and Erosion Model (RHEM). The interface allows users to input commonly known rangeland characteristics and use parameter estimation equations to construct model input files and run the RHEM model.
\nRHEM is designed to provide sound, science-based technology to model and predict runoff and erosion rates on rangelands and to assist in assessing rangeland conservation practice effects. RHEM is a newly conceptualized, process-based erosion prediction tool specific for rangeland application, based on fundamentals of infiltration, hydrology, plant science, hydraulics and erosion mechanics.
\nThis web application was built with the following goals in mind:
\nProvide tabular and graphical reports
\nResource Title: The RHEM Web Tool.
File Name: Web Page, url: https://dss.tucson.ars.ag.gov/rhem/
Main tool web site
The USDA-ARS Southwest Watershed Research Center (SWRC) operates the Walnut Gulch Experimental Watershed (WGEW) in southeastern Arizona as an outdoor laboratory for studying semiarid rangeland hydrologic, ecosystem, climate, and erosion processes.
\nSince its establishment in 1953, the SWRC in Tucson, Arizona, has collected, processed, managed, and disseminated high-resolution, spatially distributed hydrologic data in support of the center's mission. Data management at the SWRC has evolved through time in response to new computing, storage, and data access technologies. In 1996, the SWRC initiated a multiyear project to upgrade rainfall and runoff sensors and convert analog systems to digital electronic systems supported by data loggers. This conversion was coupled with radio telemetry to remotely transmit recorded data to a central computer, thus greatly reducing operational overhead by reducing labor, maintenance, and data processing time. A concurrent effort was initiated to improve access to SWRC data by creating a system based on a relational database supporting access to the data via the Internet. An SWRC team made up of scientists, IT specialists, programmers, hydrologic technicians, and instrumentation specialists was formed. This effort is termed the Southwest Watershed Research Center Data Access Project (DAP).
\nThe goal of the SWRC DAP is to efficiently disseminate data to researchers; land owners, users, and managers; and to the public. Primary access to the data is provided through a Web-based user interface. In addition, data can be accessed directly from within the SWRC network. The first priority for the DAP was to assimilate and make available rainfall and runoff data collected from two instrumented field sites, the WGEW near Tombstone, Arizona, and the Santa Rita Experimental Range (SRER) south of Tucson, Arizona.
\nResource Title: Data Access Project.
File Name: Web Page, url: https://www.tucson.ars.ag.gov/dap
Datasets were provided by the USDA-ARS Southwest Watershed Research Center. Funding for these datasets was provided by the United States Department of Agriculture, Agricultural Research Service. Please send 1 copy of the published manuscript to: Southwest Watershed Research Center, 2000 E. Allen Rd. Tucson, AZ 857119\n
The Triticeae Toolbox (T3) webportal hosts data generated by the Triticeae Coordinated Agricultural Project (CAP), funded by the National Institute for Food and Agriculture (NIFA) of the United States Department of Agriculture (USDA). T3 contains SNP, phenotypic, and pedigree data from wheat and barley germplasm in the Triticeae CAP integrating rapidly expanding DNA marker and sequence data with traditional phenotypic data to provide access to predictive analyses mapping genotype to phenotype and enabling breeders to select on marker data alone. T3 will also link to related genomic and crop diversity databases (GrainGenes, Gramene, Ensembl Plants, and GRIN) for functional analyses to identify causal polymorphisms and networks affecting phenotypes. The software and data structure for T3 were developed as part of the Barley CAP project for its database, The Hordeum Toolbox (THT), carried forward as part of the Triticeae CAP in the T3 databases. T3 Barley holds data generated for Hordeum vulgare L. T3 Wheat holds data generated for Triticum spp. T3 Oat holds data generated for Avena. All are being enhanced in database performance, community curation and user tools. T3 contains germplasm line information, pedigree, genotype and phenotypic data from breeding programs participating in the CAP and core germplasm collections maintained by the USDA National Small Grains Collection.
Resource Title: Website Pointer to The Triticeae Toolbox (T3).
File Name: Web Page, url: https://triticeaetoolbox.org/
T3 is the webportal for the data generated by the Triticeae Coordinated Agricultural Project (CAP), funded by the National Institute for Food and Agriculture (NIFA) of the United States Department of Agriculture (USDA). Databases accessed via the portal: T3 Wheat, T3 Barley, T3 Oat.
The goal of the U.S. Wheat and Barley Scab Initiative (USWBSI) is to develop effective control measures that minimize the threat of Fusarium head blight (scab), including the reduction of mycotoxins, to the producers, processors, and consumers of wheat and barley. Community activities are reported here.
Resource Title: Web Page.
File Name: Web Page, url: https://scabusa.org
This dataset includes soil health, crop biomass, and crop yield data for a 13-year corn stover harvest trial in central Iowa.
\nFollowing the release in 2005 of the Billion Ton Study assessment of biofuel sources, several soil health assessments associated with harvesting corn stover were initiated across ARS locations to help provide industry guidelines for sustainable stover harvest. This dataset is from a trial conducted by the National Laboratory for Agriculture and Environment from 2007-2021 at the Iowa State University Ag Engineering and Agronomy farm. Management factors evaluated in the trial included the following.
\nThe dataset includes:\n1) Crop biomass and yields for all crop phases in every year.\n2) Soil organic carbon, total carbon, total nitrogen, and pH to 120 cm depth in 2012, 2016, and 2017. Soil cores from 2005 (pre-study) were also sampled to 90 cm depth.\n3) Soil chemistry sampled to 15 cm depth every 1-2 years from 2007 to 2017.\n4) Soil strength and compaction was assessed to 60 cm depth in April 2021.
\nThese data have been presented in several manuscripts, including Phillips et al. (in review), O'Brien et al. (2020), and Obrycki et al. (2018).
\nResource Title: R Script for Phillips et al. 2022.
File Name: Field 70-71 Analysis Script_AgDataCommons.R
Resource Description: This R script includes analysis and figures for Phillips et al. \"Thirteen-year Stover Harvest and Tillage Effects on Soil Compaction in Iowa\". It focuses primarily on the soil compaction and strength data found in \"Field 70-71 ConeIndex_BulkDensityDepths_2021\". It also includes analysis of corn yields from \"Field 70-71 CornYield_2008-2021\" and weather conditions from \"PRISM_MayTemps\" and \"Rainfall_AEA\".
Resource Software Recommended: R version 4.1.3 or higher,url: https://cran.r-project.org/bin/windows/base/
Resource Title: Field 70-71 ConeIndex_BulkDensityDepths_2021.
File Name: Field 70-71 ConeIndex_BulkDensityDepths_2021.csv
Resource Description: This dataset provides an assessment of soil strength (penetration resistance) and soil compaction (bulk density) to 60 cm depth, in continuous corn plots. Penetration resistance was measured in most-trafficked and least-trafficked areas of the plots to assess compaction from increased traffic associated with stover harvest. This spreadsheet also has associated data, including soil water, carbon, and organic matter content. Data were collected in April 2021 and are described in Phillips et al. (in review, 2022).
Resource Title: Field 70-71 CornYield_2008-2021.
File Name: Field 70-71 CornYield_2008-2021_ForR.csv
Resource Description: This dataset provides corn stover biomass and grain yields from 2008-2021. Note that this dataset is just for corn, which were presented in Phillips et al., 2022. Yields for all crop phases, including soybeans, wheat, alfalfa, and winter cover crops, are in the file \"Field 70-71 Crop Yield File 2008-2020\".
Resource Title: PRISM_MayTemps.
File Name: PRISM_MayTemps.csv
Resource Description: Average May temperatures during the study period, obtained from interpolation of regional weather stations using the PRISM climate model (https://prism.oregonstate.edu/). These data were used to evaluate how spring temperatures may have impacted corn establishment.
Resource Title: Rainfall_AEA.
File Name: Rainfall_AEA.csv
Resource Description: Daily rainfall for the study location, 2008-2021. Data were obtained from the Iowa Environmental Mesonet (https://mesonet.agron.iastate.edu/rainfall/). Title: Field 70-71 Plot Status 2007-2021.
File Name: Field 70-71 Plot Status 2007-2021.xlsx
Resource Description: This file contains descriptions of experimental treatments and diagrams of plot layouts as they were modified through several phases of the trial. Also includes an image of plot locations relative to NRCS soil survey map units.
Resource Title: Field 70-71 Deep Soil Cores 2012-2017.
File Name: Field 70-71 Deep Soil Cores 2012-2017.xlsx
Resource Description: Soil carbon, nitrogen, organic matter, and pH to 120 cm depth in 2012, 2016, and 2017.
Resource Title: Field 70-71 Baseline Deep Soil Cores 2005.
File Name: Field 70-71 Baseline Deep Soil Cores 2005.csv
Resource Description: Baseline soil carbon, nitrogen, and pH data from an earlier trial in 2005, prior to stover trial establishment.
Resource Title: Field 70-71 Crop Yield File 2008-2020.
File Name: Field 70-71 Crop Yield File 2008-2020.xlsx
Resource Description: Yields for all crops in all cropping sequences, 2008-2020. Some of the crop sequences have not been summarized in publications.
Resource Title: Field 70-71 Surface Soil Test Data 2007-2021.
File Name: Field 70-71 Surface Soil Test Data 2007-2021.xlsx
Resource Description: Soil chemistry data, 0-15 cm, collect near-annually from 2007 to 2021. Most analyses were performed by Harris Laboratories (now AgSource) in Lincoln, Nebraska, USA. \n
Resource Title: Iowa Stover Harvest Trial Data Dictionary.
File Name: Field 70-71 Data Dictionary.xlsx
Resource Description: Data dictionary for all data files.
The main goal of the project is to construct and utilize high-resolution genome-wide RH-based physical maps of the wheat D-genome chromosomes to facilitate the construction of sequence-ready physical maps. This research provides an unprecedented view into the evolution of cereal genomes. Importantly, the methodology is being developed to be applied to other large and complex genomes such as polyploid wheat.
Resource Title: Web Page.
File Name: Web Page, url: https://wheat.pw.usda.gov/RHmapping/
This dataset contains research data compiled by the “Managing Water for Increased Resiliency of Drained Agricultural Landscapes” project a.k.a. Transforming Drainage. This project was funded from 2015-2021 by the United States Department of Agriculture, National Institute of Food and Agriculture (USDA-NIFA, Award No. 2015-68007-23193). Data are also available from a separate web-accessible application (drainagedata.org). At drainagedata.org, users can visualize the data with customized tools, query based on specific sites and measurements of interest, and access site photographs, maps, summaries, and publications. Additional data or edits made following the publication of this data here at USDA NAL Ag Data Commons will be posted under the Versions tab on drainagedata.org.
\nThese data began in 1996 and include plot- and field-level measurements for 39 experiments across the Midwest and North Carolina. Practices studied include controlled drainage, drainage water recycling, and saturated buffers. In total, 219 variables are reported and span 207 site-years for tile drainage, 154 for nitrate-N load, 181 for water quality, 92 for water table, and 201 for crop yield.
\nThe Transforming Drainage Project worked to advance the process of designing and implementing agricultural drainage systems for storing water in the landscape to improve the resiliency and productivity of agricultural systems. At each site, a control plot was paired with a plot with one of the following three practices to assess impacts.
\nControlled Drainage (CD) is the practice of using a water control structure to raise the depth of the drainage outlet, holding water in the field during periods when drainage is not needed.
\nDrainage Water Recycling (DWR) diverts subsurface drainage water into on-farm ponds or reservoirs, where it is stored until it can be used by the crop later in the season through supplemental irrigation.
\nSaturated Buffers (SB) remove nitrate from subsurface drainage water by diverting it into the buffer where it can be taken up by growing vegetation or removed by denitrification.
\nResource Title: Field management - tillage.
File Name: mngt_tillage_data.csv
Resource Description: Information about tillage operations performed in the research fields during the study period
Resource Title: Field management – notes.
File Name: mngt_notes_data.csv
Resource Description: General information about field conditions during the study period
Resource Title: Field management – residue.
File Name: mngt_residue_data.csv
Resource Description: Information about residue management in the research fields during the study period
Resource Title: Field management – fertilizing.
File Name: mngt_fertilizing_data.csv
Resource Description: Information about fertilizer application and soil amendments performed in the research fields during the study period
Resource Title: Field management – harvesting.
File Name: mngt_harvesting_data.csv
Resource Description: Information about harvesting operations performed in the research fields during the study period
Resource Title: Field management – planting.
File Name: mngt_planting_data.csv
Resource Description: Information about planting operations performed in the research fields during the study period
Resource Title: Field management – irrigation.
File Name: mngt_irrigation_data.csv
Resource Description: Information about irrigation operations performed in the research fields during the study period
Resource Title: Field management – drainage water management.
File Name: mngt_dwm_data.csv
Resource Description: Information about drainage water management in the research fields during the study period
Resource Title: Weather data.
File Name: weather_data.csv
Resource Description: On-site weather data collected in the research fields during the study period
Resource Title: Soil physicochemical properties data.
File Name: soil_properties_data.csv
Resource Description: Soil physicochemical measurements collected in the research fields during the study period
Resource Title: Soil moisture data.
File Name: soil_moisture_data.csv
Resource Description: Soil moisture, temperature and bulk EC measurements collected in the research fields during the study period
Resource Title: Irrigation data.
File Name: irrigation_data.csv
Resource Description: Amount of irrigation water applied to the research fields during the study period
Resource Title: Stage data.
File Name: water_stage_data.csv
Resource Description: Stage measurements in the wetlands during the study period
Resource Title: Water table data.
File Name: water_table_data.csv
Resource Description: Water table measurements collected in the research fields during the study period
Resource Title: Water quality data.
File Name: water_quality_data.csv
Resource Description: Water quality measurements collected from the research fields during the study period
Resource Title: Methodology.
File Name: meta_methods.csv
Resource Description: Description of the drainage system set up, sampling procedures, and other protocols used at each research site during the study period
Resource Title: Plot treatment.
File Name: meta_treatment_identifier.csv
Resource Description: List of treatments used across the research sites during the study period
Resource Title: Plot description.
File Name: meta_plot_characteristics.csv
Resource Description: Description of plots and corresponding drainage systems for each research site
Resource Title: Agronomic data.
File Name: agronomic_data.csv
Resource Description: Agronomic measurements collected in the research fields during the study period
Resource Title: Site description.
File Name: meta_site_characteristics.csv
Resource Description: Description of the research sites
Resource Title: Drainage data.
File Name: drain_flow_and_N_loads_data.csv
Resource Description: Drain flow and nitrate load measurements collected from the research fields during the study period
Resource Title: Data dictionary.
File Name: data_dictionary.csv
The dataset comprises viral titrations collected from nasal swabs of swine and weight measurements and viral titration from nasal washes of ferrets.\nNasal swabs were collected from pigs at 0, 1, 3, 5, 7 9 and 11 days post infection (dpi). Weight of ferrets was measured daily from -4 to 5, then 7, 9, 11 and 12 days post contact (dpc). Nasal washes were collected at 0, 1, 3, 5, 7, 9, 11 and 12 dpi from ferrets.
Resource Title: Viral shedding of swine and viral shedding and weight measures of ferrets.
File Name: FLU38B_H3 swine and ferret data.xlsx
Resource Description: The dataset comprises viral titrations collected from nasal swabs of swine and weight measurements and viral titration from nasal washes of ferrets.\nNasal swabs were collected from pigs at 0, 1, 3, 5, 7 9 and 11 days post infection (dpi). Ferret weight was measured daily from -4 to 5, then 7, 9, 11 and 12 days post contact (dpc). Nasal washes were collected at 0, 1, 3, 5, 7, 9, 11 and 12 dpi from ferrets.
The attached, linked files provide the characters and character matrix for publications describing immatures of the New World treehoppers (Membracidae, Melizoderdae, and Aetalionidae) by McKamey, Wallner, Porter, Wallace, and Phillips, or some combination thereof.
\nCharacters for each body part are assigned a number, and each character within each body part are assigned a letter, because additional characters (and states) are expected to be discovered with each newly examined tribe or subfamily and it is desirable to keep all characters pertaining to a body part together. With each publication, both of these linked files will be updated.
\nPresently, the characters and matrix cover the tribes Amastrini and Thuridini (Smiliinae).
Resource Title: 2015 Characters.
File Name: 2015 Characters.pdf
Resource Description: Characters and states for treehopper nymphs. Partly because character states were appended as discovered, and partly because of their plasticity, we recommend that, if these characters are used in a cladistic analysis, they be treated as unordered states.
Resource Title: May 2015 Matrix.
File Name: May 2015 matrix.pdf
Data Description\nManaged turfgrass is a common component of urban landscapes that is expanding under current land use trends. Previous studies have reported high rates of soil carbon sequestration in turfgrass, but no systematic review has summarized these rates nor evaluated how they change as turfgrass ages. We conducted a meta-analysis of soil carbon sequestration rates from 63 studies. Those data, as well as the code used to analyze them and create figures, are shared here.
\nDataset Development\nWe conducted a systematic review from Nov 2020 to Jan 2021 using Google Scholar, Web of Science, and the Michigan Turfgrass Information File Database. The search terms targeted were \"soil carbon\", \"carbon sequestration\", \"carbon storage\", or “carbon stock”, with \"turf\", \"turfgrass\", \"lawn\", \"urban ecosystem\", or \"residential\", “Fescue”, “Zoysia”, “Poa”, “Cynodon”, “Bouteloua”, “Lolium”, or “Agrostis”. We included only peer-reviewed studies written in English that measured SOC change over one year or longer, and where grass was managed as turf (mowed or clipped regularly). We included studies that sampled to any soil depth, and included several methodologies: small-plot research conducted over a few years (22 datasets from 4 articles), chronosequences of golf courses or residential lawns (39 datasets from 16 articles), and one study that was a variation on a chronosequence method and compiled long-term soil test data provided by golf courses of various ages (3 datasets from Qian & Follett, 2002). In total, 63 datasets from 21 articles met the search criteria.
\nWe excluded 1) duplicate reports of the same data, 2) small plot studies that did not report baseline SOC stocks, and 3) pure modeling studies. We included five papers that only measured changes in SOC concentrations, but not areal stocks (i.e., SOC in Mg ha-1). For these papers, we converted from concentrations to stocks using several approaches. For two papers (Law & Patton, 2017; Y. Qian & Follett, 2002) we used estimated bulk densities provided by the authors. For the chronosequences reported in Selhorst & Lal (2011), we used the average bulk density reported by the author. For the 13 choronosequences reported in Selhorst & Lal (2013), we estimated bulk density from the average relationship between percent C and bulk density reported by Selhorst (2011). For Wang et al. (2014), we used bulk density values from official soil survey descriptions.
\nData provenance\nIn most cases we contacted authors of the studies to obtain the original data. If authors did not reply after two inquiries, or no longer had access to the data, we captured data from published figures using WebPlotDigitizer (Rohatgi, 2021). For three manuscripts the data was already available, or partially available, in public data repositories. Data provenance information is provided in the document \"Dataset summaries and citations.docx\".
\nRecommended Uses\nWe recommend the following to data users:
\nThe USDA Pomological Watercolor Collection is a collection of original watercolors, lithographs, and photographs documenting fruit and nut varieties developed by growers, including USDA plant explorers, around the turn of the 20th century. Technically accurate paintings were used to create lithographs illustrating USDA bulletins, yearbooks, and other series distributed to growers and gardeners across America.
\nCoverage: 1886 to 1942, with the majority created between 1894 and 1916.
\nThe collection contains 7,584 watercolor paintings, lithographs and line drawings, including 3,807 images of apples. The plant specimens illustrated originated in 29 countries and 51 states and territories in the U.S.
\nThe paintings were created by approximately twenty-one artists commissioned by USDA for this purpose. Some works are not signed.
\nResource Title: U.S. Department of Agriculture (USDA) Pomological Watercolor Collection (web site).
File Name: Web Page, url: https://search.nal.usda.gov/discovery/collectionDiscovery?vid=01NAL_INST:MAIN&collectionId=81279629860007426
This is the web site for the USDA Pomological Watercolor Collection digitized at the National Agricultural Library.\nContent: 7,584 watercolor paintings, lithographs and line drawings, including 3,807 images of apples.
The U.S. National Fungus Collections (BPI) are the “Smithsonian for fungi” and are the repository for over one million fungal specimens worldwide - the largest such collections in the world. The collection includes preserved organisms, their parts and products, and their associated data. Information associated with these specimens constitute an enormous data resource, especially about plant-associated fungi. The collections document fungi through time and space for the past 200 years.
\nData from the labels of more than 750,000 of the specimens have been entered into a database. These labels have information on the host on which the fungus was found and the locality in which the specimen was collected. Sixty percent of these specimens are from the United States and thus represent a large body of information about the fungi in this country.
\nData entry has been completed for the Uredinales (rusts), the Ustilaginales (smuts), the Polyporales (polypores), the Deuteromycetes (imperfect fungi), the Ascomycetes, and the C.G. Lloyd collections. Recent progress has been made in the computerization of specimens of the agarics and the \"lower\" fungi including the Oomycetes and Chytridiomycetes.
Resource Title: Fungal databases - Specimens.
File Name: Web Page, url: https://nt.ars-grin.gov/fungaldatabases/specimens/specimens.cfm
The direct database form link
This subset of the U.S. National Insects Collection, which is primarly housed by the Smithsonian Institution's National Museum of Natural History, comprises the Coccomorpha (scale insects), Aphidomorpha (aphids), Alyrodomorpha (whiteflies), Psyllomorpha (psyllids), Thysanoptera (thrips), and Acari (mites) collections.
\nInformation about the Aphidomorpha (Aphididae, Adelgidae, and Phylloxeridae) samples is available through this database.
\nTo search for one of these subgroups, use the \"family\" dropdown on one of the search subpages. You can search by Field or Keywords, and may also restrict your search to Genetic Samples, Primary Type Specimens, Species Inventory, Specimen Inventory, records with images, records with geo-referenced localities, or Illustrations.
Resource Title: Department of Entomology Collections.
File Name: Web Page, url: http://collections.nmnh.si.edu/search/ento/
The online catalog for this collection
The UAS User Log is a server-based, digital logbook that is accessible through any web browser on internet-connected devices. It is an outcome of multi-state teams working together to develop a common protocol for unmanned aircraft systems (UAS, or drones) operation and bring standardization to flight data collection for purposes such as research/production, spray application, and any other activity of interest. It relies on simple user interactions to develop a record of UAS mission and can also serve to enhance flight and maintenance experience. The logbook provides options to interactively record the date, time and location of a flight, the make, model and registration information of the device, status of battery charge, type of flight (autonomous or manual), types of sensors used and data collected, safety precautions taken, weather during the flight and other related information.
Resource Title: Website Pointer to UAS User Log.
File Name: Web Page, url: https://www.uasuserlog.org/
Generates a web form to log details of a specific UAS mission.
This dataset consists of UAS flight images from three sites along an elevation and precipitation gradient within Reynolds Creek Experimental Watershed collected between June 4 and July 9, 2019. The lowest elevation site ('wbs1', 1,425 m) was vegetated by shrub steppe dominated Wyoming big sage (Artemisia tridentata ssp. wyomingensis). Vegetation at the middle elevation site ('los1', 1,680 m) was shrub steppe dominated by low sage (Artemisia arbuscula). Shrub steppe at the highest elevation site ('mbs1', 2,110 m) was dominated by mountain big sage (Artemisia tridentata ssp. vaseyana) and Utah snowberry (Symphoricarpos oreophilus utahensis). A MicaSense RedEdge 3 sensor mounted on a DJI Matrice 600 Pro UAS platform was used to collect multispectral imagery of each site. The drone was flown by a Federal Aviation Administration (FAA) Part 107 certified remote pilot between June 5 and July 9 2019. All flights were completed within two hours of solar noon. The RedEdge is a broadband multispectral sensor: blue (475nm), green (560nm), red (668nm), red edge (717nm), and near-infrared (840nm). The RedEdge sensor was radiometrically calibrated using a reflectance panel before and after each flight. A DJI Phantom 4 with the stock FC330 Red Green Blue (sRGB) camera was flown over each site to collect imagery at a finer spatial resolution to assist with training and test data for vegetation type classification.
Resources in this dataset:
UNSATCHEM is a software package for simulating water, heat, carbon dioxide and solute movement in one-dimensional variably saturated media. The software consists of the UNSCHEM (version 2.0) computer program, and the UNSATCH interactive graphics-based user interface. The UNSCHEM program numerically solves the Richards' equation for variably-saturated water flow and convection-dispersion type equations for heat, carbon dioxide and solute transport. The flow equation incorporates a sink term to account for water uptake by plant roots. The heat transport equation considers transport due to conduction and convection with flowing water. Diffusion in both liquid and gas phases and convection in the liquid phase are considered as CO2 transport mechanisms. The CO2 production model is described. The major variables of the chemical system are Ca, Mg, Na, K, SO4, Cl, NO3, H4SiO4, alkalinity, and CO2. The model accounts for equilibrium chemical reactions between these components such as complexation, cation exchange and precipitation-dissolution. For the precipitation-dissolution of calcite and dissolution of dolomite, either equilibrium or multicomponent kinetic expressions are used which include both forward and back reactions. Other dissolution-precipitation reactions considered include gypsum, hydromagnesite, nesquehonite, and sepiolite. Since the ionic strength of soil solutions can vary considerably with time and space and often reach high values, both modified Debye-Huckel and Pitzer expressions were incorporated into the model as options to calculate single ion activities.
\nThe program may be used to analyze water and solute movement in unsaturated, partially saturated, or fully saturated porous media. The flow region may be composed of nonuniform soils. Flow and transport can occur in the vertical, horizontal, or a generally inclined direction. The water flow part of the model can deal with prescribed head and flux boundaries, boundaries controlled by atmospheric conditions, as well as free drainage boundary conditions. The governing flow and transport equations are solved numerically using finite differences and Galerkin-type linear finite element schemes, respectively.
\nThis report serves as both a user manual and reference document. Detailed instructions are given for data input preparation. A graphics-based user interface, UNSATCH, for data preparation and graphical output display in the MS Windows environment is described in the second part of the manual.
Resource Title: UNSATCHEM download page.
File Name: Web Page, url: https://www.ars.usda.gov/research/software/download/?softwareid=105&modecode=20-36-15-00
This database contains measured soil water retention, hydraulic conductivity, and water diffusivity data, as well as pedological information of some 790 soil samples from around the world.
\nQuantifying water flow and chemical transport in the vadose zone typically requires knowledge of the unsaturated soil hydraulic properties. The UNsaturated SOil hydraulic DAtabase (UNSODA) was developed to provide a source of unsaturated hydraulic data and some other soil properties for practitioners and researchers. A first MS-DOS version of the database was released in 1996. It has been applied in numerous studies. In this paper, we describe the second version (UNSODA V2.0) for use with Microsoft Access-97®1. The format and structure of the new database have been modified to provide additional and more convenient options for data searches, to provide compatibility with other programs for easy loading and downloading of data, and to allow users to customise the contents and look of graphical output. This paper reviews the structure and contents of the database as well as the operations that can be performed on the different data types in UNSODA V2.0. The use and application of the new database are illustrated with two examples. The retrieval of data is briefly illustrated, followed by a more detailed example regarding the interpolation of soil particle-size distribution data obtained according to different national definitions of particle-size classes. The interpolation procedure, which is based on finding similar particle-size distribution curves from a large European data set, also performed well for soils that originate from other geographical areas.
\nResource Title: UNSODA 2.0 README.
File Name: UNSODA 2.0 README.pdf
Resource Title: UNSODA 2.0 zip package.
File Name: unsoda.ZIP
Resource Description: Contains a README file and Microsoft Access database. Files added to original record on June 8, 2020.
We introduce here the concept of Unique Pattern Informative Combinations (UPIC), a decision tool for the cost-effective design of DNA fingerprinting/genotyping experiments using simple-sequence/tandem repeat (SSR/STR) markers. After the first screening of SSR-markers tested on a subset of DNA samples, the user can apply UPIC to find marker combinations that maximize the genetic information obtained by a minimum or desirable number of markers. This allows a cost-effective planning of future experiments. We have developed Perl scripts to calculate all possible subset combinations of SSR markers, and determine based on unique patterns or alleles, which combinations can discriminate among all DNA samples included in a test. This makes UPIC an essential tool for optimizing resources when working with microsatellites. An example using real data from eight markers and 12 genotypes shows that UPIC detected groups of as few as three markers sufficient to discriminate all 12-DNA samples. Should markers for future experiments be chosen based only on polymorphism-information content (PIC), the necessary number of markers for discrimination of all samples cannot be determined. We also show that choosing markers using UPIC, an informative combination of four markers can provide similar information as using a combination of six markers (23 vs. 25 patterns, respectively), granting a more efficient planning of experiments. Perl scripts with documentation are also included to calculate the percentage of heterozygous loci on the DNA samples tested and to calculate three PIC values depending on the type of fertilization and allele frequency of the organism.
\nThe UPIC zip file contains 2 perl scripts, a README, and sample input and the resulting outputs. We would appreciate citation if you use them. As of 1 November, 2010, the zip file also contains an beta optimized script (upic_optimum_v1.1.20101101.pl) that produces a comma separated file, with all the markers that discriminate at least one line, which shows which lines have unique patterns. This allows you to select markers by score & line.
Resource Title: UPIC version 1.2.
File Name: UPIC_v1.2.zip
This dataset contains air temperature, relative humidity, precipitation, solar radiation, wind speed, soil temperature, and soil moisture data from the Soil Climate Analysis Network (SCAN) site 2026, \"Walnut Gulch #1,\" located in Cochise County, Arizona. The dataset links to a National Resources Conservation Service data request form, from which available data can be queried. The data collection site is at an elevation of 4500 feet; data has been continuously collected there since 1999-03-19.
Resource Title: GeoData catalog record.
File Name: Web Page, url: https://geodata.nal.usda.gov/geonetwork/srv/eng/catalog.search#/metadata/WalnutGulch1_eaa_2015_February_23_023
An excel template with data elements and conventions corresponding to the openLCA unit process data model. Includes LCA Commons data and metadata guidelines and definitions
Resource Title: READ ME - data dictionary.
File Name: lcaCommonsSubmissionGuidelines_FINAL_2014-09-22.pdf
Resource Title: US Federal LCA Commons Life Cycle Inventory Unit Process Template.
File Name: FedLCA_LCI_template_blank EK 7-30-2015.xlsx
Resource Description: Instructions: This template should be used for life cycle inventory (LCI) unit process development and is associated with an openLCA plugin to import these data into an openLCA database. See www.openLCA.org to download the latest release of openLCA for free, and to access available plugins.
This Image Gallery is provided as a complimentary source of high-quality digital photographs available from the Agricultural Research Service information staff. Photos, (over 2,000 .jpegs) in the Image Gallery are copyright-free, public domain images unless otherwise indicated.
\nResource Title: USDA ARS Image Gallery (Web page) .
File Name: Web Page, url: https://www.ars.usda.gov/oc/images/image-gallery/
Over 2000 copyright-free images from ARS staff.
\nA Modelling dataset containing a DSSAT cultivar file, AgMIPS platform dome code and USDA ARS LIRF drip irrigated field experiment in Greeley, Colorado average Maize biomass and yield by treatment. Irrigation treatments vary from 40% to 100% of ET. This dataset is used with the DSSAT and RZWQM2 models as part of an Agricultural Model Inter-comparison and Improvement Project (AgMIP) data node maintained at National Agricultural Library for USDA-AgMIP data. Additional data are available from https://data.agmip.org/
\nThe complete experiment dataset in readable Excel format is USDA-ARS Colorado Maize Water Productivity Dataset 2008-2011 and can be found at http://dx.doi.org/10.15482/USDA.ADC/1254006
Resource Title: Greeley, CO Limited Irrigation Research Farm (LIRF) Means.
File Name: agmip_download.zip
Our mission is to support application of low-input sustainable agriculture by: Providing, to the best of our ability, technical information about rhizobia, their preservation, and cultural and symbiotic characteristics; Acquiring and preserving the nitrogen-fixing bacterial symbionts of leguminous plants with the goal of maintaining widest possible genetic diversity; Maintaining quality control of new and existing germplasm by evaluation of microbiological purity and by examination of nodulation of the original trap host plant; Distributing cultures to the public and private sectors without charge for these services; Developing or adapting techniques in molecular biology for the determination of genetic diversity of rhizobia, to investigate interactions with their host plants and to identify novel characteristics; Acquiring, maintaining, evaluating quality, and distributing type strains for all the different taxa of nitrogen-fixing legume symbionts; Participating in the UNESCO program.
\nResource Title: USDA ARS National Rhizobium Germplasm Collection.
File Name: Web Page, url: https://www.ars-grin.gov/Rhizobium
Recent USDA/ARS patented technologies on bioenergy and the environment that are available for licensing are described, including summary, contact, benefits, and applications. Updated June 2018.
Resource Title: Bioenergy and Environment - Available Technologies, June 2018.
File Name: Bioenergy and Environment.pptx
Resource Description: Slides presenting title, contact, docket number(s), description, image, benefits, and applications of each new technology.
Resource Title: Patented Technologies Data Dictionary.
File Name: patented-technologies-data-dictionary.csv
Resource Description: Defines fields, data type, allowed values etc. in patented technology tables.
Resource Title: Bioenergy and Environment - June 2018.
File Name: Bioenergy_and_Environment_2018-06.csv
Resource Description: Listing of technologies to convert materials to bioproducts from agriculture and food production into fuels and other marketable products, and technologies to monitor and conserve the environment and resources. This CSV file provides the title, technology type, docket number, contact, description, and category for each item. Machine-readable content extracted from corresponding slides accompanying this dataset.
The biological materials in this section are unpatented, proprietary intellectual property, available for licensing under a Biological Materials License Agreement: Hybridoma Cell Lines; Microbial Isolates; Cloned Genetic Material; Cell Lines; Viruses; Plasmids. Updated June 2018.
Resource Title: Biological Materials Data Dictionary.
File Name: biological-materials-data-dictionary.csv
Resource Description: Defines fields, data type, allowed values etc. in biological materials tables.
Resource Title: Available Biological Materials - June 2018.
File Name: biological-materials-2018-06.csv
Resource Description: Listing of available biological materials including Hybridoma Cell Lines, Microbial Isolates, Cloned Genetic Material, Cell Lines, Viruses, and Plasmids. This CSV file provides the title, technology type, docket number, contact, description, and category for each item. Machine-readable content extracted from corresponding slides accompanying this dataset.
Resource Title: Biological Materials - Available Technologies, June 2018.
File Name: Biological Materials.pdf
Resource Description: Slides presenting title, contact, docket number(s), description, image, description, and applications of each new technology.
Recent USDA/ARS patented technologies on animal production and protection that are available for licensing are described, including summary, contact, benefits, and applications. Updated June 2018.
Resource Title: Animal Production and Protection - Available Technologies, June 2018.
File Name: Animal Production and Protection.pptx
Resource Description: Slides presenting title, contact, docket number(s), description, image, benefits, and applications of each new technology.
Resource Title: Patented Technologies Data Dictionary.
File Name: patented-technologies-data-dictionary.csv
Resource Description: Defines fields, data type, allowed values etc. in patented technology tables.
Resource Title: Animal Production & Protection - June 2018.
File Name: Animal_Production_and_Protection_2018-06.csv
Resource Description: Listing of technologies to improve the health, well-being, and efficiency of livestock, poultry, and aquatic food animals to ensure a productive and safe food supply. This CSV file provides the title, technology type, docket number, contact, description, and category for each item. Machine-readable content extracted from corresponding slides accompanying this dataset.
Recent USDA/ARS patent- and PVP-protected plant cultivars that are available for licensing are described, including summary, contact, and patent number/status. Updated June 2018.
Resource Title: Available Plant Cultivars - June 2018.
File Name: June Avail Plants.pptx
Resource Description: Slides presenting title, patent no./protection status, contact, docket number(s), description, and USPTO patent database URL of each new cultivar.
Resource Title: Available Plant Cultivars - June 2018.
File Name: Available_Plants_2018-06.csv
Resource Description: Listing of patent- and PVP-protected cultivars. This CSV file provides the title, patent no./protection status, contact, docket number(s), description, and USPTO patent database URL of each new cultivar. Machine-readable content extracted from corresponding slides accompanying this dataset.
Resource Title: Available Plants Data Dictionary.
File Name: available-plants-data-dictionary.csv
Resource Description: Defines fields, data type, allowed values etc. in available patented plants tables.
Recent USDA/ARS patented technologies on crop production and protection that are available for licensing are described, including summary, contact, benefits, and applications. Updated June 2018.
Resource Title: Crop Production and Protection - Available Technologies, June 2018.
File Name: Crop Production and Protection.pptx
Resource Description: Slides presenting title, contact, docket number(s), description, image, benefits, and applications of each new technology.
Resource Title: Patented Technologies Data Dictionary.
File Name: patented-technologies-data-dictionary.csv
Resource Description: Defines fields, data type, allowed values etc. in patented technology tables.
Resource Title: Crop Production and Protection - June 2018.
File Name: Crop_Production_and_Protection.csv
Resource Description: Listing of technologies for increased crop productivity, economically and environmentally sustainable methods of crop production, and protection from plant diseases and pests. This CSV file provides the title, technology type, docket number, contact, description, and category for each item. Machine-readable content extracted from corresponding slides accompanying this dataset.
Recent USDA/ARS patented technologies on food processing and products that are available for licensing are described, including summary, contact, benefits, and applications. Updated June 2018.
Resource Title: Food Processing and Products - Available Technologies, June 2018.
File Name: Food Processing and Products.pptx
Resource Description: Slides presenting title, contact, docket number(s), description, image, benefits, and applications of each new technology.
Resource Title: Patented Technologies Data Dictionary.
File Name: patented-technologies-data-dictionary.csv
Resource Description: Defines fields, data type, allowed values etc. in patented technology tables.
Resource Title: Patented Food Processing and Products - June 2018.
File Name: Food_Processing_and_Products.csv
Resource Description: Listing of technologies and processes to transfer raw ingredients into food or other food forms, and technologies to ensure that the food supply is safe for consumers. This CSV file provides the title, technology type, docket number, contact, description, and category for each item. Machine-readable content extracted from corresponding slides accompanying this dataset.
Patented technologies on materials and methods that are available for licensing. Updated June 2018.
Resource Title: Materials and Methods - Available Technologies, June 2018.
File Name: Materials and Methods.pptx
Resource Description: Slides presenting title, contact, docket number(s), description, image, benefits, and applications of each new technology.
Resource Title: Patented Technologies Data Dictionary.
File Name: patented-technologies-data-dictionary.csv
Resource Description: Defines fields, data type, allowed values etc. in patented technology tables.
Resource Title: Materials and Methods - June 2018.
File Name: Materials_and_Methods.csv
Resource Description: Listing of technologies and methods for the production of goods from raw materials. This CSV file provides the title, technology type, docket number, contact, description, and category for each item. Machine-readable content extracted from corresponding slides accompanying this dataset.
The USDA Branded Food Database was integrated as part of FoodData Central on April 2019. For more information on FoodData Central and the USDA Branded Food Database:
\nThis database contains values for six choline metabolites: Betaine, Glycerophosphocholine, Phosphocholine, Phosphatidylcholine, Sphingomyelin, and Total choline
\nThis database was created through a collaborative effort between the USDA and the Department of Nutrition, University of North Carolina.
Resource Title: READ ME - Documentation: USDA Database for the Choline Content of Common Foods .
File Name: Choln02.pdf
Resource Description: Contains information about documentation, methods and procedures, data evaluation, format, and dissemination information. Also contains references and general information about choline compounds.\n
Resource Title: Choline Content Release 2.
File Name: Choln02.zip
Resource Description: .zip file with Food and Nutrient database tables for Choline from phosphocholine, Choline from phosphatidylcholine, Choline from glycerophoshocholine, Betaine, and Choline from sphingomyelin.
The database contains values for 506 food items for five subclasses of flavonoids:
\nCyanidin, Delphinidin, Malvidin, Pelargonidin, Peonidin, Petunidin
\nResource Title: USDA Database for the Flavonoid Content of Selected Foods, Release 3.3 (March 2018).
File Name: Flav_R03-3.accdb
Resource Description: This file contains the Flavonoid Database imported into a MS Access database. In addition to the summary values, a separate file containing the individual values used to calculate the summary values is included, along with all information on conversion factors used to calculate the individual aglycone values, analytical method, country of origin, etc. It also includes relationships between files. You need MS Access 2007 or later to use this file. The file structure is the same as that of the USDA National Nutrient Database for Standard Reference. \n
Resource Title: USDA Database for the Flavonoid Content of Selected Foods Release 3.3 Documentation .
File Name: Flav3.3.pdf
This database contains data on the isoflavone content of 560 food items. Isoflavones included in the database are daidzein, genistein, glycitein and total isoflavones. Other phytoestrogens (coumestrol, biochanin A, and formononetin) are included as a separate table in the PDF report and in the database.
\nResource Title: READ ME - USDA Database for the Isoflavone Content of Selected Foods, Release 2.1.
File Name: Isoflav_R2-1.pdf
Resource Description: Information about the release history, documentation, format of the database, sources of data, and references cited in the data.
Resource Software Recommended: Adobe Acrobat Reader,url: http://www.adobe.com/prodindex/acrobat/readstep.html
Resource Title: Data Dictionary.
File Name: Isoflav_R21_DD.pdf
Resource Title: Isoflav_R2-1.accdb .
File Name: Isoflav_R2-1.zip
Resource Description: This file contains the Isoflavone Database imported into a MS Access database, version 2007 or later. The file structure is the same as that of the USDA National Nutrient Database for Standard Reference.\n
The database contains values for 283 food items for the following proanthocyanidins groups:
\nResource Title: READ ME - USDA Database for the Proanthocyanidin Content of Selected Foods.
File Name: PA02.pdf
Resource Description: Information regarding the documentation, data sources, data management, data quality evaluation, aggregation and format, sources of data, and references cited.
Resource Software Recommended: Adobe Acrobat Reader,url: http://www.adobe.com/prodindex/acrobat/readstep.html
Resource Title: Data Dictionary.
File Name: PA02_DD.pdf
Resource Title: PA02.accdb.
File Name: PA02.zip
Resource Description: This file contains the Proanthocyanidin Database imported into a MS Access database version 2007 or later. The file structure is the same as that of the USDA National Nutrient Database for Standard Reference.\n
This document provides instructions for editing and submitting unit process or product system models to the USDA LCA Commons life cycle inventory (LCI) database. The LCA Commons LCI database uses the openLCA life cycle modeling tool's database schema. Therefore, this document describes how to import and edit data in openLCA and name and classify flows such that they properly import into and operate in the database. This document also describes metadata or documentation requirements for posting models to the LCA Commons.
\nThis document is an evolving standard for LCA Commons data. As USDA-NAL continues to gain experience in managing a general purpose LCI database and global conventions continue to evolve, so too will the LCA Commons Submission Guidelines.
Resource Title: LCA Commons Submission Guidelines_12/09/2015.
File Name: lcaCommonsSubmissionGuidelines_Final_2015-12-09.pdf
Assessment of fluoride intake is paramount in understanding the mechanisms of fluoride metabolism, specifically the prevention of dental caries, dental fluorosis, and skeletal fluorosis. A database for fluoride is needed for epidemiologists and health researchers to estimate the intakes, and to investigate the relationships between intakes and human health.
\nResource Title: READ ME - USDA National Fluoride Database of Selected Beverages and Foods, Release 2.
File Name: F02.pdf
Resource Description:
Describes methods and procedures, data generation and evaluation, formats of tables, data dissemination, references cited in the documentation and database, and other miscellaneous information about this database.
\nResource Title: Fluoride Database of Selected Beverages and Foods (Release 2).
File Name: F02.xls
Resource Description: This file contains the Fluoride Database imported into a Microsoft Excel spreadsheet. You need Excel 2000 or later to use this file.
The dataset, Survey-SR, provides the nutrient data for assessing dietary intakes from the national survey What We Eat In America, National Health and Nutrition Examination Survey (WWEIA, NHANES). Historically, USDA databases have been used for national nutrition monitoring (1). Currently, the Food and Nutrient Database for Dietary Studies (FNDDS) (2), is used by Food Surveys Research Group, ARS, to process dietary intake data from WWEIA, NHANES. Nutrient values for FNDDS are based on Survey-SR. Survey-SR was referred to as the \"Primary Data Set\" in older publications. Early versions of the dataset were composed mainly of commodity-type items such as wheat flour, sugar, milk, etc. However, with increased consumption of commercial processed and restaurant foods and changes in how national nutrition monitoring data are used (1), many commercial processed and restaurant items have been added to Survey-SR. \n \nThe current version, Survey-SR 2013-2014, is mainly based on the USDA National Nutrient Database for Standard Reference (SR) 28 (2) and contains sixty-six nutrientseach for 3,404 foods. These nutrient data will be used for assessing intake data from WWEIA, NHANES 2013-2014. Nutrient profiles were added for 265 new foods and updated for about 500 foods from the version used for the previous survey (WWEIA, NHANES 2011-12). New foods added include mainly commercially processed foods such as several gluten-free products, milk substitutes, sauces and condiments such as sriracha, pesto and wasabi, Greek yogurt, breakfast cereals, low-sodium meat products, whole grain pastas and baked products, and several beverages including bottled tea and coffee, coconut water, malt beverages, hard cider, fruit-flavored drinks, fortified fruit juices and fruit and/or vegetable smoothies. Several school lunch pizzas and chicken products, fast-food sandwiches, and new beef cuts were also added, as they are now reported more frequently by survey respondents. Nutrient profiles were updated for several commonly consumed foods such as cheddar, mozzarella and American cheese, ground beef, butter, and catsup. The changes in nutrient values may be due to reformulations in products, changes in the market shares of brands, or more accurate data. Examples of more accurate data include analytical data, market share data, and data from a nationally representative sample.
Resource Title: USDA National Nutrient Database for Standard Reference Dataset for What We Eat In America, NHANES 2013-14 (Survey SR 2013-14).
File Name: SurveySR_2013_14 (1).zip
Resource Description: Access database downloaded on November 16, 2017. US Department of Agriculture, Agricultural Research Service, Nutrient Data Laboratory. USDA National Nutrient Database for Standard Reference Dataset for What We Eat In America, NHANES (Survey-SR), October 2015.
Resource Title: Data Dictionary.
File Name: SurveySR_DD.pdf
[Note: Integrated as part of FoodData Central, April 2019.]\nThe USDA National Nutrient Database for Standard Reference (SR) is the major source of food composition data in the United States and provides the foundation for most food composition databases in the public and private sectors. This is the last release of the database in its current format. SR-Legacy will continue its preeminent role as a stand-alone food composition resource and will be available in the new modernized system currently under development. SR-Legacy contains data on 7,793 food items and up to 150 food components that were reported in SR28 (2015), with selected corrections and updates. This release supersedes all previous releases.
Resource Title: USDA National Nutrient Database for Standard Reference, Legacy Release.
File Name: SR-Leg_DB.zip
Resource Description: Locally stored copy - The USDA National Nutrient Database for Standard Reference as a relational database using Acess
Resource Title: USDA National Nutrient Database for Standard Reference, Legacy Release.
File Name: SR-Leg_ASC.zip
Resource Description: ASCII files containing the data of the USDA National Nutrient Database for Standard Reference, Legacy Release.
Resource Title: USDA National Nutrient Database for Standard Reference, Legacy Release.
File Name: SR-Leg_ASC.zip
Resource Description: Locally stored copy - ASCII files containing the data of the USDA National Nutrient Database for Standard Reference, Legacy Release.
The USDA Nematode Collection is one of the largest and most valuable nematode collections in existence. It contains over 49,000 permanent slides and vials, with a total repository of nematode specimens reaching several million, including Cobb-Steiner, Thorne, and other valuable collections. Nematodes contained in this collection originate from world-wide sources.
\nThe USDA Nematode Collection Database contains over 38,000 species entries. A broad range of data is stored for each specimen, including species, host, origin, collector, date collected and date received. All records are searchable and available to the public through the online database.
\nThe physical collection is housed at the USDA Nematology Laboratory in Beltsville, MD. Specimens are available for loan to scientists who cannot personally visit the collection. Please see the Policy for Loaning USDANC Specimens for more information on this process.
\nScientists and other workers are always welcomed and encouraged to deposit material into the collection.
Resource Title: USDA Nematode Collection Database.
File Name: Web Page, url: https://nt.ars-grin.gov/nematodes/search.cfm
The database portal for this collection
The United States Department of Agriculture (USDA) Nutrient Data Laboratory (NDL), in collaboration with the National Cattlemen's Beef Association, National Pork Board, American Lamb Board, and meat scientists at selected universities, has conducted several research studies designed to update and expand nutrient data on retail meat cuts in the USDA National Nutrient Database for Standard Reference (SR). These studies have provided current and accurate estimates of data to update SR, and the study results have been incorporated into data sets that can be used for nutrient labeling. NDL has developed these data sets, presented in an easy-to-use table format.
\nEach data set provides retailers with easier access to the most accurate nutrient data for the purpose of on-pack nutrition labeling and for nutrition claims. These data sets focus on the cuts identified by USDA Food Safety and Inspection Service (FSIS) proposed labeling regulations for fresh, single-ingredient meats. The FSIS, an agency of the USDA, is the public health agency responsible for ensuring that the nation's commercial supply of meat, poultry and egg products is safe, wholesome, and correctly labeled and packaged.
Resource Title: The USDA Nutrient Data Set for Retail Beef Cuts, Release 3.0.
File Name: Retail_Beef_Cuts03.pdf
Resource Description: Each data set provides retailers with easier access to the most accurate nutrient data for the purpose of on-pack nutrition labeling and for nutrition claims. These data sets focus on the cuts identified by USDA Food Safety and Inspection Service (FSIS) proposed labeling regulations for fresh, single-ingredient meats.
\nThe online version of this document can be found at https://www.ars.usda.gov/ARSUserFiles/80400525/Data/Meat/Retail_Beef_Cuts03.pdf
Resource Title: The USDA Nutrient Data Set for Retail Beef Cuts, Release 3.0 (MS Excel download).
File Name: Beef_Labelling_Table03.xlsx
Resource Description: The tables in \"The USDA Nutrient Data Set for Retail Beef Cuts\" imported into a Microsoft Excel spreadsheet.
\nThe online version of this spreadsheet can be found at https://www.ars.usda.gov/ARSUserFiles/80400525/Data/Meat/Beef_Labelling_Table03.xlsx
Resource Title: USDA Nutrient Data Set for Retail Pork Cuts, Release 2.
File Name: Pork09.pdf
Resource Description: Each data set provides retailers with easier access to the most accurate nutrient data for the purpose of on-pack nutrition labeling and for nutrition claims. These data sets focus on the cuts identified by USDA Food Safety and Inspection Service (FSIS) proposed labeling regulations for fresh, single-ingredient meats.
\nFind the online version of this document at https://www.ars.usda.gov/ARSUserFiles/80400525/Data/Meat/Pork09.pdf
Resource Title: USDA Nutrient Data Set for Retail Pork Cuts, Release 2 (MS Excel download).
File Name: Pork09_Tbl.xls
Resource Description: The tables in \"The Revised USDA Nutrient Data Set for Fresh Pork\" imported into a Microsoft Excel spreadsheet.
\nFind the online version of this spreadsheet at https://www.ars.usda.gov/ARSUserFiles/80400525/Data/Meat/Pork09_Tbl.xls
Resource Title: Raw Ground Pork (MS Excel download).
File Name: EstNutrRawGrndPork4_28.xls
Resource Description: These tables provide nutrient profiles for raw ground pork from 4-28% fat, in increments of 1% fat, as determined by regression equations.
\nFind the online version of this spreadsheet at https://www.ars.usda.gov/ARSUserFiles/80400525/Data/Meat/EstNutrRawGrndPork4_28.xls
Resource Title: USDA Nutrient Data Set for Retail Veal Cuts.
File Name: Retail_Veal_Cuts.pdf
Resource Description: Each data set provides retailers with easier access to the most accurate nutrient data for the purpose of on-pack nutrition labeling and for nutrition claims. These data sets focus on the cuts identified by USDA Food Safety and Inspection Service (FSIS) proposed labeling regulations for fresh, single-ingredient meats.
\nFind the online version of this document at https://www.ars.usda.gov/ARSUserFiles/80400525/Data/Meat/Retail_Veal_Cuts.pdf
Resource Title: Veal Labeling Table (MS Excel download).
File Name: Veal_Labeling_Table.xlsx
Resource Description: The tables in \"The USDA Nutrient Data Set for Retail Veal Cuts\" imported into a Microsoft Excel spreadsheet.
\nFind the online version of this spreadsheet at https://www.ars.usda.gov/ARSUserFiles/80400525/Data/Meat/Veal_Labeling_Table.xlsx
Resource Title: USDA Nutrient Data Set for Retail Lamb Cuts.
File Name: Lamb_Labeling_Doc.pdf
Resource Description: Each data set provides retailers with easier access to the most accurate nutrient data for the purpose of on-pack nutrition labeling and for nutrition claims. These data sets focus on the cuts identified by USDA Food Safety and Inspection Service (FSIS) proposed labeling regulations for fresh, single-ingredient meats.
\nFind the online version of this document at https://www.ars.usda.gov/ARSUserFiles/80400525/Data/Meat/Lamb_Labeling_Doc.pdf
Resource Title: Lamb Labeling Table (MS Excel download).
File Name: Lamb_Labeling_Table.xlsx
Resource Description: The tables in \"The USDA Nutrient Data Set for Retail Lamb Cuts\" imported into a Microsoft Excel spreadsheet.
\nFind the online version of this spreadsheet at https://www.ars.usda.gov/ARSUserFiles/80400525/Data/Meat/Lamb_Labeling_Table.xlsx
The 2012 USDA Plant Hardiness Zone Map is the standard by which gardeners and growers can determine which plants are most likely to thrive at a location. The map is based on the average annual minimum winter temperature, divided into 10-degree F zones.
\nFor the first time, the map is available as an interactive GIS-based map, for which a broadband Internet connection is recommended, and as static images for those with slower Internet access. Users may also simply type in a ZIP Code and find the hardiness zone for that area.
\nNo posters of the USDA Plant Hardiness Zone Map have been printed. But state, regional, and national images of the map can be downloaded and printed in a variety of sizes and resolutions.
Resource Title: USDA Plant Hardiness Zone Map.
File Name: Web Page, url: https://planthardiness.ars.usda.gov/pages/view-maps
Includes interactive, static, and georeferenced maps, map and data downloads, and information about plant hardiness zones in the United States.
This is a public resource highlighting efforts at ARS in developing small RNA genome information for the potato genome. Updates and progress are reported here.
Resource Title: Web Page.
File Name: Web Page, url: https://potato.pw.usda.gov
This is a public resource highlighting efforts at ARS in developing genome information for the Citrus Carrizo Genome. Updates and progress are reported here.
Resource Title: Web Page.
File Name: Web Page, url: https://citrus.pw.usda.gov
USDA Table of Cooking Yields for Meat and Poultry, Release 2, is an update of previously released USDA data. Data in the updated table, accessible below, are measures of changes in meat and poultry weights resulting from moisture and fat losses during cooking. The table includes percentages for cooking yield, moisture change, and fat change for specific cuts of meat and poultry prepared in USDA research studies according to specific cooking protocols.
Resource Title: USDA Table of Cooking Yields for Meat and Poultry, Release 2.
File Name: USDA_CookingYields_MeatPoultry02.csv
Resource Description: USDA Table of Cooking Yields for Meat and Poultry, Release 2, is an update of previously released USDA data. Data in the updated table, accessible below, are measures of changes in meat and poultry weights resulting from moisture and fat losses during cooking. The table includes percentages for cooking yield, moisture change, and fat change for specific cuts of meat and poultry prepared in USDA research studies according to specific cooking protocols.
\nThis data was downloaded from the published online spreadsheet and converted to CSV format on November 15, 2017.
Resource Title: USDA Table of Cooking Yields for Meat and Poultry, Release 2 Data Dictionary.
File Name: USDA_CookingYields_MeatPoultry02_DD.csv
Resource Title: USDA Table of Cooking Yields for Meat and Poultry (2014).
File Name: USDA_CookingYields_MeatPoultry02.pdf
Resource Description: USDA Table of Cooking Yields for Meat and Poultry, Release 2, is an update of previously released USDA data. Data in the updated table, accessible below, are measures of changes in meat and poultry weights resulting from moisture and fat losses during cooking. The table includes percentages for cooking yield, moisture change, and fat change for specific cuts of meat and poultry prepared in USDA research studies according to specific cooking protocols.
Release 6, of this data set, replaces the previous release, Release 5, issued in 2003. The data set contains the factors for calculating retention of 26 vitamins, minerals and alcohol during food preparation. Factors for the other 25 food components in Release 4 are unchanged. Factors for total choline have been added to this release.
Resource Title: USDA Table of Nutrient Retention Factors, Release 6 (2007).
File Name: retn06.pdf
Resource Description: Release 6, of this data set, replaces the previous release, Release 5, issued in 2003. The data set contains the factors for calculating retention of 26 vitamins, minerals and alcohol during food preparation. Factors for the other 25 food components in Release 4 are unchanged. Factors for total choline have been added to this release.
Resource Title: USDA Table of Nutrient Retention Factors, Release 6 (2007).
File Name: NutrientRetention.csv
Resource Description: Release 6, of this data set, replaces the previous release, Release 5, issued in 2003. The data set contains the factors for calculating retention of 26 vitamins, minerals and alcohol during food preparation. Factors for the other 25 food components in Release 4 are unchanged. Factors for total choline have been added to this release.
\nThis data was downloaded from the published web site text version and converted to CSV format on November 16, 2017.
Resource Title: USDA Table of Nutrient Retention Factors, Release 6 (2007) Data Dictionary.
File Name: NutrientRetentionDD.csv
This database was developed with support from the Office of Dietary Supplements, National Institutes of Health for flavonoid intake studies. The database is a useful tool for flavonoid intake and health outcome studies for any population globally. It contains data for 29 individual flavonoid compounds in six subclasses of flavonoids for every food in a subset of 2,926 food items which provide the basis for the Food and Nutrient Database for Dietary Studies (FNDDS 4.1). Proanthocyanidins data are not included at the present time. For flavonoid intake data for the U.S. population based on NHANES 2007-08, please refer to the Food Surveys Research Group website.
\nResource Title: READ ME - USDA’s Expanded Flavonoid Database for the Assessment of Dietary Intakes Documentation and User Guide.
File Name: FDB-EXP.pdf
Resource Description: Information regarding documentation, development of the database, limitations, format, and references.
Resource Software Recommended: Adobe Acrobat Reader,url: http://www.adobe.com/prodindex/acrobat/readstep.html
Resource Title: Data Dictionary.
File Name: FDB_EXP_DD.pdf
Resource Title: FDB-EXP_R01-1.accdb.
File Name: FDB-EXP_R01-1.accdb_.zip
Resource Description: This file contains USDA's Expanded Flavonoid Database for the Assessment of Dietary Intakes imported into a MS Access database version 2007 or later. The file structure is the same as that of the USDA National Nutrient Database for Standard Reference.\n
The USDA-Agricultural Research Service carried out a water productivity field trial for irrigated maize (Zea mays L.) at the Limited Irrigation Research Farm (LIRF) facility in northeastern Colorado in 2008 through 2011. The dataset includes daily measurements of irrigation, precipitation, soil water storage, and plant growth; daily estimates of crop evapotranspiration; and seasonal measurement of crop water use and crop yield. Soil parameters and hourly and daily weather data are also provided. The dataset can be useful to validate and refine maize crop models.
\nThe data are presented in spreadsheet format. The primary data files are the four annual LIRF Maize 20xx.xlsx files that include the daily water balance and phenology, final yield and biomass data, and crop management logs. Annual LIRF Weather 20xx.xlsx files provide hourly and daily weather parameters including reference evapotranspiration. The LIRF Soils.xlsx file gives soil parameters. Each spreadsheet contains a Data Descriptions worksheet that provides worksheet or column specific information. Comments are embedded in cells with specific information. A LIRF photos.pdf file provides images of the experimental area, measurement processes and crop conditions.
\nPhoto credit Peggy Greb, ARS; copyright-free, public domain copyright policy.
Resource Title: LIRF Weather 2008.
File Name: LIRF Weather 2008.xlsx
Resource Description: LIRF hourly and daily weather data for 2008
Resource Title: LIRF Weather 2009.
File Name: LIRF Weather 2009.xlsx
Resource Description: LIRF hourly and daily weather data for 2009
Resource Title: LIRF Weather 2010.
File Name: LIRF Weather 2010.xlsx
Resource Description: LIRF hourly and daily weather data for 2010
Resource Title: LIRF Weather 2011.
File Name: LIRF Weather 2011.xlsx
Resource Description: LIRF hourly and daily weather data for 2011
Resource Title: LIRF Soils.
File Name: LIRF Soils.xlsx
Resource Description: LIRF soil maps, soil texture, moisture retention, and chemical constituents
Resource Title: LIRF Photo Log.
File Name: LIRF Photo Log.pdf
Resource Description: Photos of the LIRF Water Productivity field trials and instrumentation.
Resource Title: Data Dictionaries.
File Name: DataDictionary r1.xlsx
Resource Description: Data descriptions of all the data resources (also included in their respective data files).
Resource Title: LIRF Methodology.
File Name: LIRF Methodology r1.pdf
Resource Description: Description of data files, data, and data collection methodology for the LIRF 2008-2011 Water Productivity field trials.
Resource Title: LIRF Maize 2008.
File Name: LIRF Maize 2008 r1.xlsx
Resource Description: Water balance and yield data for 2008 LIRF field trial
Resource Title: LIRF Maize 2009.
File Name: LIRF Maize 2009 r1.xlsx
Resource Description: Water balance and yield data for 2009 LIRF field trial
Resource Title: LIRF Maize 2010.
File Name: LIRF Maize 2010 r1.xlsx
Resource Description: Water balance and yield data for 2010 LIRF field trial
Resource Title: LIRF Maize 2011.
File Name: LIRF Maize 2011 r1.xlsx
Resource Description: Water balance and yield data for 2011 LIRF field trial
The USDA-Agricultural Research Service carried out an experiment on water productivity in response to seasonal timing of irrigation of maize (Zea mays L.) at the Limited Irrigation Research Farm (LIRF) facility in northeastern Colorado (40°26’ N, 104°38’ W) starting in 2012. Twelve treatments involved different water availability targeted at specific growth-stages. This dataset includes data from the first two years, which were complete years with intact treatments. Data includes canopy growth and development (canopy height, canopy cover and LAI), irrigation, precipitation, and soil water storage measured periodically through the season; daily estimates of crop evapotranspiration; and seasonal measurement of crop water use, harvest index and crop yield. Hourly and daily weather data are also provided from the CoAgMET, Colorado’s network of meteorological information (https://coagmet.colostate.edu/ ; GLY04 station). Additional soil data can be found in a previous dataset (USDA-ARS Colorado Maize Water Productivity Dataset 2008-2011) also available from the Ag Data Commons. This previous dataset included six targeted treatments that were generally uniform through the season. This new dataset can be used to further validate and refine maize crop models.
\nThe data are presented in a spreadsheet format in individual sheets within one workbook. The first sheet in the work book provides a list of data descriptions. Two sheets (one sheet for each of the two years) provide the hourly weather data, with the exception of the precipitation data, which is included in the sheet with daily data per treatment. The weather data is from a weather station on site. Another sheet provides plot level data (harvest index, yield, annual ET, maximum LAI, stand density, total aboveground biomass) taken annually by plot (four plots per treatment). Another sheet provides LAI measured four times over each season per plot. The final sheet provides daily data per treatment over each season, including data needed to compute daily water balance. This sheet has LAI, crop growth stage, plant height, estimated root depth, interpolated canopy cover, ET coefficients, precipitation, and estimated deep percolation, evaporation, and soil water deficit at four soil depths.
\nList of files:\nLIRF small plots map 2012-2013\nLIRF maize annual_daily_hourly data 2012-2013
\nResource Title: LIRF 2012-2013 Maize database.
File Name: 2012-2013_Maize_Compiled database 06012018.xlsx
Resource Title: LIRF 2012-2013 Data Description.
File Name: Data Description 06012018.xlsx
Resource Title: LIRF 2012-2013 Plot Map.
File Name: Plot map 2012 2013.pdf
Resource Title: LIRF Data Dictionary.
File Name: Data_Dictionary_Water_Prod_2012.csv
The data are derived from the field monitoring of irrigated furrows from 1998 to 2016 at the research farm of the USDA/ARS-Northwest Irrigation and Water Research Laboratory in Kimberly, Idaho, USA (south-central Idaho). For each monitored furrow, irrigation inflow rates, outflow rates, and sediment concentrations were recorded periodically during the irrigation. A gated pipe conveyed irrigation water across the plots at the head, or inflow-end, of the furrows and adjustable spigots supplied water to each irrigated furrow. The methodology used to obtain the field data is described by Lentz and Sojka (2009). Inflows were measured by timing the filling rate of a known volume, and runoff were measured with long-throated, v-notch flumes. Outflows were measured and runoff samples collected at 30 min intervals during the first 1-3 hr of an irrigation, and every hour or two for the next 3 to 5 hr. If the set was continued for an additional 12 hr, two to four additional measurements were made. Immediately after each flume reading, sediment concentration in furrow streams were measured by collecting one-liter runoff samples from free-flowing flume discharge. The weight of sediment per liter of runoff was determined from the settled volume of sediment using the Imhoff-cone technique. Three Imhoff-cone sediment samples were collected from each treatment in each irrigation. These were filtered, and the papers dried and weighed. A calibration function relating the 30-min, settled-sediment volume to sediment mass-per-unit-volume of runoff was then calculated and used to convert settled sediment volume in cones to sediment mass.
\nThe field data for each study or year were analyzed using the WASHOUT program (Lentz and Sojka, 1995). The WASHOUT program produces an output file (filename.out), which become components of this Ag Data Commons data set.
\nFor many years and irrigations, furrows were monitored at one or more locations along the furrow, as well as at the end (bottom) of the furrow. In these cases, data for each position within the furrow are listed in the data set, labelled for example as \"Top\", \"Middle\", and \"Bottom\" (See Data Dictionary tab). For each furrow position the data represent the flow, infiltration, and runoff information for the length of furrow, which begins at its inflow end (top of the field) and ends at the defined furrow position. This distance is listed in the field data file for each furrow and irrigation.
\nAn Irrigation Data Summary is included as a tab in the data set spreadsheet. This is a summary list of the studies and irrigations that are included in the data set. Also included is a PAM-Application-Codes tab that lists description of the polyacrylamide (PAM) treatments that were employed in some of the included studies.
\nResource Title: Furrow Infiltration and Erosion Data, 1998 to 2016.
File Name: IrrigationData.xlsx
Resource Description: Furrow irrigation inflow, outflow, infiltration, and sediment load data\nSummary of studies and irrigations included in the data\nData Dictionary\nDescription of specific polyacrylamide treatments included in some of the studies
Resource Title: Data Dictionary - Kimberly, ID - Furrow Infiltration and Erosion Data, 1998 to 2016.
File Name: Kimberly-ID-Furrow-Inf-Erosion-DataDictionary1998-2016.csv
The USLE_1981-4 project data (Universal Soil Loss Equation) was collected from of (9) sites at (4) locations. A Swanson rotating boom simulator with (30) V-Jet 80100 nozzles applied rainfall at two different intensities, 60 or 130 mm/hour depending on how many nozzles were turned on. Specially designed flumes used with the FW-1 automatic water level recorder were used to obtain continuous runoff flow measurements. The sites in this data set followed a standardized rainfall simulator protocol which future studies by multiple investigators would continue to use. The data set contains rainfall simulator hydrologic and erosion data as well as vegetation and ground data collected in spring and fall from 1981 to 1984.
\nAll sites had (3) treatments with (2) replications. The vegetative plot manipulation treatments were: clipped, all vegetation clipped at ground surface and removed, bare, vegetation clipped and removed with all rocks larger than 5 mm removed, natural, vegetation left natural, tilled, all vegetation removed and soil tilled. Dataset data was published in Proceedings of the Rainfall Simulator Workshop 1985 Tucson, AZ in table format appendices. There is also (8) supporting data files with related site data. The raw data for the New Mexico site is not currently available.
Resource Title: USLE Project.
File Name: USLE Study.ZIP
Resource Description: USLE_81-4_Read Me file describes: general information, unresolved issues, data set contents, and list of references and Journal papers.\nUSLE_81-4_AllData.xls includes: runoff data, foliar cover, and ground cover data.
The UV-B Monitoring and Research Program operates a national network of solar irradiance monitoring stations equipped with instruments which provide measurements to meet the needs of both agricultural and atmospheric researchers. Two of the instruments deployed in the network are unique since they provide the important and useful direct component of solar irradiance without the expense and complexity of a solar tracker.\n\nInstrumentation includes:\n- Ultraviolet Multifilter Rotating Shadowband Radiometer: Direct, Total Horizontal, and Diffuse UV Irradiance at nominal 300, 305, 311, 317, 325, 332 and 368 nano-meter wavelengths\n- Photosynthetically Active Radiation Sensor: 400 - 700 nano-meter wavelengths\n- Broadband UVB-1 Pyranometer: (280-320 nm, erythemal weighted for skin damage)\n- Multifilter Rotating Shadowband Radiometer: Direct, Total Horizontal and Diffuse Visible Irradiance at nominal 415, 500, 615, 673, 870, 940 nano-meter wavelengths, plus one unfiltered (open) silicon photodiode of 300-1040 nm.\n- Barometric Pressure Sensor\n- Air Temperature and Relative Humidity Sensor\n- Downward Looking Photometer\n- UV-A biometer\n\nAll instruments have on-board data logging capability. Measurements are provided as 3-minute averages, aggregated from 15/20 second readings of each instruments' raw output voltage.
Resource Title: GeoData catalog record.
File Name: Web Page, url: https://geodata.nal.usda.gov/geonetwork/srv/eng/catalog.search#/metadata/AgronomyCenter_eaa_2015_March_30_1213
The Uniform Soybean Tests, Northern Region, in place since 1941, evaluate yield, disease resistance, and quality traits of public breeding lines from northern states of the USA and Canadian provinces. The annual reports which compile the test results (PDF format) are available, and new reports are added annually. The Uniform Soybean Tests are conducted and managed as a component of a CRIS project on Enhancing Resistance to Root Rot Pathogens of Soybeans in the USDA-ARS Crop Production and Pest Control Unit at West Lafayette, Indiana. The purpose of the Uniform Soybean Tests is to critically evaluate the best of the experimental soybean lines developed by federal and state research personnel in the U.S. and Canada, for their potential release as new varieties.
\nLocations include Iowa, Illinois, Indiana, Kansas, Michigan, Minnesota, Missouri, North Dakota, Nebraska, Ohio, Ontario, Quebec, Tennessee.
\nGermplasm exchange among breeding programs is the foundation of breeding progress. The purpose of the Uniform Soybean Test is to facilitate the free exchange of germplasm in an effort to maximize genetic diversity and provide well-adapted, stable breeding lines and varieties in the pursuit of breeding progress. Participants are encouraged to exchange germplasm within the legal guidelines pertaining to transgenic strains.
Resource Title: Website Pointer to Uniform Soybean Tests, Northern Region.
File Name: Web Page, url: https://www.ars.usda.gov/midwest-area/west-lafayette-in/crop-production-and-pest-control-research/docs/uniform-soybean-tests-northern-region/
The Uniform Soybean Tests, Northern Region, since 1941, evaluate yield, disease resistance and quality traits of public breeding lines from northern states of the USA and Canadian provinces. The annual reports which compile the test results are available, and new reports are added annually.
The Uniform Soybean Tests, Southern States, in place since 1943, evaluate yield, disease resistance, and quality traits of public breeding lines from the southern states of the USA. The annual reports which compile the test results (PDF format) are available, and new reports are added annually.
\nThe Uniform Soybean Testing Program has been directed toward the testing of elite breeding lines that ultimately leads to the release of varieties. Breeding lines are developed and evaluated in several participating federal and state research programs. As breeding lines demonstrate specific qualities in the individual programs, they are advanced to the preliminary and uniform regional tests conducted in cooperation with research workers in the southern states. This testing program enables breeders to evaluate new strains under a wide variety of conditions, and permits new strains to be put into production in a minimum amount of time.
\nA wide range of soil and climatic conditions exists in the regions. As an aid in recognizing regional adaptation, the region has been subdivided into five rather broad areas which still represent a wide range of soil types. These are: (1) the East Coast, consisting of the Coastal Plain and Tidewater areas of the eastern shore of Maryland, Virginia, North Carolina, and the upper half of South Carolina; (2) the Southeast, consisting primarily of the Coastal Plain soils of the Gulf Coast area, but also including similar soil from South Carolina, southward; (3) the Upper and Central South, including the Piedmont and loessial hill soils east of the Mississippi River; (4) the Delta area, composed of the alluvial soils along the Mississippi River from southern Missouri, southward; and (5) the West, comprising Arkansas and Louisiana (outside the Delta), Kansas, Oklahoma, and Texas. In the West, the potential soybean-growing areas would include alluvial soils, and the Gulf Coast of Louisiana.
\nGermplasm exchange among breeding programs is the foundation of breeding progress. The purpose of the Uniform Soybean Test is to facilitate the free exchange of germplasm in an effort to maximize genetic diversity and provide well-adapted, stable breeding lines and varieties in the pursuit of breeding progress. Participants are encouraged to exchange germplasm within the legal guidelines pertaining to transgenic strains.
Resource Title: Website Pointer to Uniform Soybean Tests, Southern States.
File Name: Web Page, url: https://www.ars.usda.gov/southeast-area/stoneville-ms/crop-genetics-research/docs/uniform-soybean-tests/
The Uniform Soybean Tests, Southern States, since 1943, evaluate yield, disease resistance and quality traits of public breeding lines from the southern states of the USA. The annual reports which compile the test results are available.
This Microsoft Excel workbook (2.712 Mb) contains spreadsheets that implement the Updated Bottom Up Solution for Triacylglycerols that allows Critical Ratios that provide structural information from mass spectrometry to be used to reconstitute the original mass spectra from which they came. It contains spreadsheets that use the non-nested equations (Critical Limits explicitly shown), as well as spreadsheets that used the nested equations (Case determinations made with Critical Limits not explicitly shown).
Resource Title: Updated Bottom Up Solution for Triacylglycerols.
File Name: Web Page, url: https://www.ars.usda.gov/research/software/download/?softwareid=459&modecode=80-40-05-05
download page
In situ denitrification rates in intact soil cores from the Upper Chesapeake Bay (UCB) LTAR site in PA quantified by directly measuring dinitrogen (N2) and nitrous oxide (N2O) production via the Nitrogen-Free Air Recirculation Method (N-FARM) from 2016-2018. 10-day laboratory incubations provided estimates of ancillary soil data, including microbial respiration and potential net N mineralization and nitrification.
Resource Title: Upper Chesapeake Bay Data Dictionary.
File Name: Upper Chesapeake Bay Data Dictionary.csv
Resource Description: Data Dictionary for UCB dataset.
Resource Title: Upper Chesapeake Bay Metadata.
File Name: Upper Chesapeake Bay Metadata.csv
Resource Description: Metadata for UCB dataset.
Resource Title: Upper Chesapeake Bay Dataset.
File Name: Upper Chesapeake Bay Dataset.csv
Resource Description: UCB dataset.
Climate variability, changing land use and management, and dynamic policy environments are the main reasons why long-term water quality data sets are needed to understand and predict possible water quality outcomes to alternative future scenarios. Such data sets were acquired by the USDA-ARS in three watersheds in Oklahoma: the Southern Great Plains Research Watershed (SGPRW), the Little Washita River Experimental Watershed (LWREW), and the Fort Cobb Reservoir Experimental Watershed (FCREW). Water quality data collection in the SGPRW began in the 1960s and continued through 1978, while that in the LWREW covered the 1960s to 1990 period. Data collection began in the FCREW in 2004 and continues through the present.\n\nThe data were collected from streams, unit source watersheds, groundwater wells, and reservoirs. It should be noted that various forms of P—reactive P, total P, soluble P, water-soluble P, particulate P, bioavailable P, total water-soluble P—were measured and are described here as given in the original data sets. No effort was made to determine the similarity of these variables.
Resource Title: GeoData catalog record.
File Name: Web Page, url: https://geodata.nal.usda.gov/geonetwork/srv/eng/catalog.search#/metadata/WashitaNutrient_jjm_2015-03-16_1025
Varroa Pop simulates the growth of Varroa mite population in honey bee colonies. The program demonstratres how Varroa mites influence colony population growth throughout the year. You can change many factors through the menus in the model such as the initial population size, queen egg laying potential, and mite reproduction rates, so you can see how these factors influence both colony and mite population growth. We hope that the model will help you understand the interactions between the honey bee and mite populations and provide insights on how best to control Varroa in colonies.
Resource Title: Varroa Pop download page.
File Name: Web Page, url: https://www.ars.usda.gov/research/software/download/?softwareid=75&modecode=20-22-05-00
This package contains perennial vegetation cover data measured using the line-intercept method from plots with various levels of herbivore exclusion on Jornada Experimental Range (JER) and Chihuahuan Desert Rangeland Research Center (CDRRC) lands. Study sites were established in 1995; one in black grama grassland and the other in creosotebush shrubland to compare the impact of herbivores on ecosystem processes between these vegetation types. Parallel studies were established at the Sevilleta LTER site (New Mexico, USA) and Mapimi Biosphere Reserve (Durango, Mexico). Each study site is 1 km by 0.5 km in area. Four replicate experimental blocks were randomly located at the grassland study site to measure vegetation responses using exclusion treatments including a) all mammalian herbivores, including cattle, lagomorphs, and rodents, b) lagomorphs and cattle only, c) cattle only, and d) control accessible to all herbivores. Because grazing cattle are excluded from the entire creosote site, only three replicate experimental blocks were randomly located there including a) all mammalian herbivores, including lagomorphs, and rodents, b) lagomorphs only, and c) control accessible to all herbivores. Thirty-six sampling points were positioned at 5.8-meter intervals on a systematically located 6 by 6 point grid within each plot. A permanent one-meter by one-meter vegetation measurement quadrat is located at each of the 36 points. The vegetation line-intercept measurements in this data package were made in fall 1995 and fall 2005 to coincide with low-level aerial photography campaigns. Three 29-meter lines were measured along three out of six rows of permanent vegetation quadrats. Intercept locations for live, perennial plant cover and bare ground were measured along each line at 10cm resolution, which is comparable to the resolution of the aerial photos. Plants were identified to species level where possible. The resulting cover data can used to ground-truth cover estimates from aerial photography or for comparison to annual measures of vegetation from 1 x 1 meter permanent vegetation quadrats. This study is complete.
Resource Title: Website Pointer to html file.
File Name: Web Page, url: https://portal.edirepository.org/nis/mapbrowse?scope=knb-lter-jrn&identifier=210086001
Webpage with information and links to data files for download
This package contains data from a study to quantify vegetation dynamics in response to lagomorph and shrub exclusion on the Jornada Experimental Range from 1938-2001. Data consist of vertical line intercept measures of the perennial grasses, suffretescents and shrubs. Sixteen plots at each of 3 sites (Gravelly Ridges, Dona Ana exclosure, and Parker Tank) were established in 1938-39. Plots were 21.3 x 21.3 m with a 7.6 m buffer zone between each. Plots were divided into east and west halves and 14 randomly located 10.65 m transects were located in each half plot. Vegetation was measured using vertical line intercepts in 1938, 1947, 1956, 1960, 1967, 1989, 1995, and 2001 for the Gravelly Ridges site, and in 1938/9, 1947, 1960, 1967, and 2001 for the Parker Tank and Dona Ana sites. The treatments include lagomorph exclusion (using wire fencing), shrub removal (hand grubbing at the ground surface), furrowing (shallow, hand raked furrows to trap surface water), and seeding (broadcast applications of seeds of native perennials). Seeding and furrowing treatments were only applied in 1939. Lagomorph exclusion has persisted since establishment, and shrub removal treatments have been reapplied immediately following all years of vegetation sampling. The dataset contains information on the site, year of data collection, plot number, line number, vegetation, and number of vegetation present on each line. This study is complete.For more information, refer to:Havstad, K.M., R.P. Gibbens, C.A. Knorr, and L.W. Murray. 1999. Long-term influences of shrub removal and lagomorph exclusion on Chihuahuan Desert vegetation dynamics. Journal of Arid Environments 42: 155-166. https://doi.org/10.1006/jare.1999.0516
Resource Title: Website Pointer to html file.
File Name: Web Page, url: https://portal.edirepository.org/nis/mapbrowse?scope=knb-lter-jrn&identifier=210392001
Webpage with information and links to data files for download
Simulated rainfall and overland-flow experiments are useful for enhancing understanding of surface hydrologic and erosion processes, quantifying runoff and erosion rates, and developing and testing predictive quantitative models. This extensive dataset (1021 experimental plots) consists of rainfall simulation (1300 plot runs, 0.5 m2 to 13 m2 scales) and overland flow (838 plot runs, ~9 m2 scale) experimental plot data coupled with associated measures of vegetation, ground cover, and surface soil properties across point to hillslope scales. The data were collected at three woodland-encroached sagebrush (Artemisia spp.) rangelands in the Great Basin, USA, under undisturbed/untreated conditions and 1 yr to 9 yr following fire and/or mechanical tree-removal treatments. The methodology employed and resulting experimental data contribute to quantifying and understanding scale-dependent surface hydrologic and erosion processes for Great Basin woodlands and sagebrush rangelands before and after tree removal and for sparsely vegetated sites elsewhere. The dataset is a valuable source for developing and testing hydrology and erosion models for applications to diverse vegetation and ground cover conditions. Lastly, the series of repeated measures in the dataset for some sites over time provides a valuable dataset for exploring long-term landscape vegetation and hydrologic and erosion responses to various land management practices and disturbances.
\nThe resulting collective dataset of 1021 experimental plots contains vegetation, ground cover, soils, hydrology, and erosion data collected across multiple spatial scales, diverse cover and surface conditions, three study sites, and five different study years. The collective dataset contains 57 plots at the hillslope scale (site characterization plots), 528 small-rainfall plots, 146 large-rainfall plots, and 290 overland-flow plots. The hydrology and erosion experiments yielded time series datasets for small-rainfall plot, large-rainfall plot, and overland-flow plot simulations. Some time series hydrographs and sedigraphs from rainfall and overland flow simulations were excluded due to various equipment failures. The final time series datasets consist of 1020 small-rainfall, 280 large-rainfall, and 838 overland-flow plot run hydrographs and sedigraphs, not excluding plots without runoff. Restricting the data to plots that generated runoff results in 749 small-rainfall, 251 large-rainfall, and 719 overland-flow plot simulation hydrographs and sedigraphs. Overall, the hydrology and erosion time series dataset amounts to 2138 hydrographs/sedigraphs including plots with zero runoff and 1719 hydrographs/sedigraphs for plots that generated runoff.
\nField experiments and data management were conducted as part of the Sagebrush Steppe Treatment Evaluation Project (SageSTEP, (www.sagestep.org) funded by the US Joint Fire Science Program, US Department of Interior (USDI) Bureau of Land Management, and US National Interagency Fire Center.\nThis dataset is contribution number 134 of the Sagebrush Steppe Treatment Evaluation Project.
\nSee README file for information regarding experimental design and methods.
", "title": "Vegetation, rainfall simulation, and overland flow experiments before and after tree removal in woodland-encroached sagebrush steppe: the SageSTEP hydrology study", "distribution": [ { "@type": "dcat:Distribution", "downloadURL": "https://ndownloader.figshare.com/files/44527421", "format": "pdf", "mediaType": "application/pdf", "title": "Table 1 - Site Attributes.pdf" }, { "@type": "dcat:Distribution", "downloadURL": "https://ndownloader.figshare.com/files/44527430", "format": "pdf", "mediaType": "application/pdf", "title": "Table 2 - Experimental Plots.pdf" }, { "@type": "dcat:Distribution", "downloadURL": "https://ndownloader.figshare.com/files/44527433", "format": "csv", "mediaType": "application/csv", "title": "site_characterization.csv" }, { "@type": "dcat:Distribution", "downloadURL": "https://ndownloader.figshare.com/files/44527436", "format": "csv", "mediaType": "text/plain", "title": "small_plots.csv" }, { "@type": "dcat:Distribution", "downloadURL": "https://ndownloader.figshare.com/files/44527442", "format": "csv", "mediaType": "text/plain", "title": "small_time_series.csv" }, { "@type": "dcat:Distribution", "downloadURL": "https://ndownloader.figshare.com/files/44527445", "format": "csv", "mediaType": "application/csv", "title": "large_plots.csv" }, { "@type": "dcat:Distribution", "downloadURL": "https://ndownloader.figshare.com/files/44527448", "format": "csv", "mediaType": "text/plain", "title": "large_time_series.csv" }, { "@type": "dcat:Distribution", "downloadURL": "https://ndownloader.figshare.com/files/44527454", "format": "csv", "mediaType": "application/csv", "title": "rill_plots.csv" }, { "@type": "dcat:Distribution", "downloadURL": "https://ndownloader.figshare.com/files/44527457", "format": "csv", "mediaType": "text/plain", "title": "rill_time_series.csv" }, { "@type": "dcat:Distribution", "downloadURL": "https://ndownloader.figshare.com/files/44527460", "format": "csv", "mediaType": "application/csv", "title": "soils.csv" }, { "@type": "dcat:Distribution", "downloadURL": "https://ndownloader.figshare.com/files/44527463", "format": "zip", "mediaType": "application/zip", "title": "Photos.zip" }, { "@type": "dcat:Distribution", "downloadURL": "https://ndownloader.figshare.com/files/44527466", "format": "csv", "mediaType": "application/csv", "title": "SageSTEP_Database_Data_Dictionary.csv" }, { "@type": "dcat:Distribution", "downloadURL": "https://ndownloader.figshare.com/files/44527469", "format": "txt", "mediaType": "text/plain", "title": "README_VegetationRainfallSimulation.txt" }, { "@type": "dcat:Distribution", "downloadURL": "https://ndownloader.figshare.com/files/44527472", "format": "txt", "mediaType": "text/plain", "title": "file_list_VegetationRainfallSimulation.txt" } ], "license": "https://www.usa.gov/publicdomain/label/1.0/", "bureauCode": [ "005:18" ], "modified": "2024-04-08", "publisher": { "@type": "org:Organization", "name": "Agricultural Research Service" }, "keyword": [ "rainfall simulation", "overland flow", "sagebrush", "erosion", "fire", "Great Basin", "hydrologic recovery", "infiltration", "interrill", "juniper", "pinyon", "islands of fertility", "rangeland", "restoration", "rills", "runoff", "sagebrush steppe", "soil water repellency", "woodland encroachment", "concentrated flow", "fire effects", "mastication", "mechanical treatments", "rainsplash", "rill", "sagebrush restoration", "SageSTEP", "sheetflow", "soil loss", "tree cutting", "tree shredding", "Wildfire", "woodland expansion", "data.gov", "ARS" ], "spatial": "{\"type\": \"MultiPoint\", \"coordinates\": [[-116.7775, 42.447222], [-115.114167, 39.454722], [-112.473333, 40.211667]]}" }, { "identifier": "10.15482/USDA.ADC/1416008", "accessLevel": "public", "contactPoint": { "hasEmail": "mailto:amy.tabb@ars.usda.gov", "fn": "Tabb, Amy" }, "programCode": [ "005:040" ], "description": "This record contains videos of apple trees acquired from a ground vehicle throughout the growing season at the USDA-ARS-AFRS (United States Department of Agriculture - Agricultural Research Service - Appalachian Fruit Research Station). Research in precision management methods in orchard crops revolve around locating objects of interest, namely flowers, fruitlets, and fruit, autonomously. This dataset is provided so that researchers without access to research plots or mature trees can experiment with the data acquired during the course of an ongoing project on apple flower estimation in images. The trees shown in these videos have a mixture of colors and growth habits. In particular, the four varieties represent one of each of the Lespinasse ideotypes.
\nReviewers of \"Multi-species fruit flower detection using a refined semantic segmentation network\" please find the relevant dataset here: Data from: Multi-species fruit flower detection using a refined semantic segmentation network
Resource Title: April 13 2017 sets 0 through 4.
File Name: April13_2017_0_through_4.zip
Resource Description: Videos acquired on April 13, 2017, during bloom. Sets 0 through 4. Notes about species are contained in each set's Details.txt file.
Resource Title: April 13 2017 set 5.
File Name: April13_2017_5.zip
Resource Description: Videos acquired on April 13, 2017, during bloom. Set 5. Notes about species are contained in each set's Details.txt file.
Resource Title: April 14 2017, sets 0 through 4.
File Name: April_14_2017_0_through_4.zip
Resource Description: Videos acquired on April 14, 2017, during bloom. Set 5. Notes about species are contained in each set's Details.txt file.
Resource Title: April 14 2017, sets 5-6.
File Name: April_14_2017_5_through_6.zip
Resource Description: Videos acquired on April 14, 2017, during bloom. Sets 5 and 6. Notes about species are contained in each set’s Details.txt file.
Resource Title: April 14 2017 set 7.
File Name: April_14_2017_7.zip
Resource Description: Videos acquired on April 14, 2017, during bloom. Set 7. Notes about species are contained in each set’s Details.txt file.
Resource Title: April 20 2017 sets 0 through 7 .
File Name: Apr20_2017_0_through_7.zip
Resource Description: Videos acquired on April 20, 2017, during bloom. Sets 0 through 7. Notes about species are contained in each set's Details.txt file.
Resource Title: April 18 2017 sets 0 through 3.
File Name: April_18_2017_0_through_3.zip
Resource Description: Videos acquired on April 18, 2017, during bloom. Sets 0 through 3. Notes about species are contained in each set’s Details.txt file.
Resource Title: April 18 2017 sets 4 through 7.
File Name: April_18_2017_4_through_7.zip
Resource Description: Videos acquired on April 18, 2017, during bloom. Set 4 through 7. Notes about species are contained in each set's Details.txt file.
Resource Title: April 18 2017 Set 8.
File Name: April_18_2017_8.zip
Resource Description: Videos acquired on April 18, 2017, during bloom. Set 8. Notes about species are contained in each set's Details.txt file.
Resource Title: April 20 2017 sets 8 .
File Name: Apr20_2017_8.zip
Resource Description: Videos acquired on April 20, 2017, during bloom. Set 8. Notes about species are contained in each set's Details.txt file.
Resource Title: April 26 2017 sets 0 through 7 .
File Name: Apr26_2017_0_through_7.zip
Resource Description: Videos acquired on April 26, 2017, during bloom. Sets 0 through 7. Notes about species are contained in each set's Details.txt file.
Resource Title: April 26 2017 set 8 .
File Name: Apr26_2017_8.zip
Resource Description: Videos acquired on April 26, 2017, during bloom. Set 8. Notes about species are contained in each set's Details.txt file.
Several years ago, our group released the Virtual Grower software to the public. Initially designed to help greenhouse growers determine heating costs and do simple simulations to figure out where heat savings could be achieved, it has slowly added features so that now, Virtual Grower can help not only identify those savings through different greenhouse designs, but predict crop growth, assist in scheduling, make real-time predictions of energy use, and see the impact of supplemental lighting on plant growth and development. In other words, the software can be a safety net and allow users to experiment with \"what if\" scenarios in a risk-free setting.
\nVirtual Grower 3.0 is the next installment in the software series. Released in August, 2011, this version is the first to be both Mac- and PC-compatible, meaning no one is excluded from being able to use the software. Return users will find the same easy-to-use sections for designing greenhouse structures, heating systems, and lighting systems, and adding up to 40 plant species or varieties to your simulation.
\nNew Features:
\nLike it? Don't like it? Wish we would change something? We want to hear from you. Please contact us through the help desk at virtualgrower@ars.usda.gov. Most of the features that are in the software now came from users like you. This is an ongoing project with no expiration date, so your suggestions will be considered and hopefully incorporated into the next version.
Resource Title: Virtual Grower 3.
File Name: Web Page, url: https://www.ars.usda.gov/research/software/download/?softwareid=309&modecode=50-82-05-00
download page
WASUIT is a computer program which predicts the
\n
\n
of the soil-water within a simulated crop root zone resulting from the use of a particular irrigation water of given composition and at a specified leaching fraction. It can be used to evaluate the effect of a given salinity level (or solute concentration) on crop yield and of a given sodicity level on soil permeability.
\nSystem Requirements:\nWATSUIT is written in Standard FORTRAN 77 and requires ANSI.SYS installed in your CONFIG.SYS file (i.e., DEVICE=C:\\DOS\\ANSI.SYS). The ANSI.SYS screen commands are used to clear your computer screen. If for some reason you do not have ANSI.SYS, the program will still run but will not your screen will not be cleared. MS-DOS 2.0 or later operating system and standard IBM 360 or 1.2 kbytes diskette drives are required.
Resource Title: WATSUIT download page.
File Name: Web Page, url: https://www.ars.usda.gov/research/software/download/?softwareid=107&modecode=20-36-15-00
Global warming is expected to lead to a more vigorous hydrological cycle, including more total rainfall and more frequent high intensity rainfall events. Rainfall amounts and intensities increased on average in the United States during the 20th century and, according to climate change models, they are expected to continue to increase during the 21st century. These rainfall changes, along with expected changes in temperature, solar radiation, and atmospheric CO2 concentrations, will have significant impacts on soil erosion rates. The processes involved in the impact of climate change on soil erosion by water are complex, involving changes in rainfall amounts and intensities, number of days of precipitation, ratio of rain to snow, plant biomass production, plant residue decomposition rates, soil microbial activity, evapo-transpiration rates, and shifts in land use necessary to accommodate a new climatic regime. WEPPCAT is a web-based erosion simulation tool that allows for the assessment of changes in erosion rates as a consequence of user-defined climate change scenarios. This tool is based on the USDA-ARS Water Erosion Prediction Project (WEPP) erosion model. It has the capability of taking into account all of the erosion-affecting processes listed above.
\nThis applications has been packaged into a virtual machine. Please fill out the form below to download the application.
Resource Title: WEPPCAT.
File Name: Web Page, url: https://www.ars.usda.gov/research/software/download/?softwareid=WEPPCAT&modecode=20-22-10-00
This applications has been packaged into a virtual machine. Please fill out the form below to download the application.
WISDEM simulates the variation in multi-species weed populations over time in response to crop rotation, tillage system, and specific weed management tactics and the consequent crop yield loss due to weed competition. Population dynamics of individual weed species are predicted from a limited number of parameters that can be derived from literature sources and expert opinion.
\nData to model the population dynamics and crop yield loss of multi-species weed populations is extremely limited as well as expensive and time-consuming to obtain. WISDEM simulates population dynamics of multi-species weed populations in response to crop rotation, tillage system, and specific weed management tactics as well as the resulting crop yield reduction from weed competition. The model uses an innovative structure for modeling weed population dynamics that requires only a small number of parameters and these can be readily derived from literature sources and regional surveys of weed experts. The structure is based on the general theory of density dependence of plant productivity and the extensive use of rectangular hyperbolic equations for describing crop yield as a function of weed density. Only two density-independent parameters are required for each species to represent differences in seed bank mortality, seedling emergence and maximum seed production. One equation is used to model crop yield loss and density-dependent weed seed production as a function of crop and weed density, relative time of weed and crop emergence and differences among species in competitive ability. WISDEM has been parameterized for 4 crops and 15 weeds of the Great Plains. A preliminary, limited evaluation provides evidence that predictions of yield loss from single species of weeds and the short term trajectories of changes in weed populations are biologically reasonable. We think the accuracy is sufficient for the goal of modeling general trends in population density accurately enough to highlight potential weed problems and solutions when comparing alternative crop management options for a field.
Resource Title: WISDEM.
File Name: Web Page, url: https://www.ars.usda.gov/research/software/download/?softwareid=182&modecode=30-12-30-20
download page
WQFS Study for Greenhouse gas Reduction through Agricultural Carbon Enhancement network in West Lafayette, Indiana\nRelative contributions of diverse, managed ecosystems to greenhouse gases are not completely documented. This study was conducted to estimate soil surface fluxes of carbon dioxide (CO2), methane (CH4), and nitrous oxide (N2 O) as affected by management practices and weather. Gas fluxes were measured by vented, static chambers in Drummer and Raub soil series during two growing seasons. Treatments evaluated were corn cropped continuously (CC) or in rotation with soybean (CS) and fertilized with in-season urea-ammonium nitrate (UAN) or liquid swine manure applied in the spring or fall. Soybean (SC) rotated with CS and restored prairie grass (RP) were also included. The CO2 fluxes correlated (P≤0.001) with soil temperature (ρ: 0.74) and accumulated rainfall 120 h before sampling (ρ: 0.53); N2O fluxes correlated with soil temperature (ρ: 0.34). Seasonal CO2–C emissions were not different across treatments (4.4 Mg ha−1 yr−1) but differed between years. Manured soils were net seasonal CH4–C emitters (0.159–0.329 kg ha−1 yr−1), whereas CSUAN and CCUAN Treatments significantly influenced seasonal N2O–N emissions (P< 0.001) and ranged from <1.0 kg ha−1yr−1in RP and SC to between 3 and 5 kg ha−1yr−1in CC (fall application) and CSUAN and >8 kg ha−1yr−1in CC (spring application); differences were driven by pulse emissions after N fertilization in concurrence with major rainfall events. These results suggest fall manure application, corn–soybean rotation, and restoration of prairies may diminish N2O emissions and hence contribute to global warming mitigation.
Resource Title: GeoData catalog record.
File Name: Web Page, url: https://geodata.nal.usda.gov/geonetwork/srv/eng/catalog.search#/metadata/10579353-ec7d-4274-af95-c2e1e4857fcd
The Southwest Watershed Research Center (SWRC) has operated Walnut Gulch Experimental Watershed (WGEW), located in the vicinity of Tombstone, Arizona, for more than 50 years. A 17 year (1990-2006) meteorological and soil hydrology database has been established by the USDA Agricultural Research Service, SWRC. Data have been acquired at 3 automated weather stations, 5 soil profile trench sites, and 19 locations dispersed across the watershed colocated with recording rain gauges. Meteorological elements measured at the weather stations include air temperature, relative humidity, wind speed, wind direction, barometric pressure, solar radiation, photosynthetically active radiation, and net radiation. Net radiation is measured at LHMet and KENMet. A single sensor is used to measure each variable at each AWS. Barometric pressure is sampled once and output at the output time step; all other sensors are sampled every 10 seconds and averaged at the output time step, either 20 or 60 minutes. Manufacturer supplied calibration or conversion factors are employed to report output in standard units.
Resource Title: GeoData catalog record.
File Name: Web Page, url: https://geodata.nal.usda.gov/geonetwork/srv/eng/catalog.search#/metadata/Walnutmeteorologic_jjm_2015-03-26_1049
An extensive precipitation database at the 149 km2 Walnut Gulch Experimental Watershed (WGEW) has been developed over the past 53 years with the first records starting in August 1953 and continuing to the present. The WGEW is a tributary of the San Pedro River, surrounds the town of Tombstone in southeastern Arizona, and has a drainage area of approximately 149 km2. Elevation of the watershed ranges from 1220 m to 1950 m above mean sea level (MSL). Average annual precipitation for the period of 1956-2005, as measured with six gauges, is roughly 312 mm, with approximately 60% falling during the summer monsoon. Precipitation consists almost solely of rainfall with relatively rare instances of hail and snowfall. From a historical high of 95 rain gauges, a current network of 88 gauges is operational. This constitutes one of the densest rain gauge networks in the world (0.6 gauges/km2) for watersheds greater than 10 km2. Through 1999, the network consisted of analog recording weighing rain gauges. In 2000, a newly designed digital gauge with telemetry was placed adjacent (1 m) to the analog gauges. Both the analog and digital networks of gauges were in operation from 2000 to 2005 to enable a comparative analysis of the two systems. The analog data were digitized from paper charts and were stored in breakpoint format. The digital data consist of rainfall depths at 1-min intervals during periods of rainfall.
Resource Title: GeoData catalog record.
File Name: Web Page, url: https://geodata.nal.usda.gov/geonetwork/srv/eng/catalog.search#/metadata/WalnutPrecipitation_jjm_2015-03-20_1018
The Walnut Gulch Experimental Watershed (WGEW) runoff database has the longest period of record of runoff in the world for a semiarid location, with data collection beginning in 1953. Runoff occurs at Walnut Gulch primarily as a result of convective thunderstorms during the months of July through September. Runoff volume and flow duration are correlated with drainage area as a result of the limited areal extent of runoff producing rainfall and transmission losses or infiltration of the flood wave into the channel alluvium. Runoff is measured at three ranges of watershed size: small, 0.0018-0.059 km2; medium, 0.35-1.60 km2; and large, 2.27-149 km2. The small watersheds are termed ‘‘unit source area watersheds'' and were established to quantify the interaction of rainfall intensity patterns, soils, vegetation, and management on the rates and amounts runoff and sediment production. The medium watersheds were established at preexisting small earthen dams or stock tanks to obtain inexpensive measurements of storm runoff volume and annual sediment yield. The large watersheds were established to quantify the effects of the spatial and temporal variability of thunderstorm rainfall and channel characteristics on water yield, peak discharge, and sediment yield. Runoff was originally measured using a stilling well, float, and analog stage recorders (Stevens A-35, Friez FD-4, Friez FW-1) with mechanical clocks to record the timing of the event. In 1999, digital recorders consisting of potentiometers attached to the stilling well gear mechanism and a Campbell Scientific CR-10 data logger were added to all of the runoff measurement stations. At present, both the analog and digital data are being collected and are archived.
Resource Title: GeoData catalog record.
File Name: Web Page, url: https://geodata.nal.usda.gov/geonetwork/srv/eng/catalog.search#/metadata/WalnutRunoff_jjm_2015-03-23_1223
The Walnut Gulch Experimental Watershed (WGEW) sediment collection program, established in 1953, provides event-based data for semiarid rangeland erosion, sediment transport, and yield research. Sediment loads carried through the channel network on the WGEW are high, but are typical of semiarid rangelands, and are influenced by soils, geologic parent material, and geomorphology. Typical monsoon thunderstorm generated flows in dryland regions are characterized by high velocities, short durations, and heavy and coarse sediment loads. Sediment is measured in conjunction with discharge measurements [Stone et al., 2008] that are integral to converting sample values to runoff event-based values. Sampling initiated in the 1960s was done with point intake pump samplers. The single point sampler intake tubes were later replaced with tubes that rise in response to flow and are perforated to collect depth integrated samples. Sampling with each of these systems is limited to suspended sediment smaller than the 0.635 cm diameter of the intake slots. Pump samplers are in use at the outlet of small watersheds where overland flow is the dominant hydrologic driver of sediment transport, and particles are small. As watershed size increases on the WGEW, in general, the channel network can dominate sediment delivery processes as it evolves to carry an increasingly coarse, and vertically sorted, sediment load. A traversing slot sediment sampler was designed in response to limitations of alternative sampling methods such as the pump sampler. The data collection network was expanded in 2002 and pit traps were added below the overfall at flumes 63.103 and 63.104. Analysis of these data, and efforts to process and make available the historic data, are ongoing.
Resource Title: GeoData catalog record.
File Name: Web Page, url: https://geodata.nal.usda.gov/geonetwork/srv/eng/catalog.search#/metadata/WalnutSediment_jjm_2015-03-23_1301
Atmospheric carbon dioxide and moisture concentrations were measured with an infrared gas analyzer (IRGA) (LI-6262, LI-COR, Inc. Lincoln, Nebraska, USA). Measurements were made from 1997 through the present at the Kendall site. The meteorological data and Bowen ratio energy balance systems (BREB) (Model 023/CO2 Campbell Scientific Inc., Logan, Utah, USA) data are used to calculate carbon dioxide and evapotranspiration (ET) fluxes. The stored Bowen ration instrument data from the measurement site were transmitted by radio daily to our research station in Tombstone, AZ. From there, they were transferred through an Internet connection to Tucson, AZ. The data were then divided into 5-day increments and inserted into a Quattro1 Pro spreadsheet file which had all the formulations to calculate flux of soil heat, latent heat, sensible heat, evapotranspiration rates (ET), and CO2 rates on the 20-min time step of the data. All instrument and calculated data were graphed in the spreadsheet file and thoroughly reviewed for any instrument problems or data stream collection issues.\n\nCarbon dioxide and water fluxes are important components of watershed function. In order to study carbon dioxide and water flux as they exist over the Walnut Gulch Experimental Watershed (WGEW), two sites were selected on the basis of their ecosystem composition, one site being dominated by shrubs and the other a grass dominated plant community. The grass site is identified as Kendall (109560800W, 314401000N; elevation; 1526 m). The soils at the Kendall site are a complex of Stronghold (coarse-loamy, mixed, thermic Ustollic Calciorthids), Elgin (fine, mixed, thermic, Ustollic Paleargids), and McAllister (fine-loamy, mixed, thermic, Ustollic Haplargids) soils, with Stronghold the dominant soil [NRCS Soil Survey, 2003]. Slopes range from 4 to 9%. The Stronghold surface A horizon (0-3 cm) contains 670 g kg1 sand, 160 g kg1 silt, and 170 g kg1 clay with 790 g kg1 coarse fragments >2 mm, 11 g kg1 organic carbon, and 7 g kg1 inorganic carbon. Vegetation is dominated by herbaceous plants, predominately black grama (Bouteloua eriopoda (Torr.) Torr.), sideoats grama (Bouteloua curtipendula (Michx.) Torr.), three-awn (Aristida sp.) and cane beardgrass (Bothriochloa barbinodis (Lag.) Herter). Vegetation canopy height at the grass site ranged from 0.4 to 0.7 m during the growing season.
Resource Title: GeoData catalog record.
File Name: Web Page, url: https://geodata.nal.usda.gov/geonetwork/srv/eng/catalog.search#/metadata/WalnutKendall_jjm_2015-03-20_1241
The meteorological data and Bowen ratio energy balance systems (BREB) (Model 023/CO2 Campbell Scientific Inc., Logan, Utah, USA) data are used to calculate carbon dioxide and evapotranspiration (ET) fluxes at Lucky Hills. The stored Bowen ration instrument data from the measurement site were transmitted by radio daily to our research station in Tombstone, AZ. From there, they were transferred through an Internet connection to Tucson, AZ. The data were then divided into 5-day increments and inserted into a Quattro1 Pro spreadsheet file which had all the formulations to calculate flux of soil heat, latent heat, sensible heat, evapotranspiration rates (ET), and CO2 rates on the 20-min time step of the data. All instrument and calculated data were graphed in the spreadsheet file and thoroughly reviewed for any instrument problems or data stream collection issues. The shrub site is known as Lucky Hills, elevation 1372 m. The soil at this site is coarse-loamy, mixed, thermic Ustochreptic Calciorthids) with 3 to 8% slopes [NRCS Soil Survey, 2003]. The surface A horizon (0-6 cm) contains 650 g kg1 sand, 290 g kg1 silt, and 60 g kg1 clay with 290 g kg1 coarse fragments >2 mm, 8 g kg1 organic carbon, and 21 g kg1 inorganic carbon. Vegetation is dominated by creosotebush (Larrea tridentata (D.C.) Cov.), whitethorn Acacia (Acacia constricta Benth. (Fabaceae)), and tarbush (Flourensia cernua D.C. (Asteraceae)). Vegetation canopy height maintained an almost constant 1 m height.\n Carbon dioxide and water fluxes are important components of watershed function. In order to study carbon dioxide and water flux as they exist over the Walnut Gulch Experimental Watershed (WGEW), two sites were selected on the basis of their ecosystem composition, one site being dominated by shrubs and the other a grass dominated plant community. Lucky Hills is the shrub site. Measurements were made from 1997 through the present at the two sites.
Resource Title: GeoData catalog record.
File Name: Web Page, url: https://geodata.nal.usda.gov/geonetwork/srv/eng/catalog.search#/metadata/WalnutLuckyHills_jjm_2015-03-20_1241
The Water Erosion Prediction Project (WEPP) model is a process-based, distributed parameter, continuous simulation, erosion prediction model for use on personal computers running Windows 95/98/NT/2000/XP/Vista/Windows7. The current model version (v2012.8) available for download is applicable to hillslope erosion processes (sheet and rill erosion), as well as simulation of the hydrologic and erosion processes on small watersheds. Included in the download package is the WEPP model (version 2012.8), WEPP Windows interface (August 2012), CLIGEN climate generators (versions 4.3 and 5.3), documentation and example data.
\nThe objective of the Water Erosion Prediction Project is to develop new generation prediction technology for use by the USDA-Natural Resources Conservation Service, USDA-Forest Service, USDI-Bureau of Land Management, and others involved in soil and water conservation and environmental planning and assessment. This improved erosion prediction technology is based on modern hydrologic and erosion science, is process-oriented, and is computer-implemented. This document is a detailed description of the WEPP erosion model as developed for application to small watersheds and hillslope profiles within those watersheds. The WEPP erosion model is a continuous simulation computer program which predicts soil loss and sediment deposition from overland flow on hillslopes, soil loss and sediment deposition from concentrated flow in small channels, and sediment deposition in impoundments. In addition to the erosion components, it also includes a climate component which uses a stochastic generator to provide daily weather information, a hydrology component which is based on a modified Green-Ampt infiltration equation and solutions of the kinematic wave equations, a daily water balance component, a plant growth and residue decomposition component, and an irrigation component. The WEPP model computes spatial and temporal distributions of soil loss and deposition, and provides explicit estimates of when and where in a watershed or on a hillslope that erosion is occurring so that conservation measures can be selected to most effectively control soil loss and sediment yield.
Resource Title: WEPP Downloads.
File Name: Web Page, url: https://www.ars.usda.gov/midwest-area/west-lafayette-in/national-soil-erosion-research/docs/wepp/wepp-downloads/
The Water Quality Portal (WQP) is a cooperative service sponsored by the United States Geological Survey (USGS), the Environmental Protection Agency (EPA), and the National Water Quality Monitoring Council (NWQMC). It serves data collected by over 400 state, federal, tribal, and local agencies. Water quality data can be downloaded in Excel, CSV, TSV, and KML formats. Fourteen site types are found in the WQP: aggregate groundwater use, aggregate surface water use, atmosphere, estuary, facility, glacier, lake, land, ocean, spring, stream, subsurface, well, and wetland. Water quality characteristic groups include physical conditions, chemical and bacteriological water analyses, chemical analyses of fish tissue, taxon abundance data, toxicity data, habitat assessment scores, and biological index scores, among others. Within these groups, thousands of water quality variables registered in the EPA Substance Registry Service (https://iaspub.epa.gov/sor_internet/registry/substreg/home/overview/home.do) and the Integrated Taxonomic Information System (https://www.itis.gov/) are represented. Across all site types, physical characteristics (e.g., temperature and water level) are the most common water quality result type in the system.
\nThe Water Quality Exchange data model (WQX; http://www.exchangenetwork.net/data-exchange/wqx/), initially developed by the Environmental Information Exchange Network, was adapted by EPA to support submission of water quality records to the EPA STORET Data Warehouse [USEPA, 2016], and has subsequently become the standard data model for the WQP.
\nContributing organizations:
\nThe Advisory Committee on Water Information (ACWI) represents the interests of water information users and professionals in advising the federal government on federal water information programs and their effectiveness in meeting the nation's water information needs.
\nThe Agricultural Research Service (ARS) is the U.S. Department of Agriculture's chief in-house scientific research agency, whose job is finding solutions to agricultural problems that affect Americans every day, from field to table. ARS conducts research to develop and transfer solutions to agricultural problems of high national priority and provide information access and dissemination to, among other topics, enhance the natural resource base and the environment. Water quality data from STEWARDS, the primary database for the USDA/ARS Conservation Effects Assessment Project (CEAP) are ingested into WQP via a web service.
\nThe Environmental Protection Agency (EPA) gathers and distributes water quality monitoring data collected by states, tribes, watershed groups, other federal agencies, volunteer groups, and universities through the Water Quality Exchange framework in the STORET Warehouse.
\nThe National Water Quality Monitoring Council (NWQMC) provides a national forum for coordination of comparable and scientifically defensible methods and strategies to improve water quality monitoring, assessment, and reporting. It also promotes partnerships to foster collaboration, advance the science, and improve management within all elements of the water quality monitoring community.
\nThe United States Geological Survey (USGS) investigates the occurrence, quantity, quality, distribution, and movement of surface waters and ground waters and disseminates the data to the public, state, and local governments, public and private utilities, and other federal agencies involved with managing the United States' water resources.
Resource Title: Website Pointer for Water Quality Portal.
File Name: Web Page, url: https://www.waterqualitydata.us/
The Water Quality Portal (WQP) is a cooperative service sponsored by the United States Geological Survey (USGS), the Environmental Protection Agency (EPA), and the National Water Quality Monitoring Council (NWQMC). It serves data collected by over 400 state, federal, tribal, and local agencies. Links to Download Data, User Guide, Contributing Organizations, National coverage by state.
\n\n\n
WeedCast Version 4
\nThe WeedCast Software Suite is a decision aid that currently includes the WeedCast and WheatScout models. These models were created by the USDA ARS and the University of Wisconsin. The software is written in Java and is free to download and use. The source code is released under the GPL.
\nWhat is WeedCast?
\nWeedCast is an easy to use software program that forecasts three types of weed growth: Emergence Potential, Emergence Timing, and Seedling Height. The forcasted data provides valuable information that can be used to aid in making weed management decisions. WeedCast is designed to function with a minimal amount of input.
\nSelect the weed or weeds of interest and the following site properties using list boxes: Last Year's Crop, Tillage System, Soil Type, and Soil Water Content
\nEnter your local weather information using a simple spreadsheet editor.
\nWork in progress: Download your weather data!
\nEnter a date range and click view output to see your forcasts.
\nResulting data is displayed in a spreadsheet form and may be graphed from within the program.
\nWhat is WheatScout?
\nWheatScout is a decision aid that predicts the effects of a variety of herbicides on green foxtail and wild oat in wheat crops. It requires similar information to Weedcast, but also requires some scouting information.
\nDownload WeedCast 4.0 now.
\nIn addition, you may be interested in viewing our:
\nWeedCast Source Code will be coming soon
\nResource Title: WeedCast Version 4.
File Name: Web Page, url: https://www.ars.usda.gov/research/software/download/?softwareid=112&modecode=50-60-05-00
download page
Software for learning about the benefits of site-specific weed management compared to a uniform herbicide application. No GIS software is needed. The benefits are predicted from weed maps drawn by the user.
\nHerbicide use may be reduced 30 to 80% without impacting crop yield with site-specific weed management. Herbicide use is varied within a field to match the variation in the weed population. However, it is not always clear that the reduction in herbicide and other benefits of site-specific weed management will justify the cost and that future weed control will not be compromised. The outcomes of site-specific weed management vary with the composition and spatial distribution of the weed population, possible herbicide treatments and the resolution of variable management. WeedSite software was developed for predicting the benefits of postemergence site-specific weed management in irrigated corn and how the benefits vary with the weed population and the approach for variable herbicide application. Georeferenced weed maps and GIS software are not needed. Net gain from site-specific weed management, area of the field not treated, herbicide use and cost, yield loss from weed competition, and weeds left in the field are all calculated from hand drawn weed maps. Results can be mapped. WeedSite is useful for educating growers, agricultural consultants and students about the potential benefits of postemergence site-specific weed management because predictions are consistent with what is known about the variation in the benefits of site-specific weed management. Also, users specify the distribution of weeds in a field, so the results may be more relevant to them than information from research studies.
\nThe installation package includes a user's manual.
Resource Title: WeedSite.
File Name: Web Page, url: https://www.ars.usda.gov/research/software/download/?softwareid=181&modecode=30-12-30-20
download page
The Weevils of North America (WoNA) (http://symbiota4.acis.ufl.edu/scan/portal/checklists/checklist.php?cl=1) is an emerging resource for occurrence information, habitus photographs, legacy descriptions, and interactive identification keys for the almost 400 genera and 3300 species of weevils (Coleoptera: Curculionoidea) in North America, led by the Arizona State University Frank F. Hasbrouck Insect Collection (ASUHIC) group (NMF) and the Systematic Entomology Laboratory (USDA-SEL) (MLC). The majority of specimens stem from the Charles W. O'Brien (CWOB) weevil collection, and Dr. O'Brien's vast and generous contributions to this effort are hereby kindly acknowledged. We also acknowledge support from the United States Department of Agriculture.
\nFor more information about this dataset, contact\nMaria Lourdes Chamorro: lourdes.chamorro@ars.usda.gov\nNico Franz: nico.franz@asu.edu
Resource Title: Weevils of North America (WoNA).
File Name: Web Page, url: http://symbiota4.acis.ufl.edu/scan/portal/checklists/checklist.php?cl=1
Link to Weevils of North America (WoNA) web site.
This dataset consists of four years of weighing lysimeter data for alfalfa grown at the USDA-ARS Conservation and Production Laboratory (CPRL), Soil and Water Management Research Unit (SWMRU), Bushland, Texas (Lat. 35.186714°, Long. -102.094189°, elevation 1170 m above MSL) in 1996 through 1999. Alfalfa was grown on two large, precision weighing lysimeters, each in the center of a 4.44 ha square field. The weighing lysimeters were used to measure mass, which was converted to relative soil water storage with 0.05 mm accuracy at 5-minute intervals, and the 5-minute change in soil water storage was used along with precipitation and irrigation amounts to calculate crop evapotranspiration (ET), which is reported at 15-minute intervals. Although a quality control process was used, the ET data in this dataset are considered raw data. Advanced algorithms for detection of precipitation, dew and frost were applied in a separate process to determine ET values that are reported in files in a dataset entitled \"Evapotranspiration and Water Balance Data for The Bushland, Texas Alfalfa Datasets\". Those files have \"water-balance\" in their names. Each lysimeter was equipped with a suite of instruments to sense wind speed, air temperature and relative humidity, components of the radiation balance (e.g., net radiation, incoming and reflected shortwave, photosynthetically active radiation (PAR), incoming and reflected longwave, thermal infrared emitted by the plant/soil surface), soil heat flux, soil temperature, and soil volumetric water content at certain depths. Not all properties were always sensed in any one year; and instruments used changed from season to season, which are reasons that subsidiary datasets and data dictionaries for each season are required.
\nThese datasets originate from research aimed at determining crop water use (ET), reference \"tall crop\" ET, crop coefficients for use in ET-based irrigation scheduling based on a reference ET, crop growth, yield, harvest index, and crop water productivity as affected by irrigation method, timing, amount (full or some degree of deficit), agronomic practices, cultivar, and weather. Prior publications have focused on alfalfa ET, reference ET, crop coefficients, and crop water productivity. Crop coefficients have been used by ET networks. The data have utility for testing simulation models of crop ET, reference \"tall crop\" ET, growth, and yield and have been used by both USDA and university researchers.
Resource Title: 1996 Bushland, TX, East Alfalfa Weighing Lysimeter and Microclimate Data.
File Name: 1996_Alfalfa_E_Lys_ClimDat.xlsx
Resource Description: This dataset consists of weighing lysimeter data for alfalfa grown at the USDA-ARS Conservation and Production Laboratory (CPRL), Soil and Water Management Research Unit (SWMRU), Bushland, Texas (Lat. 35.186714°, Long. -102.094189°, elevation 1170 m above MSL). This particular dataset contains lysimeter soil water storage and drainage data, and data from in-soil and above-soil sensors. Properties sensed included wind speed, air temperature and relative humidity, components of the radiation balance (e.g., net radiation, incoming and reflected shortwave, photosynthetically active radiation (PAR), incoming and reflected longwave, thermal infrared emitted by the plant/soil surface), soil heat flux, soil temperature, and soil volumetric water content at certain depths. Not all properties where always sensed in any one year.
Resource Title: 1997 Bushland, TX, East Alfalfa Weighing Lysimeter and Microclimate Data.
File Name: 1997_Alfalfa_E_Lys_ClimDat.xlsx
Resource Description: This dataset consists of weighing lysimeter data for alfalfa grown at the USDA-ARS Conservation and Production Laboratory (CPRL), Soil and Water Management Research Unit (SWMRU), Bushland, Texas (Lat. 35.186714°, Long. -102.094189°, elevation 1170 m above MSL). This particular dataset contains lysimeter soil water storage and drainage data, and data from in-soil and above-soil sensors. Properties sensed included wind speed, air temperature and relative humidity, components of the radiation balance (e.g., net radiation, incoming and reflected shortwave, photosynthetically active radiation (PAR), incoming and reflected longwave, thermal infrared emitted by the plant/soil surface), soil heat flux, soil temperature, and soil volumetric water content at certain depths. Not all properties where always sensed in any one year.
Resource Title: 1998 Bushland, TX, East Alfalfa Weighing Lysimeter and Microclimate Data.
File Name: 1998_Alfalfa_E_Lys_ClimDat.xlsx
Resource Description: This dataset consists of weighing lysimeter data for alfalfa grown at the USDA-ARS Conservation and Production Laboratory (CPRL), Soil and Water Management Research Unit (SWMRU), Bushland, Texas (Lat. 35.186714°, Long. -102.094189°, elevation 1170 m above MSL). This particular dataset contains lysimeter soil water storage and drainage data, and data from in-soil and above-soil sensors. Properties sensed included wind speed, air temperature and relative humidity, components of the radiation balance (e.g., net radiation, incoming and reflected shortwave, photosynthetically active radiation (PAR), incoming and reflected longwave, thermal infrared emitted by the plant/soil surface), soil heat flux, soil temperature, and soil volumetric water content at certain depths. Not all properties where always sensed in any one year.
Resource Title: 1999 Bushland, TX, East Alfalfa Weighing Lysimeter and Microclimate Data.
File Name: 1999_Alfalfa_E_Lys_ClimDat.xlsx
Resource Description: This dataset consists of weighing lysimeter data for alfalfa grown at the USDA-ARS Conservation and Production Laboratory (CPRL), Soil and Water Management Research Unit (SWMRU), Bushland, Texas (Lat. 35.186714°, Long. -102.094189°, elevation 1170 m above MSL). This particular dataset contains lysimeter soil water storage and drainage data, and data from in-soil and above-soil sensors. Properties sensed included wind speed, air temperature and relative humidity, components of the radiation balance (e.g., net radiation, incoming and reflected shortwave, photosynthetically active radiation (PAR), incoming and reflected longwave, thermal infrared emitted by the plant/soil surface), soil heat flux, soil temperature, and soil volumetric water content at certain depths. Not all properties where always sensed in any one year.
This dataset consists of six years of weighing lysimeter data for six seasons of maize (Zea mays, L., also known as corn in the United States) grown for grain at the USDA-ARS Conservation and Production Laboratory (CPRL), Soil and Water Management Research Unit (SWMRU), Bushland, Texas (Lat. 35.186714°, Long. -102.094189°, elevation 1170 m above MSL) for 1989, 1990, 1994, 2013, 2016, and 2018. Maize was grown on four large, precision weighing lysimeters, each in the center of a 4.44 ha square field. The weighing lysimeters were used to measure mass, which was converted to relative soil water storage with 0.05 mm accuracy at 5-minute intervals, and the 5-minute change in soil water storage was used along with precipitation and irrigation amounts to calculate crop evapotranspiration (ET), which is reported at 15-minute intervals. Although a quality control process was used, the ET data in this dataset are considered raw data. Advanced algorithms for detection of precipitation, dew and frost were applied in a separate process to determine ET values that are reported in files in a dataset entitled \"Evapotranspiration and Water Balance Data for The Bushland, Texas Maize for Grain Datasets\". Those files have \"water-balance\" in their names. Each lysimeter was equipped with a suite of instruments to sense wind speed, air temperature and relative humidity, components of the radiation balance (e.g., net radiation, incoming and reflected shortwave, photosynthetically active radiation (PAR), incoming and reflected longwave, thermal infrared emitted by the plant/soil surface), soil heat flux, soil temperature, and soil volumetric water content at certain depths. Not all properties were always sensed in any one year; and instruments used changed from season to season, which are reasons that subsidiary datasets and data dictionaries for each season are required.
These datasets originate from research aimed at determining crop water use (ET), crop coefficients for use in ET-based irrigation scheduling based on a reference ET, crop growth, yield, harvest index, and crop water productivity as affected by irrigation method, timing, amount (full or some degree of deficit), agronomic practices, cultivar, and weather. Prior publications have focused on maize ET, crop coefficients, and crop water productivity. Crop coefficients have been used by ET networks. The data have utility for testing simulation models of crop ET, growth, and yield and have been used by the Agricultural Model Intercomparison and Improvement Project (AgMIP), by OPENET, and by many others for testing, and calibrating models of ET that use satellite and/or weather data.
Resources in this dataset:
This dataset consists of two years of weighing lysimeter data for sunflower grown at the USDA-ARS Conservation and Production Laboratory (CPRL), Soil and Water Management Research Unit (SWMRU), Bushland, Texas (Lat. 35.186714°, Long. -102.094189°, elevation 1170 m above MSL) in 2009 and 2011. Sunflower was grown on two large, precision weighing lysimeters, each in the center of a 4.44 ha square field. The weighing lysimeters were used to measure mass, which was converted to relative soil water storage with 0.05 mm accuracy at 5-minute intervals, and the 5-minute change in soil water storage was used along with precipitation and irrigation amounts to calculate crop evapotranspiration (ET), which is reported at 15-minute intervals. Although a quality control process was used, the ET data in this dataset are considered raw data. Advanced algorithms for detection of precipitation, dew and frost were applied in a separate process to determine ET values that are reported in files in a dataset entitled \"Evapotranspiration and Water Balance Data for The Bushland, Texas Sunflower Datasets\". Those files have \"water-balance\" in their names. Each lysimeter was equipped with a suite of instruments to sense wind speed, air temperature and relative humidity, components of the radiation balance (e.g., net radiation, incoming and reflected shortwave, photosynthetically active radiation (PAR), incoming and reflected longwave, thermal infrared emitted by the plant/soil surface), soil heat flux, soil temperature, and soil volumetric water content at certain depths. Not all properties were always sensed in any one year; and instruments used changed from season to season, which are reasons that subsidiary datasets and data dictionaries for each season are required.
\nThese datasets originate from research aimed at determining crop water use (ET), crop coefficients for use in ET-based irrigation scheduling based on a reference ET, crop growth, yield, harvest index, and crop water productivity as affected by irrigation method, timing, amount (full or some degree of deficit), agronomic practices, cultivar, and weather. Prior publications have focused on sunflower ET, crop coefficients, crop water productivity, and simulation modeling of crop growth, water use, and yield. Crop coefficients have been used by ET networks. The data have utility for testing simulation models of crop ET, growth, and yield and have been used by both USDA and university researchers.
Resource Title: 2009 Bushland, TX, East Sunflower Weighing Lysimeter and Microclimate Data.
File Name: 2009_East_Sunflower_Lys_ClimDat.xlsx
Resource Description: This dataset consists of weighing lysimeter data for sunflower grown at the USDA-ARS Conservation and Production Laboratory (CPRL), Soil and Water Management Research Unit (SWMRU), Bushland, Texas (Lat. 35.186714°, Long. -102.094189°, elevation 1170 m above MSL). This particular dataset contains lysimeter soil water storage and drainage data, and data from in-soil and above-soil sensors. Properties sensed included wind speed, air temperature and relative humidity, components of the radiation balance (e.g., net radiation, incoming and reflected shortwave, photosynthetically active radiation (PAR), incoming and reflected longwave, thermal infrared emitted by the plant/soil surface), soil heat flux, soil temperature, and soil volumetric water content at certain depths. Not all properties where always sensed in any one year.
Resource Title: 2011 Bushland, TX, East Sunflower Weighing Lysimeter and Microclimate Data.
File Name: 2011_East_Sunflower_Lys_ClimDat.xlsx
Resource Description: This dataset consists of weighing lysimeter data for sunflower grown at the USDA-ARS Conservation and Production Laboratory (CPRL), Soil and Water Management Research Unit (SWMRU), Bushland, Texas (Lat. 35.186714°, Long. -102.094189°, elevation 1170 m above MSL). This particular dataset contains lysimeter soil water storage and drainage data, and data from in-soil and above-soil sensors. Properties sensed included wind speed, air temperature and relative humidity, components of the radiation balance (e.g., net radiation, incoming and reflected shortwave, photosynthetically active radiation (PAR), incoming and reflected longwave, thermal infrared emitted by the plant/soil surface), soil heat flux, soil temperature, and soil volumetric water content at certain depths. Not all properties where always sensed in any one year.
This dataset consists of six years of weighing lysimeter data for winter wheat grown at the USDA-ARS Conservation and Production Laboratory (CPRL), Soil and Water Management Research Unit (SWMRU), Bushland, Texas (Lat. 35.186714°, Long. -102.094189°, elevation 1170 m above MSL) in the 1989-1990, 1991-1992, and 1992-1993 seasons. Winter wheat was grown on two large, precision weighing lysimeters, each in the center of a 4.44 ha square field. The weighing lysimeters were used to measure mass, which was converted to relative soil water storage with 0.05 mm accuracy at 5-minute intervals, and the 5-minute change in soil water storage was used along with precipitation and irrigation amounts to calculate crop evapotranspiration (ET), which is reported at 15-minute intervals. Although a quality control process was used, the ET data in this dataset are considered raw data. Advanced algorithms for detection of precipitation, dew and frost were applied in a separate process to determine ET values that are reported in files in a dataset entitled \"Evapotranspiration and Water Balance Data for The Bushland, Texas Winter Wheat Datasets\". Those files have \"water-balance\" in their names. Each lysimeter was equipped with a suite of instruments to sense wind speed, air temperature and relative humidity, components of the radiation balance (e.g., net radiation, incoming and reflected shortwave, photosynthetically active radiation (PAR), incoming and reflected longwave, thermal infrared emitted by the plant/soil surface), soil heat flux, soil temperature, and soil volumetric water content at certain depths. Not all properties were always sensed in any one year; and instruments used changed from season to season, which are reasons that subsidiary datasets and data dictionaries for each season are required.
\nThese datasets originate from research aimed at determining crop water use (ET), crop coefficients for use in ET-based irrigation scheduling based on a reference ET, crop growth, yield, harvest index, and crop water productivity as affected by irrigation method, timing, amount (full or some degree of deficit), agronomic practices, cultivar, and weather. Prior publications have focused on winter wheat ET, crop coefficients, crop water productivity, and simulation modeling of crop growth, water use, and yield. Crop coefficients have been used by ET networks. The data have utility for testing simulation models of crop ET, growth, and yield and have been used by both USDA and university researchers.
Resource Title: 1989 Bushland, TX, West Winter Wheat Weighing Lysimeter and Microclimate Data.
File Name: 1989_Wheat W_Lys_ClimDat.xlsx
Resource Description: This dataset consists of weighing lysimeter data for winter wheat grown at the USDA-ARS Conservation and Production Laboratory (CPRL), Soil and Water Management Research Unit (SWMRU), Bushland, Texas (Lat. 35.186714°, Long. -102.094189°, elevation 1170 m above MSL). This particular dataset contains lysimeter soil water storage and drainage data, and data from in-soil and above-soil sensors. Properties sensed included wind speed, air temperature and relative humidity, components of the radiation balance (e.g., net radiation, incoming and reflected shortwave, photosynthetically active radiation (PAR), incoming and reflected longwave, thermal infrared emitted by the plant/soil surface), soil heat flux, soil temperature, and soil volumetric water content at certain depths. Not all properties where always sensed in any one year.
Resource Title: 1990 Bushland, TX, West Winter Wheat Weighing Lysimeter and Microclimate Data.
File Name: 1990_Wheat W_Lys_ClimDat.xlsx
Resource Description: This dataset consists of weighing lysimeter data for winter wheat grown at the USDA-ARS Conservation and Production Laboratory (CPRL), Soil and Water Management Research Unit (SWMRU), Bushland, Texas (Lat. 35.186714°, Long. -102.094189°, elevation 1170 m above MSL). This particular dataset contains lysimeter soil water storage and drainage data, and data from in-soil and above-soil sensors. Properties sensed included wind speed, air temperature and relative humidity, components of the radiation balance (e.g., net radiation, incoming and reflected shortwave, photosynthetically active radiation (PAR), incoming and reflected longwave, thermal infrared emitted by the plant/soil surface), soil heat flux, soil temperature, and soil volumetric water content at certain depths. Not all properties where always sensed in any one year.
Resource Title: 1991 Bushland, TX, East Winter Wheat Weighing Lysimeter and Microclimate Data.
File Name: 1991_Wheat_E_Lys_ClimDat.xlsx
Resource Description: This dataset consists of weighing lysimeter data for winter wheat grown at the USDA-ARS Conservation and Production Laboratory (CPRL), Soil and Water Management Research Unit (SWMRU), Bushland, Texas (Lat. 35.186714°, Long. -102.094189°, elevation 1170 m above MSL). This particular dataset contains lysimeter soil water storage and drainage data, and data from in-soil and above-soil sensors. Properties sensed included wind speed, air temperature and relative humidity, components of the radiation balance (e.g., net radiation, incoming and reflected shortwave, photosynthetically active radiation (PAR), incoming and reflected longwave, thermal infrared emitted by the plant/soil surface), soil heat flux, soil temperature, and soil volumetric water content at certain depths. Not all properties where always sensed in any one year.
Resource Title: 1992 Bushland, TX, East Winter Wheat Weighing Lysimeter and Microclimate Data.
File Name: 1992_Wheat_E_Lys_ClimDat.xlsx
Resource Description: This dataset consists of weighing lysimeter data for winter wheat grown at the USDA-ARS Conservation and Production Laboratory (CPRL), Soil and Water Management Research Unit (SWMRU), Bushland, Texas (Lat. 35.186714°, Long. -102.094189°, elevation 1170 m above MSL). This particular dataset contains lysimeter soil water storage and drainage data, and data from in-soil and above-soil sensors. Properties sensed included wind speed, air temperature and relative humidity, components of the radiation balance (e.g., net radiation, incoming and reflected shortwave, photosynthetically active radiation (PAR), incoming and reflected longwave, thermal infrared emitted by the plant/soil surface), soil heat flux, soil temperature, and soil volumetric water content at certain depths. Not all properties where always sensed in any one year.
Resource Title: 1992 Bushland, TX, West Winter Wheat Weighing Lysimeter and Microclimate Data.
File Name: 1992_Wheat_W_Lys_ClimDat.xlsx
Resource Description: This dataset consists of weighing lysimeter data for winter wheat grown at the USDA-ARS Conservation and Production Laboratory (CPRL), Soil and Water Management Research Unit (SWMRU), Bushland, Texas (Lat. 35.186714°, Long. -102.094189°, elevation 1170 m above MSL). This particular dataset contains lysimeter soil water storage and drainage data, and data from in-soil and above-soil sensors. Properties sensed included wind speed, air temperature and relative humidity, components of the radiation balance (e.g., net radiation, incoming and reflected shortwave, photosynthetically active radiation (PAR), incoming and reflected longwave, thermal infrared emitted by the plant/soil surface), soil heat flux, soil temperature, and soil volumetric water content at certain depths. Not all properties where always sensed in any one year.
Resource Title: 1993 Bushland, TX, West Winter Wheat Weighing Lysimeter and Microclimate Data.
File Name: 1993_Wheat_W_Lys_ClimDat.xlsx
Resource Description: This dataset consists of weighing lysimeter data for winter wheat grown at the USDA-ARS Conservation and Production Laboratory (CPRL), Soil and Water Management Research Unit (SWMRU), Bushland, Texas (Lat. 35.186714°, Long. -102.094189°, elevation 1170 m above MSL). This particular dataset contains lysimeter soil water storage and drainage data, and data from in-soil and above-soil sensors. Properties sensed included wind speed, air temperature and relative humidity, components of the radiation balance (e.g., net radiation, incoming and reflected shortwave, photosynthetically active radiation (PAR), incoming and reflected longwave, thermal infrared emitted by the plant/soil surface), soil heat flux, soil temperature, and soil volumetric water content at certain depths. Not all properties where always sensed in any one year.
This dataset consists of weighing lysimeter data for upland cotton [Gossypium hirsutum (L.)] grown for lint and seed at the USDA-ARS Conservation and Production Research Laboratory (CPRL), Soil and Water Management Research Unit (SWMRU), Bushland, Texas (Lat. 35.186714°, Long. -102.094189°, elevation 1170 m above MSL) in 2000 through 2004, 2008, 2010, 2012, 2020, and 2021 on from one to four large, precision weighing lysimeters, each in the center of a 4.44 ha square field similarly cropped. In 2019, cotton was grown on four large, precision weighing lysimeters, each in the center of a 4.4-ha square field. The weighing lysimeters were used to measure mass, which was converted to relative soil water storage with 0.05 mm accuracy at 5-minute intervals, and the 5-minute change in soil water storage was used along with precipitation and irrigation amounts to calculate crop evapotranspiration (ET), which is reported at 15-minute intervals. Although a quality control process was used, the ET data in this dataset are considered raw data. Advanced algorithms for detection of precipitation, dew and frost were applied in a separate process to determine ET values that are reported in files in a dataset entitled \"Evapotranspiration and Water Balance Data for The Bushland, Texas Cotton Datasets\". Those files have \"water-balance\" in their names. Each lysimeter was equipped with a suite of instruments to sense wind speed, air temperature and relative humidity, components of the radiation balance (e.g., net radiation, incoming and reflected shortwave, photosynthetically active radiation (PAR), incoming and reflected longwave, thermal infrared emitted by the plant/soil surface), soil heat flux, soil temperature, and soil volumetric water content at certain depths. Not all properties were always sensed in any one year; and instruments used changed from season to season, which are reasons that subsidiary datasets and data dictionaries for each season are required.
These datasets originate from research aimed at determining crop water use (ET), crop coefficients for use in ET-based irrigation scheduling based on a reference ET, crop growth, yield, harvest index, and crop water productivity as affected by irrigation method, timing, amount (full or some degree of deficit), lack of irrigation (dryland production), agronomic practices, cultivar, and weather. Prior publications have focused on cotton ET, crop coefficients, crop water productivity, and simulation modeling of crop growth, water use, and yield. Crop coefficients have been used by ET networks. The data have utility for testing simulation models of crop ET, growth, and yield and have been used by both USDA and university researchers.
See the README file (README_Bushland_Cotton_Lys.txt) for descriptions of each data file. Descriptions are different for each year because experimental protocols changed yearly.
", "title": "Weighing Lysimeter Data for The Bushland, Texas, Cotton Datasets", "distribution": [ { "@type": "dcat:Distribution", "downloadURL": "https://ndownloader.figshare.com/files/45385753", "format": "xlsx", "mediaType": "application/vnd.openxmlformats-officedocument.spreadsheetml.sheet", "title": "2004_Cot-Sorg W_Lys_ClimDat.xlsx" }, { "@type": "dcat:Distribution", "downloadURL": "https://ndownloader.figshare.com/files/45385759", "format": "xlsx", "mediaType": "application/vnd.openxmlformats-officedocument.spreadsheetml.sheet", "title": "2008_Cotton W_Lys_ClimDat.xlsx" }, { "@type": "dcat:Distribution", "downloadURL": "https://ndownloader.figshare.com/files/45385762", "format": "xlsx", "mediaType": "application/vnd.openxmlformats-officedocument.spreadsheetml.sheet", "title": "2008_Cotton_E_Lys_ClimDat.xlsx" }, { "@type": "dcat:Distribution", "downloadURL": "https://ndownloader.figshare.com/files/45385756", "format": "xlsx", "mediaType": "application/vnd.openxmlformats-officedocument.spreadsheetml.sheet", "title": "2010_Cotton_E_Lys_ClimDat.xlsx" }, { "@type": "dcat:Distribution", "downloadURL": "https://ndownloader.figshare.com/files/45385765", "format": "xlsx", "mediaType": "application/vnd.openxmlformats-officedocument.spreadsheetml.sheet", "title": "2012_Cotton_W_Lys_ClimDat.xlsx" }, { "@type": "dcat:Distribution", "downloadURL": "https://ndownloader.figshare.com/files/45385768", "format": "xlsx", "mediaType": "application/vnd.openxmlformats-officedocument.spreadsheetml.sheet", "title": "2020_Cotton_E_Lys_ClimDat.xlsx" }, { "@type": "dcat:Distribution", "downloadURL": "https://ndownloader.figshare.com/files/45385777", "format": "xlsx", "mediaType": "application/vnd.openxmlformats-officedocument.spreadsheetml.sheet", "title": "2020_Cotton_W_Lys_ClimDat.xlsx" }, { "@type": "dcat:Distribution", "downloadURL": "https://ndownloader.figshare.com/files/45385774", "format": "xlsx", "mediaType": "application/vnd.openxmlformats-officedocument.spreadsheetml.sheet", "title": "2021_Cotton_E_Lys_ClimDat.xlsx" }, { "@type": "dcat:Distribution", "downloadURL": "https://ndownloader.figshare.com/files/45385783", "format": "xlsx", "mediaType": "application/vnd.openxmlformats-officedocument.spreadsheetml.sheet", "title": "2021_Cotton_W_Lys_ClimDat.xlsx" }, { "@type": "dcat:Distribution", "downloadURL": "https://ndownloader.figshare.com/files/45385780", "format": "xlsx", "mediaType": "application/vnd.openxmlformats-officedocument.spreadsheetml.sheet", "title": "2000_Cotton W_Lys_ClimDat.xlsx" }, { "@type": "dcat:Distribution", "downloadURL": "https://ndownloader.figshare.com/files/45385771", "format": "xlsx", "mediaType": "application/vnd.openxmlformats-officedocument.spreadsheetml.sheet", "title": "2000_Cotton_E_Lys_ClimDat.xlsx" }, { "@type": "dcat:Distribution", "downloadURL": "https://ndownloader.figshare.com/files/45385789", "format": "xlsx", "mediaType": "application/vnd.openxmlformats-officedocument.spreadsheetml.sheet", "title": "2001_Cotton W_Lys_ClimDat.xlsx" }, { "@type": "dcat:Distribution", "downloadURL": "https://ndownloader.figshare.com/files/45385795", "format": "xlsx", "mediaType": "application/vnd.openxmlformats-officedocument.spreadsheetml.sheet", "title": "2001_Cotton_E_Lys_ClimDat.xlsx" }, { "@type": "dcat:Distribution", "downloadURL": "https://ndownloader.figshare.com/files/45385792", "format": "xlsx", "mediaType": "application/vnd.openxmlformats-officedocument.spreadsheetml.sheet", "title": "2002_Cotton_E_Lys_ClimDat.xlsx" }, { "@type": "dcat:Distribution", "downloadURL": "https://ndownloader.figshare.com/files/45385786", "format": "xlsx", "mediaType": "application/vnd.openxmlformats-officedocument.spreadsheetml.sheet", "title": "2003_Sorg-Cot W_Lys_ClimDat.xlsx" }, { "@type": "dcat:Distribution", "downloadURL": "https://ndownloader.figshare.com/files/45385798", "format": "txt", "mediaType": "text/plain", "title": "README_Bushland_Cotton_Lys.txt" } ], "license": "https://creativecommons.org/publicdomain/zero/1.0/", "bureauCode": [ "005:18" ], "modified": "2024-04-04", "publisher": { "@type": "org:Organization", "name": "Agricultural Research Service" }, "accrualPeriodicity": "irregular", "keyword": [ "NP211", "Evapotranspiration", "cotton", "irrigation", "deficit irrigation", "Atmospheric - Surface - Surface Radiation Budget (including solar irradiance)", "soil heat flux", "soil water content", "microclimate", "Soil Temperature", "data.gov", "ARS" ], "spatial": "{\"type\": \"Polygon\", \"coordinates\": [[[-102.09906463948, 35.191719970106], [-102.07671433134, 35.19121493622], [-102.07678299485, 35.1865853205], [-102.07609634934, 35.177044674547], [-102.09913330298, 35.177072738625], [-102.09906463948, 35.191719970106]]]}" }, { "identifier": "10.15482/USDA.ADC/1528684", "accessLevel": "public", "contactPoint": { "hasEmail": "mailto:steve.evett@usda.gov", "fn": "Evett, Steven R." }, "programCode": [ "005:040" ], "description": "This dataset consists of five years of weighing lysimeter data for soybean [Glycine max (L.) Merr.] grown at the USDA-ARS Conservation and Production Laboratory (CPRL), Soil and Water Management Research Unit (SWMRU), Bushland, Texas (Lat. 35.186714°, Long. -102.094189°, elevation 1170 m above MSL) in 1995, 2003, 2004, 2010 and 2019. In 1995, 2003, 2004, and 2010, soybean was grown on two large, precision weighing lysimeters, each in the center of a 4.44 ha square field. In 2019, soybean was grown on four large, precision weighing lysimeters, each in the center of a 4.4-ha square field. The weighing lysimeters were used to measure mass, which was converted to relative soil water storage with 0.05 mm accuracy at 5-minute intervals, and the 5-minute change in soil water storage was used along with precipitation and irrigation amounts to calculate crop evapotranspiration (ET), which is reported at 15-minute intervals. Although a quality control process was used, the ET data in this dataset are considered raw data. Advanced algorithms for detection of precipitation, dew and frost were applied in a separate process to determine ET values that are reported in files in a dataset entitled \"Evapotranspiration and Water Balance Data for The Bushland, Texas Soybean Datasets\". Those files have \"water-balance\" in their names. Each lysimeter was equipped with a suite of instruments to sense wind speed, air temperature and relative humidity, components of the radiation balance (e.g., net radiation, incoming and reflected shortwave, photosynthetically active radiation (PAR), incoming and reflected longwave, thermal infrared emitted by the plant/soil surface), soil heat flux, soil temperature, and soil volumetric water content at certain depths. Not all properties were always sensed in any one year; and instruments used changed from season to season, which are reasons that subsidiary datasets and data dictionaries for each season are required.
\nThese datasets originate from research aimed at determining crop water use (ET), crop coefficients for use in ET-based irrigation scheduling based on a reference ET, crop growth, yield, harvest index, and crop water productivity as affected by irrigation method, timing, amount (full or some degree of deficit), agronomic practices, cultivar, and weather. Prior publications have focused on soybean ET, crop coefficients, crop water productivity, and simulation modeling of crop growth, water use, and yield. Crop coefficients have been used by ET networks. The data have utility for testing simulation models of crop ET, growth, and yield and have been used by both USDA and university researchers.
See the README for descriptions of each data file.
Resource Title: 1995 Bushland, TX, West Soybean Weighing Lysimeter and Microclimate Data.
File Name: 1995_Soybean_W_Lys_ClimDat(FINAL).xlsx
Resource Title: 2003 Bushland, TX, East Soybean Weighing Lysimeter and Microclimate Data.
File Name: 2003_Soybean E_Lys_ClimDat(FINAL).xlsx
Resource Title: 2004 Bushland, TX, East Soybean Weighing Lysimeter and Microclimate Data.
File Name: 2004_Soybean E_Lys_ClimDat(FINAL).xlsx
Resource Title: 2010 Bushland, TX, West Soybean Weighing Lysimeter and Microclimate Data.
File Name: 2010_Soybean_W_Lys_ClimDat(FINAL).xlsx
Resource Title: 2019 Bushland, TX, East Soybean Weighing Lysimeter and Microclimate Data.
File Name: 2019_Soybean_E_Lys_ClimDat(FINAL).xlsx
Resource Title: 2019 Bushland, TX, West Soybean Weighing Lysimeter and Microclimate Data.
File Name: 2019_Soybean_W_Lys_ClimDat(FINAL).xlsx
Resource Title: README.
File Name: README_Bushland_Soybean_Lys.txt
West Texas Mesonet Agro-Climate Monitor shows the precipitation, temperature, weather forecast for mesonet stations in West Texas. Although dependent on rainfall and other climate factors to produce crops, West Texas crop consultants, extension agents, and agricultural producers have few tools that allow them to track the current growing season’s climate conditions and determine how current conditions compare with those of past years. The West Texas Mesonet Agro-Climate Monitor (ACM), a JavaScript web application based on daily data from Texas Tech University’s mesonet weather station network, was designed to meet this need. By displaying continuously updated information on variables such as soil temperature, cumulative growing degree days (GDD), cumulative precipitation, and first freeze dates, the ACM allows producers to monitor planting conditions, track crop development, and compare current conditions with those during the previous 10 yr’s growing seasons. In illustrating how mesonet data might be used as an operational climate data resource, the ACM might also serve as a conceptual model for other high resolution climate tools that estimate measures of current climate using continuously updated daily data sets.
Resource Title: West Texas Mesonet Agro-Climate Monitor.
File Name: Web Page, url: https://www.ars.usda.gov/research/software/download/?softwareid=484&modecode=30-96-05-00
download page
What We Eat in America (WWEIA) is the dietary intake interview component of the National Health and Nutrition Examination Survey (NHANES). \nWWEIA is conducted as a partnership between the U.S. Department of Agriculture (USDA) and the U.S. Department of Health and Human Services (DHHS). Two days of 24-hour dietary recall data are collected through an initial in-person interview, and a second interview conducted over the telephone within three to 10 days. Participants are given three-dimensional models (measuring cups and spoons, a ruler, and two household spoons) and/or USDA's Food Model Booklet (containing drawings of various sizes of glasses, mugs, bowls, mounds, circles, and other measures) to estimate food amounts. WWEIA data are collected using USDA's dietary data collection instrument, the Automated Multiple-Pass Method (AMPM). The AMPM is a fully computerized method for collecting 24-hour dietary recalls either in-person or by telephone.
\nFor each 2-year data release cycle, the following dietary intake data files are available:
\nDHHS is responsible for the sample design and data collection, and USDA is responsible for the survey’s dietary data collection methodology, maintenance of the databases used to code and process the data, and data review and processing. USDA also funds the collection and processing of Day 2 dietary intake data, which are used to develop variance estimates and calculate usual nutrient intakes.
Resource Title: What We Eat In America (WWEIA) main web page.
File Name: Web Page, url: https://www.ars.usda.gov/northeast-area/beltsville-md-bhnrc/beltsville-human-nutrition-research-center/food-surveys-research-group/docs/wweianhanes-overview/
Contains data tables, research articles, documentation data sets and more information about the WWEIA program.
\n(Link updated 05/13/2020)
Hessian fly (Mayetiola destructor) is a destructive pest of wheat causing severe damage to wheat (Triticum aestivum) production globally. New and novel sources of Hessian fly resistant cultivars are needed that can be used for native resistance and in breeding programs to develop robust insect-resistant wheat lines. In the current study, a total of 374 wheat cultivars from different regions within the United States were evaluated for resistance to Hessian fly. Three pasta wheat cultivars, one originating from North Dakota and 2 others from Minnesota showed resistance to multiple forms (technically called as ‘biotypes’) of Hessian fly when tested at 20°C. Although at higher temperatures of 30°C these three cultivars are unable to maintain their resistance to Hessian fly and are not suitable in regions with higher environmental temperatures, these three wheat lines can offer breeders additional sources of Hessian fly resistance for developing elite Hessian fly-resistant cultivars.
", "title": "Wheat Phenotypic Response to Hessian fly", "distribution": [ { "@type": "dcat:Distribution", "downloadURL": "https://ndownloader.figshare.com/files/44102297", "format": "xlsx", "mediaType": "application/vnd.openxmlformats-officedocument.spreadsheetml.sheet", "title": "Wheat Phenotypic Response to Hessian fly.xlsx" } ], "license": "https://www.usa.gov/publicdomain/label/1.0/", "bureauCode": [ "005:18" ], "modified": "2024-03-01", "publisher": { "@type": "org:Organization", "name": "Agricultural Research Service" }, "keyword": [ "Hessian fly", "Tetraploids", "Wheat", "ARS", "Data.gov", "biotypes", "phenotypic response", "insect resistance" ] }, { "identifier": "10.15482/USDA.ADC/25817608.v1", "accessLevel": "public", "contactPoint": { "hasEmail": "mailto:lisa.durso@usda.gov", "fn": "Durso, Lisa M." }, "programCode": [ "005:040" ], "description": "Larvae from the petroleum oil fly, Helaeomyia petrolei, live in the asphaltene and polyaromatic hydrocarbon rich asphalt seeps of Rancho La Brea, Los Angeles, California. These larvae pass high amounts of viscous asphalt through their digestive system, and their gut microbiota is exposed to these extreme conditions. Environmental stress response mechanisms can co-select for antibiotic resistance, and in the current study we used 16S rRNA and genomic sequencing along with the Comprehensive Antibiotic Resistance Database (CARD) tools to characterize antibiotic resistance profiles from six bacteria previously isolated from the oil fly larval intestinal tract, linking phenotypic and genotypic resistance profiles. The isolates contain a core set of antibiotic resistance determinants along with determinants that are rarely found in these species. Comparing these oil fly isolates to the phenotypic prevalence data generated by the CARD Resistance Gene Identifier revealed sixteen instances where the oil fly bacteria appeared to carry a resistance not seen in related taxa in the database, suggesting a novel suite of resistance families in the oil fly isolates compared to other members of the same taxa. Results highlight the functional duality of genes that code for antibiotic resistance and expand our understanding of the ecological and evolutionary role of antibiotic resistance genes in environmental habitats.
", "title": "Whole genome sequences of bacteria isolated from Oil fly (Helaeomyia petrolei) larvae", "distribution": [ { "@type": "dcat:Distribution", "downloadURL": "https://ndownloader.figshare.com/files/46499083", "format": "xlsx", "mediaType": "application/vnd.openxmlformats-officedocument.spreadsheetml.sheet", "title": "S1_OF2_Alcaligenes_sp_ARGs_Mapped_Reads_Info.xlsx" }, { "@type": "dcat:Distribution", "downloadURL": "https://ndownloader.figshare.com/files/46499086", "format": "xlsx", "mediaType": "application/vnd.openxmlformats-officedocument.spreadsheetml.sheet", "title": "S2_OF4_Pseudomonas_aeruginosa_ARGs_Mapped_Reads_Info.xlsx" }, { "@type": "dcat:Distribution", "downloadURL": "https://ndownloader.figshare.com/files/46499089", "format": "xlsx", "mediaType": "application/vnd.openxmlformats-officedocument.spreadsheetml.sheet", "title": "S3_OF5_Providencia_vermicola1_ARGs_Mapped_Reads_Info.xlsx" }, { "@type": "dcat:Distribution", "downloadURL": "https://ndownloader.figshare.com/files/46499092", "format": "xlsx", "mediaType": "application/vnd.openxmlformats-officedocument.spreadsheetml.sheet", "title": "S4_OF6_Providencia_rettgeri_ARGs_Mapped_Reads_Info.xlsx" }, { "@type": "dcat:Distribution", "downloadURL": "https://ndownloader.figshare.com/files/46499095", "format": "xlsx", "mediaType": "application/vnd.openxmlformats-officedocument.spreadsheetml.sheet", "title": "S5_OF8_Morganella morganii_ARGs_Mapped_Reads_Info.xlsx" }, { "@type": "dcat:Distribution", "downloadURL": "https://ndownloader.figshare.com/files/46499098", "format": "xlsx", "mediaType": "application/vnd.openxmlformats-officedocument.spreadsheetml.sheet", "title": "S6_OF10_Providencia_vermicola2_ARGs_Mapped_Reads_Info - Copy.xlsx" }, { "@type": "dcat:Distribution", "downloadURL": "https://ndownloader.figshare.com/files/46499101", "format": "xlsx", "mediaType": "application/vnd.openxmlformats-officedocument.spreadsheetml.sheet", "title": "S7_Gene Assignments from CARD Genotypic Database.xlsx" } ], "license": "https://creativecommons.org/licenses/by/4.0/", "bureauCode": [ "005:18" ], "modified": "2024-05-29", "publisher": { "@type": "org:Organization", "name": "Agricultural Research Service" }, "keyword": [ "Antibiotic Resistance", "Oil Fly", "Helaeomyia petrolei", "Bacteria", "Extreme environments -- Microbiology" ], "spatial": "{\"type\": \"Point\", \"coordinates\": [-118.3491, 34.0698]}" }, { "identifier": "10.15482/USDA.ADC/1529204", "accessLevel": "public", "contactPoint": { "hasEmail": "mailto:Eduardo.Bautista@usda.gov", "fn": "Baustista, Eduardo" }, "programCode": [ "005:040" ], "description": "WinSRFR is a hydraulic analysis tool for surface irrigation systems. The software combines simulation, evaluation, operational analysis, and design functionalities. Intended users are irrigation specialists, extension agents, researchers, consultants, students, and farmers with moderate to advanced knowledge of surface irrigation hydraulics. WinSRFR 5.1 is the fifth major release of the software. The new version offers a reprogrammed simulation engine, an application programming interface, batch simulation capabilities, and enhancements to the user interface.
Resource Title: WinSRFR 5.1 Software and User Manual.
File Name: WinSRFR5.pdf
Resource Description: Download WinSRFR Version 5.1.1 (2019) from the ARS software page at https://www.ars.usda.gov/research/software/download/?softwareid=502&mode / https://www.ars.usda.gov/research/software/?modeCode=20-20-05-15
\nChoose file link below to download the user manual.
Leaves from genetically unique Juglans regia plants were scanned using X-ray micro-computed tomography (microCT) on the X-ray μCT beamline (8.3.2) at the Advanced Light Source (ALS) in Lawrence Berkeley National Laboratory (LBNL), Berkeley, CA USA).
\nSoil samples were collected in Fall of 2017 from the riparian oak forest located at the Russell Ranch Sustainable Agricultural Institute at the University of California Davis. The soil was sieved through a 2 mm mesh and was air dried before imaging. A single soil aggregate was scanned at 23 keV using the 10x objective lens with a pixel resolution of 650 nanometers on beamline 8.3.2 at the ALS.
\nAdditionally, a drought stressed almond flower bud (Prunus dulcis) from a plant housed at the University of California, Davis, was scanned using a 4x lens with a pixel resolution of 1.72 µm on beamline 8.3.2 at the ALS
\nRaw tomographic image data was reconstructed using TomoPy. Reconstructions were converted to 8-bit tif or png format using ImageJ or the PIL package in Python before further processing. Images were annotated using Intel’s Computer Vision Annotation Tool (CVAT) and ImageJ. Both CVAT and ImageJ are free to use and open source. Leaf images were annotated in following Théroux-Rancourt et al. (2020). Specifically, Hand labeling was done directly in ImageJ by drawing around each tissue; with 5 images annotated per leaf. Care was taken to cover a range of anatomical variation to help improve the generalizability of the models to other leaves. All slices were labeled by Dr. Mina Momayyezi and Fiona Duong.To annotate the flower bud and soil aggregate, images were imported into CVAT. The exterior border of the bud (i.e. bud scales) and flower were annotated in CVAT and exported as masks. Similarly, the exterior of the soil aggregate and particulate organic matter identified by eye were annotated in CVAT and exported as masks. To annotate air spaces in both the bud and soil aggregate, images were imported into ImageJ. A gaussian blur was applied to the image to decrease noise and then the air space was segmented using thresholding. After applying the threshold, the selected air space region was converted to a binary image with white representing the air space and black representing everything else. This binary image was overlaid upon the original image and the air space within the flower bud and aggregate was selected using the “free hand” tool. Air space outside of the region of interest for both image sets was eliminated. The quality of the air space annotation was then visually inspected for accuracy against the underlying original image; incomplete annotations were corrected using the brush or pencil tool to paint missing air space white and incorrectly identified air space black. Once the annotation was satisfactorily corrected, the binary image of the air space was saved. Finally, the annotations of the bud and flower or aggregate and organic matter were opened in ImageJ and the associated air space mask was overlaid on top of them forming a three-layer mask suitable for training the fully convolutional network. All labeling of the soil aggregate and soil aggregate images was done by Dr. Devin Rippner.
\nThese images and annotations are for training deep learning models to identify different constituents in leaves, almond buds, and soil aggregates
\nLimitations:\nFor the walnut leaves, some tissues (stomata, etc.) are not labeled and only represent a small portion of a full leaf. Similarly, both the almond bud and the aggregate represent just one single sample of each. The bud tissues are only divided up into buds scales, flower, and air space. Many other tissues remain unlabeled. For the soil aggregate annotated labels are done by eye with no actual chemical information. Therefore particulate organic matter identification may be incorrect.
\nResource Title: Annotated X-ray CT images and masks of a Forest Soil Aggregate.
File Name: forest_soil_images_masks_for_testing_training.zip
Resource Description: This aggregate was collected from the riparian oak forest at the Russell Ranch Sustainable Agricultural Facility. The aggreagate was scanned using X-ray micro-computed tomography (microCT) on the X-ray μCT beamline (8.3.2) at the Advanced Light Source (ALS) in Lawrence Berkeley National Laboratory (LBNL), Berkeley, CA USA) using the 10x objective lens with a pixel resolution of 650 nanometers. For masks, the background has a value of 0,0,0; pores spaces have a value of 250,250, 250; mineral solids have a value= 128,0,0; and particulate organic matter has a value of = 000,128,000. These files were used for training a model to segment the forest soil aggregate and for testing the accuracy, precision, recall, and f1 score of the model.
Resource Title: Annotated X-ray CT images and masks of an Almond bud (P. Dulcis).
File Name: Almond_bud_tube_D_P6_training_testing_images_and_masks.zip
Resource Description: Drought stressed almond flower bud (Prunis dulcis) from a plant housed at the University of California, Davis, was scanned by X-ray micro-computed tomography (microCT) on the X-ray μCT beamline (8.3.2) at the Advanced Light Source (ALS) in Lawrence Berkeley National Laboratory (LBNL), Berkeley, CA USA) using the 4x lens with a pixel resolution of 1.72 µm using. For masks, the background has a value of 0,0,0; air spaces have a value of 255,255, 255; bud scales have a value= 128,0,0; and flower tissues have a value of = 000,128,000. These files were used for training a model to segment the almond bud and for testing the accuracy, precision, recall, and f1 score of the model.
Resource Software Recommended: Fiji (ImageJ),url: https://imagej.net/software/fiji/downloads
Resource Title: Annotated X-ray CT images and masks of Walnut leaves (J. Regia) .
File Name: 6_leaf_training_testing_images_and_masks_for_paper.zip
Resource Description: Stems were collected from genetically unique J. regia accessions at the 117 USDA-ARS-NCGR in Wolfskill Experimental Orchard, Winters, California USA to use as scion, and were grafted by Sierra Gold Nursery onto a commonly used commercial rootstock, RX1 (J. microcarpa × J. regia). We used a common rootstock to eliminate any own-root effects and to simulate conditions for a commercial walnut orchard setting, where rootstocks are commonly used. The grafted saplings were repotted and transferred to the Armstrong lathe house facility at the University of California, Davis in June 2019, and kept under natural light and temperature. Leaves from each accession and treatment were scanned using X-ray micro-computed tomography (microCT) on the X-ray μCT beamline (8.3.2) at the Advanced Light Source (ALS) in Lawrence Berkeley National Laboratory (LBNL), Berkeley, CA USA) using the 10x objective lens with a pixel resolution of 650 nanometers. For masks, the background has a value of 170,170,170; Epidermis value= 85,85,85; Mesophyll value= 0,0,0; Bundle Sheath Extension value= 152,152,152; Vein value= 220,220,220; Air value = 255,255,255.
Resource Software Recommended: Fiji (ImageJ),url: https://imagej.net/software/fiji/downloads
Yield Editor is a tool which allows the user to select, apply and analyze a variety of automated filters and editing techniques used to process and clean yield data. The software imports either AgLeader advanced or Greenstar text file formats, and exports data in a delimited ASCII format.
\nYield Editor 2.0.7 includes some of the improvements and updates that users of the software have asked to be included. It provides three major improvements over version 1.0.2. The most important of these is the inclusion of a module for automated selection of many yield filter values, as well as a couple of additional automated filter types. A legend tool has been added which allows for the viewing of multiple data streams. Finally, a command line interface language under development allows for automated batch mode processing of large yield datasets.
\nYield maps provide important information for developing and evaluating precision management strategies. The high-quality yield maps needed for decision-making require screening raw yield monitor datasets for errors and removing them before maps are made. To facilitate this process, we developed the Yield Editor interactive software which has been widely used by producers, consultants and researchers. Some of the most difficult and time consuming issues involved in cleaning yield maps include determination of combine delay times, and the removal of “overlapped” data, especially near end rows. Our new Yield Editor 2.0 automates these and other tasks, significantly increasing the reliability and reducing the difficulty of creating accurate yield maps. This paper describes this new software, with emphasis on the Automated Yield Cleaning Expert (AYCE) module. Application of Yield Editor 2.0 is illustrated through comparison of automated AYCE cleaning to the interactive approach available in Yield Editor 1.x. On a test set of fifty grain yield maps, AYCE cleaning was not significantly different than interactive cleaning by an expert user when examining field mean yield, yield standard deviation, and number of yield observations remaining after cleaning. Yield Editor 2.0 provides greatly improved efficiency and equivalent accuracy compared to the interactive methods available in Yield Editor 1.x.
Resource Title: Yield Editor 2.0.7.
File Name: Web Page, url: https://www.ars.usda.gov/research/software/download/?softwareid=370&modecode=50-70-10-00
download page: https://www.ars.usda.gov/research/software/download/?softwareid=370&modecode=50-70-10-00
Java Tool to extrapolate latitude and longitude from US Postal Service database
\nThe purpose of this tool is to estimate latitude and longitude from a user inputted zip code. This tool has been useful in collecting latitude and longitude data for users within the US that may not have known their corresponding latitude and longitude information.
\nUser Input :
\nThe sole input from the user is the zip code. The program searches the database and then displays the corresponding geographical latitude and longitude. This model was developed as an aid to gather latitude and longitude data from user of our other software tools.
\nThis model was developed in JAVA, is simple to use, and runs on multiple platforms (e.g. Mac, PC, Sun).
Resource Title: Zip Search Version 0.9.
File Name: Web Page, url: https://www.ars.usda.gov/research/software/download/?softwareid=156&modecode=50-60-05-00
download page
GUI-based software coded in PYTHON to promote throughput image processing and analytics of a big dataset of satellite imagery and provide spatiotemporal monitoring of crop health conditions throughout the growing season by automatically illustrating 1) a field map calendar (FMC) with daily thumbnails of vegetation heatmaps in each month and 2) a seasonal Vegetation Index (VI) Profile of the crop fields. Output examples of FMC and VI Profile are found in files named in fmCalendar.jpg and NDVI_Profile.jpg, respectively, which were created satellite imagery on 5/1-10/31 in 2020 from a sugarbeet field in Moorhead, MN.
", "title": "iCalendar: Satellite-based Field Map Calendar", "distribution": [ { "@type": "dcat:Distribution", "downloadURL": "https://ndownloader.figshare.com/files/47120473", "format": "py", "mediaType": "text/x-python", "title": "iCalendar.py" }, { "@type": "dcat:Distribution", "downloadURL": "https://ndownloader.figshare.com/files/47120476", "format": "jpg", "mediaType": "image/jpeg", "title": "fmCalendar.jpg" }, { "@type": "dcat:Distribution", "downloadURL": "https://ndownloader.figshare.com/files/47120479", "format": "jpg", "mediaType": "image/jpeg", "title": "NDVI_Profile.jpg" }, { "@type": "dcat:Distribution", "downloadURL": "https://ndownloader.figshare.com/files/47120482", "format": "py", "mediaType": "text/x-script.python", "title": "BM_NDVI.py" }, { "@type": "dcat:Distribution", "downloadURL": "https://ndownloader.figshare.com/files/47120485", "format": "py", "mediaType": "text/x-python", "title": "FMC.py" } ], "license": "https://www.usa.gov/publicdomain/label/1.0/", "bureauCode": [ "005:18" ], "modified": "2024-06-18", "publisher": { "@type": "org:Organization", "name": "Agricultural Research Service" }, "keyword": [ "Satellite Image Time Series", "image analytics", "software", "Crop health monitoring", "vegetation index", "field mapping images" ] }, { "identifier": "10113/AA22574", "accessLevel": "public", "contactPoint": { "hasEmail": "mailto:Daniel.Palic@usda.gov", "fn": "Palic, Daniel" }, "programCode": [ "005:040" ], "description": "iFEAT (iFARM Economic Analysis Tool) is a spreadsheet based tool developed to allow the user to assess current and potential management options for economic sustainability. The user can evaluate lease arrangements, input costs, government programs, and insurance options to arrive at the best economic combination of these variables.
\niFEAT is a user-friendly spreadsheet tool for helping no-till farmers—who often have higher fertilizer costs—quickly assess the economic benefits of various leasing and management options. The spreadsheet provides information on costs and net returns for different management alternatives, enabling them to assess the potential economic outcomes of management changes.
Resource Title: iFEAT download page.
File Name: Web Page, url: https://www.ars.usda.gov/research/software/download/?softwareid=240&modecode=30-12-30-25
The easy to use iFARM Field Record Keeper spreadsheet-based tool was designed to help farmers keep track of field operational records. The tool is designed to be farm specific allowing the user inputs to be specific to their operation. Drop down menus are created from user input including field names, crops, tillages, fertilizer, chemicals, landlords, and storage locations. This information needs only to be entered once. After initial setup each field will be saved as a file with the completed information. Up to four spray operations can be entered per field with the spray reports satisfying current Colorado Department of Agriculture and EPA requirements for Restricted Use Pesticide (RUP). The one page field report meets the fundamental requirements for the current Conservation Security Program (CSP) requirements for record keeping.
Resource Title: iFarm Record Keeper.
File Name: Web Page, url: https://www.ars.usda.gov/research/software/download/?softwareid=242&modecode=30-12-30-25
download page
iSnobal is a physically-based distributed snowmelt model. Snowmelt is the principal source for soil moisture, ground-water re-charge, and stream-flow in mountainous regions of the western US, Canada, and other similar regions of the world. Information on the timing, magnitude, and contributing area of melt under variable or changing climate conditions is required for successful water and resource management. A coupled energy and mass-balance model iSnobal is used to simulate the development and melting of the seasonal snowcover in several mountain basins in California, Idaho, and Utah. Simulations are done over basins varying from 1 to 2500 km2 , with simulation periods varying from a few days for the smallest basin, Emerald Lake watershed in California, to multiple snow seasons for the Park City area in Utah. The model is driven by topographically corrected estimates of radiation, temperature, humidity, wind, and precipitation. Simulation results in all basins closely match independently measured snow water equivalent, snow depth, or runoff during both the development and depletion of the snowcover. Spatially distributed estimates of snow deposition and melt allow us to better understand the interaction between topographic structure, climate, and moisture availability in mountain basins of the western US. Application of topographically distributed models such as this will lead to improved water resource and watershed management.
Resource Title: Image Processing Workbench (IPW).
File Name: Web Page, url: https://gitlab.com/ars-snow/ipw
GitHub repository where the model can be accessed and downloaded.
GUI-based software coded in PYTHON to automate image stitching and alignment processes from a set of tile images for the high throughput image analytics by implementing a series of algorithms: 1) deskewing the image acquired in an oblique view angle, 2) row alignment of the geometrically drifted image due to acquisition errors by detecting the crop row using Hough Transformation, and 3) options for omnidirectional overlap trimming and resizing.
Resource Title: iStitch: GUI-based Image Stitching Software.
File Name: iStitch.zip
myPhyloDB is an open-source software package aimed at developing a user-friendly web-interface for accessing and analyzing all of your laboratory's microbial ecology data (currently supported project types: soil, air, water, microbial, and human-associated). The storage and handling capabilities of myPhyloDB archives users' raw sequencing files, and allows for easy selection of any combination of projects/samples from all of your projects using the built-in SQL database. The data processing capabilities of myPhyloDB are also flexible enough to allow the upload, storage, and analysis of pre-processed data or raw (454 or Illumina) data files using the built-in versions of Mothur and R. myPhyloDB is designed to run as a local web-server, which allows a single installation to be accessible to all of your laboratory members, regardless of their operating system or other hardware limitations. myPhyloDB includes an embedded copy of the popular Mothur program and uses a customizable batch file to perform sequence editing and processing. This allows myPhyloDB to leverage the flexibility of Mothur and allow for greater standardization of data processing and handling across all of your sequencing projects.
\nmyPhyloDB also includes an embedded copy of the R software environment for a variety of statistical analyses and graphics. Currently, myPhyloDB includes analysis for factor or regression-based ANcOVA, principal coordinates analysis (PCoA), differential abundance analysis (DESeq), and sparse partial least-squares regression (sPLS).
Resource Title: Website Pointer to myPhyloDB.
File Name: Web Page, url: https://myphylodb.azurecloudgov.us/myPhyloDB/home/
Provides information and links to download latest version, release history, documentation, and tutorials including type of analysis you would like to perform (Univariate: ANCOVA/GLM; Multivariate: DiffAbund, PcoA, or sPLS).
Python implementation of the Snobal model applied at either a point or over an image (iSnobal). This package contains the C libraries of Snobal in a python wrapper for more flexibility and ease of interaction. ipysnobal.py has functions for general interaction. More detailed and flexible functions can be found in the Automated Water Supply Model (AWSM). Features:
\ndesigned to work within AWSM framework
\nResource Title: pySnobal GitHub repository.
File Name: Web Page, url: https://github.com/USDA-ARS-NWRC/pysnobal/tree/v0.2.0
Python wrapped implementation of the Snobal model.
The USDA Legacy Phosphorus Project seeks to leverage watershed research with USDA NRCS (Natural Resource Conservation Service) and USDA ARS (Agricultural Research Service) to advance the science, innovation, and forecasting of legacy phosphorus (P) mitigation strategies. This project utilizes Conservation Effects Assessment Project (CEAP) watersheds across seven research sites within the Snake River, Mississippi River, Lake Erie, Chesapeake Bay, and Lake Champlain watersheds.
This dataset supports the manuscript entitled \"Phosphorus lability across diverse agricultural contexts with legacy sources\" Simpson et al., to be submitted to Journal of Environmental Quality. [Citation will be updated upon acceptance + publication.]
The main data file contains multiple sheets to guide the user, see 'readme' and 'column descriptions' for details. The 'Data Summary' sheet has the primary data in tidy format.
The R project (.Rproj) file is useful for navigating the R code in RStudio. Scripts to support and reproduce the analyses in the manuscript are given. Code for figures are also in these scripts. The 'analyses' folder includes EPC0 fits via
brms
-- for sake of space, only the selected fits are included here (\"best performing models by site\") -- unzip that folder to use.
Contact Zach Simpson for more information.
Funded through an interagency agreement between USDA-NRCS and USDA-ARS, specifically: USDA Conservation Effects Assessment Project (CEAP) Watershed Assessment Studies
", "title": "USDA Legacy P project: P lability in soils and sediments", "distribution": [ { "@type": "dcat:Distribution", "downloadURL": "https://ndownloader.figshare.com/files/46629706", "format": "7z", "mediaType": "application/x-7z-compressed", "title": "best performing models by site.7z" }, { "@type": "dcat:Distribution", "downloadURL": "https://ndownloader.figshare.com/files/46629763", "format": "xlsx", "mediaType": "application/vnd.openxmlformats-officedocument.spreadsheetml.sheet", "title": "USDA Legacy P project - soils and sediments dataset.xlsx" }, { "@type": "dcat:Distribution", "downloadURL": "https://ndownloader.figshare.com/files/46629796", "format": "png", "mediaType": "image/png", "title": "agri-v-ref_P-properties.png" }, { "@type": "dcat:Distribution", "downloadURL": "https://ndownloader.figshare.com/files/46629799", "format": "png", "mediaType": "image/png", "title": "EPC0_v_AEM_and_GAM_v3.png" }, { "@type": "dcat:Distribution", "downloadURL": "https://ndownloader.figshare.com/files/46629802", "format": "png", "mediaType": "image/png", "title": "pairs_core-P-vars_v3.png" }, { "@type": "dcat:Distribution", "downloadURL": "https://ndownloader.figshare.com/files/46629805", "format": "png", "mediaType": "image/png", "title": "pairs_Fe-Al-clay.png" }, { "@type": "dcat:Distribution", "downloadURL": "https://ndownloader.figshare.com/files/46629808", "format": "png", "mediaType": "image/png", "title": "pairs_stratification-ratios.png" }, { "@type": "dcat:Distribution", "downloadURL": "https://ndownloader.figshare.com/files/46629811", "format": "png", "mediaType": "image/png", "title": "sed-vs-soil_emmeans-contrasts.png" }, { "@type": "dcat:Distribution", "downloadURL": "https://ndownloader.figshare.com/files/46629814", "format": "png", "mediaType": "image/png", "title": "strat-ratio_via-emmeans.png" }, { "@type": "dcat:Distribution", "downloadURL": "https://ndownloader.figshare.com/files/46629817", "format": "png", "mediaType": "image/png", "title": "time-since-last-P_AEM-EPC0-BWI_soils-only.png" }, { "@type": "dcat:Distribution", "downloadURL": "https://ndownloader.figshare.com/files/46629862", "format": "R", "mediaType": "text/plain", "title": "correlation matrices for various variables.R" }, { "@type": "dcat:Distribution", "downloadURL": "https://ndownloader.figshare.com/files/46629865", "format": "R", "mediaType": "text/plain", "title": "data and plot setup.R" }, { "@type": "dcat:Distribution", "downloadURL": "https://ndownloader.figshare.com/files/46629868", "format": "R", "mediaType": "text/plain", "title": "estimate EPC0 by site -- Snake River.R" }, { "@type": "dcat:Distribution", "downloadURL": "https://ndownloader.figshare.com/files/46629871", "format": "R", "mediaType": "text/plain", "title": "GAMs for EPC0.R" }, { "@type": "dcat:Distribution", "downloadURL": "https://ndownloader.figshare.com/files/46629874", "format": "R", "mediaType": "text/plain", "title": "labile P as a stock.R" }, { "@type": "dcat:Distribution", "downloadURL": "https://ndownloader.figshare.com/files/46629877", "format": "R", "mediaType": "text/plain", "title": "organise model-based EPC0 estimates.R" }, { "@type": "dcat:Distribution", "downloadURL": "https://ndownloader.figshare.com/files/46629880", "format": "R", "mediaType": "text/plain", "title": "soil vs sediment contrasts.R" }, { "@type": "dcat:Distribution", "downloadURL": "https://ndownloader.figshare.com/files/46629883", "format": "R", "mediaType": "text/plain", "title": "stratification of P in soils.R" }, { "@type": "dcat:Distribution", "downloadURL": "https://ndownloader.figshare.com/files/46629886", "format": "R", "mediaType": "text/plain", "title": "time since last P, other mgmt.R" }, { "@type": "dcat:Distribution", "downloadURL": "https://ndownloader.figshare.com/files/46629991", "format": "Rproj", "mediaType": "text/plain", "title": "USDA Legacy P - P lability in soils and sediments.Rproj" }, { "@type": "dcat:Distribution", "downloadURL": "https://ndownloader.figshare.com/files/46794796", "format": "txt", "mediaType": "text/plain", "title": "readme.txt" } ], "license": "https://creativecommons.org/licenses/by/4.0/", "bureauCode": [ "005:53", "005:18" ], "modified": "2024-06-10", "publisher": { "@type": "org:Organization", "name": "Agricultural Research Service" }, "accrualPeriodicity": "irregular", "keyword": [ "phosphorus", "legacy phosphorus", "sorption", "soil", "sediment", "EPC0" ], "spatial": "{\"type\": \"MultiPoint\", \"coordinates\": [[-114.36470497551085, 42.529335182614005], [-93.09390598792665, 44.946633559442546], [-86.91101529627943, 40.4475015791034], [-82.98470786777187, 39.94533443107363], [-89.51980787402127, 34.36179062102241], [-90.91031835603383, 33.423806690274304], [-76.91429174520925, 39.028501684729235], [-77.86482753622907, 40.79920562190611], [-73.15613564726097, 44.466151759214654], [-105.06758701599048, 40.57270549634876]]}" }, { "identifier": "USDA-9361", "accessLevel": "public", "contactPoint": { "hasEmail": "mailto:paige.niederer@ftc.usda.gov", "@type": "vcard:Contact", "fn": "Paige Niederer" }, "programCode": [ "005:027" ], "description": "This site provides addresses, telephone numbers and other key information for USDA Service Center locations. These office locations will provide customers with information and assistance for available disaster programs. Agencies shown include the Farm Service Agency, Rural Development and the Natural Resources Conservation Service.", "title": "USDA Service Center Locator", "distribution": [ { "@type": "dcat:Distribution", "downloadURL": "http://offices.sc.egov.usda.gov/locator/app", "mediaType": "text/csv", "title": "Comma Seperated Values File" } ], "license": "https://creativecommons.org/licenses/by/4.0", "bureauCode": [ "005:53" ], "modified": "2014-12-23", "publisher": { "@type": "org:Organization", "name": "NRCS" }, "accrualPeriodicity": "R/P1D", "keyword": [ "Agriculture", "FSA", "NRCS", "Office", "RD", "Service Center", "USDA", "conservation assistance", "grants", "loans", "natural resources" ], "spatial": "United States and U.S. Territories", "issued": "1998-08-01" }, { "identifier": "NRCS0082", "accessLevel": "non-public", "contactPoint": { "hasEmail": "mailto:eva.mitter@wdc.usda.gov", "@type": "vcard:Contact", "fn": "Eva Mitter" }, "programCode": [ "005:027" ], "description": "Supporting spatial database for NRCS applications", "title": "WAI", "distribution": [], "bureauCode": [ "005:53" ], "modified": "2014-02-27", "publisher": { "@type": "org:Organization", "name": "NRCS" }, "keyword": [ "Systems Reference Data" ] }, { "identifier": "NRCS0084", "accessLevel": "non-public", "contactPoint": { "hasEmail": "mailto:eva.mitter@wdc.usda.gov", "@type": "vcard:Contact", "fn": "Eva Mitter" }, "programCode": [ "005:027" ], "description": "Legacy application permissions", "title": "WebRoles", "distribution": [], "bureauCode": [ "005:53" ], "modified": "2014-02-27", "publisher": { "@type": "org:Organization", "name": "NRCS" }, "keyword": [ "Systems Reference Data" ] }, { "identifier": "NRCS0008", "accessLevel": "non-public", "contactPoint": { "hasEmail": "mailto:eva.mitter@wdc.usda.gov", "@type": "vcard:Contact", "fn": "Eva Mitter" }, "programCode": [ "005:027" ], "description": "Legacy National Conservation Planning database", "title": "eConsplan", "distribution": [], "bureauCode": [ "005:53" ], "modified": "2014-02-27", "publisher": { "@type": "org:Organization", "name": "NRCS" }, "keyword": [ "Conservation Planning" ] }, { "identifier": "NRCS0009", "accessLevel": "non-public", "contactPoint": { "hasEmail": "mailto:eva.mitter@wdc.usda.gov", "@type": "vcard:Contact", "fn": "Eva Mitter" }, "programCode": [ "005:027" ], "description": "Legacy National Conservation Planning database", "title": "eConsplanMessages", "distribution": [], "bureauCode": [ "005:53" ], "modified": "2014-02-27", "publisher": { "@type": "org:Organization", "name": "NRCS" }, "keyword": [ "Conservation Planning" ] }, { "identifier": "NRCS0010", "accessLevel": "non-public", "contactPoint": { "hasEmail": "mailto:eva.mitter@wdc.usda.gov", "@type": "vcard:Contact", "fn": "Eva Mitter" }, "programCode": [ "005:027" ], "description": "NRCS agreements and cost-sharing data", "title": "eContracts", "distribution": [], "bureauCode": [ "005:53" ], "modified": "2014-02-27", "publisher": { "@type": "org:Organization", "name": "NRCS" }, "keyword": [ "Contracts and Agreements" ] }, { "identifier": "NRCS0011", "accessLevel": "non-public", "contactPoint": { "hasEmail": "mailto:eva.mitter@wdc.usda.gov", "@type": "vcard:Contact", "fn": "Eva Mitter" }, "programCode": [ "005:027" ], "description": "NRCS agreements and cost-sharing data", "title": "eContractsLedger", "distribution": [], "bureauCode": [ "005:53" ], "modified": "2014-02-27", "publisher": { "@type": "org:Organization", "name": "NRCS" }, "keyword": [ "Contracts and Agreements" ] }, { "identifier": "NRCS0012", "accessLevel": "non-public", "contactPoint": { "hasEmail": "mailto:eva.mitter@wdc.usda.gov", "@type": "vcard:Contact", "fn": "Eva Mitter" }, "programCode": [ "005:027" ], "description": "NRCS agreements and cost-sharing data", "title": "eContractsUsers", "distribution": [], "bureauCode": [ "005:53" ], "modified": "2014-02-27", "publisher": { "@type": "org:Organization", "name": "NRCS" }, "keyword": [ "Contracts and Agreements" ] }, { "identifier": "NRCS0027", "accessLevel": "non-public", "contactPoint": { "hasEmail": "mailto:eva.mitter@wdc.usda.gov", "@type": "vcard:Contact", "fn": "Eva Mitter" }, "programCode": [ "005:027" ], "description": "Inventory for managing NRCS dams", "title": "geoObserverDB", "distribution": [], "bureauCode": [ "005:53" ], "modified": "2014-02-27", "publisher": { "@type": "org:Organization", "name": "NRCS" }, "keyword": [ "NRCS Operations" ] }, { "identifier": "NRCS0026", "accessLevel": "non-public", "contactPoint": { "hasEmail": "mailto:eva.mitter@wdc.usda.gov", "@type": "vcard:Contact", "fn": "Eva Mitter" }, "programCode": [ "005:027" ], "description": "Inventory for managing NRCS dams", "title": "geoObserverDams", "distribution": [], "bureauCode": [ "005:53" ], "modified": "2014-02-28", "publisher": { "@type": "org:Organization", "name": "NRCS" }, "keyword": [ "NRCS", "USDA" ] }, { "identifier": "NRCS0028", "accessLevel": "non-public", "contactPoint": { "hasEmail": "mailto:eva.mitter@wdc.usda.gov", "@type": "vcard:Contact", "fn": "Eva Mitter" }, "programCode": [ "005:027" ], "description": "Legacy User Management", "title": "iasaccount", "distribution": [], "bureauCode": [ "005:53" ], "modified": "2014-10-31", "publisher": { "@type": "org:Organization", "name": "NRCS" }, "keyword": [ "Systems Reference Data" ] }, { "identifier": "NRCS0029", "accessLevel": "non-public", "contactPoint": { "hasEmail": "mailto:eva.mitter@wdc.usda.gov", "@type": "vcard:Contact", "fn": "Eva Mitter" }, "programCode": [ "005:027" ], "description": "Personnel data feed", "title": "iascams", "distribution": [], "bureauCode": [ "005:53" ], "modified": "2014-02-27", "publisher": { "@type": "org:Organization", "name": "NRCS" }, "keyword": [ "Systems Reference Data" ] }, { "identifier": "NRCS0030", "accessLevel": "non-public", "contactPoint": { "hasEmail": "mailto:eva.mitter@wdc.usda.gov", "@type": "vcard:Contact", "fn": "Eva Mitter" }, "programCode": [ "005:027" ], "description": "Legacy Client Records", "title": "iascustomer", "distribution": [], "bureauCode": [ "005:53" ], "modified": "2014-02-27", "publisher": { "@type": "org:Organization", "name": "NRCS" }, "keyword": [ "Systems Reference Data" ] }, { "identifier": "NRCS0031", "accessLevel": "non-public", "contactPoint": { "hasEmail": "mailto:eva.mitter@wdc.usda.gov", "@type": "vcard:Contact", "fn": "Eva Mitter" }, "programCode": [ "005:027" ], "description": "Legacy Systems Permissions", "title": "iasprofile", "distribution": [], "bureauCode": [ "005:53" ], "modified": "2014-02-28", "publisher": { "@type": "org:Organization", "name": "NRCS" }, "keyword": [ "IAS", "NRCS", "USDA" ] }, { "identifier": "NRCS0038", "accessLevel": "non-public", "contactPoint": { "hasEmail": "mailto:eva.mitter@wdc.usda.gov", "@type": "vcard:Contact", "fn": "Eva Mitter" }, "programCode": [ "005:027" ], "description": "Master Reference Tables", "title": "mrtxdb", "distribution": [], "bureauCode": [ "005:53" ], "modified": "2014-02-27", "publisher": { "@type": "org:Organization", "name": "NRCS" }, "keyword": [ "Systems Reference Data" ] }, { "identifier": "NRCS0040", "accessLevel": "non-public", "contactPoint": { "hasEmail": "mailto:eva.mitter@wdc.usda.gov", "@type": "vcard:Contact", "fn": "Ea Mitter" }, "programCode": [ "005:027" ], "description": "Nasis accumulation of change transactions", "title": "nasischg", "distribution": [], "bureauCode": [ "005:53" ], "modified": "2014-02-27", "publisher": { "@type": "org:Organization", "name": "NRCS" }, "keyword": [ "Natural Resources" ] }, { "identifier": "NRCS0041", "accessLevel": "non-public", "contactPoint": { "hasEmail": "mailto:eva.mitter@wdc.usda.gov", "@type": "vcard:Contact", "fn": "Eva Mitter" }, "programCode": [ "005:027" ], "description": "Supporting spatial database for NRCS applications", "title": "navigation", "distribution": [], "bureauCode": [ "005:53" ], "modified": "2014-02-27", "publisher": { "@type": "org:Organization", "name": "NRCS" }, "keyword": [ "Systems Reference Data" ] }, { "identifier": "NRCS0042", "accessLevel": "non-public", "contactPoint": { "hasEmail": "mailto:eva.mitter@wdc.usda.gov", "@type": "vcard:Contact", "fn": "Eva Mitter" }, "programCode": [ "005:027" ], "description": "Legacy Supporting spatial database for NRCS applications", "title": "navsde", "distribution": [], "bureauCode": [ "005:53" ], "modified": "2014-02-27", "publisher": { "@type": "org:Organization", "name": "NRCS" }, "keyword": [ "Systems Reference Data" ] }, { "identifier": "NRCS0056", "accessLevel": "non-public", "contactPoint": { "hasEmail": "mailto:eva.mitter@wdc.usda.gov", "@type": "vcard:Contact", "fn": "Eva Mitter" }, "programCode": [ "005:027" ], "description": "Office Information Profile.", "title": "oipdb", "distribution": [], "bureauCode": [ "005:53" ], "modified": "2014-02-27", "publisher": { "@type": "org:Organization", "name": "NRCS" }, "keyword": [ "Systems Reference Data" ] }, { "identifier": "NRCS0066", "accessLevel": "non-public", "contactPoint": { "hasEmail": "mailto:eva.mitter@wdc.usda.gov", "@type": "vcard:Contact", "fn": "Eva Mitter" }, "programCode": [ "005:027" ], "description": "Legacy progress reporting system", "title": "prms", "distribution": [], "bureauCode": [ "005:53" ], "modified": "2014-02-27", "publisher": { "@type": "org:Organization", "name": "NRCS" }, "keyword": [ "NRCS Operations" ] }, { "identifier": "NRCS0067", "accessLevel": "non-public", "contactPoint": { "hasEmail": "mailto:eva.mitter@wdc.usda.gov", "@type": "vcard:Contact", "fn": "Eva Mitter" }, "programCode": [ "005:027" ], "description": "NRCS Programs listing", "title": "program", "distribution": [], "bureauCode": [ "005:53" ], "modified": "2014-02-27", "publisher": { "@type": "org:Organization", "name": "NRCS" }, "keyword": [ "Systems Reference Data" ] }, { "identifier": "NRCS0076", "accessLevel": "non-public", "contactPoint": { "hasEmail": "mailto:eva.mitter@wdc.usda.gov", "@type": "vcard:Contact", "fn": "Eva Mitter" }, "programCode": [ "005:027" ], "description": "Soils Data Mart", "title": "sdm", "distribution": [], "bureauCode": [ "005:53" ], "modified": "2014-02-27", "publisher": { "@type": "org:Organization", "name": "NRCS" }, "keyword": [ "Natural Resources" ] }, { "identifier": "NRCS0079", "accessLevel": "non-public", "contactPoint": { "hasEmail": "mailto:eva.mitter@wdc.usda.gov", "@type": "vcard:Contact", "fn": "Eva Mitter" }, "programCode": [ "005:027" ], "description": "Technical Service Provider registration", "title": "techreg", "distribution": [], "bureauCode": [ "005:53" ], "modified": "2014-02-27", "publisher": { "@type": "org:Organization", "name": "NRCS" }, "keyword": [ "NRCS Operations" ] }, { "identifier": "NRCS0080", "accessLevel": "non-public", "contactPoint": { "hasEmail": "mailto:eva.mitter@wdc.usda.gov", "@type": "vcard:Contact", "fn": "Eva Mitter" }, "programCode": [ "005:027" ], "description": "Tract review spotcheck system for compliance", "title": "tractreview", "distribution": [], "bureauCode": [ "005:53" ], "modified": "2014-02-27", "publisher": { "@type": "org:Organization", "name": "NRCS" }, "keyword": [ "Conservation Planning" ] }, { "identifier": "NRCS0083", "accessLevel": "non-public", "contactPoint": { "hasEmail": "mailto:eva.mitter@wdc.usda.gov", "@type": "vcard:Contact", "fn": "Eva Mitter" }, "programCode": [ "005:027" ], "description": "Supports tractreview", "title": "watershed", "distribution": [], "bureauCode": [ "005:53" ], "modified": "2014-02-27", "publisher": { "@type": "org:Organization", "name": "NRCs" }, "keyword": [ "Conservation Planning" ] }, { "identifier": "NRCS0085", "accessLevel": "non-public", "contactPoint": { "hasEmail": "mailto:eva.mitter@wdc.usda.gov", "@type": "vcard:Contact", "fn": "Eva Mitter" }, "programCode": [ "005:027" ], "description": "Employee Timesheet data", "title": "webTCAS", "distribution": [], "bureauCode": [ "005:53" ], "modified": "2014-02-27", "publisher": { "@type": "org:Organization", "name": "NRCS" }, "keyword": [ "NRCS Operations" ] }, { "identifier": "NRCS0086", "accessLevel": "non-public", "contactPoint": { "hasEmail": "mailto:eva.mitter@wdc.usda.gov", "@type": "vcard:Contact", "fn": "Eva Mitter" }, "programCode": [ "005:027" ], "description": "Application roles and permissions", "title": "zRoles", "distribution": [], "bureauCode": [ "005:53" ], "modified": "2014-02-27", "publisher": { "@type": "org:Organization", "name": "NRCS" }, "keyword": [ "Systems Reference Data" ] }, { "identifier": "NRCS0087", "accessLevel": "non-public", "contactPoint": { "hasEmail": "mailto:eva.mitter@wdc.usda.gov", "@type": "vcard:Contact", "fn": "Eva Mitter" }, "programCode": [ "005:027" ], "description": "Application roles and permissions", "title": "zRolesApplicationLog", "distribution": [], "bureauCode": [ "005:53" ], "modified": "2014-02-27", "publisher": { "@type": "org:Organization", "name": "NRCS" }, "keyword": [ "Systems Reference Data" ] }, { "identifier": "USDA-RD-00002", "accessLevel": "non-public", "contactPoint": { "hasEmail": "mailto:greg.eschman@stl.usda.gov", "@type": "vcard:Contact", "fn": "Greg Eschman" }, "programCode": [ "005:001" ], "landingPage": "http://www.sc.egov.usda.gov/data/data_files.html", "description": "In accordance with the Federal Funding Accountability and Transparency Act of 2006 (FFATA) and the American Recovery and Reinvestment Act of 2009 (ARRA), this downloadable file identifies Rural Development ARRA program obligation and disbursement activities.", "title": "RD Monthly Obligations and Disbursements (ARRA)", "distribution": [ { "@type": "dcat:Distribution", "downloadURL": "http://www.sc.egov.usda.gov/data/files/ARRA/RD_ARRA_20151120_03.csv", "mediaType": "text/csv", "title": "RD Obligations and Disbursements - ARRA" } ], "bureauCode": [ "005:55" ], "modified": "2016-04-01", "publisher": { "@type": "org:Organization", "name": "Rural Development, Department of Agriculture" }, "accrualPeriodicity": "R/P1M", "keyword": [ "ARRA", "Agriculture and Rural Development", "American Recovery and Reinvestment Act", "FAAD", "FAIN", "FFATA", "Federal Award Identifier", "Rural Development", "agriculture", "data", "disbursement", "obligations", "recovery act", "usda" ] }, { "identifier": "USDA-RD-0011", "accessLevel": "public", "contactPoint": { "hasEmail": "mailto:karen.priestly@wdc.usda.gov", "@type": "vcard:Contact", "fn": "Karen Priestly" }, "programCode": [ "005:039" ], "description": "Rural Development Disaster Assistance Declarations - April30Ver2", "title": "Rural Development Disaster Assistance", "distribution": [ { "accessURL": "http://www.rd.usda.gov/programs-services/services/rural-development-disaster-assistance", "@type": "dcat:Distribution", "description": "Rural Development disasater assistance options", "title": "Rural Development Disaster Assistance" } ], "license": "https://creativecommons.org/publicdomain/zero/1.0/", "bureauCode": [ "005:55" ], "modified": "2015-02-26", "publisher": { "@type": "org:Organization", "name": "Rural Development, Department of Agriculture" }, "keyword": [ "Agriculture and Rural Development", "Business and Industry", "Disaster Relief", "FEMA", "Federal Emergency", "Intermediary Relending", "MFH", "RBEG", "Rural Business Enterprise", "Rural Development", "Rural Economic Development", "SFH", "agriculture", "assistance", "community facilities", "direct loan", "disaster", "disaster assistance", "emergency", "grants", "guaranteed loans", "multi family housing", "rural", "single family housing", "tenants", "utilities", "water" ] }, { "identifier": "USDA-RD-0017", "accessLevel": "non-public", "contactPoint": { "hasEmail": "mailto:greg.eschman@stl.usda.gov", "@type": "vcard:Contact", "fn": "Greg Eschman" }, "programCode": [ "005:001" ], "landingPage": "http://www.sc.egov.usda.gov/data/data_files.html", "description": "In accordance with the Federal Funding Accountability and Transparency Act of 2006 (FFATA) and the American Recovery and Reinvestment Act of 2009 (ARRA), this downloadable file identifies Rural Development non-ARRA program obligations for April 2015.", "title": "Rural Development Obligations and Disbursements (non ARRA) - April 2015", "distribution": [ { "@type": "dcat:Distribution", "downloadURL": "http://www.sc.egov.usda.gov/data/files/Non_ARRA/RD_Non_ARRA_20150421_03.csv", "mediaType": "text/csv", "title": "RD Obligations and Disbursements - Non Stimulus - April 2015" } ], "bureauCode": [ "005:55" ], "modified": "2016-03-01", "publisher": { "@type": "org:Organization", "name": "Rural Development, Department of Agriculture" }, "accrualPeriodicity": "R/P1M", "keyword": [ "ARRA", "Agriculture and Rural Development", "American Recovery and Reinvestment", "FAAD", "FAIN", "FFATA", "Federal Award Identifier Number", "Recovery Act", "Rural Development", "agriculture", "assistance", "data", "disbursement", "funding", "obligations", "rural", "usda" ] }, { "identifier": "USDA-RD-056", "accessLevel": "non-public", "contactPoint": { "hasEmail": "mailto:greg.eschman@stl.usda.gov", "@type": "vcard:Contact", "fn": "Greg Eschman" }, "programCode": [ "005:001" ], "landingPage": "http://www.sc.egov.usda.gov/data/data_files.html", "description": "In accordance with the Federal Funding Accountability and Transparency Act of 2006 (FFATA) and the American Recovery and Reinvestment Act of 2009 (ARRA), this downloadable file identifies Rural Development non-ARRA program obligations for April 2016.", "title": "Rural Development Obligations and Disbursements (non ARRA) - April 2016", "distribution": [ { "@type": "dcat:Distribution", "downloadURL": "https://www.sc.egov.usda.gov/data/files/Non_ARRA/RD_Non_ARRA_20160419_03.csv", "description": "Non-Stimulus Obligations and Disbursements - April 2016", "mediaType": "text/csv", "title": "Non-Stimulus Obligations and Disbursements" } ], "bureauCode": [ "005:55" ], "modified": "2016-03-01", "publisher": { "@type": "org:Organization", "name": "Rural Development, Department of Agriculture" }, "accrualPeriodicity": "R/P1M", "keyword": [ "ARRA", "Agriculture and Rural Development", "American Recovery and Reinvestment", "FAAD", "FAIN", "FFATA", "Federal Award Identifier Number", "Recovery Act", "Rural Development", "agriculture", "assistance", "data", "disbursement", "funding", "obligations", "rural", "usda" ] }, { "identifier": "USDA-RD-0013", "accessLevel": "non-public", "contactPoint": { "hasEmail": "mailto:greg.eschman@stl.usda.gov", "@type": "vcard:Contact", "fn": "Greg Eschman" }, "programCode": [ "005:001" ], "landingPage": "http://www.sc.egov.usda.gov/data/data_files.html", "description": "In accordance with the Federal Funding Accountability and Transparency Act of 2006 (FFATA) and the American Recovery and Reinvestment Act of 2009 (ARRA), this downloadable file identifies Rural Development non-ARRA program obligations for August 2015.", "title": "Rural Development Obligations and Disbursements (non ARRA) - August 2015", "distribution": [ { "@type": "dcat:Distribution", "downloadURL": "http://www.sc.egov.usda.gov/data/files/Non_ARRA/RD_Non_ARRA_20150819_03.csv", "mediaType": "text/csv", "title": "Obligations and Disbursements - Non Stimulus - August 2015" } ], "bureauCode": [ "005:55" ], "modified": "2015-03-01", "publisher": { "@type": "org:Organization", "name": "Rural Development, Department of Agriculture" }, "accrualPeriodicity": "R/P1M", "keyword": [ "ARRA", "Agriculture and Rural Development", "American Recovery and Reinvestment", "FAAD", "FAIN", "FFATA", "Federal Award Identifier Number", "Recovery Act", "Rural Development", "agriculture", "assistance", "data", "disbursement", "funding", "obligations", "rural", "usda" ] }, { "identifier": "USDA-RD-060", "accessLevel": "non-public", "contactPoint": { "hasEmail": "mailto:greg.eschman@stl.usda.gov", "@type": "vcard:Contact", "fn": "Greg Eschman" }, "programCode": [ "005:001" ], "landingPage": "http://www.sc.egov.usda.gov/data/data_files.html", "description": "In accordance with the Federal Funding Accountability and Transparency Act of 2006 (FFATA) and the American Recovery and Reinvestment Act of 2009 (ARRA), this downloadable file identifies Rural Development non-ARRA program obligations for August 2016.", "title": "Rural Development Obligations and Disbursements (non ARRA) - August 2016", "distribution": [ { "@type": "dcat:Distribution", "downloadURL": "https://www.sc.egov.usda.gov/data/files/Non_ARRA/RD_Non_ARRA_20160804_03.csv", "description": "Non-Stimulus Obligations and Disbursements - August 2016", "mediaType": "text/csv", "title": "Non-Stimulus Obligations and Disbursements" } ], "bureauCode": [ "005:55" ], "modified": "2016-07-01", "publisher": { "@type": "org:Organization", "name": "Rural Development, Department of Agriculture" }, "accrualPeriodicity": "R/P1M", "keyword": [ "ARRA", "Agriculture and Rural Development", "American Recovery and Reinvestment", "FAAD", "FAIN", "FFATA", "Federal Award Identifier Number", "Recovery Act", "Rural Development", "agriculture", "assistance", "data", "disbursement", "funding", "obligations", "rural", "usda" ] }, { "identifier": "USDA-RD-0024", "accessLevel": "non-public", "contactPoint": { "hasEmail": "mailto:greg.eschman@stl.usda.gov", "@type": "vcard:Contact", "fn": "Greg Eschman" }, "programCode": [ "005:001" ], "landingPage": "http://www.sc.egov.usda.gov/data/data_files.html", "description": "In accordance with the Federal Funding Accountability and Transparency Act of 2006 (FFATA) and the American Recovery and Reinvestment Act of 2009 (ARRA), this downloadable file identifies Rural Development non-ARRA program obligations for December 2015.", "title": "Rural Development Obligations and Disbursements (non ARRA) - December 2015", "distribution": [ { "accessURL": "http://www.sc.egov.usda.gov/data/files/Non_ARRA/RD_Non_ARRA_20151217_03.csv", "@type": "dcat:Distribution", "title": "Rural Development Obligations and Disbursements (non-stimulus)" } ], "bureauCode": [ "005:55" ], "modified": "2016-03-01", "publisher": { "@type": "org:Organization", "name": "Rural Development, Department of Agriculture" }, "accrualPeriodicity": "R/P1M", "keyword": [ "ARRA", "Agriculture and Rural Development", "American Recovery and Reinvestment", "FAAD", "FAIN", "FFATA", "Federal Award Identifier Number", "Recovery Act", "Rural Development", "agriculture", "assistance", "data", "disbursement", "funding", "obligations", "rural", "usda" ] }, { "identifier": "USDA-RD-0019", "accessLevel": "non-public", "contactPoint": { "hasEmail": "mailto:greg.eschman@stl.usda.gov", "@type": "vcard:Contact", "fn": "Greg Eschman" }, "programCode": [ "005:001" ], "landingPage": "http://www.sc.egov.usda.gov/data/data_files.html", "description": "In accordance with the Federal Funding Accountability and Transparency Act of 2006 (FFATA) and the American Recovery and Reinvestment Act of 2009 (ARRA), this downloadable file identifies Rural Development non-ARRA program obligations for February 2015.", "title": "Rural Development Obligations and Disbursements (non ARRA) - February 2015", "distribution": [ { "@type": "dcat:Distribution", "downloadURL": "http://www.sc.egov.usda.gov/data/files/Non_ARRA/RD_Non_ARRA_20150219_03.csv", "mediaType": "text/csv", "title": "RD Obligations and Disbursements - Non Stimulus - February 2015" } ], "bureauCode": [ "005:55" ], "modified": "2016-03-01", "publisher": { "@type": "org:Organization", "name": "Rural Development, Department of Agriculture" }, "accrualPeriodicity": "R/P1M", "keyword": [ "ARRA", "Agriculture and Rural Development", "American Recovery and Reinvestment", "FAAD", "FAIN", "FFATA", "Federal Award Identifier Number", "Recovery Act", "Rural Development", "agriculture", "assistance", "data", "disbursement", "funding", "obligations", "rural", "usda" ] }, { "identifier": "USDA-RD-054", "accessLevel": "non-public", "contactPoint": { "hasEmail": "mailto:greg.eschman@stl.usda.gov", "@type": "vcard:Contact", "fn": "Greg Eschman" }, "programCode": [ "005:001" ], "landingPage": "http://www.sc.egov.usda.gov/data/data_files.html", "description": "In accordance with the Federal Funding Accountability and Transparency Act of 2006 (FFATA) and the American Recovery and Reinvestment Act of 2009 (ARRA), this downloadable file identifies Rural Development non-ARRA program obligations for February 2016.", "title": "Rural Development Obligations and Disbursements (non ARRA) - February 2016", "distribution": [ { "@type": "dcat:Distribution", "downloadURL": "https://www.sc.egov.usda.gov/data/files/Non_ARRA/RD_Non_ARRA_20160219_03.csv", "description": "Non-Stimulus Obligations and Disbursements - February 2016", "mediaType": "text/csv", "title": "Non-Stimulus Obligations and Disbursements" } ], "bureauCode": [ "005:55" ], "modified": "2016-03-01", "publisher": { "@type": "org:Organization", "name": "Rural Development, Department of Agriculture" }, "accrualPeriodicity": "R/P1M", "keyword": [ "ARRA", "Agriculture and Rural Development", "American Recovery and Reinvestment", "FAAD", "FAIN", "FFATA", "Federal Award Identifier Number", "Recovery Act", "Rural Development", "agriculture", "assistance", "data", "disbursement", "funding", "obligations", "rural", "usda" ] }, { "identifier": "USDA-RD-0020", "accessLevel": "non-public", "contactPoint": { "hasEmail": "mailto:greg.eschman@stl.usda.gov", "@type": "vcard:Contact", "fn": "Greg Eschman" }, "programCode": [ "005:001" ], "landingPage": "http://www.sc.egov.usda.gov/data/data_files.html", "description": "In accordance with the Federal Funding Accountability and Transparency Act of 2006 (FFATA) and the American Recovery and Reinvestment Act of 2009 (ARRA), this downloadable file identifies Rural Development non-ARRA program obligations for January 2015.", "title": "Rural Development Obligations and Disbursements (non ARRA) - January 2015", "distribution": [ { "@type": "dcat:Distribution", "downloadURL": "http://www.sc.egov.usda.gov/data/files/Non_ARRA/RD_Non_ARRA_20150115_03.csv", "mediaType": "text/csv", "title": "RD Obligations and Disbursments - Non Stimulus - January 2015" } ], "bureauCode": [ "005:55" ], "modified": "2016-03-01", "publisher": { "@type": "org:Organization", "name": "Rural Development, Department of Agriculture" }, "accrualPeriodicity": "R/P1M", "keyword": [ "ARRA", "Agriculture and Rural Development", "American Recovery and Reinvestment", "FAAD", "FAIN", "FFATA", "Federal Award Identifier Number", "Recovery Act", "Rural Development", "agriculture", "assistance", "data", "disbursement", "funding", "obligations", "rural", "usda" ] }, { "identifier": "USDA-RD-0052", "accessLevel": "non-public", "contactPoint": { "hasEmail": "mailto:greg.eschman@stl.usda.gov", "@type": "vcard:Contact", "fn": "Greg Eschman" }, "programCode": [ "005:001" ], "landingPage": "http://www.sc.egov.usda.gov/data/data_files.html", "description": "In accordance with the Federal Funding Accountability and Transparency Act of 2006 (FFATA) and the American Recovery and Reinvestment Act of 2009 (ARRA), this downloadable file identifies Rural Development non-ARRA program obligations for January 2016.", "title": "Rural Development Obligations and Disbursements (non ARRA) - January 2016", "distribution": [ { "@type": "dcat:Distribution", "downloadURL": "https://www.sc.egov.usda.gov/data/files/Non_ARRA/RD_Non_ARRA_20160204_03.csv", "description": "Non-Stimulus Obligations and Disbursements - January 2016", "mediaType": "text/csv", "title": "Non-Stimulus Obligations and Disbursements" } ], "bureauCode": [ "005:55" ], "modified": "2016-03-01", "publisher": { "@type": "org:Organization", "name": "Rural Development, Department of Agriculture" }, "accrualPeriodicity": "R/P1M", "keyword": [ "ARRA", "Agriculture and Rural Development", "American Recovery and Reinvestment", "FAAD", "FAIN", "FFATA", "Federal Award Identifier Number", "Recovery Act", "Rural Development", "agriculture", "assistance", "data", "disbursement", "funding", "obligations", "rural", "usda" ] }, { "identifier": "USDA-RD-064", "accessLevel": "non-public", "contactPoint": { "hasEmail": "mailto:greg.eschman@stl.usda.gov", "@type": "vcard:Contact", "fn": "Greg Eschman" }, "programCode": [ "005:001" ], "landingPage": "http://www.sc.egov.usda.gov/data/data_files.html", "description": "In accordance with the Federal Funding Accountability and Transparency Act of 2006 (FFATA) and the American Recovery and Reinvestment Act of 2009 (ARRA), this downloadable file identifies Rural Development non-ARRA program obligations for January 2017.", "title": "Rural Development Obligations and Disbursements (non ARRA) - January 2017", "distribution": [ { "@type": "dcat:Distribution", "downloadURL": "https://www.sc.egov.usda.gov/data/files/Non_ARRA/RD_Non_ARRA_20170120_03.csv", "description": "Non-Stimulus Obligations and Disbursements - January 2017", "mediaType": "text/csv", "title": "Non-Stimulus Obligations and Disbursements" } ], "bureauCode": [ "005:55" ], "modified": "2017-01-01", "publisher": { "@type": "org:Organization", "name": "Rural Development, Department of Agriculture" }, "accrualPeriodicity": "R/P1M", "keyword": [ "ARRA", "Agriculture and Rural Development", "American Recovery and Reinvestment", "FAAD", "FAIN", "FFATA", "Federal Award Identifier Number", "Recovery Act", "Rural Development", "agriculture", "assistance", "data", "disbursement", "funding", "obligations", "rural", "usda" ] }, { "identifier": "USDA-RD-0014", "accessLevel": "non-public", "contactPoint": { "hasEmail": "mailto:greg.eschman@stl.usda.gov", "@type": "vcard:Contact", "fn": "Greg Eschman" }, "programCode": [ "005:001" ], "landingPage": "http://www.sc.egov.usda.gov/data/data_files.html", "description": "In accordance with the Federal Funding Accountability and Transparency Act of 2006 (FFATA) and the American Recovery and Reinvestment Act of 2009 (ARRA), this downloadable file identifies Rural Development non-ARRA program obligations for July 2015.", "title": "Rural Development Obligations and Disbursements (non ARRA) - July 2015", "distribution": [ { "@type": "dcat:Distribution", "downloadURL": "http://www.sc.egov.usda.gov/data/files/Non_ARRA/RD_Non_ARRA_20150717_03.csv", "mediaType": "text/csv", "title": "Obligations and Disbursements - Non Stimulus - July 2015" } ], "bureauCode": [ "005:55" ], "modified": "2016-03-01", "publisher": { "@type": "org:Organization", "name": "Rural Development, Department of Agriculture" }, "accrualPeriodicity": "R/P1M", "keyword": [ "ARRA", "Agriculture and Rural Development", "American Recovery and Reinvestment", "FAAD", "FAIN", "FFATA", "Federal Award Identifier Number", "Recovery Act", "Rural Development", "agriculture", "assistance", "data", "disbursement", "funding", "obligations", "rural", "usda" ] }, { "identifier": "USDA-RD-059", "accessLevel": "non-public", "contactPoint": { "hasEmail": "mailto:greg.eschman@stl.usda.gov", "@type": "vcard:Contact", "fn": "Greg Eschman" }, "programCode": [ "005:001" ], "landingPage": "http://www.sc.egov.usda.gov/data/data_files.html", "description": "In accordance with the Federal Funding Accountability and Transparency Act of 2006 (FFATA) and the American Recovery and Reinvestment Act of 2009 (ARRA), this downloadable file identifies Rural Development non-ARRA program obligations for July 2016.", "title": "Rural Development Obligations and Disbursements (non ARRA) - July 2016", "distribution": [ { "@type": "dcat:Distribution", "downloadURL": "https://www.sc.egov.usda.gov/data/files/Non_ARRA/RD_Non_ARRA_20160719_03.csv", "description": "Non-Stimulus Obligations and Disbursements - July 2016", "mediaType": "text/csv", "title": "Non-Stimulus Obligations and Disbursements" } ], "bureauCode": [ "005:55" ], "modified": "2016-07-01", "publisher": { "@type": "org:Organization", "name": "Rural Development, Department of Agriculture" }, "accrualPeriodicity": "R/P1M", "keyword": [ "ARRA", "Agriculture and Rural Development", "American Recovery and Reinvestment", "FAAD", "FAIN", "FFATA", "Federal Award Identifier Number", "Recovery Act", "Rural Development", "agriculture", "assistance", "data", "disbursement", "funding", "obligations", "rural", "usda" ] }, { "identifier": "USDA-RD-0015", "accessLevel": "non-public", "contactPoint": { "hasEmail": "mailto:greg.eschman@stl.usda.gov", "@type": "vcard:Contact", "fn": "Greg Eschman" }, "programCode": [ "005:001" ], "landingPage": "http://www.sc.egov.usda.gov/data/data_files.html", "description": "In accordance with the Federal Funding Accountability and Transparency Act of 2006 (FFATA) and the American Recovery and Reinvestment Act of 2009 (ARRA), this downloadable file identifies Rural Development non-ARRA program obligations for June 2015.", "title": "Rural Development Obligations and Disbursements (non ARRA) - June 2015", "distribution": [ { "@type": "dcat:Distribution", "downloadURL": "http://www.sc.egov.usda.gov/data/files/Non_ARRA/RD_Non_ARRA_20150619_03.csv", "mediaType": "text/csv", "title": "Obligations and Disbursements - Non Stimulus - June 2015" } ], "bureauCode": [ "005:55" ], "modified": "2016-03-01", "publisher": { "@type": "org:Organization", "name": "Rural Development, Department of Agriculture" }, "accrualPeriodicity": "R/P1M", "keyword": [ "ARRA", "Agriculture and Rural Development", "American Recovery and Reinvestment", "FAAD", "FAIN", "FFATA", "Federal Award Identifier Number", "Recovery Act", "Rural Development", "agriculture", "assistance", "data", "disbursement", "funding", "obligations", "rural", "usda" ] }, { "identifier": "USDA-RD-058", "accessLevel": "non-public", "contactPoint": { "hasEmail": "mailto:greg.eschman@stl.usda.gov", "@type": "vcard:Contact", "fn": "Greg Eschman" }, "programCode": [ "005:001" ], "landingPage": "http://www.sc.egov.usda.gov/data/data_files.html", "description": "In accordance with the Federal Funding Accountability and Transparency Act of 2006 (FFATA) and the American Recovery and Reinvestment Act of 2009 (ARRA), this downloadable file identifies Rural Development non-ARRA program obligations for June 2016.", "title": "Rural Development Obligations and Disbursements (non ARRA) - June 2016", "distribution": [ { "@type": "dcat:Distribution", "downloadURL": "https://www.sc.egov.usda.gov/data/files/Non_ARRA/RD_Non_ARRA_20160603_03.csv", "description": "Non-Stimulus Obligations and Disbursements - June 2016", "mediaType": "text/csv", "title": "Non-Stimulus Obligations and Disbursements" } ], "bureauCode": [ "005:55" ], "modified": "2016-06-01", "publisher": { "@type": "org:Organization", "name": "Rural Development, Department of Agriculture" }, "accrualPeriodicity": "R/P1M", "keyword": [ "ARRA", "Agriculture and Rural Development", "American Recovery and Reinvestment", "FAAD", "FAIN", "FFATA", "Federal Award Identifier Number", "Recovery Act", "Rural Development", "agriculture", "assistance", "data", "disbursement", "funding", "obligations", "rural", "usda" ] }, { "identifier": "USDA-RD-0018", "accessLevel": "non-public", "contactPoint": { "hasEmail": "mailto:greg.eschman@stl.usda.gov", "@type": "vcard:Contact", "fn": "Greg Eschman" }, "programCode": [ "005:001" ], "landingPage": "http://www.sc.egov.usda.gov/data/data_files.html", "description": "In accordance with the Federal Funding Accountability and Transparency Act of 2006 (FFATA) and the American Recovery and Reinvestment Act of 2009 (ARRA), this downloadable file identifies Rural Development non-ARRA program obligations for March 2015.", "title": "Rural Development Obligations and Disbursements (non ARRA) - March 2015", "distribution": [ { "@type": "dcat:Distribution", "downloadURL": "http://www.sc.egov.usda.gov/data/files/Non_ARRA/RD_Non_ARRA_20150319_03.csv", "mediaType": "text/csv", "title": "RD Obligations and Disbursements - Non Stimulus - March 2015" } ], "bureauCode": [ "005:55" ], "modified": "2016-03-01", "publisher": { "@type": "org:Organization", "name": "Rural Development, Department of Agriculture" }, "accrualPeriodicity": "R/P1M", "keyword": [ "ARRA", "Agriculture and Rural Development", "American Recovery and Reinvestment", "FAAD", "FAIN", "FFATA", "Federal Award Identifier Number", "Recovery Act", "Rural Development", "agriculture", "assistance", "data", "disbursement", "funding", "obligations", "rural", "usda" ] }, { "identifier": "USDA-RD-055", "accessLevel": "non-public", "contactPoint": { "hasEmail": "mailto:greg.eschman@stl.usda.gov", "@type": "vcard:Contact", "fn": "Greg Eschman" }, "programCode": [ "005:001" ], "landingPage": "http://www.sc.egov.usda.gov/data/data_files.html", "description": "In accordance with the Federal Funding Accountability and Transparency Act of 2006 (FFATA) and the American Recovery and Reinvestment Act of 2009 (ARRA), this downloadable file identifies Rural Development non-ARRA program obligations for March 2016.", "title": "Rural Development Obligations and Disbursements (non ARRA) - March 2016", "distribution": [ { "@type": "dcat:Distribution", "downloadURL": "https://www.sc.egov.usda.gov/data/files/Non_ARRA/RD_Non_ARRA_20160316_03.csv", "description": "Non-Stimulus Obligations and Disbursements - March 2016", "mediaType": "text/csv", "title": "Non-Stimulus Obligations and Disbursements" } ], "bureauCode": [ "005:55" ], "modified": "2016-03-01", "publisher": { "@type": "org:Organization", "name": "Rural Development, Department of Agriculture" }, "accrualPeriodicity": "R/P1M", "keyword": [ "ARRA", "Agriculture and Rural Development", "American Recovery and Reinvestment", "FAAD", "FAIN", "FFATA", "Federal Award Identifier Number", "Recovery Act", "Rural Development", "agriculture", "assistance", "data", "disbursement", "funding", "obligations", "rural", "usda" ] }, { "identifier": "USDA-RD-0016", "accessLevel": "non-public", "contactPoint": { "hasEmail": "mailto:greg.eschman@stl.usda.gov", "@type": "vcard:Contact", "fn": "Greg Eschman" }, "programCode": [ "005:001" ], "landingPage": "http://www.sc.egov.usda.gov/data/data_files.html", "description": "In accordance with the Federal Funding Accountability and Transparency Act of 2006 (FFATA) and the American Recovery and Reinvestment Act of 2009 (ARRA), this downloadable file identifies Rural Development non-ARRA program obligations for May 2015.", "title": "Rural Development Obligations and Disbursements (non ARRA) - May 2015", "distribution": [ { "@type": "dcat:Distribution", "downloadURL": "http://www.sc.egov.usda.gov/data/files/Non_ARRA/RD_Non_ARRA_20150505_03.csv", "mediaType": "text/csv", "title": "Obligations and Disbursements - Non Stimulus - May 2015" } ], "bureauCode": [ "005:55" ], "modified": "2016-03-01", "publisher": { "@type": "org:Organization", "name": "Rural Development, Department of Agriculture" }, "accrualPeriodicity": "R/P1M", "keyword": [ "ARRA", "Agriculture and Rural Development", "American Recovery and Reinvestment", "FAAD", "FAIN", "FFATA", "Federal Award Identifier Number", "Recovery Act", "Rural Development", "agriculture", "assistance", "data", "disbursement", "funding", "obligations", "rural", "usda" ] }, { "identifier": "USDA-RD-057", "accessLevel": "non-public", "contactPoint": { "hasEmail": "mailto:greg.eschman@stl.usda.gov", "@type": "vcard:Contact", "fn": "Greg Eschman" }, "programCode": [ "005:001" ], "landingPage": "http://www.sc.egov.usda.gov/data/data_files.html", "description": "In accordance with the Federal Funding Accountability and Transparency Act of 2006 (FFATA) and the American Recovery and Reinvestment Act of 2009 (ARRA), this downloadable file identifies Rural Development non-ARRA program obligations for May 2016.", "title": "Rural Development Obligations and Disbursements (non ARRA) - May 2016", "distribution": [ { "@type": "dcat:Distribution", "downloadURL": "https://www.sc.egov.usda.gov/data/files/Non_ARRA/RD_Non_ARRA_20160519_03.csv", "description": "Non-Stimulus Obligations and Disbursements - May 2016", "mediaType": "text/csv", "title": "Non-Stimulus Obligations and Disbursements" } ], "bureauCode": [ "005:55" ], "modified": "2016-05-01", "publisher": { "@type": "org:Organization", "name": "Rural Development, Department of Agriculture" }, "accrualPeriodicity": "R/P1M", "keyword": [ "ARRA", "Agriculture and Rural Development", "American Recovery and Reinvestment", "FAAD", "FAIN", "FFATA", "Federal Award Identifier Number", "Recovery Act", "Rural Development", "agriculture", "assistance", "data", "disbursement", "funding", "obligations", "rural", "usda" ] }, { "identifier": "USDA-RD-0023", "accessLevel": "non-public", "contactPoint": { "hasEmail": "mailto:greg.eschman@stl.usda.gov", "@type": "vcard:Contact", "fn": "Greg Eschman" }, "programCode": [ "005:001" ], "landingPage": "http://www.sc.egov.usda.gov/data/data_files.html", "description": "In accordance with the Federal Funding Accountability and Transparency Act of 2006 (FFATA) and the American Recovery and Reinvestment Act of 2009 (ARRA), this downloadable file identifies Rural Development non-ARRA program obligations for November 2015.", "title": "Rural Development Obligations and Disbursements (non ARRA) - November 2015", "distribution": [ { "@type": "dcat:Distribution", "downloadURL": "http://www.sc.egov.usda.gov/data/files/Non_ARRA/RD_Non_ARRA_20151120_03.csv", "description": "Non-ARRA related obligations for Rural Development - November 2015", "mediaType": "text/csv", "title": "Rural Developme Non-ARRA - November 2015" } ], "bureauCode": [ "005:55" ], "modified": "2016-03-01", "publisher": { "@type": "org:Organization", "name": "Rural Development, Department of Agriculture" }, "accrualPeriodicity": "R/P1M", "keyword": [ "ARRA", "Agriculture and Rural Development", "American Recovery and Reinvestment", "FAAD", "FAIN", "FFATA", "Federal Award Identifier Number", "Recovery Act", "Rural Development", "agriculture", "assistance", "data", "disbursement", "funding", "obligations", "rural", "usda" ] }, { "identifier": "USDA-RD-063", "accessLevel": "non-public", "contactPoint": { "hasEmail": "mailto:greg.eschman@stl.usda.gov", "@type": "vcard:Contact", "fn": "Greg Eschman" }, "programCode": [ "005:001" ], "landingPage": "http://www.sc.egov.usda.gov/data/data_files.html", "description": "In accordance with the Federal Funding Accountability and Transparency Act of 2006 (FFATA) and the American Recovery and Reinvestment Act of 2009 (ARRA), this downloadable file identifies Rural Development non-ARRA program obligations for November 2016.", "title": "Rural Development Obligations and Disbursements (non ARRA) - November 2016", "distribution": [ { "@type": "dcat:Distribution", "downloadURL": "https://www.sc.egov.usda.gov/data/files/Non_ARRA/RD_Non_ARRA_20161120_03.csv", "description": "Non-Stimulus Obligations and Disbursements - November 2016", "mediaType": "text/csv", "title": "Non-Stimulus Obligations and Disbursements" } ], "bureauCode": [ "005:55" ], "modified": "2016-11-01", "publisher": { "@type": "org:Organization", "name": "Rural Development, Department of Agriculture" }, "accrualPeriodicity": "R/P1M", "keyword": [ "ARRA", "Agriculture and Rural Development", "American Recovery and Reinvestment", "FAAD", "FAIN", "FFATA", "Federal Award Identifier Number", "Recovery Act", "Rural Development", "agriculture", "assistance", "data", "disbursement", "funding", "obligations", "rural", "usda" ] }, { "identifier": "USDA-RD-0003", "accessLevel": "non-public", "contactPoint": { "hasEmail": "mailto:greg.eschman@stl.usda.gov", "@type": "vcard:Contact", "fn": "Greg Eschman" }, "programCode": [ "005:001" ], "landingPage": "http://www.sc.egov.usda.gov/data/data_files.html", "description": "In accordance with the Federal Funding Accountability and Transparency Act of 2006 (FFATA) and the American Recovery and Reinvestment Act of 2009 (ARRA), this downloadable file identifies Rural Development non-ARRA program obligations for October 2015.", "title": "Rural Development Obligations and Disbursements (non ARRA) - October 2015", "distribution": [ { "@type": "dcat:Distribution", "downloadURL": "http://www.sc.egov.usda.gov/data/files/Non_ARRA/RD_Non_ARRA_20151002_03.csv", "mediaType": "text/csv", "title": "Obligations and Disbursements - Non Stimulus - October 2015" } ], "bureauCode": [ "005:55" ], "modified": "2015-03-01", "publisher": { "@type": "org:Organization", "name": "Rural Development, Department of Agriculture" }, "accrualPeriodicity": "R/P1M", "keyword": [ "ARRA", "Agriculture and Rural Development", "American Recovery and Reinvestment", "FAAD", "FAIN", "FFATA", "Federal Award Identifier Number", "Recovery Act", "Rural Development", "agriculture", "assistance", "data", "disbursement", "funding", "obligations", "rural", "usda" ] }, { "identifier": "USDA-RD-062", "accessLevel": "non-public", "contactPoint": { "hasEmail": "mailto:greg.eschman@stl.usda.gov", "@type": "vcard:Contact", "fn": "Greg Eschman" }, "programCode": [ "005:001" ], "landingPage": "http://www.sc.egov.usda.gov/data/data_files.html", "description": "In accordance with the Federal Funding Accountability and Transparency Act of 2006 (FFATA) and the American Recovery and Reinvestment Act of 2009 (ARRA), this downloadable file identifies Rural Development non-ARRA program obligations for October 2016.", "title": "Rural Development Obligations and Disbursements (non ARRA) - October 2016", "distribution": [ { "@type": "dcat:Distribution", "downloadURL": "https://www.sc.egov.usda.gov/data/files/Non_ARRA/RD_Non_ARRA_20161018_03.csv", "description": "Non-Stimulus Obligations and Disbursements - October 2016", "mediaType": "text/csv", "title": "Non-Stimulus Obligations and Disbursements" } ], "bureauCode": [ "005:55" ], "modified": "2016-10-01", "publisher": { "@type": "org:Organization", "name": "Rural Development, Department of Agriculture" }, "accrualPeriodicity": "R/P1M", "keyword": [ "ARRA", "Agriculture and Rural Development", "American Recovery and Reinvestment", "FAAD", "FAIN", "FFATA", "Federal Award Identifier Number", "Recovery Act", "Rural Development", "agriculture", "assistance", "data", "disbursement", "funding", "obligations", "rural", "usda" ] }, { "identifier": "USDA-RD-0012", "accessLevel": "non-public", "contactPoint": { "hasEmail": "mailto:greg.eschman@stl.usda.gov", "@type": "vcard:Contact", "fn": "Greg Eschman" }, "programCode": [ "005:001" ], "landingPage": "http://www.sc.egov.usda.gov/data/data_files.html", "description": "In accordance with the Federal Funding Accountability and Transparency Act of 2006 (FFATA) and the American Recovery and Reinvestment Act of 2009 (ARRA), this downloadable file identifies Rural Development non-ARRA program obligations for September 2015.", "title": "Rural Development Obligations and Disbursements (non ARRA) - September 2015", "distribution": [ { "@type": "dcat:Distribution", "downloadURL": "http://www.sc.egov.usda.gov/data/files/Non_ARRA/RD_Non_ARRA_20150914_03.csv", "mediaType": "text/csv", "title": "Obligations and Disbursements - Non Stimulus - September 2015" } ], "bureauCode": [ "005:55" ], "modified": "2016-03-01", "publisher": { "@type": "org:Organization", "name": "Rural Development, Department of Agriculture" }, "accrualPeriodicity": "R/P1M", "keyword": [ "ARRA", "Agriculture and Rural Development", "American Recovery and Reinvestment", "FAAD", "FAIN", "FFATA", "Federal Award Identifier Number", "Recovery Act", "Rural Development", "agriculture", "assistance", "data", "disbursement", "funding", "obligations", "rural", "usda" ] }, { "identifier": "USDA-RD-061", "accessLevel": "non-public", "contactPoint": { "hasEmail": "mailto:greg.eschman@stl.usda.gov", "@type": "vcard:Contact", "fn": "Greg Eschman" }, "programCode": [ "005:001" ], "landingPage": "http://www.sc.egov.usda.gov/data/data_files.html", "description": "In accordance with the Federal Funding Accountability and Transparency Act of 2006 (FFATA) and the American Recovery and Reinvestment Act of 2009 (ARRA), this downloadable file identifies Rural Development non-ARRA program obligations for September 2016.", "title": "Rural Development Obligations and Disbursements (non ARRA) - September 2016", "distribution": [ { "@type": "dcat:Distribution", "downloadURL": "https://www.sc.egov.usda.gov/data/files/Non_ARRA/RD_Non_ARRA_20160906_03.csv", "description": "Non-Stimulus Obligations and Disbursements - September 2016", "mediaType": "text/csv", "title": "Non-Stimulus Obligations and Disbursements" } ], "bureauCode": [ "005:55" ], "modified": "2016-09-01", "publisher": { "@type": "org:Organization", "name": "Rural Development, Department of Agriculture" }, "accrualPeriodicity": "R/P1M", "keyword": [ "ARRA", "Agriculture and Rural Development", "American Recovery and Reinvestment", "FAAD", "FAIN", "FFATA", "Federal Award Identifier Number", "Recovery Act", "Rural Development", "agriculture", "assistance", "data", "disbursement", "funding", "obligations", "rural", "usda" ] }, { "identifier": "USDA-RD-021", "accessLevel": "public", "contactPoint": { "hasEmail": "mailto:gayle.doss@stl.usda.gov", "@type": "vcard:Contact", "fn": "Gayle Doss" }, "programCode": [ "005:004" ], "landingPage": "http://www.sc.egov.usda.gov/data/data_files.html", "description": "These ESRI shapefiles show spatial data, points on a map. In addition, shapefiles provide attribute data for each point. Shapefile’s attribute data include spatial information such as latitude and longitude, the address, and obligation amount.", "title": "USDA Rural Development (RD) - Obligations by Location", "distribution": [ { "@type": "dcat:Distribution", "downloadURL": "http://www.sc.egov.usda.gov/data/files/RD_Obligations/RD_Obligations_2014_06.zip", "mediaType": "application/zip", "title": "RD Obligations by Location Shapefiles" } ], "license": "https://creativecommons.org/publicdomain/zero/1.0/", "bureauCode": [ "005:55" ], "modified": "2015-10-27", "publisher": { "@type": "org:Organization", "name": "Rural Development, Department of Agriculture" }, "accrualPeriodicity": "R/P6M", "keyword": [ "Agriculture and Rural Development", "Obligations", "Property", "RD", "Rural Development", "USDA", "agriculture", "data", "geospatial", "latitude", "longitude", "spatial", "usda" ] }, { "identifier": "USDA-RD-007", "accessLevel": "public", "contactPoint": { "hasEmail": "mailto:gayle.doss@stl.usda.gov", "@type": "vcard:Contact", "fn": "Gayle Doss" }, "programCode": [ "005:004" ], "landingPage": "http://www.sc.egov.usda.gov/data/data_files.html", "description": "This data is used to determine eligibility for certain USDA broadband loan and grant programs.", "title": "USDA Rural Development (RD) Property Eligibility - Broadband", "distribution": [ { "@type": "dcat:Distribution", "downloadURL": "http://www.sc.egov.usda.gov/data/files/Broadband_Ineligible.zip", "description": "This map file contains information for determining property ineligible for broadband programs", "mediaType": "application/zip", "title": "Property Ineligibilty - Broadband" }, { "@type": "dcat:Distribution", "downloadURL": "http://eligibility.sc.egov.usda.gov/eligibility/welcomeAction.do", "mediaType": "text/html", "title": "Housing Income Eligibility Calculator" } ], "license": "https://creativecommons.org/publicdomain/zero/1.0/", "bureauCode": [ "005:55" ], "modified": "2014-05-01", "publisher": { "@type": "org:Organization", "name": "Rural Development, Department of Agriculture" }, "accrualPeriodicity": "R/P6M", "keyword": [ "Agriculture and Rural Development", "Property", "Rural Development", "USDA", "agriculture", "broadband", "data", "eligibility", "usda" ] }, { "identifier": "USDA-RD-041", "accessLevel": "public", "contactPoint": { "hasEmail": "mailto:karen.priestly@wdc.usda.gov", "@type": "vcard:Contact", "fn": "Public Affairs Office" }, "programCode": [ "005:008" ], "landingPage": "http://www.sc.egov.usda.gov/data/CF.html", "description": "Locations and characteristics of projects that have received USDA Rural Development Community Facilities Loans, Grants, and Guaranteed Loans. Includes latitude and longitude coordinates, facility name and address, NAICS Code, funding type, obligation date and amount, total development cost, borrower name and type, and more", "title": "USDA Rural Development Community Facilities Loan, Grant, and Guaranteed Loan Data", "distribution": [ { "@type": "dcat:Distribution", "downloadURL": "http://www.sc.egov.usda.gov/data/files/CF/Community_Facilities_Data_Dictionary_September_2016.pdf", "description": "USDA RD Community Facilities Data Dictionary as of September 2016", "mediaType": "application/pdf", "title": "USDA RD Community Facilities Data Dictionary" }, { "accessURL": "http://www.sc.egov.usda.gov/data/files/CF/USDA%20Community%20Facilities%20Loans%20and%20Grants%20as%20of%2009.01.2016.xls", "@type": "dcat:Distribution", "title": "USDA RD Community Facilities CF Loans and Grants" } ], "license": "https://creativecommons.org/publicdomain/zero/1.0/", "bureauCode": [ "005:55" ], "modified": "2016-08-29", "publisher": { "@type": "org:Organization", "name": "Rural Development, Department of Agriculture" }, "accrualPeriodicity": "R/P6M", "keyword": [ "Active Loans", "Agriculture", "Agriculture and Rural Development", "CF", "Community Facilities", "Condo", "Coop", "Grant", "Guaranteed Loan", "Loan", "Loans by County", "PUD", "Rural Development", "Rural Housing Service", "USDA", "United States Department of Agriculture", "agriculture", "data", "disaster assistance", "home mortgage", "home purchease", "lending", "property", "rental", "rural", "self help" ] }, { "identifier": "USDA-RD-028", "accessLevel": "public", "contactPoint": { "hasEmail": "mailto:ed.duval@wdc.usda.gov", "@type": "vcard:Contact", "fn": "Ed Duval" }, "programCode": [ "005:008" ], "landingPage": "http://www.sc.egov.usda.gov/data/data_files.html", "description": "Multi Family Housing: A downloadable database file that identifies pertinent information related to USDA Rural Development housing assistance and the Multi Family Housing Section 515 Program for April 2016.", "title": "USDA Rural Development Multi Family Housing - April 2016", "distribution": [ { "accessURL": "http://www.sc.egov.usda.gov/data/files/MFH_Section_515/MFH_section_515_20160401_03.zip", "@type": "dcat:Distribution", "description": "MFH Section 515 April 2016", "title": "MFH Section 515 April 2016" } ], "license": "https://creativecommons.org/publicdomain/zero/1.0/", "bureauCode": [ "005:55" ], "modified": "2016-03-02", "publisher": { "@type": "org:Organization", "name": "Rural Development, Department of Agriculture" }, "accrualPeriodicity": "R/P1M", "keyword": [ "Agriculture and Rural Development", "Disaster Relief", "Rural Development", "Section 515", "USDA", "United States Department of Agriculture", "agriculture", "data", "disaster assistance", "dwelling", "property", "rental" ] }, { "identifier": "USDA-RD-55", "accessLevel": "public", "contactPoint": { "hasEmail": "mailto:ed.duval@wdc.usda.gov", "@type": "vcard:Contact", "fn": "Ed Duval" }, "programCode": [ "005:008" ], "landingPage": "http://www.sc.egov.usda.gov/data/data_files.html", "description": "Multi Family Housing: A downloadable database file that identifies pertinent information related to USDA Rural Development housing assistance and the Multi Family Housing Section 515 Program for April 2017.", "title": "USDA Rural Development Multi Family Housing - April 2017", "distribution": [ { "@type": "dcat:Distribution", "downloadURL": "https://www.sc.egov.usda.gov/data/files/MFH_Section_515/MFH_section_515_20170403_03.zip", "description": "Active Projects by month", "mediaType": "application/zip", "title": "MFH Section 515" } ], "license": "https://creativecommons.org/publicdomain/zero/1.0/", "bureauCode": [ "005:55" ], "modified": "2017-03-02", "publisher": { "@type": "org:Organization", "name": "Rural Development, Department of Agriculture" }, "accrualPeriodicity": "R/P1M", "keyword": [ "Agriculture and Rural Development", "Disaster Relief", "Rural Development", "Section 515", "USDA", "United States Department of Agriculture", "agriculture", "data", "disaster assistance", "dwelling", "property", "rental" ] }, { "identifier": "USDA-RD-67", "accessLevel": "public", "contactPoint": { "hasEmail": "mailto:ed.duval@wdc.usda.gov", "@type": "vcard:Contact", "fn": "Ed Duval" }, "programCode": [ "005:008" ], "landingPage": "http://www.sc.egov.usda.gov/data/data_files.html", "description": "Multi Family Housing: A downloadable database file that identifies pertinent information related to USDA Rural Development housing assistance and the Multi Family Housing Section 515 Program for April 2018.", "title": "USDA Rural Development Multi Family Housing - April 2018", "distribution": [ { "@type": "dcat:Distribution", "downloadURL": "https://www.sc.egov.usda.gov/data/files/MFH_Section_515/MFH_section_515_20180402_03.zip", "mediaType": "application/zip", "title": "MFH Section 515 - April 2018" } ], "license": "https://creativecommons.org/publicdomain/zero/1.0/", "bureauCode": [ "005:55" ], "modified": "2018-03-01", "publisher": { "@type": "org:Organization", "name": "Rural Development, Department of Agriculture" }, "accrualPeriodicity": "R/P1M", "keyword": [ "Agriculture and Rural Development", "Disaster Relief", "Rural Development", "Section 515", "USDA", "United States Department of Agriculture", "agriculture", "data", "disaster assistance", "dwelling", "property", "rental" ] }, { "identifier": "USDA-RD-043", "accessLevel": "public", "contactPoint": { "hasEmail": "mailto:ed.duval@wdc.usda.gov", "@type": "vcard:Contact", "fn": "Ed Duval" }, "programCode": [ "005:008" ], "landingPage": "http://www.sc.egov.usda.gov/data/data_files.html", "description": "Multi Family Housing: A downloadable database file that identifies pertinent information related to USDA Rural Development housing assistance and the Multi Family Housing Section 515 Program for August 2016.", "title": "USDA Rural Development Multi Family Housing - August 2016", "distribution": [ { "@type": "dcat:Distribution", "downloadURL": "http://www.sc.egov.usda.gov/data/files/MFH_Section_515/MFH_section_515_20160801_03.zip", "mediaType": "application/zip", "title": "USDA MFH Section 515 - August 2016" } ], "license": "https://creativecommons.org/publicdomain/zero/1.0/", "bureauCode": [ "005:55" ], "modified": "2016-07-05", "publisher": { "@type": "org:Organization", "name": "Rural Development, Department of Agriculture" }, "accrualPeriodicity": "R/P1M", "keyword": [ "Agriculture and Rural Development", "Disaster Relief", "Rural Development", "Section 515", "USDA", "United States Department of Agriculture", "agriculture", "data", "disaster assistance", "dwelling", "property", "rental" ] }, { "identifier": "USDA-RD-59", "accessLevel": "public", "contactPoint": { "hasEmail": "mailto:ed.duval@wdc.usda.gov", "@type": "vcard:Contact", "fn": "Ed Duval" }, "programCode": [ "005:008" ], "landingPage": "http://www.sc.egov.usda.gov/data/data_files.html", "description": "Multi Family Housing: A downloadable database file that identifies pertinent information related to USDA Rural Development housing assistance and the Multi Family Housing Section 515 Program for August 2017.", "title": "USDA Rural Development Multi Family Housing - August 2017", "distribution": [ { "@type": "dcat:Distribution", "downloadURL": "https://www.sc.egov.usda.gov/data/files/MFH_Section_515/MFH_section_515_20170801_03.zip", "mediaType": "application/zip", "title": "USDA MFH Section 515 - August 2017" } ], "license": "https://creativecommons.org/publicdomain/zero/1.0/", "bureauCode": [ "005:55" ], "modified": "2017-03-02", "publisher": { "@type": "org:Organization", "name": "Rural Development, Department of Agriculture" }, "accrualPeriodicity": "R/P1M", "keyword": [ "Agriculture and Rural Development", "Disaster Relief", "Rural Development", "Section 515", "USDA", "United States Department of Agriculture", "agriculture", "data", "disaster assistance", "dwelling", "property", "rental" ] }, { "identifier": "USDA-RD-71", "accessLevel": "public", "contactPoint": { "hasEmail": "mailto:ed.duval@wdc.usda.gov", "@type": "vcard:Contact", "fn": "Ed Duval" }, "programCode": [ "005:008" ], "landingPage": "http://www.sc.egov.usda.gov/data/data_files.html", "description": "Multi Family Housing: A downloadable database file that identifies pertinent information related to USDA Rural Development housing assistance and the Multi Family Housing Section 515 Program for August 2018.", "title": "USDA Rural Development Multi Family Housing - August 2018", "distribution": [ { "@type": "dcat:Distribution", "downloadURL": "https://www.sc.egov.usda.gov/data/files/MFH_Section_515/MFH_section_515_20180801_03.zip", "mediaType": "application/zip", "title": "MFH Section 515 - August 2018" } ], "license": "https://creativecommons.org/publicdomain/zero/1.0/", "bureauCode": [ "005:55" ], "modified": "2018-03-01", "publisher": { "@type": "org:Organization", "name": "Rural Development, Department of Agriculture" }, "accrualPeriodicity": "R/P1M", "keyword": [ "Agriculture and Rural Development", "Disaster Relief", "Rural Development", "Section 515", "USDA", "United States Department of Agriculture", "agriculture", "data", "disaster assistance", "dwelling", "property", "rental" ] }, { "identifier": "USDA-RD-022", "accessLevel": "public", "contactPoint": { "hasEmail": "mailto:ed.duval@wdc.usda.gov", "@type": "vcard:Contact", "fn": "Ed Duval" }, "programCode": [ "005:008" ], "landingPage": "http://www.sc.egov.usda.gov/data/data_files.html", "description": "Multi Family Housing: A downloadable database file that identifies pertinent information related to USDA Rural Development housing assistance and the Multi Family Housing Section 515 Program for December 2015.", "title": "USDA Rural Development Multi Family Housing - December 2015", "distribution": [ { "@type": "dcat:Distribution", "downloadURL": "http://www.sc.egov.usda.gov/data/files/MFH_Section_515/MFH_section_515_20151201_03.zip", "mediaType": "application/zip", "title": "MFH Section 515 December 2015" } ], "license": "https://creativecommons.org/publicdomain/zero/1.0/", "bureauCode": [ "005:55" ], "modified": "2015-12-02", "publisher": { "@type": "org:Organization", "name": "Rural Development, Department of Agriculture" }, "accrualPeriodicity": "R/P1M", "keyword": [ "Agriculture and Rural Development", "Disaster Relief", "Rural Development", "Section 515", "agriculture", "data", "disaster assistance", "dwelling", "property", "rental" ] }, { "identifier": "USDA-RD-51", "accessLevel": "public", "contactPoint": { "hasEmail": "mailto:ed.duval@wdc.usda.gov", "@type": "vcard:Contact", "fn": "Ed Duval" }, "programCode": [ "005:008" ], "landingPage": "http://www.sc.egov.usda.gov/data/data_files.html", "description": "Multi Family Housing: A downloadable database file that identifies pertinent information related to USDA Rural Development housing assistance and the Multi Family Housing Section 515 Program for December 2016.", "title": "USDA Rural Development Multi Family Housing - December 2016", "distribution": [ { "@type": "dcat:Distribution", "downloadURL": "https://www.sc.egov.usda.gov/data/files/MFH_Section_515/MFH_section_515_20161201_03.zip", "description": "MFH Section 515 December 2016", "mediaType": "application/zip", "title": "Active MFH Section 515 by Month - December 2016" } ], "license": "https://creativecommons.org/publicdomain/zero/1.0/", "bureauCode": [ "005:55" ], "modified": "2016-12-01", "publisher": { "@type": "org:Organization", "name": "Rural Development, Department of Agriculture" }, "accrualPeriodicity": "R/P1M", "keyword": [ "Agriculture and Rural Development", "Disaster Relief", "Rural Development", "Section 515", "USDA", "United States Department of Agriculture", "agriculture", "data", "disaster assistance", "dwelling", "property", "rental" ] }, { "identifier": "USDA-RD-63", "accessLevel": "public", "contactPoint": { "hasEmail": "mailto:ed.duval@wdc.usda.gov", "@type": "vcard:Contact", "fn": "Ed Duval" }, "programCode": [ "005:008" ], "landingPage": "http://www.sc.egov.usda.gov/data/data_files.html", "description": "Multi Family Housing: A downloadable database file that identifies pertinent information related to USDA Rural Development housing assistance and the Multi Family Housing Section 515 Program for December 2017.", "title": "USDA Rural Development Multi Family Housing - December 2017", "distribution": [ { "@type": "dcat:Distribution", "downloadURL": "https://www.sc.egov.usda.gov/data/files/MFH_Section_515/MFH_section_515_20171201_03.zip", "mediaType": "application/zip", "title": "MFH Section 515 december 2017" } ], "license": "https://creativecommons.org/publicdomain/zero/1.0/", "bureauCode": [ "005:55" ], "modified": "2017-11-02", "publisher": { "@type": "org:Organization", "name": "Rural Development, Department of Agriculture" }, "accrualPeriodicity": "R/P1M", "keyword": [ "Agriculture and Rural Development", "Disaster Relief", "Rural Development", "Section 515", "USDA", "United States Department of Agriculture", "agriculture", "data", "disaster assistance", "dwelling", "property", "rental" ] }, { "identifier": "USDA-RD-026", "accessLevel": "public", "contactPoint": { "hasEmail": "mailto:ed.duval@wdc.usda.gov", "@type": "vcard:Contact", "fn": "Ed Duval" }, "programCode": [ "005:008" ], "landingPage": "http://www.sc.egov.usda.gov/data/data_files.html", "description": "Multi Family Housing: A downloadable database file that identifies pertinent information related to USDA Rural Development housing assistance and the Multi Family Housing Section 515 Program for February 2016.", "title": "USDA Rural Development Multi Family Housing - February 2016", "distribution": [ { "@type": "dcat:Distribution", "downloadURL": "http://www.sc.egov.usda.gov/data/files/MFH_Section_515/MFH_section_515_20160201_03.zip", "description": "USDA Rural Development Section 515 MFH - February 2016", "mediaType": "application/zip", "title": "USDA Rural Development Section 515 MFH - February 2016" } ], "license": "https://creativecommons.org/publicdomain/zero/1.0/", "bureauCode": [ "005:55" ], "modified": "2016-02-02", "publisher": { "@type": "org:Organization", "name": "Rural Development, Department of Agriculture" }, "accrualPeriodicity": "R/P1M", "keyword": [ "Agriculture and Rural Development", "Disaster Relief", "Rural Development", "Section 515", "agriculture", "data", "disaster assistance", "dwelling", "property", "rental" ] }, { "identifier": "USDA-RD-53", "accessLevel": "public", "contactPoint": { "hasEmail": "mailto:ed.duval@wdc.usda.gov", "@type": "vcard:Contact", "fn": "Ed Duval" }, "programCode": [ "005:008" ], "landingPage": "http://www.sc.egov.usda.gov/data/data_files.html", "description": "Multi Family Housing: A downloadable database file that identifies pertinent information related to USDA Rural Development housing assistance and the Multi Family Housing Section 515 Program for February 2017.", "title": "USDA Rural Development Multi Family Housing - February 2017", "distribution": [ { "@type": "dcat:Distribution", "downloadURL": "https://www.sc.egov.usda.gov/data/files/MFH_Section_515/MFH_section_515_20170201_03.zip", "description": "MFH Section 515 - January 2017", "mediaType": "application/zip", "title": "MFH Section 515 - January 2017" } ], "license": "https://creativecommons.org/publicdomain/zero/1.0/", "bureauCode": [ "005:55" ], "modified": "2017-01-01", "publisher": { "@type": "org:Organization", "name": "Rural Development, Department of Agriculture" }, "accrualPeriodicity": "R/P1M", "keyword": [ "Agriculture and Rural Development", "Disaster Relief", "Rural Development", "Section 515", "USDA", "United States Department of Agriculture", "agriculture", "data", "disaster assistance", "dwelling", "property", "rental" ] }, { "identifier": "USDA-RD-65", "accessLevel": "public", "contactPoint": { "hasEmail": "mailto:ed.duval@wdc.usda.gov", "@type": "vcard:Contact", "fn": "Ed Duval" }, "programCode": [ "005:008" ], "landingPage": "http://www.sc.egov.usda.gov/data/data_files.html", "description": "Multi Family Housing: A downloadable database file that identifies pertinent information related to USDA Rural Development housing assistance and the Multi Family Housing Section 515 Program for February 2018.", "title": "USDA Rural Development Multi Family Housing - February 2018", "distribution": [ { "@type": "dcat:Distribution", "downloadURL": "https://www.sc.egov.usda.gov/data/files/MFH_Section_515/MFH_section_515_20180201_03.zip", "mediaType": "application/zip", "title": "MFH Section 515 February 2018" } ], "license": "https://creativecommons.org/publicdomain/zero/1.0/", "bureauCode": [ "005:55" ], "modified": "2018-02-01", "publisher": { "@type": "org:Organization", "name": "Rural Development, Department of Agriculture" }, "accrualPeriodicity": "R/P1M", "keyword": [ "Agriculture and Rural Development", "Disaster Relief", "Rural Development", "Section 515", "USDA", "United States Department of Agriculture", "agriculture", "data", "disaster assistance", "dwelling", "property", "rental" ] }, { "identifier": "USDA-RD-025", "accessLevel": "public", "contactPoint": { "hasEmail": "mailto:ed.duval@wdc.usda.gov", "@type": "vcard:Contact", "fn": "Ed Duval" }, "programCode": [ "005:008" ], "landingPage": "http://www.sc.egov.usda.gov/data/data_files.html", "description": "Multi Family Housing: A downloadable database file that identifies pertinent information related to USDA Rural Development housing assistance and the Multi Family Housing Section 515 Program for January 2016.", "title": "USDA Rural Development Multi Family Housing - January 2016", "distribution": [ { "@type": "dcat:Distribution", "downloadURL": "http://www.sc.egov.usda.gov/data/files/MFH_Section_515/MFH_section_515_20160104_03.zip", "mediaType": "application/zip", "title": "MFH Section 515 January 2016" } ], "license": "https://creativecommons.org/publicdomain/zero/1.0/", "bureauCode": [ "005:55" ], "modified": "2016-01-02", "publisher": { "@type": "org:Organization", "name": "Rural Development, Department of Agriculture" }, "accrualPeriodicity": "R/P1M", "keyword": [ "Agriculture and Rural Development", "Disaster Relief", "Rural Development", "Section 515", "agriculture", "data", "disaster assistance", "dwelling", "property", "rental" ] }, { "identifier": "USDA-RD-52", "accessLevel": "public", "contactPoint": { "hasEmail": "mailto:ed.duval@wdc.usda.gov", "@type": "vcard:Contact", "fn": "Ed Duval" }, "programCode": [ "005:008" ], "landingPage": "http://www.sc.egov.usda.gov/data/data_files.html", "description": "Multi Family Housing: A downloadable database file that identifies pertinent information related to USDA Rural Development housing assistance and the Multi Family Housing Section 515 Program for January 2017.", "title": "USDA Rural Development Multi Family Housing - January 2017", "distribution": [ { "@type": "dcat:Distribution", "downloadURL": "https://www.sc.egov.usda.gov/data/files/MFH_Section_515/MFH_section_515_20170103_03.zip", "description": "MFH Section 515 January 2017", "mediaType": "application/zip", "title": "Active MFH Section 515 by Month - January 2017" } ], "license": "https://creativecommons.org/publicdomain/zero/1.0/", "bureauCode": [ "005:55" ], "modified": "2017-01-01", "publisher": { "@type": "org:Organization", "name": "Rural Development, Department of Agriculture" }, "accrualPeriodicity": "R/P1M", "keyword": [ "Agriculture and Rural Development", "Disaster Relief", "Rural Development", "Section 515", "USDA", "United States Department of Agriculture", "agriculture", "data", "disaster assistance", "dwelling", "property", "rental" ] }, { "identifier": "USDA-RD-64", "accessLevel": "public", "contactPoint": { "hasEmail": "mailto:ed.duval@wdc.usda.gov", "@type": "vcard:Contact", "fn": "Ed Duval" }, "programCode": [ "005:008" ], "landingPage": "http://www.sc.egov.usda.gov/data/data_files.html", "description": "Multi Family Housing: A downloadable database file that identifies pertinent information related to USDA Rural Development housing assistance and the Multi Family Housing Section 515 Program for January 2018.", "title": "USDA Rural Development Multi Family Housing - January 2018", "distribution": [ { "@type": "dcat:Distribution", "downloadURL": "https://www.sc.egov.usda.gov/data/files/MFH_Section_515/MFH_section_515_20180102_03.zip", "mediaType": "application/zip", "title": "MFH Section 515 January 2018" } ], "license": "https://creativecommons.org/publicdomain/zero/1.0/", "bureauCode": [ "005:55" ], "modified": "2017-11-02", "publisher": { "@type": "org:Organization", "name": "Rural Development, Department of Agriculture" }, "accrualPeriodicity": "R/P1M", "keyword": [ "Agriculture and Rural Development", "Disaster Relief", "Rural Development", "Section 515", "USDA", "United States Department of Agriculture", "agriculture", "data", "disaster assistance", "dwelling", "property", "rental" ] }, { "identifier": "USDA-RD-036", "accessLevel": "public", "contactPoint": { "hasEmail": "mailto:ed.duval@wdc.usda.gov", "@type": "vcard:Contact", "fn": "Ed Duval" }, "programCode": [ "005:008" ], "landingPage": "http://www.sc.egov.usda.gov/data/data_files.html", "description": "Multi Family Housing: A downloadable database file that identifies pertinent information related to USDA Rural Development housing assistance and the Multi Family Housing Section 515 Program for July 2016.", "title": "USDA Rural Development Multi Family Housing - July 2016", "distribution": [ { "@type": "dcat:Distribution", "downloadURL": "http://www.sc.egov.usda.gov/data/files/MFH_Section_515/MFH_section_515_20160705_03.zip", "mediaType": "application/zip", "title": "MFH Section 515 - July 2016" } ], "license": "https://creativecommons.org/publicdomain/zero/1.0/", "bureauCode": [ "005:55" ], "modified": "2016-07-05", "publisher": { "@type": "org:Organization", "name": "Rural Development, Department of Agriculture" }, "accrualPeriodicity": "R/P1M", "keyword": [ "Agriculture and Rural Development", "Disaster Relief", "Rural Development", "Section 515", "USDA", "United States Department of Agriculture", "agriculture", "data", "disaster assistance", "dwelling", "property", "rental" ] }, { "identifier": "USDA-RD-58", "accessLevel": "public", "contactPoint": { "hasEmail": "mailto:ed.duval@wdc.usda.gov", "@type": "vcard:Contact", "fn": "Ed Duval" }, "programCode": [ "005:008" ], "landingPage": "http://www.sc.egov.usda.gov/data/data_files.html", "description": "Multi Family Housing: A downloadable database file that identifies pertinent information related to USDA Rural Development housing assistance and the Multi Family Housing Section 515 Program for July 2017.", "title": "USDA Rural Development Multi Family Housing - July 2017", "distribution": [ { "@type": "dcat:Distribution", "downloadURL": "https://www.sc.egov.usda.gov/data/files/MFH_Section_515/MFH_section_515_20170703_03.zip", "mediaType": "application/zip", "title": "USDA MFH Section 515 - July 2017" } ], "license": "https://creativecommons.org/publicdomain/zero/1.0/", "bureauCode": [ "005:55" ], "modified": "2017-03-02", "publisher": { "@type": "org:Organization", "name": "Rural Development, Department of Agriculture" }, "accrualPeriodicity": "R/P1M", "keyword": [ "Agriculture and Rural Development", "Disaster Relief", "Rural Development", "Section 515", "USDA", "United States Department of Agriculture", "agriculture", "data", "disaster assistance", "dwelling", "property", "rental" ] }, { "identifier": "USDA-RD-70", "accessLevel": "public", "contactPoint": { "hasEmail": "mailto:ed.duval@wdc.usda.gov", "@type": "vcard:Contact", "fn": "Ed Duval" }, "programCode": [ "005:008" ], "landingPage": "http://www.sc.egov.usda.gov/data/data_files.html", "description": "Multi Family Housing: A downloadable database file that identifies pertinent information related to USDA Rural Development housing assistance and the Multi Family Housing Section 515 Program for July 2018.", "title": "USDA Rural Development Multi Family Housing - July 2018", "distribution": [ { "@type": "dcat:Distribution", "downloadURL": "https://www.sc.egov.usda.gov/data/files/MFH_Section_515/MFH_section_515_20180702_03.zip", "mediaType": "application/zip", "title": "MFH Section 515 - July 2018" } ], "license": "https://creativecommons.org/publicdomain/zero/1.0/", "bureauCode": [ "005:55" ], "modified": "2018-03-01", "publisher": { "@type": "org:Organization", "name": "Rural Development, Department of Agriculture" }, "accrualPeriodicity": "R/P1M", "keyword": [ "Agriculture and Rural Development", "Disaster Relief", "Rural Development", "Section 515", "USDA", "United States Department of Agriculture", "agriculture", "data", "disaster assistance", "dwelling", "property", "rental" ] }, { "identifier": "USDA-RD-033", "accessLevel": "public", "contactPoint": { "hasEmail": "mailto:ed.duval@wdc.usda.gov", "@type": "vcard:Contact", "fn": "Ed Duval" }, "programCode": [ "005:008" ], "landingPage": "http://www.sc.egov.usda.gov/data/data_files.html", "description": "Multi Family Housing: A downloadable database file that identifies pertinent information related to USDA Rural Development housing assistance and the Multi Family Housing Section 515 Program for June 2016.", "title": "USDA Rural Development Multi Family Housing - June 2016", "distribution": [ { "@type": "dcat:Distribution", "downloadURL": "http://www.sc.egov.usda.gov/data/files/MFH_Section_515/MFH_section_515_20160601_03.zip", "description": "Multifamily Section 515 Housing Assistance", "mediaType": "application/zip", "title": "MFH Section 515 - June 2016" } ], "license": "https://creativecommons.org/publicdomain/zero/1.0/", "bureauCode": [ "005:55" ], "modified": "2016-06-06", "publisher": { "@type": "org:Organization", "name": "Rural Development, Department of Agriculture" }, "accrualPeriodicity": "R/P1M", "keyword": [ "Agriculture and Rural Development", "Disaster Relief", "Rural Development", "Section 515", "USDA", "United States Department of Agriculture", "agriculture", "data", "disaster assistance", "dwelling", "property", "rental" ] }, { "identifier": "USDA-RD-57", "accessLevel": "public", "contactPoint": { "hasEmail": "mailto:ed.duval@wdc.usda.gov", "@type": "vcard:Contact", "fn": "Ed Duval" }, "programCode": [ "005:008" ], "landingPage": "http://www.sc.egov.usda.gov/data/data_files.html", "description": "Multi Family Housing: A downloadable database file that identifies pertinent information related to USDA Rural Development housing assistance and the Multi Family Housing Section 515 Program for June 2017.", "title": "USDA Rural Development Multi Family Housing - June 2017", "distribution": [ { "@type": "dcat:Distribution", "downloadURL": "https://www.sc.egov.usda.gov/data/files/MFH_Section_515/MFH_section_515_20170601_03.zip", "mediaType": "application/zip", "title": "MFH Section 515 - June 2017" } ], "license": "https://creativecommons.org/publicdomain/zero/1.0/", "bureauCode": [ "005:55" ], "modified": "2017-03-02", "publisher": { "@type": "org:Organization", "name": "Rural Development, Department of Agriculture" }, "accrualPeriodicity": "R/P1M", "keyword": [ "Agriculture and Rural Development", "Disaster Relief", "Rural Development", "Section 515", "USDA", "United States Department of Agriculture", "agriculture", "data", "disaster assistance", "dwelling", "property", "rental" ] }, { "identifier": "USDA-RD-69", "accessLevel": "public", "contactPoint": { "hasEmail": "mailto:ed.duval@wdc.usda.gov", "@type": "vcard:Contact", "fn": "Ed Duval" }, "programCode": [ "005:008" ], "landingPage": "http://www.sc.egov.usda.gov/data/data_files.html", "description": "Multi Family Housing: A downloadable database file that identifies pertinent information related to USDA Rural Development housing assistance and the Multi Family Housing Section 515 Program for June 2018.", "title": "USDA Rural Development Multi Family Housing - June 2018", "distribution": [ { "@type": "dcat:Distribution", "downloadURL": "https://www.sc.egov.usda.gov/data/files/MFH_Section_515/MFH_section_515_20180601_03.zip", "mediaType": "application/zip", "title": "MFH Section 515 June 2018" } ], "license": "https://creativecommons.org/publicdomain/zero/1.0/", "bureauCode": [ "005:55" ], "modified": "2018-03-01", "publisher": { "@type": "org:Organization", "name": "Rural Development, Department of Agriculture" }, "accrualPeriodicity": "R/P1M", "keyword": [ "Agriculture and Rural Development", "Disaster Relief", "Rural Development", "Section 515", "USDA", "United States Department of Agriculture", "agriculture", "data", "disaster assistance", "dwelling", "property", "rental" ] }, { "identifier": "USDA-RD-027", "accessLevel": "public", "contactPoint": { "hasEmail": "mailto:ed.duval@wdc.usda.gov", "@type": "vcard:Contact", "fn": "Ed Duval" }, "programCode": [ "005:008" ], "landingPage": "http://www.sc.egov.usda.gov/data/data_files.html", "description": "Multi Family Housing: A downloadable database file that identifies pertinent information related to USDA Rural Development housing assistance and the Multi Family Housing Section 515 Program for March 2016.", "title": "USDA Rural Development Multi Family Housing - March 2016", "distribution": [ { "@type": "dcat:Distribution", "downloadURL": "http://www.sc.egov.usda.gov/data/files/MFH_Section_515/MFH_section_515_20160301_03.zip", "description": "Multi Family Housing Section 515 Program for March 2016", "mediaType": "application/zip", "title": "MFH Section 515 March 2016" } ], "license": "https://creativecommons.org/publicdomain/zero/1.0/", "bureauCode": [ "005:55" ], "modified": "2016-03-02", "publisher": { "@type": "org:Organization", "name": "Rural Development, Department of Agriculture" }, "accrualPeriodicity": "R/P1M", "keyword": [ "Agriculture and Rural Development", "Disaster Relief", "Rural Development", "Section 515", "agriculture", "data", "disaster assistance", "dwelling", "property", "rental" ] }, { "identifier": "USDA-RD-54", "accessLevel": "public", "contactPoint": { "hasEmail": "mailto:ed.duval@wdc.usda.gov", "@type": "vcard:Contact", "fn": "Ed Duval" }, "programCode": [ "005:008" ], "landingPage": "http://www.sc.egov.usda.gov/data/data_files.html", "description": "Multi Family Housing: A downloadable database file that identifies pertinent information related to USDA Rural Development housing assistance and the Multi Family Housing Section 515 Program for March 2017.", "title": "USDA Rural Development Multi Family Housing - March 2017", "distribution": [ { "@type": "dcat:Distribution", "downloadURL": "https://www.sc.egov.usda.gov/data/files/MFH_Section_515/MFH_section_515_20170301_03.zip", "mediaType": "application/zip", "title": "MFH Section 515 - March 2017" } ], "license": "https://creativecommons.org/publicdomain/zero/1.0/", "bureauCode": [ "005:55" ], "modified": "2017-03-02", "publisher": { "@type": "org:Organization", "name": "Rural Development, Department of Agriculture" }, "accrualPeriodicity": "R/P1M", "keyword": [ "Agriculture and Rural Development", "Disaster Relief", "Rural Development", "Section 515", "USDA", "United States Department of Agriculture", "agriculture", "data", "disaster assistance", "dwelling", "property", "rental" ] }, { "identifier": "USDA-RD-66", "accessLevel": "public", "contactPoint": { "hasEmail": "mailto:ed.duval@wdc.usda.gov", "@type": "vcard:Contact", "fn": "Ed Duval" }, "programCode": [ "005:008" ], "landingPage": "http://www.sc.egov.usda.gov/data/data_files.html", "description": "Multi Family Housing: A downloadable database file that identifies pertinent information related to USDA Rural Development housing assistance and the Multi Family Housing Section 515 Program for March 2018.", "title": "USDA Rural Development Multi Family Housing - March 2018", "distribution": [ { "@type": "dcat:Distribution", "downloadURL": "https://www.sc.egov.usda.gov/data/files/MFH_Section_515/MFH_section_515_20180301_03.zip", "mediaType": "application/zip", "title": "MFH Section 515 March 2018" } ], "license": "https://creativecommons.org/publicdomain/zero/1.0/", "bureauCode": [ "005:55" ], "modified": "2018-03-01", "publisher": { "@type": "org:Organization", "name": "Rural Development, Department of Agriculture" }, "accrualPeriodicity": "R/P1M", "keyword": [ "Agriculture and Rural Development", "Disaster Relief", "Rural Development", "Section 515", "USDA", "United States Department of Agriculture", "agriculture", "data", "disaster assistance", "dwelling", "property", "rental" ] }, { "identifier": "USDA-RD-029", "accessLevel": "public", "contactPoint": { "hasEmail": "mailto:ed.duval@wdc.usda.gov", "@type": "vcard:Contact", "fn": "Ed Duval" }, "programCode": [ "005:008" ], "landingPage": "http://www.sc.egov.usda.gov/data/data_files.html", "description": "Multi Family Housing: A downloadable database file that identifies pertinent information related to USDA Rural Development housing assistance and the Multi Family Housing Section 515 Program for May 2016.", "title": "USDA Rural Development Multi Family Housing - May 2016", "distribution": [ { "@type": "dcat:Distribution", "downloadURL": "http://www.sc.egov.usda.gov/data/files/MFH_Section_515/MFH_section_515_20160502_03.zip", "description": "MFH Section 515 May 2016", "mediaType": "application/zip", "title": "MFH Section 515 May 2016" } ], "license": "https://creativecommons.org/publicdomain/zero/1.0/", "bureauCode": [ "005:55" ], "modified": "2016-03-02", "publisher": { "@type": "org:Organization", "name": "Rural Development, Department of Agriculture" }, "accrualPeriodicity": "R/P1M", "keyword": [ "Agriculture and Rural Development", "Disaster Relief", "Rural Development", "Section 515", "USDA", "United States Department of Agriculture", "agriculture", "data", "disaster assistance", "dwelling", "property", "rental" ] }, { "identifier": "USDA-RD-56", "accessLevel": "public", "contactPoint": { "hasEmail": "mailto:ed.duval@wdc.usda.gov", "@type": "vcard:Contact", "fn": "Ed Duval" }, "programCode": [ "005:008" ], "landingPage": "http://www.sc.egov.usda.gov/data/data_files.html", "description": "Multi Family Housing: A downloadable database file that identifies pertinent information related to USDA Rural Development housing assistance and the Multi Family Housing Section 515 Program for May 2017.", "title": "USDA Rural Development Multi Family Housing - May 2017", "distribution": [ { "@type": "dcat:Distribution", "downloadURL": "https://www.sc.egov.usda.gov/data/files/MFH_Section_515/MFH_section_515_20170501_03.zip", "mediaType": "application/zip", "title": "MFH Section 515 May 2017" } ], "license": "https://creativecommons.org/publicdomain/zero/1.0/", "bureauCode": [ "005:55" ], "modified": "2017-03-02", "publisher": { "@type": "org:Organization", "name": "Rural Development, Department of Agriculture" }, "accrualPeriodicity": "R/P1M", "keyword": [ "Agriculture and Rural Development", "Disaster Relief", "Rural Development", "Section 515", "USDA", "United States Department of Agriculture", "agriculture", "data", "disaster assistance", "dwelling", "property", "rental" ] }, { "identifier": "USDA-RD-68", "accessLevel": "public", "contactPoint": { "hasEmail": "mailto:ed.duval@wdc.usda.gov", "@type": "vcard:Contact", "fn": "Ed Duval" }, "programCode": [ "005:008" ], "landingPage": "http://www.sc.egov.usda.gov/data/data_files.html", "description": "Multi Family Housing: A downloadable database file that identifies pertinent information related to USDA Rural Development housing assistance and the Multi Family Housing Section 515 Program for May 2018.", "title": "USDA Rural Development Multi Family Housing - May 2018", "distribution": [ { "@type": "dcat:Distribution", "downloadURL": "https://www.sc.egov.usda.gov/data/files/MFH_Section_515/MFH_section_515_20180501_03.zip", "mediaType": "application/zip", "title": "MFH Section 515 May 2018" } ], "license": "https://creativecommons.org/publicdomain/zero/1.0/", "bureauCode": [ "005:55" ], "modified": "2018-03-01", "publisher": { "@type": "org:Organization", "name": "Rural Development, Department of Agriculture" }, "accrualPeriodicity": "R/P1M", "keyword": [ "Agriculture and Rural Development", "Disaster Relief", "Rural Development", "Section 515", "USDA", "United States Department of Agriculture", "agriculture", "data", "disaster assistance", "dwelling", "property", "rental" ] }, { "identifier": "USDA-RD-001", "accessLevel": "public", "contactPoint": { "hasEmail": "mailto:ed.duval@wdc.usda.gov", "@type": "vcard:Contact", "fn": "Ed Duval" }, "programCode": [ "005:008" ], "landingPage": "http://www.sc.egov.usda.gov/data/data_files.html", "description": "Multi Family Housing: A downloadable database file that identifies pertinent information related to USDA Rural Development housing assistance and the Multi Family Housing Section 515 Program.", "title": "USDA Rural Development Multi Family Housing - November 2015", "distribution": [ { "@type": "dcat:Distribution", "downloadURL": "http://www.sc.egov.usda.gov/data/files/MFH_Section_515/MFH_section_515_20151102_03.zip", "format": "zip", "mediaType": "application/zip", "title": "Section 515 Housing" } ], "license": "https://creativecommons.org/publicdomain/zero/1.0/", "bureauCode": [ "005:55" ], "modified": "2015-11-06", "publisher": { "@type": "org:Organization", "name": "Rural Development, Department of Agriculture" }, "accrualPeriodicity": "R/P1M", "keyword": [ "Agriculture and Rural Development", "Disaster Relief", "Rural Development", "Section 515", "agriculture", "data", "disaster assistance", "dwelling", "property", "rental" ] }, { "identifier": "USDA-RD-50", "accessLevel": "public", "contactPoint": { "hasEmail": "mailto:ed.duval@wdc.usda.gov", "@type": "vcard:Contact", "fn": "Ed Duval" }, "programCode": [ "005:008" ], "landingPage": "http://www.sc.egov.usda.gov/data/data_files.html", "description": "Multi Family Housing: A downloadable database file that identifies pertinent information related to USDA Rural Development housing assistance and the Multi Family Housing Section 515 Program for November 2016.", "title": "USDA Rural Development Multi Family Housing - November 2016", "distribution": [ { "@type": "dcat:Distribution", "downloadURL": "http://www.sc.egov.usda.gov/data/files/MFH_Section_515/MFH_section_515_20161101_03.zip", "mediaType": "application/zip", "title": "Active MFH Project by Month - November 2016" } ], "license": "https://creativecommons.org/publicdomain/zero/1.0/", "bureauCode": [ "005:55" ], "modified": "2016-07-05", "publisher": { "@type": "org:Organization", "name": "Rural Development, Department of Agriculture" }, "accrualPeriodicity": "R/P1M", "keyword": [ "Agriculture and Rural Development", "Disaster Relief", "Rural Development", "Section 515", "USDA", "United States Department of Agriculture", "agriculture", "data", "disaster assistance", "dwelling", "property", "rental" ] }, { "identifier": "USDA-RD-62", "accessLevel": "public", "contactPoint": { "hasEmail": "mailto:ed.duval@wdc.usda.gov", "@type": "vcard:Contact", "fn": "Ed Duval" }, "programCode": [ "005:008" ], "landingPage": "http://www.sc.egov.usda.gov/data/data_files.html", "description": "Multi Family Housing: A downloadable database file that identifies pertinent information related to USDA Rural Development housing assistance and the Multi Family Housing Section 515 Program for November 2017.", "title": "USDA Rural Development Multi Family Housing - November 2017", "distribution": [ { "@type": "dcat:Distribution", "downloadURL": "https://www.sc.egov.usda.gov/data/files/MFH_Section_515/MFH_section_515_20171101_03.zip", "mediaType": "application/zip", "title": "MFH Section 515 - Novermber 2017" } ], "license": "https://creativecommons.org/publicdomain/zero/1.0/", "bureauCode": [ "005:55" ], "modified": "2017-11-02", "publisher": { "@type": "org:Organization", "name": "Rural Development, Department of Agriculture" }, "accrualPeriodicity": "R/P1M", "keyword": [ "Agriculture and Rural Development", "Disaster Relief", "Rural Development", "Section 515", "USDA", "United States Department of Agriculture", "agriculture", "data", "disaster assistance", "dwelling", "property", "rental" ] }, { "identifier": "USDA-RD-49", "accessLevel": "public", "contactPoint": { "hasEmail": "mailto:ed.duval@wdc.usda.gov", "@type": "vcard:Contact", "fn": "Ed Duval" }, "programCode": [ "005:008" ], "landingPage": "http://www.sc.egov.usda.gov/data/data_files.html", "description": "Multi Family Housing: A downloadable database file that identifies pertinent information related to USDA Rural Development housing assistance and the Multi Family Housing Section 515 Program for October 2016.", "title": "USDA Rural Development Multi Family Housing - October 2016", "distribution": [ { "@type": "dcat:Distribution", "downloadURL": "http://www.sc.egov.usda.gov/data/files/MFH_Section_515/MFH_section_515_20161003_03.zip", "mediaType": "application/zip", "title": "MFH Section 515 October 2016" } ], "license": "https://creativecommons.org/publicdomain/zero/1.0/", "bureauCode": [ "005:55" ], "modified": "2016-07-05", "publisher": { "@type": "org:Organization", "name": "Rural Development, Department of Agriculture" }, "accrualPeriodicity": "R/P1M", "keyword": [ "Agriculture and Rural Development", "Disaster Relief", "Rural Development", "Section 515", "USDA", "United States Department of Agriculture", "agriculture", "data", "disaster assistance", "dwelling", "property", "rental" ] }, { "identifier": "USDA-RD-61", "accessLevel": "public", "contactPoint": { "hasEmail": "mailto:ed.duval@wdc.usda.gov", "@type": "vcard:Contact", "fn": "Ed Duval" }, "programCode": [ "005:008" ], "landingPage": "http://www.sc.egov.usda.gov/data/data_files.html", "description": "Multi Family Housing: A downloadable database file that identifies pertinent information related to USDA Rural Development housing assistance and the Multi Family Housing Section 515 Program for October 2017.", "title": "USDA Rural Development Multi Family Housing - October 2017", "distribution": [ { "@type": "dcat:Distribution", "downloadURL": "https://www.sc.egov.usda.gov/data/files/MFH_Section_515/MFH_section_515_20171002_03.zip", "mediaType": "application/zip", "title": "MFH Section 515 - October 2017" } ], "license": "https://creativecommons.org/publicdomain/zero/1.0/", "bureauCode": [ "005:55" ], "modified": "2017-10-02", "publisher": { "@type": "org:Organization", "name": "Rural Development, Department of Agriculture" }, "accrualPeriodicity": "R/P1M", "keyword": [ "Agriculture and Rural Development", "Disaster Relief", "Rural Development", "Section 515", "USDA", "United States Department of Agriculture", "agriculture", "data", "disaster assistance", "dwelling", "property", "rental" ] }, { "identifier": "USDA-RD-044", "accessLevel": "public", "contactPoint": { "hasEmail": "mailto:ed.duval@wdc.usda.gov", "@type": "vcard:Contact", "fn": "Ed Duval" }, "programCode": [ "005:008" ], "landingPage": "http://www.sc.egov.usda.gov/data/data_files.html", "description": "Multi Family Housing: A downloadable database file that identifies pertinent information related to USDA Rural Development housing assistance and the Multi Family Housing Section 515 Program for September 2016.", "title": "USDA Rural Development Multi Family Housing - September 2016", "distribution": [ { "@type": "dcat:Distribution", "downloadURL": "http://www.sc.egov.usda.gov/data/files/MFH_Section_515/MFH_section_515_20160906_03.zip", "mediaType": "application/zip", "title": "USDA MFH Section 515 - September 2016" } ], "license": "https://creativecommons.org/publicdomain/zero/1.0/", "bureauCode": [ "005:55" ], "modified": "2016-07-05", "publisher": { "@type": "org:Organization", "name": "Rural Development, Department of Agriculture" }, "accrualPeriodicity": "R/P1M", "keyword": [ "Agriculture and Rural Development", "Disaster Relief", "Rural Development", "Section 515", "USDA", "United States Department of Agriculture", "agriculture", "data", "disaster assistance", "dwelling", "property", "rental" ] }, { "identifier": "USDA-RD-60", "accessLevel": "public", "contactPoint": { "hasEmail": "mailto:ed.duval@wdc.usda.gov", "@type": "vcard:Contact", "fn": "Ed Duval" }, "programCode": [ "005:008" ], "landingPage": "http://www.sc.egov.usda.gov/data/data_files.html", "description": "Multi Family Housing: A downloadable database file that identifies pertinent information related to USDA Rural Development housing assistance and the Multi Family Housing Section 515 Program for September 2017.", "title": "USDA Rural Development Multi Family Housing - September 2017", "distribution": [ { "@type": "dcat:Distribution", "downloadURL": "https://www.sc.egov.usda.gov/data/files/MFH_Section_515/MFH_section_515_20170901_03.zip", "mediaType": "application/zip", "title": "MFH Section 515 - September 2017" } ], "license": "https://creativecommons.org/publicdomain/zero/1.0/", "bureauCode": [ "005:55" ], "modified": "2017-03-02", "publisher": { "@type": "org:Organization", "name": "Rural Development, Department of Agriculture" }, "accrualPeriodicity": "R/P1M", "keyword": [ "Agriculture and Rural Development", "Disaster Relief", "Rural Development", "Section 515", "USDA", "United States Department of Agriculture", "agriculture", "data", "disaster assistance", "dwelling", "property", "rental" ] }, { "identifier": "USDA-RD-045", "accessLevel": "public", "contactPoint": { "hasEmail": "mailto:karen.priestly@wdc.usda.gov", "@type": "vcard:Contact", "fn": "Public Affairs Office" }, "programCode": [ "005:008" ], "landingPage": "http://www.sc.egov.usda.gov/data/MFH.html", "description": "This dataset provides loan-level information on when USDA Section 514 and 515 properties are projected to pay off their loans and exit USDA’s Multi-Family Housing program. Includes estimated property exit year, whether the loan is prepay eligible and when, loan amount, original loan term and remaining term days, borrower characteristics, property location and characteristics, and more.", "title": "USDA Rural Development Multi-Family Housing Program Exit Data", "distribution": [ { "@type": "dcat:Distribution", "downloadURL": "https://www.sc.egov.usda.gov/data/files/MFH/USDA%20Multifamily%20Housing%20Program%20Exit%20Data%20as%20of%2006.30.17.xlsx", "description": "This dataset provides loan-level information on when USDA Section 514 and 515 properties are projected to pay off their loans and exit USDA’s Multi-Family Housing program.", "mediaType": "application/vnd.openxmlformats-officedocument.spreadsheetml.sheet", "title": "USDA Multifmaily Housing Program Exit Data as of 06.30.17" }, { "@type": "dcat:Distribution", "downloadURL": "http://www.sc.egov.usda.gov/data/files/MFH/USDA%20Multifamily%20Housing%20Program%20Exit%20Data_Data%20Dictionary.pdf", "description": "Multi-Family Housing Program Exit Data - Public Data Dictionary", "mediaType": "application/pdf", "title": "USDA Multifamily Housing Program Exit Data - Data Dictionary" } ], "license": "https://creativecommons.org/publicdomain/zero/1.0/", "bureauCode": [ "005:55" ], "modified": "2017-06-30", "publisher": { "@type": "org:Organization", "name": "Rural Development, Department of Agriculture" }, "accrualPeriodicity": "R/P6M", "keyword": [ "514", "515", "Agriculture", "Agriculture and Rural Development", "Coop", "Dwellings", "Loan", "MFH", "Rural Development", "Rural Housing Service", "USDA", "United States Department of Agriculture", "affordable housing", "agriculture", "data", "dwelling", "exit data", "home mortgage", "home purchease", "homeownership", "housing", "lending", "leveraged loan", "mfh", "multifamily", "property", "rental", "rental housing", "rural", "rural areas", "self help", "single-family" ] }, { "identifier": "USDA-RD-031", "accessLevel": "public", "contactPoint": { "hasEmail": "mailto:karen.priestly@wdc.usda.gov", "@type": "vcard:Contact", "fn": "Public Affairs Office" }, "programCode": [ "005:008" ], "landingPage": "http://www.sc.egov.usda.gov/data/MFH.html", "description": "Transaction history of property transfers, consolidations, and sales within the USDA Rural Development Multifamily Direct Loan programs: Section 515 Rural Rental Housing and Section 514 Farm Labor Housing. Includes new property ID numbers and associated old property ID numbers, transaction type indicators, and effective dates. Requires merging with “USDA Rural Development Multifamily Section 515 Rural Rental Housing and Section 514 Farm Labor Housing Property Characteristics” to obtain property address and other characteristics based on new property ID number.", "title": "USDA Rural Development Multifamily Section 515 Rural Rental Housing and Section 514 Farm Labor Housing Properties Transfers, Consolidations, and Sales", "distribution": [ { "@type": "dcat:Distribution", "downloadURL": "https://www.sc.egov.usda.gov/data/files/MFH_Section_515/ActiveProjects/mfhd_active_projects_transfer_info.csv", "description": "Transaction history of property transfers, consolidations, and sales within the USDA Rural Development Multifamily Direct Loan programs: Section 515 Rural Rental Housing and Section 514 Farm Labor Housing. Includes new property ID numbers and associated old property ID numbers, transaction type indicators, and effective dates. Requires merging with “USDA Rural Development Multifamily Section 515 Rural Rental Housing and Section 514 Farm Labor Housing Property Characteristics” to obtain property address and other characteristics based on new property ID number.", "mediaType": "text/csv", "title": "USDA Rural Development Multifamily Section 515 Rural Rental Housing and Section 514 Farm Labor Housing Properties Transfers, Consolidations, and Sales" }, { "@type": "dcat:Distribution", "downloadURL": "http://www.sc.egov.usda.gov/data/files/MFH_Section_515/ActiveProjects/USDA-RUR.PDF", "description": "Public data dictionary describing the coding of variables for three USDA Rural Development Multifamily Direct Loan Program", "mediaType": "application/pdf", "title": "USDA Rural Development Multifamily Section 515 Rural Rental Housing and Section 514 Farm Labor Housing Public Data Dictionary" } ], "license": "https://creativecommons.org/publicdomain/zero/1.0/", "bureauCode": [ "005:55" ], "modified": "2016-06-02", "publisher": { "@type": "org:Organization", "name": "Rural Development, Department of Agriculture" }, "accrualPeriodicity": "R/P6M", "keyword": [ "Agriculture and Rural Development", "Farm Labor Housing", "Rural Development", "Section 514", "Section 515", "USDA", "United States Department of Agriculture", "agriculture", "data", "disaster assistance", "dwelling", "farmworker", "housing", "multifamily", "property", "rental", "rental assistance" ] }, { "identifier": "USDA-RD-030", "accessLevel": "public", "contactPoint": { "hasEmail": "mailto:karen.priestly@wdc.usda.gov", "@type": "vcard:Contact", "fn": "Public Affairs Office" }, "programCode": [ "005:008" ], "landingPage": "http://www.sc.egov.usda.gov/data/MFH.html", "description": "Property locations and characteristics for USDA Rural Development Multifamily Direct Loan programs: Section 515 Rural Rental Housing and Section 514 Farm Labor Housing. Includes latitude and longitude coordinates, property address, type of development, date of operation, profit type, management agent, loan program identifier, Low Income Housing Tax Credit identifier and expiration date, Multifamily Preservation and Revitalization program identifier, total units, USDA Section 521 rental assistance units, units by bedroom size, and vacant units.", "title": "USDA Rural Development Multifamily Section 515 Rural Rental Housing and Section 514 Farm Labor Housing Property Characteristics", "distribution": [ { "@type": "dcat:Distribution", "downloadURL": "https://www.sc.egov.usda.gov/data/files/MFH_Section_515/ActiveProjects/mfhd_active_projects.csv", "description": "Property locations and characteristics for USDA Rural Development Multifamily Direct Loan programs: Section 515 Rural Rental Housing and Section 514 Farm Labor Housing. Includes latitude and longitude coordinates, property address, type of development, date of operation, profit type, management agent, loan program identifier, Low Income Housing Tax Credit identifier and expiration date, Multifamily Preservation and Revitalization program identifier, total units, USDA Section 521 rental assistance units, units by bedroom size, and vacant units.", "mediaType": "text/csv", "title": "USDA Rural Development Multifamily Section 515 Rural Rental Housing and Section 514 Farm Labor Housing Property Characteristics" }, { "@type": "dcat:Distribution", "downloadURL": "http://www.sc.egov.usda.gov/data/files/MFH_Section_515/ActiveProjects/USDA-RUR.PDF", "description": "Public data dictionary describing the coding of variables for three USDA Rural Development Multifamily Direct Loan Program", "mediaType": "application/pdf", "title": "USDA Rural Development Multifamily Section 515 Rural Rental Housing and Section 514 Farm Labor Housing Public Data Dictionary" } ], "license": "https://creativecommons.org/publicdomain/zero/1.0/", "bureauCode": [ "005:55" ], "modified": "2016-06-02", "publisher": { "@type": "org:Organization", "name": "Rural Development, Department of Agriculture" }, "accrualPeriodicity": "R/P6M", "keyword": [ "Agriculture and Rural Development", "Farm Labor Housing", "Rural Development", "Section 514", "Section 515", "USDA", "United States Department of Agriculture", "agriculture", "data", "disaster assistance", "dwelling", "farmworker", "housing", "multifamily", "property", "rental", "rental assistance" ] }, { "identifier": "USDA-RD-032", "accessLevel": "public", "contactPoint": { "hasEmail": "mailto:karen.priestly@wdc.usda.gov", "@type": "vcard:Contact", "fn": "Public Affairs Office" }, "programCode": [ "005:008" ], "landingPage": "http://www.sc.egov.usda.gov/data/MFH.html", "description": "Aggregated tenant characteristics for USDA Rural Development Multifamily Direct Loan programs: Section 515 Rural Rental Housing and Section 514 Farm Labor Housing. Includes property address and aggregated demographic information including female headed-households, elderly aged 62 or older, minors, disability status, race, and ethnicity. Also includes average annual income, average annual income by source of income, cost-burden indicator, zero income indicator, and rental assistance subsidy counts by type of assistance. Can be merged with “USDA Rural Development Multifamily Section 515 Rural Rental Housing and Section 514 Farm Labor Housing Property Characteristics” to link to property characteristics, as well as “USDA Rural Development Multifamily Section 515 Rural Rental Housing and Section 514 Farm Labor Housing Properties Transfers, Consolidations, and Sales” to link with property transaction histories.", "title": "USDA Rural Development Multifamily Section 515 Rural Rental Housing and Section 514 Farm Labor Housing Tenant Characteristics", "distribution": [ { "@type": "dcat:Distribution", "downloadURL": "https://www.sc.egov.usda.gov/data/files/MFH_Section_515/ActiveProjects/mfhd_tenant_info_all_properties.csv", "description": "Aggregated tenant characteristics for USDA Rural Development Multifamily Direct Loan programs: Section 515 Rural Rental Housing and Section 514 Farm Labor Housing. Includes property address and aggregated demographic information including female headed-households, elderly aged 62 or older, minors, disability status, race, and ethnicity. Also includes average annual income, average annual income by source of income, cost-burden indicator, zero income indicator, and rental assistance subsidy counts by type of assistance. Can be merged with “USDA Rural Development Multifamily Section 515 Rural Rental Housing and Section 514 Farm Labor Housing Property Characteristics” to link to property characteristics, as well as “USDA Rural Development Multifamily Section 515 Rural Rental Housing and Section 514 Farm Labor Housing Properties Transfers, Consolidations, and Sales” to link with property transaction histories.", "mediaType": "text/csv", "title": "USDA Rural Development Multifamily Section 515 Rural Rental Housing and Section 514 Farm Labor Housing Tenant Characteristics" }, { "@type": "dcat:Distribution", "downloadURL": "http://www.sc.egov.usda.gov/data/files/MFH_Section_515/ActiveProjects/USDA-RUR.PDF", "description": "Public data dictionary describing the coding of variables for three USDA Rural Development Multifamily Direct Loan Program", "mediaType": "application/pdf", "title": "USDA Rural Development Multifamily Section 515 Rural Rental Housing and Section 514 Farm Labor Housing Public Data Dictionary" } ], "license": "https://creativecommons.org/publicdomain/zero/1.0/", "bureauCode": [ "005:55" ], "modified": "2016-06-02", "publisher": { "@type": "org:Organization", "name": "Rural Development, Department of Agriculture" }, "accrualPeriodicity": "R/P6M", "keyword": [ "Agriculture and Rural Development", "Farm Labor Housing", "Rural Development", "Section 514", "Section 515", "USDA", "United States Department of Agriculture", "agriculture", "data", "disaster assistance", "dwelling", "farmworker", "housing", "multifamily", "property", "rental", "rental assistance" ] }, { "identifier": "USDA-RD-010", "accessLevel": "public", "contactPoint": { "hasEmail": "mailto:gayle.doss@stl.usda.gov", "@type": "vcard:Contact", "fn": "Gayle Doss" }, "programCode": [ "005:006" ], "landingPage": "http://www.sc.egov.usda.gov/data/data_files.html", "description": "This data is used to determine eligibility for certain USDA Single Family Housing and Multi-Family Housing loan and grant programs.", "title": "USDA Rural Development Property Eligibility (SFH/MFH)", "distribution": [ { "@type": "dcat:Distribution", "downloadURL": "https://www.sc.egov.usda.gov/data/files/SFH_MFH_Ineligible/SFH_MFH_Ineligible20180823.zip", "description": "These map files determine areas ineligible for SFH and MFH programs - 4th Quarter 2018", "mediaType": "application/zip", "title": "Property Ineligibility - Single Family Housing and Multi Family Housing - 4th Quarter 2018" }, { "@type": "dcat:Distribution", "downloadURL": "http://eligibility.sc.egov.usda.gov/eligibility/welcomeAction.do", "mediaType": "text/html", "title": "Housing Income Eligibility Calculator" } ], "license": "https://creativecommons.org/publicdomain/zero/1.0/", "bureauCode": [ "005:55" ], "modified": "2018-08-24", "publisher": { "@type": "org:Organization", "name": "Rural Development, Department of Agriculture" }, "accrualPeriodicity": "R/P6M", "keyword": [ "Agriculture and Rural Development", "MFH", "Rural Development", "SFH", "agriculture", "data", "eligibility", "mfh", "multi family housing", "property", "rural", "sfh", "single family housing", "usda" ] }, { "identifier": "USDA-RD-0006", "accessLevel": "public", "contactPoint": { "hasEmail": "mailto:gayle.doss@stl.usda.gov", "@type": "vcard:Contact", "fn": "Gayle Doss" }, "programCode": [ "005:001" ], "landingPage": "http://www.sc.egov.usda.gov/data/data_files.html", "description": "This data is used to determine eligibility for certain USDA RBS loan and grant programs.", "title": "USDA Rural Development Property Eligibility - Rural Business Service (B&I Guaranteed, RBEG, RBOG, REAP, RMAP, BAP and IRP)", "distribution": [ { "accessURL": "https://www.sc.egov.usda.gov/data/files/RBS_Ineligible.zip", "@type": "dcat:Distribution", "description": "These map files determine areas ineligible for RBS loans and grants", "title": "Property Ineligibility - RBS" }, { "@type": "dcat:Distribution", "downloadURL": "http://eligibility.sc.egov.usda.gov/eligibility/welcomeAction.do", "mediaType": "text/html", "title": "Housing Income Eligibility Calculator" } ], "license": "https://creativecommons.org/publicdomain/zero/1.0/", "bureauCode": [ "005:55" ], "modified": "2017-04-18", "publisher": { "@type": "org:Organization", "name": "Rural Development, Department of Agriculture" }, "accrualPeriodicity": "R/P6M", "keyword": [ "Agriculture and Rural Development", "BAP", "BandI Guar", "Biorefinery Assisstance Program", "Business and Industry Guaranteed Loans", "IRP", "Intermediary Relending Program", "RBEG", "RBOG", "REAP", "RMAP", "Renewable Energy for America Program", "Rural Business Enterprise Grants", "Rural Business Opportunity Grants", "Rural Development", "Rural Microentrepreneur Assistance Program", "agriculture", "data", "eligibility", "grant", "loan", "property", "rural", "usda" ] }, { "identifier": "USDA-RD-008", "accessLevel": "public", "contactPoint": { "hasEmail": "mailto:gayle.doss@stl.usda.gov", "@type": "vcard:Contact", "fn": "Gayle Doss" }, "programCode": [ "005:007" ], "landingPage": "http://www.sc.egov.usda.gov/data/data_files.html", "description": "This data is used to determine eligibility for certain USDA Intermediary Relending Programs.", "title": "USDA Rural Development Property Eligibility - Rural Business Service (RCDI, REDL, REDG)", "distribution": [ { "@type": "dcat:Distribution", "downloadURL": "http://www.sc.egov.usda.gov/data/files/IRP_Ineligible.zip", "description": "This file contains map data to determine ineligile areas for IRP", "mediaType": "application/zip", "title": "Property Ineligibility - Intermediary Relending Program" }, { "@type": "dcat:Distribution", "downloadURL": "http://eligibility.sc.egov.usda.gov/eligibility/welcomeAction.do", "mediaType": "text/html", "title": "Housing Income Eligibility Calculator" } ], "license": "https://creativecommons.org/publicdomain/zero/1.0/", "bureauCode": [ "005:55" ], "modified": "2015-03-18", "publisher": { "@type": "org:Organization", "name": "Rural Development, Department of Agriculture" }, "accrualPeriodicity": "R/P6M", "keyword": [ "Agriculture and Rural Development", "RCDI", "REDL", "Rural Community Development Initiative", "Rural Development", "Rural Economic Developoment Grants", "Rural Economic Devlopment Loans", "agriculture", "data", "eligibility", "loan", "property", "relending", "rural", "usda" ] }, { "identifier": "USDA-RD-009", "accessLevel": "public", "contactPoint": { "hasEmail": "mailto:gayle.doss@stl.usda.gov", "@type": "vcard:Contact", "fn": "Gayle Doss" }, "programCode": [ "005:006" ], "landingPage": "http://www.sc.egov.usda.gov/data/data_files.html", "description": "This data is used to determine eligibility for certain USDA Water and Environmental Programs.", "title": "USDA Rural Development Property Eligibility Water and Environmental Programs", "distribution": [ { "@type": "dcat:Distribution", "downloadURL": "http://www.sc.egov.usda.gov/data/files/WEP_Ineligible.zip", "description": "These map files determine areas ineligible for water and environmental programs", "mediaType": "application/zip", "title": "Property Ineligibility - Water & Environmental Program" }, { "@type": "dcat:Distribution", "downloadURL": "http://eligibility.sc.egov.usda.gov/eligibility/welcomeAction.do", "mediaType": "text/html", "title": "Housing Income Eligibility Calculator" } ], "license": "https://creativecommons.org/publicdomain/zero/1.0/", "bureauCode": [ "005:55" ], "modified": "2014-05-01", "publisher": { "@type": "org:Organization", "name": "Rural Development, Department of Agriculture" }, "accrualPeriodicity": "R/P6M", "keyword": [ "Agriculture and Rural Development", "Rural Development", "agriculture", "data", "eligibility", "environment", "property", "rural", "usda", "water" ] }, { "identifier": "USDA-RD-0004", "accessLevel": "public", "contactPoint": { "hasEmail": "mailto:michael.sutton@stl.usda.gov", "@type": "vcard:Contact", "fn": "Michael Sutton" }, "programCode": [ "005:007" ], "landingPage": "http://www.sc.egov.usda.gov/data/data_files.html", "description": "Data provides current information regarding single family homes and ranches for sale by the U.S. Federal Government. These previously owned properties are for sale by public auction or other method depending on the property.", "title": "USDA Rural Development Resale Properties - Foreclosure", "distribution": [ { "@type": "dcat:Distribution", "downloadURL": "https://properties.sc.egov.usda.gov/resales/public/home", "mediaType": "text/html", "title": "Properties for Sale" }, { "@type": "dcat:Distribution", "downloadURL": "https://www.sc.egov.usda.gov/data/files/Property/FSASFHFOREData9-7-18.txt", "description": "Current information about single family homes and ranches for sale by the U.S. Federal Government. These previously owned properties are for sale by public auction or other method depending on the property. Anyone can buy a home for sale by the U.S. Government, but you must work with a real estate agent, broker, or servicing representative to submit an offer or bid.", "mediaType": "text/plain", "title": "Resale Properties (FCL)" }, { "@type": "dcat:Distribution", "downloadURL": "https://www.sc.egov.usda.gov/data/files/Property/FSASFHFOREData9-7-18.txt", "format": "txt", "description": "These previously owned properties are for sale by public auction or other method depending on the property.", "mediaType": "text/csv", "title": "Resale Properties (Foreclosure)" } ], "license": "https://creativecommons.org/publicdomain/zero/1.0/", "bureauCode": [ "005:55" ], "modified": "2018-09-10", "publisher": { "@type": "org:Organization", "name": "Rural Development, Department of Agriculture" }, "accrualPeriodicity": "R/P1M", "keyword": [ "Agriculture and Rural Development", "Disaster Relief", "Rural Development", "agriculture", "auction", "buy", "data", "disaster assistance", "foreclosure", "housing", "loan", "price", "property", "real estate", "rural", "single family housing" ] }, { "identifier": "USDA-RD-005", "accessLevel": "public", "contactPoint": { "hasEmail": "mailto:michael.sutton@stl.usda.gov", "@type": "vcard:Contact", "fn": "Michael Sutton" }, "programCode": [ "005:007" ], "landingPage": "http://www.sc.egov.usda.gov/data/data_files.html", "description": "Data provides current information regarding single family homes, and ranches for sale by the U.S. Federal Government. These previously owned properties are for sale by public auction or other method depending on the property.", "title": "USDA Rural Development Resale Properties - Real Estate Owned", "distribution": [ { "@type": "dcat:Distribution", "downloadURL": "http://properties.sc.egov.usda.gov/resales/public/home", "description": "Properties for Sale", "mediaType": "text/html", "title": "USDA-RD/FSA Properties" }, { "@type": "dcat:Distribution", "downloadURL": "https://www.sc.egov.usda.gov/data/files/Property/FSASFHREOData9-7-18.txt", "description": "Current information about single family homes and ranches for sale by the U.S. Federal Government. These previously owned properties are for sale by public auction or other method depending on the property. Anyone can buy a home for sale by the U.S. Government, but you must work with a real estate agent, broker, or servicing representative to submit an offer or bid.", "mediaType": "text/plain", "title": "Resale (REO)" } ], "license": "https://creativecommons.org/publicdomain/zero/1.0/", "bureauCode": [ "005:55" ], "modified": "2018-09-10", "publisher": { "@type": "org:Organization", "name": "Rural Development, Department of Agriculture" }, "accrualPeriodicity": "R/P1M", "keyword": [ "Agriculture and Rural Development", "Disaster Relief", "Price", "Rural Development", "Single Family Housing", "auction", "buy", "disaster assistance", "housing", "property", "real estate", "resale", "rural", "usda" ] }, { "identifier": "USDA-RD-035", "accessLevel": "public", "contactPoint": { "hasEmail": "mailto:karen.priestly@wdc.usda.gov", "@type": "vcard:Contact", "fn": "Public Affairs Office" }, "programCode": [ "005:008" ], "landingPage": "http://www.sc.egov.usda.gov/data/SFH.html", "description": "Borrower, property and loan characteristics for all active Section 502 Guaranteed Loans, aggregated by Congressional District. Borrower characteristics include: income, debt-income ratio, race, ethnicity, marital status, dependents, household size, first-time homebuyer status, age and disability status. Property characteristics include: project type (PUD, Condo, Coop), housing structure (detached, attached), manufactured home, living area. Loan characteristics include: loan request amount, loan amount, loan-to-value ratio, and appraised value.Property characteristics include: project type (PUD, Condo, Coop), housing structure (detached, attached), manufactured home, living area. Loan characteristics include: loan request amount, loan amount, loan-to-value ratio, and appraised value.", "title": "USDA Rural Development Section 502 Guaranteed Loan Program Active Loans by Congressional District", "distribution": [ { "@type": "dcat:Distribution", "downloadURL": "http://www.sc.egov.usda.gov/data/files/SFH_Data/SFHG_Section_502_Guaranteed_By%20Congressional%20Dist%206.9.2016.csv", "description": "Borrower, property and loan characteristics for all active Section 502 Guaranteed Loans, aggregated by Congressional District.", "mediaType": "text/csv", "title": "USDA Rural Development Section 502 Guaranteed Loan Program Active Loans by Congressional District" }, { "@type": "dcat:Distribution", "downloadURL": "http://www.sc.egov.usda.gov/data/files/SFH_Data/USDA%20Rural%20Housing%20Service_Single-family%20Housing%20Guaranteed_Public%20Data%20Dictionary_June%202016.pdf", "mediaType": "application/pdf", "title": "USDA Rural Housing Service Single-Family Housing Guaranteed Public Data Dictionary - June 2016" } ], "license": "https://creativecommons.org/publicdomain/zero/1.0/", "bureauCode": [ "005:55" ], "modified": "2016-07-05", "publisher": { "@type": "org:Organization", "name": "Rural Development, Department of Agriculture" }, "accrualPeriodicity": "R/P6M", "keyword": [ "Active Loans", "Agriculture", "Agriculture and Rural Development", "Condo", "Congressional District", "Coop", "Guaranteed Loan", "Loan", "PUD", "Rural Development", "Rural Housing Service", "SFHG", "Section 502", "Single Family Housing", "USDA", "United States Department of Agriculture", "agriculture", "data", "disaster assistance", "dwelling", "home loan", "home mortgage", "home ownership", "home purchase", "housing", "lending", "manufactured homes", "multifamily", "property", "rental", "rental assistance", "rural", "single-family" ] }, { "identifier": "USDA-RD-034", "accessLevel": "public", "contactPoint": { "hasEmail": "mailto:karen.priestly@wdc.usda.gov", "@type": "vcard:Contact", "fn": "Public Affairs Office" }, "programCode": [ "005:008" ], "landingPage": "http://www.sc.egov.usda.gov/data/SFH.html", "description": "Borrower, property and loan characteristics for all active Section 502 Guaranteed Loans, aggregated by county. Borrower characteristics include: income, debt-income ratio, race, ethnicity, marital status, dependents, household size, first-time homebuyer status, age and disability status. Property characteristics include: project type (PUD, Condo, Coop), housing structure (detached, attached), manufactured home, living area. Loan characteristics include: loan request amount, loan amount, loan-to-value ratio, and appraised value.", "title": "USDA Rural Development Section 502 Guaranteed Loan Program Active Loans by County", "distribution": [ { "@type": "dcat:Distribution", "downloadURL": "http://www.sc.egov.usda.gov/data/files/SFH_Data/SFHG_Section_502_Guaranteed_%20By%20County%206.9.2016.csv", "description": "Borrower, property and loan characteristics for all active Section 502 Guaranteed Loans, aggregated by county.", "mediaType": "text/csv", "title": "USDA Rural Development Section 502 Guaranteed Loan Program Active Loans by County" }, { "@type": "dcat:Distribution", "downloadURL": "http://www.sc.egov.usda.gov/data/files/SFH_Data/USDA%20Rural%20Housing%20Service_Single-family%20Housing%20Guaranteed_Public%20Data%20Dictionary_June%202016.pdf", "mediaType": "application/pdf", "title": "USDA Rural Housing Service Single Family Guaranteed Public Data Dictionary - June 2016" } ], "license": "https://creativecommons.org/publicdomain/zero/1.0/", "bureauCode": [ "005:55" ], "modified": "2016-07-05", "publisher": { "@type": "org:Organization", "name": "Rural Development, Department of Agriculture" }, "accrualPeriodicity": "R/P6M", "keyword": [ "Active Loans", "Agriculture", "Agriculture and Rural Development", "Condo", "Coop", "Direct Home Loan", "Dwellings", "Guaranteed Loan", "Loan", "Loans by County", "PUD", "Rural Development", "Rural Housing Service", "SFHG", "Section 502", "Single Family Housing", "USDA", "United States Department of Agriculture", "affordable housing", "agriculture", "data", "disaster assistance", "dwelling", "home mortgage", "home purchease", "homeownership", "housing", "lending", "manufactured homes", "multifamily", "property", "rental", "rental assistance", "rural", "single-family" ] }, { "identifier": "USDA-RD-042", "accessLevel": "public", "contactPoint": { "hasEmail": "mailto:karen.priestly@wdc.usda.gov", "@type": "vcard:Contact", "fn": "Public Affairs Office" }, "programCode": [ "005:008" ], "landingPage": "http://www.sc.egov.usda.gov/data/MFH.html", "description": "Active loan characteristics in USDA RD Section 538 Multifamily Guaranteed Loan program, including loan, property, and community characteristics. Loan characteristics include obligation fiscal year, lender, borrower, loan closing date, loan amount, total development cost, loan to cost ratio, and federal LIHTC tax credit indicator. Property characteristics include location and address, colonias or tribal location indicator, EZ/EC location indicator, project size, project type, construction type, number of units by bedroom size, and average contract rent by bedroom size. Community characteristics include the area population and median household income at time of obligation.", "title": "USDA Rural Development Section 538 Multifamily Guaranteed Loans as of 7.13.2016", "distribution": [ { "@type": "dcat:Distribution", "downloadURL": "http://www.sc.egov.usda.gov/data/files/MFH_Section_538/USDA_RD_July_2016.CSV", "description": "Active loan characteristics in USDA RD Section 538 Multifamily Guaranteed Loan program, including loan, property, and community characteristics. Loan characteristics include obligation fiscal year, lender, borrower, loan closing date, loan amount, total development cost, loan to cost ratio, and federal LIHTC tax credit indicator. Property characteristics include location and address, colonias or tribal location indicator, EZ/EC location indicator, project size, project type, construction type, number of units by bedroom size, and average contract rent by bedroom size. Community characteristics include the area population and median household income at time of obligation.", "mediaType": "text/csv", "title": "USDA RD Section 538 Multifamily Guaranteed Loans" }, { "@type": "dcat:Distribution", "downloadURL": "http://www.sc.egov.usda.gov/data/files/MFH_Section_538/Section_538_MFHG_Loan_Program_Public_Data_Dictionary_July_2016.pdf", "description": "Public data dictionary describing the coding of variables for the USDA RD Section 538 Multifamily Guaranteed Loans dataset.", "mediaType": "application/pdf", "title": "USDA Section 538 Multifamily Guaranteed Loan Program_Public Data Dictionary_July 2016" } ], "license": "https://creativecommons.org/publicdomain/zero/1.0/", "bureauCode": [ "005:55" ], "modified": "2016-07-14", "publisher": { "@type": "org:Organization", "name": "Rural Development, Department of Agriculture" }, "accrualPeriodicity": "R/P6M", "keyword": [ "538", "Active Loans", "Agriculture", "Agriculture and Rural Development", "Coop", "Direct Home Loan", "Dwellings", "Guaranteed Loan", "Loan", "MFH", "Rural Development", "Rural Housing Service", "USDA", "United States Department of Agriculture", "affordable housing", "agriculture", "data", "dwelling", "guaranteed loan", "home mortgage", "home purchease", "homeownership", "housing", "lending", "leveraged loan", "mfh", "multifamily", "property", "rental", "rental housing", "rural", "rural areas", "self help", "single-family" ] }, { "identifier": "USDA-RD-039", "accessLevel": "public", "contactPoint": { "hasEmail": "mailto:karen.priestly@wdc.usda.gov", "@type": "vcard:Contact", "fn": "Public Affairs Office" }, "programCode": [ "005:008" ], "landingPage": "http://www.sc.egov.usda.gov/data/SFH.html", "description": "Active borrower characteristics aggregated at the Congressional District level of geography, including number of borrowers, income levels, race, ethnicity, marital status, number of children in household, and average household size.", "title": "USDA Rural Development Single Family Section 502 Direct Active Borrowers by Congressional District", "distribution": [ { "@type": "dcat:Distribution", "downloadURL": "http://www.sc.egov.usda.gov/data/files/SFH_Data/USDA%20Single%20Family%20Section%20502%20Direct_Borrowers%20by%20County%20as%20of%207.8.2016%20.csv", "description": "Active borrower characteristics aggregated at the Congressional District level of geography, including number of borrowers, income levels, race, ethnicity, marital status, number of children in household, and average household size.", "mediaType": "text/csv", "title": "USDA Rural Development Single Family Section 502 Direct Active Borrowers by Congressional District" }, { "@type": "dcat:Distribution", "downloadURL": "http://www.sc.egov.usda.gov/data/files/SFH_Data/USDA%20Single%20Family%20Section%20502%20Direct_Data%20Dictionary_July%202016.pdf", "mediaType": "application/pdf", "title": "SFHD 502 Data Dictionary" } ], "license": "https://creativecommons.org/publicdomain/zero/1.0/", "bureauCode": [ "005:55" ], "modified": "2016-07-14", "publisher": { "@type": "org:Organization", "name": "Rural Development, Department of Agriculture" }, "accrualPeriodicity": "R/P6M", "keyword": [ "Active Loans", "Agriculture", "Agriculture and Rural Development", "Condo", "Coop", "Direct Home Loan", "Dwellings", "Guaranteed Loan", "Loan", "Loans by County", "PUD", "Rural Development", "Rural Housing Service", "SFHD", "Section 502", "Single Family Housing", "USDA", "United States Department of Agriculture", "affordable housing", "agriculture", "data", "disaster assistance", "dwelling", "home mortgage", "home purchease", "homeownership", "housing", "lending", "manufactured homes", "multifamily", "property", "rental", "rural", "self help", "single-family" ] }, { "identifier": "USDA-RD-038", "accessLevel": "public", "contactPoint": { "hasEmail": "mailto:karen.priestly@wdc.usda.gov", "@type": "vcard:Contact", "fn": "Public Affairs Office" }, "programCode": [ "005:008" ], "landingPage": "http://www.sc.egov.usda.gov/data/SFH.html", "description": "Active borrower characteristics aggregated at the county level of geography, including number of borrowers, income levels, race, ethnicity, marital status, number of children in household, and average household size.", "title": "USDA Rural Development Single Family Section 502 Direct Active Borrowers by County", "distribution": [ { "@type": "dcat:Distribution", "downloadURL": "http://www.sc.egov.usda.gov/data/files/SFH_Data/USDA%20Single%20Family%20Section%20502%20Direct_Borrowers%20by%20County%20as%20of%207.8.2016%20.csv", "mediaType": "text/csv", "title": "USDA Rural Development Single Family Section 502 Direct Active Borrowers by County" }, { "@type": "dcat:Distribution", "downloadURL": "http://www.sc.egov.usda.gov/data/files/SFH_Data/USDA%20Single%20Family%20Section%20502%20Direct_Data%20Dictionary_July%202016.pdf", "mediaType": "application/pdf", "title": "SFHD 502 Data Dictionary" } ], "license": "https://creativecommons.org/publicdomain/zero/1.0/", "bureauCode": [ "005:55" ], "modified": "2016-07-14", "publisher": { "@type": "org:Organization", "name": "Rural Development, Department of Agriculture" }, "accrualPeriodicity": "R/P6M", "keyword": [ "Active Loans", "Agriculture", "Agriculture and Rural Development", "Condo", "Coop", "Direct Home Loan", "Dwellings", "Guaranteed Loan", "Loan", "Loans by County", "PUD", "Rural Development", "Rural Housing Service", "SFHD", "Section 502", "Single Family Housing", "USDA", "United States Department of Agriculture", "affordable housing", "agriculture", "data", "disaster assistance", "dwelling", "home mortgage", "home purchease", "homeownership", "housing", "lending", "manufactured homes", "multifamily", "property", "rental", "rural", "self help", "single-family" ] }, { "identifier": "USDA-RD-040", "accessLevel": "public", "contactPoint": { "hasEmail": "mailto:karen.priestly@wdc.usda.gov", "@type": "vcard:Contact", "fn": "Public Affairs Office" }, "programCode": [ "005:008" ], "landingPage": "http://www.sc.egov.usda.gov/data/SFH.html", "description": "Active loan characteristics aggregated at the Congressional District level of geography, including number of loans, average loan amount, average loan amount by 5 year ranges, number of loans to Section 523 Mutual Self Help Housing program participants, and number of leveraged loans.", "title": "USDA Rural Development Single Family Section 502 Direct Active Loans by Congressional District", "distribution": [ { "@type": "dcat:Distribution", "downloadURL": "http://www.sc.egov.usda.gov/data/files/SFH_Data/USDA%20Single%20Family%20Section%20502%20Direct_Loans%20by%20Congressional%20District%20as%20of%207.8.2016.csv", "description": "Active loan characteristics aggregated at the Congressional District level of geography, including number of loans, average loan amount, average loan amount by 5 year ranges, number of loans to Section 523 Mutual Self Help Housing program participants, and number of leveraged loans.", "mediaType": "text/csv", "title": "USDA Rural Development Single Family Section 502 Direct Active Loans by Congressional District" }, { "@type": "dcat:Distribution", "downloadURL": "http://www.sc.egov.usda.gov/data/files/SFH_Data/USDA%20Single%20Family%20Section%20502%20Direct_Data%20Dictionary_July%202016.pdf", "mediaType": "application/pdf", "title": "SFHD Section 502 Data Dictionary" } ], "license": "https://creativecommons.org/publicdomain/zero/1.0/", "bureauCode": [ "005:55" ], "modified": "2016-07-14", "publisher": { "@type": "org:Organization", "name": "Rural Development, Department of Agriculture" }, "accrualPeriodicity": "R/P6M", "keyword": [ "Active Loans", "Agriculture", "Agriculture and Rural Development", "Condo", "Coop", "Direct Home Loan", "Dwellings", "Guaranteed Loan", "Loan", "Loans by County", "PUD", "Rural Development", "Rural Housing Service", "SFHD", "Section 502", "Single Family Housing", "USDA", "United States Department of Agriculture", "affordable housing", "agriculture", "data", "disaster assistance", "dwelling", "home mortgage", "home purchease", "homeownership", "housing", "lending", "manufactured homes", "multifamily", "property", "rental", "rural", "self help", "single-family" ] }, { "identifier": "USDA-RD-037", "accessLevel": "public", "contactPoint": { "hasEmail": "mailto:karen.priestly@wdc.usda.gov", "@type": "vcard:Contact", "fn": "Public Affairs Office" }, "programCode": [ "005:008" ], "landingPage": "http://www.sc.egov.usda.gov/data/SFH.html", "description": "Active loan characteristics aggregated at the county level of geography, including number of loans, average loan amount, average loan amount by 5 year ranges, number of loans to Section 523 Mutual Self Help Housing program participants, and number of leveraged loans.", "title": "USDA Rural Development Single Family Section 502 Direct Active Loans by County", "distribution": [ { "@type": "dcat:Distribution", "downloadURL": "http://www.sc.egov.usda.gov/data/files/SFH_Data/USDA%20Single%20Family%20Section%20502%20Direct_Loans%20by%20County%20as%20of%207.8.2016.csv", "description": "Active loan characteristics aggregated at the county level of geography, including number of loans, average loan amount, average loan amount by 5 year ranges, number of loans to Section 523 Mutual Self Help Housing program participants, and number of leveraged loans.", "mediaType": "text/csv", "title": "USDA Rural Development Single Family Section 502 Direct Active Loans by County" }, { "@type": "dcat:Distribution", "downloadURL": "http://www.sc.egov.usda.gov/data/files/SFH_Data/USDA%20Single%20Family%20Section%20502%20Direct_Data%20Dictionary_July%202016.pdf", "mediaType": "application/pdf", "title": "SFHD Section 502 Data Dictionary" } ], "license": "https://creativecommons.org/publicdomain/zero/1.0/", "bureauCode": [ "005:55" ], "modified": "2016-07-14", "publisher": { "@type": "org:Organization", "name": "Rural Development, Department of Agriculture" }, "accrualPeriodicity": "R/P6M", "keyword": [ "Active Loans", "Agriculture", "Agriculture and Rural Development", "Condo", "Coop", "Direct Home Loan", "Dwellings", "Guaranteed Loan", "Loan", "Loans by County", "PUD", "Rural Development", "Rural Housing Service", "SFHD", "Section 502", "Single Family Housing", "USDA", "United States Department of Agriculture", "affordable housing", "agriculture", "data", "disaster assistance", "dwelling", "home mortgage", "home purchease", "homeownership", "housing", "lending", "manufactured homes", "multifamily", "property", "rental", "rural", "self help", "single-family" ] }, { "identifier": "USDA-27004", "accessLevel": "public", "contactPoint": { "hasEmail": "mailto:info@fas.usda.gov", "@type": "vcard:Contact", "fn": "Foreign Agricultural Service" }, "programCode": [ "005:000" ], "description": "The Agricultural Tariff Tool is a web application that queries tariff schedules and rate information resulting from Free Trade Agreements (FTAs). All exporters/importers need to determine how competitive their product will be in a market. One of the key cost components is the import tariff that will be applied to a product by the importing country. The FAS Agricultural Tariff Tool will allow exporters/importers to quickly and easily determine the tariff rate that will be applied to their product by the importing country.", "title": "Agricultural Tariff Tracker", "distribution": [ { "accessURL": "https://apps.fas.usda.gov/agtarifftracker/Home/Search", "@type": "dcat:Distribution", "format": "text/html", "description": "The Agricultural Tariff Tool is a web application that queries tariff schedules and rate information resulting from Free Trade Agreements (FTAs). All exporters/importers need to determine how competitive their product will be in a market. One of the key cost components is the import tariff that will be applied to a product by the importing country. The FAS Agricultural Tariff Tool will allow exporters/importers to quickly and easily determine the tariff rate that will be applied to their product by the importing country.", "title": "Agricultural Tariff Tracker" } ], "license": "https://creativecommons.org/publicdomain/zero/1.0/", "bureauCode": [ "005:68" ], "modified": "2017-02-01", "publisher": { "@type": "org:Organization", "name": "Foreign Agricultural Service, Department of Agriculture" }, "keyword": [ "Agricultural Products", "Agriculture", "FTA", "Foreign Agricultural Service", "Free Trade Agreement", "HS Code", "Harmonized System", "Tariff", "Tariff Schedule", "USTR", "United States Trade Representative" ] }, { "identifier": "USDA-27002", "accessLevel": "public", "contactPoint": { "hasEmail": "mailto:ronald.lord@fas.usda.gov", "@type": "vcard:Contact", "fn": "Ronald Lord" }, "programCode": [ "005:000" ], "description": "Amounts of 2016 Dairy Products Available for Reallocation, by Commodity and Country, as of October 1, 2016", "title": "Amounts of 2016 Dairy Products Available for Reallocation, by Commodity and Country", "distribution": [ { "accessURL": "https://www.fas.usda.gov/programs/resources/amounts-2016-dairy-products-available-reallocation-commodity-and-country-october-1-2016", "@type": "dcat:Distribution", "format": "text/html", "description": "Amounts of 2016 Dairy Products Available for Reallocation, by Commodity and Country, as of October 1, 2016", "title": "Amounts of 2016 Dairy Products Available for Reallocation, by Commodity and Country" } ], "license": "https://creativecommons.org/publicdomain/zero/1.0/", "bureauCode": [ "005:68" ], "modified": "2017-01-18", "publisher": { "@type": "org:Organization", "name": "Foreign Agricultural Service, Department of Agriculture" }, "keyword": [ "dairy products reallocation" ] }, { "identifier": "USDA-27003", "accessLevel": "public", "contactPoint": { "hasEmail": "mailto:ronald.lord@fas.usda.gov", "@type": "vcard:Contact", "fn": "Ronald Lord" }, "programCode": [ "005:000" ], "description": "Amounts of 2016 Licenses Issued, by Commodity and Country", "title": "Amounts of 2016 Licenses Issued, by Commodity and Country", "distribution": [ { "accessURL": "https://www.fas.usda.gov/programs/resources/amounts-2016-licenses-issued-commodity-and-country", "@type": "dcat:Distribution", "format": "text/html", "description": "https://www.fas.usda.gov/programs/resources/amounts-2016-licenses-issued-commodity-and-country", "title": "https://www.fas.usda.gov/programs/resources/amounts-2016-licenses-issued-commodity-and-country" } ], "license": "https://creativecommons.org/publicdomain/zero/1.0/", "bureauCode": [ "005:68" ], "modified": "2017-01-18", "publisher": { "@type": "org:Organization", "name": "Foreign Agricultural Service, Department of Agriculture" }, "keyword": [ "dairy licenses issued" ] }, { "identifier": "USDA-26291", "accessLevel": "public", "contactPoint": { "hasEmail": "mailto:Ronald.Frantz@fas.usda.gov", "@type": "vcard:Contact", "fn": "Ron Frantz" }, "programCode": [ "005:000" ], "description": "Global crop production analysis", "title": "Crop Explorer", "distribution": [ { "@type": "dcat:Distribution", "downloadURL": "http://www.pecad.fas.usda.gov/cropexplorer/Default.aspx", "mediaType": "text/html", "title": "Web Page" } ], "license": "https://creativecommons.org/licenses/by/4.0", "bureauCode": [ "005:68" ], "modified": "2014-12-23", "publisher": { "@type": "org:Organization", "name": "Foreign Agricultural Service, Department of Agriculture" }, "accrualPeriodicity": "R/P1M", "keyword": [ "Weather", "crop models", "crop production", "growing season", "satellite image", "soil moisture", "vegetation index" ], "spatial": "Africa, Asia, Europe, Middle East, North America, South America, World" }, { "identifier": "USDA-26351", "accessLevel": "public", "contactPoint": { "hasEmail": "mailto:esr@fas.usda.gov", "@type": "vcard:Contact", "fn": "Pete Burr" }, "programCode": [ "005:000" ], "description": "Information on US export sales, by commodity and country of destination, updated weekly.", "title": "Export Sales Reporting", "distribution": [ { "@type": "dcat:Distribution", "downloadURL": "http://apps.fas.usda.gov/esrquery/esrq.aspx", "mediaType": "text/html", "title": "Export Sales Query System Query Page" } ], "license": "https://creativecommons.org/licenses/by/4.0", "bureauCode": [ "005:68" ], "modified": "2015-03-12", "publisher": { "@type": "org:Organization", "name": "Foreign Agricultural Service, Department of Agriculture" }, "accrualPeriodicity": "R/P1D", "keyword": [ "International trade", "commodities", "export sales" ], "spatial": "Global", "issued": "1999-01-01" }, { "identifier": "USDA-26461", "accessLevel": "public", "contactPoint": { "hasEmail": "mailto:1-GAINAppSupport@fas.usda.gov", "@type": "vcard:Contact", "fn": "Lee Schartz" }, "programCode": [ "005:000" ], "description": "Information reports on agricultural situations in more than 130 countries submitted by overseas offices of USDA's Foreign Agricultural Service", "title": "Global Agricultural Information Network", "distribution": [ { "@type": "dcat:Distribution", "downloadURL": "http://gain.fas.usda.gov/Lists/Advanced%20Search/AllItems.aspx", "mediaType": "text/html", "title": "Web Page" } ], "license": "https://creativecommons.org/licenses/by/4.0", "bureauCode": [ "005:68" ], "modified": "2014-12-23", "publisher": { "@type": "org:Organization", "name": "Foreign Agricultural Service, Department of Agriculture" }, "accrualPeriodicity": "R/P1D", "keyword": [ "Agricultural economy", "agricultural policy", "commodity report", "foreign market" ], "spatial": "Global" }, { "identifier": "USDA-26321", "accessLevel": "public", "contactPoint": { "hasEmail": "mailto:GATShelp@fas.usda.gov", "@type": "vcard:Contact", "fn": "Jon Heal" }, "programCode": [ "005:000" ], "description": "Trade data from US Census Bureau as defined by USDA Foreign Agricultural Service groupings", "title": "Global Agricultural Trade System", "distribution": [ { "@type": "dcat:Distribution", "downloadURL": "http://apps.fas.usda.gov/gats/", "mediaType": "text/html", "title": "Global Agricultural Trade Sytem Home Page" } ], "license": "https://creativecommons.org/licenses/by/4.0", "bureauCode": [ "005:68" ], "modified": "2015-03-12", "publisher": { "@type": "org:Organization", "name": "Foreign Agricultural Service, Department of Agriculture" }, "accrualPeriodicity": "R/P1M", "keyword": [ "BICO", "FASUS", "International trade", "exports", "imports" ], "spatial": "Global" }, { "identifier": "USDA-27001", "accessLevel": "public", "contactPoint": { "hasEmail": "mailto:ronald.lord@fas.usda.gov", "@type": "vcard:Contact", "fn": "Ronald Lord" }, "programCode": [ "005:000" ], "description": "Listing of Dairy License Recipients Under Regulation 1 (as of March 2016)", "title": "Listing of Dairy License Recipients Under Regulation 1", "distribution": [ { "@type": "dcat:Distribution", "downloadURL": "https://www.fas.usda.gov/sites/default/files/2017-01/list_of_licenses_issued_march_2016.xlsx", "format": "text/xml", "description": "Listing of Dairy License Recipients Under Regulation 1 (as of March 2016)", "mediaType": "application/vnd.openxmlformats-officedocument.spreadsheetml.sheet", "title": "Listing of Dairy License Recipients Under Regulation 1" } ], "license": "https://creativecommons.org/publicdomain/zero/1.0/", "bureauCode": [ "005:68" ], "modified": "2017-01-18", "publisher": { "@type": "org:Organization", "name": "Foreign Agricultural Service, Department of Agriculture" }, "keyword": [ "dairy licensing program", "dairy licensing recipients" ] }, { "identifier": "USDA-2635111", "accessLevel": "public", "contactPoint": { "hasEmail": "mailto:ronald.lord@fas.usda.gov", "@type": "vcard:Contact", "fn": "Ronald Lord" }, "programCode": [ "005:000" ], "description": "Listing of Dairy License Recipients Under Regulation 1 (as of March 2016)", "title": "Listing of Dairy License Recipients Under Regulation 1", "distribution": [ { "@type": "dcat:Distribution", "downloadURL": "https://www.fas.usda.gov/sites/default/files/2017-01/list_of_licenses_issued_march_2016.xlsx", "format": "XLSX", "description": "Listing of Dairy License Recipients Under Regulation 1 (as of March 2016)", "mediaType": "application/vnd.openxmlformats-officedocument.spreadsheetml.sheet", "title": "Listing of Dairy License Recipients Under Regulation 1" } ], "describedByType": "text/csv", "license": "https://creativecommons.org/publicdomain/zero/1.0/", "bureauCode": [ "005:68" ], "modified": "2016-01-18", "publisher": { "@type": "org:Organization", "subOrganizationOf": { "@type": "org:Organization", "name": "Department of Agriculture" }, "name": "Foreign Agricultural Service" }, "accrualPeriodicity": "R/P1Y", "theme": [ "dairy licenses" ], "keyword": [ "dairy license recipients" ] }, { "identifier": "USDA-26341", "accessLevel": "public", "contactPoint": { "hasEmail": "mailto:psdonline@fas.usda.gov", "@type": "vcard:Contact", "fn": "Jeet Motwani" }, "programCode": [ "005:000" ], "landingPage": "http://apps.fas.usda.gov/psdonline", "description": "Official USDA data on production, supply, and distribution of agricultural commodities for the United States and key producing and consuming countries.", "title": "Production, Supply, and Distribution Database", "distribution": [ { "@type": "dcat:Distribution", "downloadURL": "http://apps.fas.usda.gov/psdonline", "description": "This database contains current and historical official USDA data on production, supply and distribution of agricultural commodities for the United States and key producing and consuming countries.", "mediaType": "text/html", "title": "PSD Online Home Page" } ], "license": "https://creativecommons.org/licenses/by/4.0", "bureauCode": [ "005:68" ], "modified": "2014-04-01", "publisher": { "@type": "org:Organization", "name": "Foreign Agricultural Service, Department of Agriculture" }, "accrualPeriodicity": "R/P1M", "keyword": [ "PSD", "commodity balance", "consumption", "international market", "market year", "production", "stocks", "supply and demand", "trade" ], "spatial": "Global" }, { "identifier": "USDA-26311", "accessLevel": "public", "contactPoint": { "hasEmail": "mailto:oliver.flake@fas.usda.gov", "@type": "vcard:Contact", "fn": "Oliver Flake" }, "programCode": [ "005:000" ], "description": "USDA quarterly forecasts for U.S. agricultural exports, in value and volume, by commodity and region", "title": "Quarterly Agricultural Export Forecast", "distribution": [ { "@type": "dcat:Distribution", "downloadURL": "http://usda.mannlib.cornell.edu/MannUsda/viewDocumentInfo.do?documentID=1196", "mediaType": "text/html", "title": "Web Page" } ], "license": "https://creativecommons.org/licenses/by/4.0", "bureauCode": [ "005:68" ], "modified": "2014-12-23", "publisher": { "@type": "org:Organization", "name": "Foreign Agricultural Service, Department of Agriculture" }, "accrualPeriodicity": "R/P3M", "keyword": [ "U S agricultural exports", "export outlook", "trade surplus" ], "spatial": "Global" }, { "identifier": "USDA-FAS-0010", "accessLevel": "public", "contactPoint": { "hasEmail": "mailto:paul.provance@fas.usda.gov", "@type": "vcard:Contact", "fn": "International Production Assessment Division" }, "programCode": [ "005:042" ], "description": "Monthly report on crop acreage, yield and production in major countries worldwide. Sources include reporting from FAS’s worldwide offices, official statistics of foreign governments, and analysis of economic data and satellite imagery.", "title": "World Agricultural Production", "distribution": [ { "@type": "dcat:Distribution", "downloadURL": "http://apps.fas.usda.gov/psdonline/circulars/production.pdf", "description": "Monthly report on crop acreage, yield and production in major countries worldwide. Sources include reporting from FAS’s worldwide offices, official statistics of foreign governments, and analysis of economic data and satellite imagery.", "mediaType": "application/pdf", "title": "World Agricultural Production" }, { "@type": "dcat:Distribution", "downloadURL": "https://inventory.data.gov/dataset/a4bb2733-5ab4-479e-96f3-5fe7f839c93e/resource/e47689e1-6c62-4611-9574-c0ba88cd7570/download/worldagriculturalproductionaug2014.pdf", "mediaType": "application/pdf", "title": "World Agricultural Production Aug 2014" } ], "license": "https://creativecommons.org/publicdomain/zero/1.0/", "bureauCode": [ "005:68" ], "modified": "2014-08-01", "publisher": { "@type": "org:Organization", "name": "Foreign Agricultural Service" }, "keyword": [ "commodity", "crop acreage", "crop yield", "production" ] }, { "identifier": "USDA-FNS-48", "accessLevel": "public", "contactPoint": { "hasEmail": "mailto:webmaster@fns.usda.gov", "@type": "vcard:Contact", "fn": "FNS Webmaster" }, "programCode": [ "005:054" ], "description": "This study is part of a larger FNS effort to ensure WIC program integrity and to comply with the Improper Payments Information Act of 2002 (IPIA) (Public Law 107-300), which requires FNS to estimate improper payments (IP) in its programs. To evaluate program integrity, the 2013 report includes two complementary studies: A study, comparable to the 1998 and 2005 WIC Vendor Management Studies, which examined purchases made through compliance buys using paper- or Electronic Benefit Transfer (EBT)-based FIs, and a cash value voucher study, which examined purchases made through compliance buys using the CVVs or, in the case of EBT, cash value benefits (CVBs) to purchase fruits and vegetables.", "title": "2013 WIC Vendor Management Study", "distribution": [ { "@type": "dcat:Distribution", "downloadURL": "http://www.fns.usda.gov/sites/default/files/2013WICVendor.pdf", "mediaType": "application/pdf", "title": "2013 WIC Vendor Management Study" } ], "license": "https://creativecommons.org/publicdomain/zero/1.0/", "bureauCode": [ "005:84" ], "dataQuality": true, "rights": "Public", "modified": "2013-11-21", "publisher": { "@type": "org:Organization", "name": "Food and Nutrition Service" }, "keyword": [ "EBT", "FNS", "Fruits", "Vegetables", "WIC" ], "spatial": "United States" }, { "identifier": "USDA-FNS-107", "accessLevel": "public", "contactPoint": { "hasEmail": "mailto:Sasha.Gersten-Paal@fns.usda.gov", "@type": "vcard:Contact", "fn": "Sasha Gersten-Paal" }, "programCode": [ "005:056" ], "description": "Most SNAP participants who can work, do work. SNAP rules require all recipients meet work requirements unless they are exempt because of age or disability or another specific reason. Children, seniors, and those with disabilities comprise almost two-thirds of all SNAP participants. Among households that include someone who is able to work, more than 75 percent* had a job in year before or after receiving SNAP. Forty-three percent of SNAP participants live in a household with earnings. \r\n\r\nSome of these working individuals are ABAWDs, or able-bodied adults without dependents. ABAWDs must meet special work requirements, in addition to the general work requirements, to maintain their eligibility.\r\n\r\nAn ABAWD is a person between the ages of 18 and 49 who has no dependents and is not disabled. ABAWD stands for Able Bodied Adult Without Dependents.", "title": "Able-Bodied Adults Without Dependents (ABAWDs) rules", "distribution": [ { "accessURL": "https://www.fns.usda.gov/snap/able-bodied-adults-without-dependents-abawds", "@type": "dcat:Distribution", "format": "pdf", "title": "ABAWD Waiver Status" } ], "license": "https://creativecommons.org/publicdomain/zero/1.0/", "bureauCode": [ "005:84" ], "dataQuality": true, "modified": "2016-01-14", "publisher": { "@type": "org:Organization", "name": "Food and Nutrition Service" }, "keyword": [ "ABAWD", "FNS", "Rules", "SNAP" ] }, { "identifier": "USDA-FNS-83", "accessLevel": "public", "contactPoint": { "hasEmail": "mailto:ITGB@fns.usda.gov", "@type": "vcard:Contact", "fn": "FNS Datasets" }, "programCode": [ "005:054" ], "description": "This report responds to requirements found in the Healthy, Hunger-Free Kids Act of 2010 (HHFKA) and summarizes hunger, obesity, and Type II diabetes among American Indian and Alaska Native children living on or near reservations or other tribal lands (Indian Country). The report provides a summary of available statistics on hunger, obesity, and Type II diabetes among children living in Indian Country and offers comparable statistics for the general population for context and comparison.", "title": "Addressing Child Hunger and Obesity in Indian Country: Report to Congress", "distribution": [ { "@type": "dcat:Distribution", "downloadURL": "http://www.fns.usda.gov/sites/default/files/IndianCountry.pdf", "format": "PDF", "description": "Addressing Child Hunger and Obesity in Indian Country: Report to Congress", "mediaType": "application/pdf", "title": "Addressing Child Hunger and Obesity in Indian Country: Report to Congress" } ], "license": "https://creativecommons.org/publicdomain/zero/1.0/", "bureauCode": [ "005:84" ], "dataQuality": true, "rights": "Public", "modified": "2012-01-12", "publisher": { "@type": "org:Organization", "name": "Food and Nutrition Service" }, "keyword": [ "FNS", "Hunger", "Hunger-Free Kids Act of 2010", "Obesity", "Type II Diabetes" ] }, { "identifier": "USDA-FNS-69", "accessLevel": "public", "contactPoint": { "hasEmail": "mailto:ITGB@fns.usda.gov", "@type": "vcard:Contact", "fn": "FNS Datasets" }, "programCode": [ "005:056" ], "description": "Due to the United States' high rates of obesity and diet-related chronic diseases, this project aims to develop a plan for front of package (FOP) and shelf-labeling systems that identifies healthy choices, develops theory-based approaches that leverage FOP and shelf-labeling systems to promote healthier food purchases by SNAP participants, and identifies further exploration through the implementation and testing of a future pilot study.", "title": "Approaches for Promoting Healthy Food Purchases by SNAP Participants Project", "distribution": [ { "@type": "dcat:Distribution", "downloadURL": "http://www.fns.usda.gov/sites/default/files/ICF-IHC-Final-Report-0714.pdf", "mediaType": "application/pdf", "title": "Approaches for Promoting Healthy Food Purchases by Supplemental Nutrition Assistance Program Participants Project" } ], "license": "https://creativecommons.org/publicdomain/zero/1.0/", "bureauCode": [ "005:84" ], "dataQuality": true, "rights": "Public", "modified": "2014-07-14", "publisher": { "@type": "org:Organization", "name": "Food and Nutrition Service" }, "keyword": [ "Chronic Diseases", "FNS", "Food", "Obesity", "SNAP" ], "spatial": "United States" }, { "identifier": "USDA-FNS-131", "accessLevel": "public", "contactPoint": { "hasEmail": "mailto:ITGB@usda.gov", "@type": "vcard:Contact", "fn": "FNS Datasets" }, "programCode": [ "005:056" ], "description": "As required by federal law, state SNAP agencies verify financial and non-financial information by matching SNAP applicant and participant information to various national and state data sources to ensure they meet the program’s eligibility criteria. Data matching is an important tool for ensuring program integrity and benefit accuracy. However, information on states’ data matching practices and protocols is limited. This study was undertaken to address this knowledge gap.", "title": "Assessment of States' Use of Computer Matching Protocols in SNAP", "distribution": [ { "@type": "dcat:Distribution", "downloadURL": "https://fns-prod.azureedge.net/sites/default/files/resource-files/SNAPComputerMatching.pdf", "description": "As required by federal law, state SNAP agencies verify financial and non-financial information by matching SNAP applicant and participant information to various national and state data sources to ensure they meet the program’s eligibility criteria. Data matching is an important tool for ensuring program integrity and benefit accuracy. However, information on states’ data matching practices and protocols is limited. This study was undertaken to address this knowledge gap.", "mediaType": "application/pdf", "title": "Assessment of States' Use of Computer Matching Protocols in SNAP" } ], "license": "https://creativecommons.org/publicdomain/zero/1.0/", "bureauCode": [ "005:84" ], "dataQuality": true, "rights": "Public", "modified": "2020-08-11", "publisher": { "@type": "org:Organization", "name": "Food and Nutrition Service" }, "keyword": [ "National and State data", "matching", "snap", "state data" ] }, { "identifier": "USDA-FNS-132", "accessLevel": "public", "contactPoint": { "hasEmail": "mailto:ITGB@usda.gov", "@type": "vcard:Contact", "fn": "FNS Datasets" }, "programCode": [ "005:056" ], "description": "The Administrative Review (AR) is the process state agencies use to assess compliance with Federal requirements of SFAs participating in the National School Lunch Program and the School Breakfast Program. The current AR process was implemented in school year (SY) 2013-2014. This study assesses the AR process by examining the results from a sample of Administrative Review forms selected and submitted by the 52 state agencies utilizing the AR process during school years 2013-2014, 2014-2015, and 2016-2017. The study also describes in-depth how nine selected state agencies conduct their ARs, and ways the process could be further improved.", "title": "Assessment of the Administrative Review Process in School Meal Programs", "distribution": [ { "@type": "dcat:Distribution", "downloadURL": "https://fns-prod.azureedge.net/sites/default/files/resource-files/AssessmentAdmin_Review.pdf", "description": "The Administrative Review (AR) is the process state agencies use to assess compliance with Federal requirements of SFAs participating in the National School Lunch Program and the School Breakfast Program. The current AR process was implemented in school year (SY) 2013-2014. This study assesses the AR process by examining the results from a sample of Administrative Review forms selected and submitted by the 52 state agencies utilizing the AR process during school years 2013-2014, 2014-2015, and 2016-2017. The study also describes in-depth how nine selected state agencies conduct their ARs, and ways the process could be further improved.", "mediaType": "application/pdf", "title": "Assessment of the Administrative Review Process in School Meal Programs" } ], "license": "https://creativecommons.org/publicdomain/zero/1.0/", "bureauCode": [ "005:84" ], "dataQuality": true, "rights": "Public", "modified": "2020-08-25", "publisher": { "@type": "org:Organization", "name": "Food and Nutrition Service" }, "keyword": [ "AR Process", "Administrative Review", "NSLP Schools", "National School Lunch Program", "School Breakfast", "School Breakfast Program" ] }, { "identifier": "USDA-FNS-128", "accessLevel": "public", "contactPoint": { "hasEmail": "mailto:webmaster@fns.usda.gov", "@type": "vcard:Contact", "fn": "FNS Webmaster" }, "programCode": [ "005:056" ], "description": "The At-Risk Afterschool Meals component of the Child and Adult Care Food Program (CACFP) offers Federal funding to Afterschool Programs that serve a meal or snack to children in low-income areas. Reimbursement for At-Risk Afterschool Snacks has been available since the 1990s. However, reimbursement for At-Risk Afterschool Meals was available only in a few states. The Healthy, Hunger-Free Kids Act of 2010 (P.L. 111-296) expanded the availability for At-Risk Afterschool Meals to all states.", "title": "CACFP At-Risk Afterschool Care Handbook", "distribution": [ { "@type": "dcat:Distribution", "downloadURL": "https://www.fns.usda.gov/sites/default/files/resource-files/atriskguide2016.pdf", "mediaType": "application/pdf", "title": "At-Risk Afterschool Care Handbook" } ], "license": "https://creativecommons.org/publicdomain/zero/1.0/", "bureauCode": [ "005:84" ], "modified": "2019-05-06", "publisher": { "@type": "org:Organization", "name": "Food and Nutrition Service" }, "keyword": [ "CACFP", "FNS", "Healthy", "Hunger-Free Kids Act of 2010", "School Meals", "USDA" ] }, { "identifier": "USDA-FNS-127", "accessLevel": "public", "contactPoint": { "hasEmail": "mailto:webmaster@fns.usda.gov", "@type": "vcard:Contact", "fn": "FNS Webmaster" }, "programCode": [ "005:056" ], "description": "This handbook is for state agency monitoring staff and provides detail for administering the Child and Adult Care Food Program (CACFP). \r\n \r\nThe CACFP is a federally-funded program that provides payments for eligible meals served to participants who meet age and income requirements. Meals served by participating institutions and facilities must meet minimum guidelines set by the U.S. Department of Agriculture (USDA). The CACFP helps institutions and facilities serve well-balanced, nutritious meals to the participants in their care. Serving nutritious meals helps improve and maintain the health and nutritional status of participants in a day care environment and can help them develop and maintain good eating habits.", "title": "CACFP Monitoring Handbook for State Agencies", "distribution": [ { "@type": "dcat:Distribution", "downloadURL": "https://www.fns.usda.gov/sites/default/files/resource-files/2014Monitoring_Handbook_SA.pdf", "mediaType": "application/pdf", "title": "Monitoring Handbook for State Agencies" } ], "license": "https://creativecommons.org/publicdomain/zero/1.0/", "bureauCode": [ "005:84" ], "modified": "2018-11-26", "publisher": { "@type": "org:Organization", "name": "Food and Nutrition Service" }, "keyword": [ "CACFP", "FNS", "Meals", "USDA", "health and nutritional" ] }, { "identifier": "USDA-FNS-133", "accessLevel": "public", "contactPoint": { "hasEmail": "mailto:ITGB@usda.gov", "@type": "vcard:Contact", "fn": "FNS Datasets" }, "programCode": [ "005:056" ], "description": "The Program Access Index (PAI) is one of the measures FNS uses to reward states for high performance in the administration of the Supplemental Nutrition Assistance Program (SNAP). Performance awards were authorized by the Farm Security and Rural Investment Act of 2002 (also known as the 2002 Farm Bill). The PAI is designed to indicate the degree to which low-income people have access to SNAP benefits. The purpose of this step-by-step guide is to describe the calculation of the Program Access Index (PAI) in detail. It includes all of the data, adjustments, and calculations used in determining the PAI for every state.", "title": "Calculating the SNAP Program Access Index: A Step-By-Step Guide", "distribution": [ { "@type": "dcat:Distribution", "downloadURL": "https://fns-prod.azureedge.net/sites/default/files/resource-files/PAI2017.pdf", "description": "The Program Access Index (PAI) is one of the measures FNS uses to reward states for high performance in the administration of the Supplemental Nutrition Assistance Program (SNAP). Performance awards were authorized by the Farm Security and Rural Investment Act of 2002 (also known as the 2002 Farm Bill). The PAI is designed to indicate the degree to which low-income people have access to SNAP benefits. The purpose of this step-by-step guide is to describe the calculation of the Program Access Index (PAI) in detail. It includes all of the data, adjustments, and calculations used in determining the PAI for every state.", "mediaType": "application/pdf", "title": "Calculating the SNAP Program Access Index: A Step-By-Step Guide" } ], "license": "https://creativecommons.org/publicdomain/zero/1.0/", "bureauCode": [ "005:84" ], "dataQuality": true, "rights": "Public", "modified": "2020-02-04", "publisher": { "@type": "org:Organization", "name": "Food and Nutrition Service" }, "keyword": [ "Farm Bill", "Farm Security and Rural Investment Act", "Program Access Index", "SNAP" ] }, { "identifier": "USDA-FNS-45", "accessLevel": "public", "contactPoint": { "hasEmail": "mailto:webmaster@fns.usda.gov", "@type": "vcard:Contact", "fn": "FNS Webmaster" }, "programCode": [ "005:056" ], "description": "The Program Access Index (PAI) is one of the measures the USDA Food and Nutrition Service (FNS) uses to reward States for high performance in the administration of the Supplemental Nutrition Assistance Program (SNAP). The Farm Security and Rural Investment Act of 2002 (also known as the 2002 Farm Bill) directed USDA to establish a number of indicators of effective program performance and to award bonus payments to States with the best and most improved performance. The PAI is designed to indicate the degree to which low-income people have access to SNAP benefits.", "title": "Calculating the SNAP Program Access Index: A Step-By-Step Guide for 2012", "distribution": [ { "@type": "dcat:Distribution", "downloadURL": "https://www.fns.usda.gov/snap/calculating-supplemental-nutrition-assistance-program-snap-program-access-index-step-step-guide", "mediaType": "application/pdf", "title": "Calculating the SNAP Program Access Index: A Step-By-Step Guide for 2012" } ], "license": "https://creativecommons.org/publicdomain/zero/1.0/", "bureauCode": [ "005:84" ], "dataQuality": true, "rights": "Public", "modified": "2014-02-19", "publisher": { "@type": "org:Organization", "name": "Food and Nutrition Service" }, "keyword": [ "FNS", "Farm Bill", "Program Access Index", "Program Performance", "SNAP" ], "spatial": "United States" }, { "identifier": "USDA-FNS-44", "accessLevel": "public", "contactPoint": { "hasEmail": "mailto:webmaster@fns.usda.gov", "@type": "vcard:Contact", "fn": "FNS Webmaster" }, "programCode": [ "005:056" ], "description": "This annual report provides details on the demographic characteristics and economic circumstances of SNAP households at both the national and the State level. In 2012, one-person households comprised more than half the caseload (50.3 percent) and the average SNAP household benefit declined by $7 to $274.", "title": "Characteristics of SNAP Households: Fiscal Year 2012", "distribution": [ { "@type": "dcat:Distribution", "downloadURL": "http://www.fns.usda.gov/sites/default/files/2012Characteristics.pdf", "mediaType": "application/pdf", "title": "Characteristics of SNAP Households: Fiscal Year 20 12" } ], "license": "https://creativecommons.org/publicdomain/zero/1.0/", "bureauCode": [ "005:84" ], "dataQuality": true, "rights": "Public", "modified": "2014-02-14", "publisher": { "@type": "org:Organization", "name": "Food and Nutrition Service" }, "keyword": [ "Demographic Characteristics", "FNS", "SNAP", "household" ] }, { "identifier": "USDA-FNS-134", "accessLevel": "public", "contactPoint": { "hasEmail": "mailto:ITGB@usda.gov", "@type": "vcard:Contact", "fn": "FNS Datasets" }, "programCode": [ "005:056" ], "description": "The Child Nutrition Program Operations Study II (CN-OPS II) is a multiyear study designed to provide the U.S. Department of Agriculture's (USDA) Food and Nutrition Service (FNS) with information on current State Agency (SA) and school food authority (SFA) policies, practices, and needs related to school nutrition service operations, financial management, meal counting, training and professional standards, food service equipment, and technology. Results are used to inform Child Nutrition program management and policy development.", "title": "Child Nutrition Program Operations Study II, School Year 2015-2016", "distribution": [ { "@type": "dcat:Distribution", "downloadURL": "https://fns-prod.azureedge.net/sites/default/files/resource-files/CNOPS-II-SY%202015-16.pdf", "description": "The Child Nutrition Program Operations Study II (CN-OPS II) is a multiyear study designed to provide the U.S. Department of Agriculture's (USDA) Food and Nutrition Service (FNS) with information on current State Agency (SA) and school food authority (SFA) policies, practices, and needs related to school nutrition service operations, financial management, meal counting, training and professional standards, food service equipment, and technology. Results are used to inform Child Nutrition program management and policy development.\r\n\r\nThe first year of CN-OPS II relies on data collected from May-October 2016 through surveys of all State Child Nutrition (CN) directors and a nationally representative stratified sample of SFA directors from public school districts with at least one school participating in the National School Lunch Program (NSLP) or School Breakfast Program (SBP). While survey questions were primarily asked about school year (SY) 2015-2016, retrospective data were collected for SY 2013-2014 and/or SY 2014-2015 on topics such as participation, meal prices, and SFA finances to facilitate comparisons over time.", "mediaType": "application/pdf", "title": "Child Nutrition Program Operations Study II, School Year 2015-2016" } ], "license": "https://creativecommons.org/publicdomain/zero/1.0/", "bureauCode": [ "005:84" ], "dataQuality": true, "rights": "Public", "modified": "2019-12-18", "publisher": { "@type": "org:Organization", "name": "Food and Nutrition Service" }, "keyword": [ "Child Nutrition Program", "SFA", "State Agency", "school food authority" ] }, { "identifier": "USDA-FNS-24", "accessLevel": "public", "contactPoint": { "hasEmail": "mailto:ITGB@fns.usda.gov", "@type": "vcard:Contact", "fn": "FNS Datasets" }, "programCode": [ "005:054" ], "description": "This memorandum provides an overview of ways State agencies, School Food Authorities (SFA) participating in the National School Lunch and School\r\nBreakfast Programs (NSLP and SBP), institutions participating in the Child and Adult Care Food Program (CACFP), and sponsors participating in the\r\nSummer Food Service Program (SFSP) can respond to situations\r\nresulting from damage or disruptions due to natural disasters such as\r\nhurricanes, tornadoes, and floods. State agencies should review the avenues available to prepare and plan before a disaster strikes so responses can be as swift as possible.", "title": "Child Nutrition Programs Disaster Response Memo", "distribution": [ { "@type": "dcat:Distribution", "downloadURL": "http://www.fns.usda.gov/sites/default/files/SP25_CACFP12_SFSP10-2012.pdf", "mediaType": "application/pdf", "title": "Child Nutrition Programs Disaster Response Memo" } ], "license": "https://creativecommons.org/publicdomain/zero/1.0/", "bureauCode": [ "005:84" ], "dataQuality": true, "rights": "Public", "modified": "2012-04-10", "publisher": { "@type": "org:Organization", "name": "Food and Nutrition Service" }, "keyword": [ "Child and Adult Care Food Program", "Disaster", "Flood", "Food", "Hurricanes", "National School Lunch and School Breakfast Program", "School", "School Food Authorities", "State agencies", "Summer Food Service Program", "Tornadoes" ], "spatial": "United States", "issued": "2012-04-10" }, { "identifier": "USDA-FNS-00006", "accessLevel": "public", "contactPoint": { "hasEmail": "mailto:Tim.Kreh@fns.usda.gov", "@type": "vcard:Contact", "fn": "Tim Kreh" }, "programCode": [ "005:054" ], "description": "Child and Adult Care Food Participation plays a vital role in improving the quality of day care for children and elderly adults by making care more affordable for many low-income families. Through CACFP, nearly 3 million children and 90,000 adults receive nutritious meals and snacks each day as part of the day care they receive. The data set contains participation; meals served, and cash payments to states.", "title": "Child and Adult Care Food Participation, Meals, and Cost Data", "distribution": [ { "@type": "dcat:Distribution", "downloadURL": "http://www.fns.usda.gov/sites/default/files/pd/ccsummar.xls", "mediaType": "application/vnd.ms-excel", "title": "Child and Adult Care Food Participation, Meals, and Cost Data" } ], "license": "https://creativecommons.org/licenses/by/4.0", "bureauCode": [ "005:84" ], "modified": "2014-12-23", "publisher": { "@type": "org:Organization", "name": "Food and Nutrition Service, Department of Agriculture" }, "accrualPeriodicity": "R/P3M", "keyword": [ "Adult", "CACFP", "Care", "Child", "Food", "Participation", "low-income", "meals", "nutritious", "payments", "states" ], "spatial": "United States" }, { "identifier": "USDA-FNS-67", "accessLevel": "public", "contactPoint": { "hasEmail": "mailto:ITGB@fns.usda.gov", "@type": "vcard:Contact", "fn": "FNS Datasets" }, "programCode": [ "005:055" ], "description": "The (CACFP) provides reimbursements for nutritious meals and snacks served in family day care homes, child care centers, and other participating facilities and programs. This assessment examines the accuracy of the classification of Family Day Care Homes (FDCHs) participating in the U.S. Department of Agriculture's (USDA) Child and Adult Care Food Program. The assessment provides estimates of the number of FDCHs misclassified by sponsoring agencies into the wrong tier and the resulting erroneous payments for meals and snacks reimbursed at the wrong rate for program year 2013.", "title": "Child and Adult Care Food Program (CACFP): Assessment of Sponsor Tiering Determinations", "distribution": [ { "@type": "dcat:Distribution", "downloadURL": "http://www.fns.usda.gov/sites/default/files/CACFPTiering13.pdf", "mediaType": "application/pdf", "title": "Child and Adult Care Food Program (CACFP): Assessment of Sponsor Tiering Determinations" } ], "license": "https://creativecommons.org/publicdomain/zero/1.0/", "bureauCode": [ "005:84" ], "dataQuality": true, "rights": "Public", "modified": "2014-09-14", "publisher": { "@type": "org:Organization", "name": "Food and Nutrition Service" }, "keyword": [ "Child and Adult Care Food Program", "FDCH", "USDA" ], "spatial": "United States" }, { "identifier": "USDA-FNS-104", "accessLevel": "public", "contactPoint": { "hasEmail": "mailto:Tim.Kreh@fns.usda.gov", "@type": "vcard:Contact", "fn": "Tim Kreh" }, "programCode": [ "005:054" ], "description": "This dataset provides the monthly data for Child and Adult Care Program.", "title": "Child and Adult Care Program Monthly Data", "distribution": [ { "accessURL": "http://www.fns.usda.gov/sites/default/files/pd/33cc_monthly.pdf", "@type": "dcat:Distribution", "title": "Child and Adult Care Program Monthly Data" } ], "license": "https://creativecommons.org/publicdomain/zero/1.0/", "bureauCode": [ "005:84" ], "dataQuality": true, "modified": "2015-11-06", "publisher": { "@type": "org:Organization", "subOrganizationOf": { "@type": "org:Organization", "name": "Department of Agriculture" }, "name": "Food and Nutrition Service" }, "keyword": [ "Child and Adult Care Program", "FNS", "USDA" ] }, { "identifier": "USDA-FNS-52", "accessLevel": "public", "contactPoint": { "hasEmail": "mailto:ITGB@fns.usda.gov", "@type": "vcard:Contact", "fn": "FNS Datasets" }, "programCode": [ "005:055" ], "description": "Provide Persons participating in Commodity Supplemental Food Program on State level.", "title": "Commodity Supplemental Food Program: Total Participation", "distribution": [ { "@type": "dcat:Distribution", "downloadURL": "http://www.fns.usda.gov/sites/default/files/pd/20csfp.pdf", "mediaType": "application/pdf", "title": "Commodity Supplemental Food Program: Total Participation" } ], "license": "https://creativecommons.org/publicdomain/zero/1.0/", "bureauCode": [ "005:84" ], "dataQuality": true, "rights": "Public", "modified": "2014-08-08", "publisher": { "@type": "org:Organization", "name": "Food and Nutrition Service" }, "keyword": [ "Commodity", "Commodity Supplemental Food Program", "Food", "State Level", "Supplemental" ], "spatial": "United States" }, { "identifier": "USDA-FNS-58", "accessLevel": "public", "contactPoint": { "hasEmail": "mailto:ITGB@fns.usda.gov", "@type": "vcard:Contact", "fn": "FNS Datasets" }, "programCode": [ "005:055" ], "description": "The Healthy, Hunger-Free Kids Act (HHFKA) provided schools and districts that predominately serve low-income children with a new option for meal certification. Under the Community Eligibility Provision, schools do not collect or process meal applications for free and reduced-price meals served in the National School Lunch Program and School Breakfast Program. Schools must serve all meals at no cost with any costs in excess of the Federal reimbursement paid from non-Federal sources. The evaluation, mandated by HHFKA, examined the implementation and impacts of the Community Eligibility Provision.", "title": "Community Eligibility Provision Evaluation", "distribution": [ { "@type": "dcat:Distribution", "downloadURL": "http://www.fns.usda.gov/sites/default/files/CEPEvaluation.pdf", "mediaType": "application/pdf", "title": "Community Eligibility Provision Evaluation" } ], "license": "https://creativecommons.org/publicdomain/zero/1.0/", "bureauCode": [ "005:84" ], "dataQuality": true, "rights": "Public", "modified": "2014-02-11", "publisher": { "@type": "org:Organization", "name": "Food and Nutrition Service" }, "keyword": [ "FNS", "HHFKA", "National School Lunch Program", "districts", "meals", "schools" ], "spatial": "United States" }, { "identifier": "USDA-FNS-54", "accessLevel": "public", "contactPoint": { "hasEmail": "mailto:ITGB@fns.usda.gov", "@type": "vcard:Contact", "fn": "FNS Datasets" }, "programCode": [ "005:055" ], "description": "Provide cost of Nutrition Services Incentive Program (NSIP--formerly Nutrition Program for the Elderly), Food Distribution on Indian Reservations (FDPIR), Commodity Supplemental Food (CSFP), Emergency Food Assistance (TEFAP) programs.", "title": "Cost of Food Distribution Programs", "distribution": [ { "@type": "dcat:Distribution", "downloadURL": "http://www.fns.usda.gov/sites/default/files/pd/fd$sum.pdf", "mediaType": "application/pdf", "title": "Cost of Food Distribution Programs" } ], "license": "https://creativecommons.org/publicdomain/zero/1.0/", "bureauCode": [ "005:84" ], "dataQuality": true, "rights": "Public", "modified": "2014-08-08", "publisher": { "@type": "org:Organization", "name": "Food and Nutrition Service" }, "keyword": [ "CSFP", "FDPIR", "FNS", "Food Distribution Programs", "NSIP", "TEFAP" ], "spatial": "United States" }, { "identifier": "USDA-FNS-19", "accessLevel": "public", "contactPoint": { "hasEmail": "mailto:ITGB@fns.usda.gov", "@type": "vcard:Contact", "fn": "FNS Datasets" }, "programCode": [ "005:056" ], "description": "We adjust SNAP maximum allotments, deductions, and income eligibility standards at the beginning of each Federal fiscal year. The changes are based on changes in the cost of living. COLAs take effect on October 1 each year.\r\n\r\nMaximum allotments are calculated from the cost of a market basket based on the Thrifty Food Plan for a family of four, priced in June that year. The maximum allotments for households larger and smaller than four persons are determined using formulas that account for economies of scale. Smaller households get slightly more per person than the four-person household. Larger households get slightly less.\r\n\r\nIncome eligibility standards are set by law. Gross monthly income limits are set at 130 percent of the poverty level for the household size. Net monthly income limits are set at 100 percent of poverty.", "title": "Cost of Living Adjustment (COLA) Information", "distribution": [ { "@type": "dcat:Distribution", "downloadURL": "http://www.fns.usda.gov/snap/cost-living-adjustment-cola-information", "mediaType": "text/htm", "title": "Cost of Living Adjustment (COLA) Information" } ], "license": "https://creativecommons.org/publicdomain/zero/1.0/", "bureauCode": [ "005:84" ], "rights": "Public", "modified": "2014-09-25", "publisher": { "@type": "org:Organization", "name": "Food and Nutrition Service" }, "keyword": [ "Aircraft Cost", "SNAP", "deduction", "income" ], "spatial": "United States" }, { "identifier": "USDA-FNS-15", "accessLevel": "public", "contactPoint": { "hasEmail": "mailto:Jackie.Haven@fns.usda.gov", "@type": "vcard:Contact", "fn": "Jackie Haven" }, "programCode": [ "005:057" ], "description": "A daily food plan shows what and how much your child should eat to meet his or her needs. You can create an eating plan for your preschooler using the SuperTracker's MyPlan. You will be asked to create a profile using your child’s information. You can register to save the profile if you want to. \r\nUse the Plan as a general guide to help you feed your child. It will show what and how much to offer your child to meet his or her needs.", "title": "Daily Food Plan for Preschoolers", "distribution": [ { "accessURL": "http://www.choosemyplate.gov/preschoolers-daily-food-plans", "@type": "dcat:Distribution", "title": "Daily Food Plan for Preschoolers" } ], "license": "https://creativecommons.org/publicdomain/zero/1.0/", "bureauCode": [ "005:84" ], "rights": "Public", "modified": "2014-07-23", "publisher": { "@type": "org:Organization", "name": "Food and Nutrition Service" }, "keyword": [ "child", "food", "plan" ], "spatial": "United States" }, { "identifier": "USDA-FNS-125", "accessLevel": "public", "contactPoint": { "hasEmail": "mailto:webmaster@fns.usda.gov", "@type": "vcard:Contact", "fn": "FNS Webmaster" }, "programCode": [ "005:056" ], "description": "The 2010 Child Nutrition reauthorization also directed the Secretary of Agriculture to submit a report by the end of December each year to the U.S. House of Representatives Committees on Agriculture and Education and the Workforce, in addition to the Senate Committee on Agriculture, Nutrition, and Forestry. The annual reports are to describe the status of each demonstration project and the available results of any evaluations of the demonstration projects completed during the previous fiscal year (FY).", "title": "Demonstration Projects to End Childhood Hunger 2018 Annual Report to Congress", "distribution": [ { "@type": "dcat:Distribution", "downloadURL": "https://www.fns.usda.gov/sites/default/files/resource-files/ChildhoodHunger-2018Congress.pdf", "mediaType": "application/pdf", "title": "Demonstration Projects to End Childhood Hunger 2018 Annual Report to Congress" } ], "license": "https://creativecommons.org/publicdomain/zero/1.0/", "bureauCode": [ "005:84" ], "dataQuality": true, "modified": "2018-10-01", "publisher": { "@type": "org:Organization", "name": "Food and Nutrition Service" }, "keyword": [ "Agriculture", "Child Nutrition", "FNS", "Nutrition", "USDA" ] }, { "identifier": "USDA-FNS-13", "accessLevel": "public", "contactPoint": { "hasEmail": "mailto:Jackie.Haven@fns.usda.gov", "@type": "vcard:Contact", "fn": "Jackie Haven" }, "programCode": [ "005:057" ], "description": "The new 2010 Dietary Guidelines for Americans focus on balancing calories with physical activity, and encourage Americans to consume more healthy foods like vegetables, fruits, whole grains, fat-free and low-fat dairy products, and seafood, and to consume less sodium, saturated and trans fats, added sugars, and refined grains.", "title": "Dietary Guidelines for Americans, 2010", "distribution": [ { "accessURL": "http://www.health.gov/dietaryguidelines/dga2010/DietaryGuidelines2010.pdf", "@type": "dcat:Distribution", "title": "Dietary Guidelines for Americans, 2010" } ], "license": "https://creativecommons.org/publicdomain/zero/1.0/", "bureauCode": [ "005:84" ], "rights": "Public", "modified": "2010-12-15", "publisher": { "@type": "org:Organization", "name": "Food and Nutrition Service" }, "keyword": [ "Dietary", "Food", "calories", "fruits", "guidelines", "health", "vegetables" ], "spatial": "United States" }, { "identifier": "USDA-FNS-21", "accessLevel": "public", "contactPoint": { "hasEmail": "mailto:ITGB@fns.usda.gov", "@type": "vcard:Contact", "fn": "FNS Datasets" }, "programCode": [ "005:056" ], "description": "This handbook describes D - SNAP policy, provides lessons learned from previous D-SNAPs, and contains toolkits to help SNAP offices plan for, organize, and operate a D-SNAP.", "title": "Disaster SNAP Guidance", "distribution": [ { "@type": "dcat:Distribution", "downloadURL": "http://www.fns.usda.gov/sites/default/files/D-SNAP_handbook.pdf", "mediaType": "application/pdf", "title": "Disaster SNAP Guidance" } ], "license": "https://creativecommons.org/publicdomain/zero/1.0/", "bureauCode": [ "005:84" ], "rights": "Public", "modified": "2013-04-04", "publisher": { "@type": "org:Organization", "name": "Food and Nutrition Service" }, "keyword": [ "SNAP", "agricultural policy", "disaster" ], "spatial": "United States" }, { "identifier": "USDA-FNS-22", "accessLevel": "public", "contactPoint": { "hasEmail": "mailto:ITGB@fns.usda.gov", "@type": "vcard:Contact", "fn": "FNS Datasets" }, "programCode": [ "005:056" ], "description": "Disaster SNAP Tool Kit", "title": "Disaster SNAP Tool Kit", "distribution": [ { "@type": "dcat:Distribution", "downloadURL": "http://www.fns.usda.gov/sites/default/files/D-SNAP_Guidance_Handbook_Toolkit.pdf", "mediaType": "application/pdf", "title": "DSNAP Tool Kit" } ], "license": "https://creativecommons.org/publicdomain/zero/1.0/", "bureauCode": [ "005:84" ], "rights": "Public", "modified": "2013-04-04", "publisher": { "@type": "org:Organization", "name": "Food and Nutrition Service" }, "keyword": [ "Tool-Kit", "disaster", "snap" ], "spatial": "United States" }, { "identifier": "USDA-FNS-25", "accessLevel": "public", "contactPoint": { "hasEmail": "mailto:ITGB@fns.usda.gov", "@type": "vcard:Contact", "fn": "FNS Datasets" }, "programCode": [ "005:056" ], "description": "This dataset provides information about disaster Supplemental Nutrition Assistance Program (SNAP) income eligibility standards and allotments based on household size.", "title": "Disaster Supplemental Nutrition Assistance Program Income Eligibility Standards and Allotments", "distribution": [ { "@type": "dcat:Distribution", "downloadURL": "https://www.fns.usda.gov/sites/default/files/disaster/FY17-Disaster-Income-Eligibility-Standards-and-Allotments.pdf", "mediaType": "application/pdf", "title": "Disaster Supplemental Nutrition Assistance Program Income Eligi bility Standards and Allotments" } ], "license": "https://creativecommons.org/publicdomain/zero/1.0/", "bureauCode": [ "005:84" ], "dataQuality": true, "rights": "Public", "modified": "2014-01-24", "publisher": { "@type": "org:Organization", "name": "Food and Nutrition Service" }, "keyword": [ "Disaster Gross Income Limit", "Income", "SNAP", "disaster" ], "spatial": "United States" }, { "identifier": "USDA-FNS-91", "accessLevel": "public", "contactPoint": { "hasEmail": "mailto:ITGB@fns.usda.gov", "@type": "vcard:Contact", "fn": "FNS Datasets" }, "programCode": [ "005:056" ], "description": "This report describes the dynamics of the Supplemental Nutrition Assistance Program participation from 2008-2012. It describe individuals’ patterns of SNAP participation and analyze which factors were associated with their decisions to enter or exit the program. It uses data from the U.S. Census Bureau’s Survey of Income and Program Participation covering the period from 2008 to 2012.", "title": "Dynamics and Determinants of Supplemental Nutrition Assistance Program Participation from 2008-2012", "distribution": [ { "accessURL": "http://www.fns.usda.gov/sites/default/files/ops/Dynamics2008-2012.pdf", "@type": "dcat:Distribution", "format": "PDF", "title": "Dynamics and Determinants of Supplemental Nutrition Assistance Program Participation from 2008-2012" } ], "license": "https://creativecommons.org/publicdomain/zero/1.0/", "bureauCode": [ "005:84" ], "dataQuality": true, "rights": "Public", "modified": "2014-12-15", "publisher": { "@type": "org:Organization", "name": "Food and Nutrition Service" }, "keyword": [ "Food and Nutrition Service", "Income and Program Participation", "Report", "SNAP" ] }, { "identifier": "USDA-FNS-41", "accessLevel": "public", "contactPoint": { "hasEmail": "mailto:webmaster@fns.usda.gov", "@type": "vcard:Contact", "fn": "FNS Webmaster" }, "programCode": [ "005:056" ], "description": "This report presents estimates that, for each state, measure the need for SNAP and the program’s effectiveness in each of the three years from 2009 to 2011.", "title": "Empirical Bayes Shrinkage Estimates of State SNAP Participation Rates", "distribution": [ { "@type": "dcat:Distribution", "downloadURL": "http://www.fns.usda.gov/sites/default/files/techpartrate2009-2011.pdf", "mediaType": "application/pdf", "title": "Empirical Bayes Shrinkage Estimates of State Supplemental Nutrition assistance Program Participation Rates in 2009-2011" } ], "license": "https://creativecommons.org/publicdomain/zero/1.0/", "bureauCode": [ "005:84" ], "dataQuality": true, "rights": "Public", "modified": "2014-03-11", "publisher": { "@type": "org:Organization", "name": "Food and Nutrition Service" }, "keyword": [ "FNS", "Program Effectiveness", "SNAP" ], "spatial": "United States" }, { "identifier": "USDA-FNS-135", "accessLevel": "public", "contactPoint": { "hasEmail": "mailto:ITGB@usda.gov", "@type": "vcard:Contact", "fn": "FNS Datasets" }, "programCode": [ "005:056" ], "description": "This report, part of an annual series, presents estimates, by state, of the percentage of eligible persons and working poor individuals who participated in SNAP during an average month in fiscal year (FY 2017) and the two previous fiscal years.", "title": "Estimates of State Supplemental Nutrition Assistance Program Participation Rates in 2017", "distribution": [ { "@type": "dcat:Distribution", "downloadURL": "https://fns-prod.azureedge.net/sites/default/files/resource-files/Reaching2017.pdf", "description": "This report, part of an annual series, presents estimates, by state, of the percentage of eligible persons and working poor individuals who participated in SNAP during an average month in fiscal year (FY 2017) and the two previous fiscal years.", "mediaType": "application/pdf", "title": "Estimates of State Supplemental Nutrition Assistance Program Participation Rates in 2017" } ], "license": "https://creativecommons.org/publicdomain/zero/1.0/", "bureauCode": [ "005:84" ], "dataQuality": true, "rights": "Public", "modified": "2020-08-28", "publisher": { "@type": "org:Organization", "name": "Food and Nutrition Service" }, "keyword": [ "FY 2017", "SNAP", "participation" ] }, { "identifier": "USDA-FNS-136", "accessLevel": "public", "contactPoint": { "hasEmail": "mailto:ITGB@usda.gov", "@type": "vcard:Contact", "fn": "FNS Datasets" }, "programCode": [ "005:056" ], "description": "Historically, approximately a third of the eligible elderly population has participated in the Supplemental Nutrition Assistance Program (SNAP), the largest of the domestic nutrition assistance programs administered by the Food and Nutrition Service (FNS) of the U.S. Department of Agriculture (USDA). In response to the low participation levels and unique economic circumstances of elderly households, FNS has implemented specific eligibility criteria for elderly households, and has developed several demonstration projects and opportunities to waive federal regulations that seek to address elderly access to SNAP.", "title": "Evaluation of Alternatives to Improve Elderly Access to SNAP", "distribution": [ { "@type": "dcat:Distribution", "downloadURL": "https://fns-prod.azureedge.net/sites/default/files/resource-files/AlternativesImproveElderlyAccess.pdf", "description": "Historically, approximately a third of the eligible elderly population has participated in the Supplemental Nutrition Assistance Program (SNAP), the largest of the domestic nutrition assistance programs administered by the Food and Nutrition Service (FNS) of the U.S. Department of Agriculture (USDA). In response to the low participation levels and unique economic circumstances of elderly households, FNS has implemented specific eligibility criteria for elderly households, and has developed several demonstration projects and opportunities to waive federal regulations that seek to address elderly access to SNAP.", "mediaType": "application/pdf", "title": "Evaluation of Alternatives to Improve Elderly Access to SNAP" } ], "license": "https://creativecommons.org/publicdomain/zero/1.0/", "bureauCode": [ "005:84" ], "dataQuality": true, "rights": "Public", "modified": "2020-05-04", "publisher": { "@type": "org:Organization", "name": "Food and Nutrition Service" }, "keyword": [ "SNAP", "Supplemental Nutrition Assistance Program", "elderly", "elderly access", "eligibility criteria" ] }, { "identifier": "USDA-FNS-137", "accessLevel": "public", "contactPoint": { "hasEmail": "mailto:ITGB@usda.gov", "@type": "vcard:Contact", "fn": "FNS Datasets" }, "programCode": [ "005:056" ], "description": "The demonstration of Direct Certification with Medicaid for Free and Reduced-Price Meals (DCM-F/RP) allows authorized States and school districts to use information from Medicaid data files to identify students eligible to receive free or reduced-price (F/RP) National School Lunch Program (NSLP) and School Breakfast Program (SBP) meals. The Food and Nutrition Service (FNS) contracted with Mathematica Policy Research to conduct a study of the first two years of this demonstration to describe the implementation process and explore the effects on certification, participation, Federal reimbursements, and State administrative costs. This report presents the findings from the first year of the demonstration evaluation, school year (SY) 2016–2017.", "title": "Evaluation of the Direct Certification with Medicaid for Free and Reduced-Price Meals - Year 1", "distribution": [ { "@type": "dcat:Distribution", "downloadURL": "https://fns-prod.azureedge.net/sites/default/files/resource-files/Evaluation-DCM_Year1.pdf", "description": "The demonstration of Direct Certification with Medicaid for Free and Reduced-Price Meals (DCM-F/RP) allows authorized States and school districts to use information from Medicaid data files to identify students eligible to receive free or reduced-price (F/RP) National School Lunch Program (NSLP) and School Breakfast Program (SBP) meals. The Food and Nutrition Service (FNS) contracted with Mathematica Policy Research to conduct a study of the first two years of this demonstration to describe the implementation process and explore the effects on certification, participation, Federal reimbursements, and State administrative costs. This report presents the findings from the first year of the demonstration evaluation, school year (SY) 2016–2017.", "mediaType": "application/pdf", "title": "Evaluation of the Direct Certification with Medicaid for Free and Reduced-Price Meals Demonstration - Year 1" } ], "license": "https://creativecommons.org/publicdomain/zero/1.0/", "bureauCode": [ "005:84" ], "dataQuality": true, "rights": "Public", "modified": "2020-08-30", "publisher": { "@type": "org:Organization", "name": "Food and Nutrition Service" }, "keyword": [ "Direct Certification", "Free and Reduced-Price Meals", "Medicaid", "NSLP", "National School Lunch Program", "National School Lunch and School Breakfast Program", "SBP", "School Breakfast Program" ] }, { "identifier": "USDA-FNS-123", "accessLevel": "public", "contactPoint": { "hasEmail": "mailto:ITGB@fns.usda.gov", "@type": "vcard:Contact", "fn": "FNS Datasets" }, "programCode": [ "005:055" ], "description": "This report presents results from a pre/post study comparing the fall of 2014 with the spring of 2015, to evaluate the impacts of a Pilot project under which States had the option to serve canned, frozen, and dried fruits and vegetables.", "title": "Evaluation of the Elementary Schools Pilot Project for Canned, Frozen, or Dried Fruits and Vegetables", "distribution": [ { "accessURL": "https://www.fns.usda.gov/evaluation-elementary-schools-pilot-project-canned-frozen-or-dried-fruits-and-vegetables-fresh", "@type": "dcat:Distribution", "format": "pdf", "title": "Evaluation of the Elementary Schools Pilot Project for Canned, Frozen, or Dried Fruits and Vegetables in the Fresh Fruits and Vegetable Program" } ], "license": "https://creativecommons.org/publicdomain/zero/1.0/", "bureauCode": [ "005:84" ], "dataQuality": true, "modified": "2017-01-24", "publisher": { "@type": "org:Organization", "name": "Food and Nutrition Service" }, "keyword": [ "Elementary Schools", "FNS", "Fresh Fruits", "USAD" ] }, { "identifier": "USDA-FNS-66", "accessLevel": "public", "contactPoint": { "hasEmail": "mailto:ITGB@fns.usda.gov", "@type": "vcard:Contact", "fn": "FNS Datasets" }, "programCode": [ "005:056" ], "description": "This final report summary describes the background, methods, and findings of the Healthy Incentives Pilot (HIP). This pilot project enabled SNAP participants to receive an incentive of 30 cents for every SNAP dollar spent on targeted fruits and vegetables at participating retailers. The comprehensive data concluded that HIP participants consumed 26 percent more of targeted fruits and vegetables compared to non-participants. The summary report also details the implications for HIP retailer participants and total costs.", "title": "Evaluation of the Healthy Incentives Pilot (HIP) Final Report-Summary", "distribution": [ { "@type": "dcat:Distribution", "downloadURL": "http://www.fns.usda.gov/sites/default/files/HIP-Final-Summary.pdf", "mediaType": "application/pdf", "title": "Evaluation of the Healthy Incentives Pilot (HIP) Final Report-Summary" } ], "license": "https://creativecommons.org/publicdomain/zero/1.0/", "bureauCode": [ "005:84" ], "dataQuality": true, "rights": "Public", "modified": "2014-09-14", "publisher": { "@type": "org:Organization", "name": "Food and Nutrition Service" }, "keyword": [ "Fruits", "Healthy Incentives Pilot", "Retailers", "SNAP", "Vegetables" ], "spatial": "United States" }, { "identifier": "USDA-FNS-89", "accessLevel": "public", "contactPoint": { "hasEmail": "mailto:ITGB@fns.usda.gov", "@type": "vcard:Contact", "fn": "FNS Datasets" }, "programCode": [ "005:056" ], "description": "This study describes the characteristics, circumstances, and participation and income dynamics of zero-income SNAP households and seeks to assess whether economic and policy changes may have affected this growth.", "title": "Examining the Growth of Zero-Income SNAP Caseload: Characteristics, Circumstances, and Dynamics of Zero-Income SNAP Participants", "distribution": [ { "accessURL": "http://www.fns.usda.gov/sites/default/files/ops/ZeroIncome-Vol1.pdf", "@type": "dcat:Distribution", "format": "PDF", "title": "Examining the Growth of Zero-Income SNAP Caseload: Characteristics, Circumstances, and Dynamics of Zero-Income SNAP Participants" } ], "license": "https://creativecommons.org/publicdomain/zero/1.0/", "bureauCode": [ "005:84" ], "dataQuality": true, "rights": "Public", "modified": "2014-10-15", "publisher": { "@type": "org:Organization", "name": "Food and Nutrition Service" }, "keyword": [ "Food and Nutrition Service", "Households", "Policy Changes", "SNAP", "zero-income" ] }, { "identifier": "USDA-FNS-00002", "accessLevel": "public", "contactPoint": { "hasEmail": "mailto:Mark.Lino@cnpp.usda.gov", "@type": "vcard:Contact", "fn": "Mark Lino" }, "programCode": [ "005:057" ], "description": "Since 1960, the U.S. Department of Agriculture has provided estimates of expenditures on children from birth through age 17. This technical report presents the most recent estimates for married- couple and single-parent families using data from the 2011-15 Consumer Expenditure Survey (all data presented in 2015 dollars). Data and methods used in calculating annual child-rearing expenses are described. Estimates are provided for married-couple and single-parent families with two children for major components of the budget by age of child, family income, and region of residence. For the overall United States, annual child-rearing expense estimates ranged between $12,350 and $13,900 for a child in a two-child, married-couple family in the middle-income group. Adjustment factors for households with less than or greater than two children are also provided. Expenses vary considerably by household income level, region, and composition, emphasizing that a single estimate may not be applicable to all families. Results of this study may be of use in developing State child support and foster care guidelines, as well as public health and family-centered educational programs. \r\ni", "title": "Expenditures on Children by Families, 2015", "distribution": [ { "@type": "dcat:Distribution", "downloadURL": "http://www.cnpp.usda.gov/sites/default/files/expenditures_on_children_by_families/crc2013.pdf", "mediaType": "application/pdf", "title": "PDF File" } ], "license": "https://creativecommons.org/publicdomain/zero/1.0/", "bureauCode": [ "005:84" ], "modified": "2017-03-16", "publisher": { "@type": "org:Organization", "name": "Food and Nutrition Service" }, "accrualPeriodicity": "R/P3M", "keyword": [ "budget", "children", "cost", "expenditures", "families", "household", "husband-wife", "income", "single-parent" ], "spatial": "United States" }, { "identifier": "USDA-FNS-108", "accessLevel": "public", "contactPoint": { "hasEmail": "mailto:webmaster@fns.usda.gov", "@type": "vcard:Contact", "fn": "FNS Webmaster" }, "programCode": [ "005:056" ], "description": "This dataset lists all FNS regional offices as well as contact information for administrator and director's offices.", "title": "FNS Regional Offices", "distribution": [ { "@type": "dcat:Distribution", "downloadURL": "http://www.fns.usda.gov/fns-regional-offices", "format": "html", "description": "Webpage", "mediaType": "text/html", "title": "FNS Regional Offices" } ], "license": "https://creativecommons.org/publicdomain/zero/1.0/", "bureauCode": [ "005:84" ], "dataQuality": true, "modified": "2015-12-30", "publisher": { "@type": "org:Organization", "name": "Food and Nutrition Service" }, "keyword": [ "Administrator", "Directors", "FNS", "Point of Contact", "Regional Offices" ] }, { "identifier": "USDA-FNS-95", "accessLevel": "public", "contactPoint": { "hasEmail": "mailto:webmaster@fns.usda.gov", "@type": "vcard:Contact", "fn": "FNS Webmaster" }, "programCode": [ "005:054" ], "description": "This dataset provides location and contact information for FNS regions.", "title": "FNS Regions", "distribution": [ { "accessURL": "http://www.fns.usda.gov/fns-regional-offices", "@type": "dcat:Distribution", "format": "html", "title": "FNS regional offices" } ], "license": "https://creativecommons.org/publicdomain/zero/1.0/", "bureauCode": [ "005:84" ], "dataQuality": true, "modified": "2015-06-25", "publisher": { "@type": "org:Organization", "name": "Food and Nutrition Service" }, "keyword": [ "FNS", "USDA", "contact info", "locations", "regions" ] }, { "identifier": "USDA-FNS-27", "accessLevel": "public", "contactPoint": { "hasEmail": "mailto:webmaster@fns.usda.gov", "@type": "vcard:Contact", "fn": "FNS Webmaster" }, "programCode": [ "005:056" ], "description": "This manual contains important information for persons in Food and Nutrition Service (FNS) Headquarters, FNS Regional Offices, and Distributing Agencies (DA), which include State Distributing Agencies, and Indian Tribal Organizations that are charged with the responsibility of providing USDA Foods (formerly known as USDA commodities or donated food) to disaster relief organizations in the event of a disaster, emergency, or situation of distress.", "title": "FNS USDA Food Programs Disaster Manual", "distribution": [ { "@type": "dcat:Distribution", "downloadURL": "http://www.fns.usda.gov/sites/default/files/FDDDisasterManual.pdf", "mediaType": "application/pdf", "title": "FNS-USDA Foods Program Disaster Manual" } ], "license": "https://creativecommons.org/publicdomain/zero/1.0/", "bureauCode": [ "005:84" ], "dataQuality": true, "rights": "Public", "modified": "2011-04-01", "publisher": { "@type": "org:Organization", "name": "Food and Nutrition Service" }, "keyword": [ "Disaster", "Distributing Agencies", "Emergency", "FNS", "Indian Tribal", "USDA Food" ], "spatial": "United States" }, { "identifier": "USDA-FNS-81", "accessLevel": "public", "contactPoint": { "hasEmail": "mailto:Tim.Kreh@fns.usda.gov", "@type": "vcard:Contact", "fn": "Tim Kreh" }, "programCode": [ "005:055" ], "description": "This report contains key data regarding the cost of FNS' food assistance programs. The report summarizes data submitted by various reporting agencies for the United States during fiscal year 2013 and fiscal year 2014.", "title": "FNS' Food Assistance Program Cost Information Report", "distribution": [ { "@type": "dcat:Distribution", "downloadURL": "http://www.fns.usda.gov/sites/default/files/datastatistics/Keydata-June-2014.pdf", "format": "PDF", "description": "FNS' Food Assistance Program Cost Information Report", "mediaType": "application/pdf", "title": "FNS' Food Assistance Program Cost Information Report" } ], "license": "https://creativecommons.org/publicdomain/zero/1.0/", "bureauCode": [ "005:84" ], "dataQuality": true, "rights": "Public", "modified": "2014-06-15", "publisher": { "@type": "org:Organization", "name": "Food and Nutrition Service" }, "keyword": [ "Data", "FNS", "Food Assistance Program Cost", "Report" ] }, { "identifier": "USDA-FNS-37", "accessLevel": "public", "contactPoint": { "hasEmail": "mailto:Matthew.Benson@fns.usda.gov", "@type": "vcard:Contact", "fn": "Matthew Benson" }, "programCode": [ "005:054" ], "description": "The Healthy, Hunger-Free Kids Act of 2010 (HHFKA) formally established a Farm to School Program within USDA to improve access to local foods in schools. In order to establish realistic goals with regard to increasing the availability of local foods in schools, in 2013, USDA conducted the first nationwide Farm to School Census (the Census). In 2015, USDA conducted a second Farm to School Census to measure progress towards reaching this goal.", "title": "Farm to School Census", "distribution": [ { "accessURL": "https://farmtoschoolcensus.fns.usda.gov", "@type": "dcat:Distribution", "title": "farm-to-school-census" } ], "license": "https://creativecommons.org/publicdomain/zero/1.0/", "bureauCode": [ "005:84" ], "dataQuality": true, "rights": "Public", "modified": "2016-05-22", "publisher": { "@type": "org:Organization", "name": "Food and Nutrition Service" }, "keyword": [ "Farm to School Census", "USDA", "districts", "school" ], "spatial": "United States" }, { "identifier": "USDA-FNS-94", "accessLevel": "public", "contactPoint": { "hasEmail": "mailto:ITGB@fns.usda.gov", "@type": "vcard:Contact", "fn": "FNS Datasets" }, "programCode": [ "005:054" ], "description": "This dataset allows users to drill-down into the data from the USDA Farm to School Census. Once you’ve conducted your query, you can easily download your results in an excel file.", "title": "Farm to School Census Explorer Tool", "distribution": [ { "accessURL": "https://farmtoschoolcensus.fns.usda.gov/find-your-school-district", "@type": "dcat:Distribution", "format": "xls", "title": "Farm to School Census Explorer Tool" } ], "license": "https://creativecommons.org/publicdomain/zero/1.0/", "bureauCode": [ "005:84" ], "dataQuality": true, "modified": "2014-05-15", "publisher": { "@type": "org:Organization", "name": "Food and Nutrition Service" }, "keyword": [ "Census", "FNS", "Farm to School", "USDA" ] }, { "identifier": "USDA-FNS-96", "accessLevel": "public", "contactPoint": { "hasEmail": "mailto:webmaster@fns.usda.gov", "@type": "vcard:Contact", "fn": "FNS Webmaster" }, "programCode": [ "005:054" ], "description": "This dataset provides contact information for Farms to School for each state.", "title": "Farm to School Contacts", "distribution": [ { "accessURL": "http://www.fns.usda.gov/farmtoschool/farm-school-contacts", "@type": "dcat:Distribution", "format": "html", "title": "Farm to School Contacts" } ], "license": "https://creativecommons.org/publicdomain/zero/1.0/", "bureauCode": [ "005:84" ], "dataQuality": true, "modified": "2015-01-22", "publisher": { "@type": "org:Organization", "name": "Food and Nutrition Service" }, "keyword": [ "Contact Information", "Farms to School", "State" ] }, { "identifier": "USDA-FNS-39", "accessLevel": "public", "contactPoint": { "hasEmail": "mailto:webmaster@fns.usda.gov", "@type": "vcard:Contact", "fn": "FNS Webmaster" }, "programCode": [ "005:056" ], "description": "To encourage Supplemental Nutrition Assistance Program participants to shop at farmers markets, various organizations have been providing financial incentives to participants who redeem SNAP benefits at participating farmers markets. This report is meant to be the first systematic study of the roles different organizations play in designing and implementing SNAP based incentive programs, how they choose markets for their programs, and how they evaluate success of their programs.", "title": "Farmers Market Incentive Provider Study", "distribution": [ { "@type": "dcat:Distribution", "downloadURL": "http://www.fns.usda.gov/sites/default/files/FarmersMarketIncentiveProvider.pdf", "mediaType": "application/pdf", "title": "Farmers Market Incentive Provider Study" } ], "license": "https://creativecommons.org/publicdomain/zero/1.0/", "bureauCode": [ "005:84" ], "dataQuality": true, "rights": "Public", "modified": "2014-03-13", "publisher": { "@type": "org:Organization", "name": "Food and Nutrition Service" }, "keyword": [ "SNAP", "farmers market", "financial", "incentive programs", "report", "success" ], "spatial": "United States" }, { "identifier": "USDA-FNS-138", "accessLevel": "public", "contactPoint": { "hasEmail": "mailto:ITGB@usda.gov", "@type": "vcard:Contact", "fn": "FNS Datasets" }, "programCode": [ "005:056" ], "description": "FNS uses a two-tier system to measure errors in eligibility and benefit determination for SNAP. This feasibility study identifies all processes and components that would be required for a one-tier federal SNAP QC system, including the procedural, staffing, and organizational changes and the technological and data-sharing infrastructures. The study does not make recommendations but documents all the changes needed to move from a two-tier to a one-tier QC system.", "title": "Feasibility of Revising the SNAP Quality Control Review Process", "distribution": [ { "@type": "dcat:Distribution", "downloadURL": "https://fns-prod.azureedge.net/sites/default/files/resource-files/SNAPQC_Feasibility.pdf", "description": "FNS uses a two-tier system to measure errors in eligibility and benefit determination for SNAP. This feasibility study identifies all processes and components that would be required for a one-tier federal SNAP QC system, including the procedural, staffing, and organizational changes and the technological and data-sharing infrastructures. The study does not make recommendations but documents all the changes needed to move from a two-tier to a one-tier QC system.", "mediaType": "application/pdf", "title": "Feasibility of Revising the SNAP Quality Control Review Process" } ], "license": "https://creativecommons.org/publicdomain/zero/1.0/", "bureauCode": [ "005:84" ], "dataQuality": true, "rights": "Public", "modified": "2019-12-29", "publisher": { "@type": "org:Organization", "name": "Food and Nutrition Service" }, "keyword": [ "SNAP", "SNAP QC", "eligibility and benefit" ] }, { "identifier": "USDA-FNS-00008", "accessLevel": "public", "contactPoint": { "hasEmail": "mailto:Tim.Kreh@fns.usda.gov", "@type": "vcard:Contact", "fn": "Tim Kreh" }, "programCode": [ "005:054" ], "description": "The mission of FNS is to provide children and needy families better access to food and a more healthful diet through its food assistance programs and comprehensive nutrition education efforts. These dataset provides a summary of all the FNS School Food Program combined into one dataset. It contains cash payments and commodity costs for the National School Lunch Program, School Breakfast Program and the Special Milk Program. (format: html, xls)", "title": "Federal Cost of School Food Program Data", "distribution": [ { "@type": "dcat:Distribution", "downloadURL": "http://www.fns.usda.gov/sites/default/files/pd/cncost.xls", "mediaType": "application/vnd.ms-excel", "title": "Federal Cost of School Food Program Data" } ], "license": "https://creativecommons.org/publicdomain/zero/1.0/", "bureauCode": [ "005:84" ], "modified": "2014-02-24", "publisher": { "@type": "org:Organization", "name": "Food and Nutrition Service, Department of Agriculture" }, "accrualPeriodicity": "R/P3M", "keyword": [ "Breakfast", "Children", "Federal", "Interactive", "Lunch", "Milk", "National", "Program", "commodity", "diet", "education", "food", "healthful", "needy", "nutrition", "school" ], "spatial": "United States" }, { "identifier": "USDA-FNS-92", "accessLevel": "public", "contactPoint": { "hasEmail": "mailto:Kevin.Russ@fns.usda.gov", "@type": "vcard:Contact", "fn": "Kevin Russ" }, "programCode": [ "005:054" ], "description": "Nutritious free meals are available for children and teens 18 and younger at many locations throughout the nation throughout the summer while school is out of session. This mapping tool helps to find a site near you.", "title": "Find Summer Meals in Your Community", "distribution": [ { "accessURL": "http://www.fns.usda.gov/summerfoodrocks", "@type": "dcat:Distribution", "title": "Find Summer Meals in Your Community" }, { "accessURL": "http://www.fns.usda.gov/summerfoodrocks", "@type": "dcat:Distribution", "format": "API", "title": "Find Summer Meals in Your Community" } ], "license": "https://creativecommons.org/publicdomain/zero/1.0/", "bureauCode": [ "005:84" ], "dataQuality": true, "modified": "2015-06-15", "publisher": { "@type": "org:Organization", "name": "Food and Nutrition Service" }, "keyword": [ "children", "free meals", "map", "school", "summer meals", "teens" ] }, { "identifier": "USDA-FNS-73", "accessLevel": "public", "contactPoint": { "hasEmail": "mailto:ITGB@fns.usda.gov", "@type": "vcard:Contact", "fn": "FNS Datasets" }, "programCode": [ "005:055" ], "description": "This fact sheet describes what FDPIR is, who is eligible for the program, and what foods are available through the program. The fact sheet also provides the number of participants, information about health and nutrition, and resources for supplemental information.", "title": "Food Distribution Program on Indian Reservations Program Fact Sheet", "distribution": [ { "@type": "dcat:Distribution", "downloadURL": "https://www.fns.usda.gov/sites/default/files/fdpir/pfs-fdpir.pdf", "mediaType": "application/pdf", "title": "Food Distribution Program on Indian Reservations Program Fact Sheet" } ], "license": "https://creativecommons.org/publicdomain/zero/1.0/", "bureauCode": [ "005:84" ], "dataQuality": true, "rights": "Public", "modified": "2014-07-14", "publisher": { "@type": "org:Organization", "name": "Food and Nutrition Service" }, "keyword": [ "FDPIR", "Health and Nutrition", "Participants", "Supplemental Information", "foods" ], "spatial": "United States" }, { "identifier": "USDA-FNS-53", "accessLevel": "public", "contactPoint": { "hasEmail": "mailto:ITGB@fns.usda.gov", "@type": "vcard:Contact", "fn": "FNS Datasets" }, "programCode": [ "005:055" ], "description": "Provide Persons participating in Food Distribution Program on Indian Reserves on State level.", "title": "Food Distribution Program on Indian Reservations: Persons Participating", "distribution": [ { "@type": "dcat:Distribution", "downloadURL": "http://www.fns.usda.gov/sites/default/files/pd/21irpart.pdf", "mediaType": "application/pdf", "title": "Food Distribution Program on Indian Reservations: Persons Participating" } ], "license": "https://creativecommons.org/publicdomain/zero/1.0/", "bureauCode": [ "005:84" ], "dataQuality": true, "rights": "Public", "modified": "2014-08-08", "publisher": { "@type": "org:Organization", "name": "Food and Nutrition Service" }, "keyword": [ "FNS", "Food Distribution Program", "Indian Reserves", "Persons Participating", "State Level" ], "spatial": "United States" }, { "identifier": "USDA-FNS-16", "accessLevel": "public", "contactPoint": { "hasEmail": "mailto:Jackie.Haven@fns.usda.gov", "@type": "vcard:Contact", "fn": "Jackie Haven" }, "programCode": [ "005:057" ], "description": "Find the calorie content of any food or beverage using the Food-a-pedia, looking at the Nutrition Facts label, or checking product or restaurant websites", "language": [ "en-US" ], "title": "Food-a-pedia", "distribution": [ { "@type": "dcat:Distribution", "downloadURL": "https://catalog.data.gov/dataset/supertracker-source-code-and-foods-database", "mediaType": "text/html", "title": "Food-a-pedia" } ], "license": "https://creativecommons.org/publicdomain/zero/1.0/", "bureauCode": [ "005:84" ], "dataQuality": true, "rights": "Public", "modified": "2021-11-17", "publisher": { "@type": "org:Organization", "name": "Food and Nutrition Service" }, "keyword": [ "Child Nutrition", "beverage", "calorie", "food", "health", "label" ], "spatial": "United States" }, { "identifier": "USDA-FNS-126", "accessLevel": "public", "contactPoint": { "hasEmail": "mailto:webmaster@fns.usda.gov", "@type": "vcard:Contact", "fn": "FNS Webmaster" }, "programCode": [ "005:056" ], "description": "This handbook specifically focuses on plans for institutions (independent centers and sponsoring organizations) to conduct organized and fiscally responsible operations of the CACFP management plans outline the institution’s policies and procedures for administering and monitoring its own operations and those of its sponsored facilities. Budgets outline the use of CACFP and other funds for meeting Program requirements. FNS recognizes that maintaining a high-quality CACFP requires a commitment to excellence on the part of institutions and caregivers. We applaud the efforts of the many dedicated persons who ensure that the participating children and adults are served wholesome, attractive, and nutritious meals in a sociable environment while meeting the requirements for federal assistance.", "title": "Guidance for Management Plans and Budgets - A Child and Adult Care Food Program Handbook", "distribution": [ { "@type": "dcat:Distribution", "downloadURL": "https://www.fns.usda.gov/sites/default/files/resource-files/CACFP%20Management_PlansHandbook.pdf", "mediaType": "application/pdf", "title": "Guidance for Management Plans and Budgets" } ], "license": "https://creativecommons.org/publicdomain/zero/1.0/", "bureauCode": [ "005:84" ], "modified": "2019-05-03", "publisher": { "@type": "org:Organization", "name": "Food and Nutrition Service" }, "keyword": [ "CACFP", "Child and Adult Care Food Program", "FNS", "Plans and Budgets", "USDA" ] }, { "identifier": "USDA-FNS-93", "accessLevel": "public", "contactPoint": { "hasEmail": "mailto:ITGB@fns.usda.gov", "@type": "vcard:Contact", "fn": "FNS Datasets" }, "programCode": [ "005:054" ], "description": "Schools have the opportunity to become certified as Bronze, Silver, Gold, or Gold of Distinction Schools, depending on meeting certain criteria. We are pleased to share the names of those schools that have achieved certification as a Bronze, Silver, Gold, or Gold of Distinction School.", "title": "HUSSC Award Winning Schools", "distribution": [ { "accessURL": "http://www.fns.usda.gov/hussc/award-winning-schools", "@type": "dcat:Distribution", "description": "HUSSC Award Winning Schools", "title": "HUSSC Award Winning Schools" } ], "license": "https://creativecommons.org/publicdomain/zero/1.0/", "bureauCode": [ "005:84" ], "dataQuality": true, "modified": "2015-06-05", "publisher": { "@type": "org:Organization", "name": "Food and Nutrition Service" }, "keyword": [ "Award", "Distinction", "HUSSC", "Schools" ] }, { "identifier": "USDA-FNS-29", "accessLevel": "public", "contactPoint": { "hasEmail": "mailto:webmaster@fns.usda.gov", "@type": "vcard:Contact", "fn": "FNS Webmaster" }, "programCode": [ "005:056" ], "description": "Healthy Access Locator map can be used to view schools that have received a Healthier US Schools Challenge Award (HUSSC). To get started, click on Search Awards and enter your search criteria. When the information displays on the map, you can click a star for additional details or see a summary of your results below the map. You can also use the Data Layers feature to display different data layers on obesity and diabetes prevalence, SNAP Participation Rates, and SNAP Outreach Plans by states. (HUSSC Awards as of May 30, 2013).", "title": "Healthy Access Locator", "distribution": [ { "@type": "dcat:Distribution", "downloadURL": "http://www.fns.usda.gov/healthy-access-locator", "mediaType": "text/html", "title": "Healthy Access Locator" } ], "license": "https://creativecommons.org/publicdomain/zero/1.0/", "bureauCode": [ "005:84" ], "dataQuality": true, "rights": "Public", "modified": "2013-08-11", "publisher": { "@type": "org:Organization", "name": "Food and Nutrition Service" }, "keyword": [ "SNAP", "diabetes", "health", "map", "obesity", "rates" ], "spatial": "United States" }, { "identifier": "USDA-FNS-78", "accessLevel": "public", "contactPoint": { "hasEmail": "mailto:ITGB@fns.usda.gov", "@type": "vcard:Contact", "fn": "FNS Datasets" }, "programCode": [ "005:054" ], "description": "This memorandum provides information and guidance to State agencies and School Food Authorities (SFAs) on the current status of the domestic beef market. Despite an increase in wholesale prices for ground beef, the USDA is continually encouraging schools to purchase and use beef in their menus as a good source of lean protein. The USDA is also offering guidance on ways that schools can ensure the resources needed to provide students with healthy, balanced meals.", "title": "Information and Guidance on the Domestic Beef Market", "distribution": [ { "@type": "dcat:Distribution", "downloadURL": "http://www.fns.usda.gov/sites/default/files/fdd/SP66-2014s.pdf", "format": "PDF", "description": "Information and Guidance on the Domestic Beef Market", "mediaType": "application/pdf", "title": "Information and Guidance on the Domestic Beef Market" } ], "license": "https://creativecommons.org/publicdomain/zero/1.0/", "bureauCode": [ "005:84" ], "dataQuality": true, "rights": "Public", "modified": "2014-09-22", "publisher": { "@type": "org:Organization", "name": "Food and Nutrition Service" }, "keyword": [ "Beef Market", "FNS", "Memo", "Prices", "School Food Authorities", "State Agencies" ] }, { "identifier": "USDA-FNS-120", "accessLevel": "public", "contactPoint": { "hasEmail": "mailto:ITGB@fns.usda.gov", "@type": "vcard:Contact", "fn": "FNS Datasets" }, "programCode": [ "005:054" ], "description": "Engage school staff and parents in school wellness using these ready-to-go communication tools. Sharing news about your Local School Wellness Policy is easy with these flyers, presentations, newsletter articles, and social media posts. Your school can personalize them to make them specific to your Local School Wellness Policy activities.", "title": "Local School Wellness Policy Outreach Toolkit", "distribution": [ { "accessURL": "http://www.fns.usda.gov/tn/local-school-wellness-policy-outreach-toolkit", "@type": "dcat:Distribution", "format": "html", "title": "Local School Wellness Policy Outreach Toolkit" } ], "license": "https://creativecommons.org/publicdomain/zero/1.0/", "bureauCode": [ "005:84" ], "dataQuality": true, "modified": "2016-11-21", "publisher": { "@type": "org:Organization", "name": "Food and Nutrition Service" }, "keyword": [ "FNS", "School", "School Staff", "Tools", "USDA" ] }, { "identifier": "USDA-FNS-42", "accessLevel": "public", "contactPoint": { "hasEmail": "mailto:webmaster@fns.usda.gov", "@type": "vcard:Contact", "fn": "FNS Webmaster" }, "programCode": [ "005:056" ], "description": "SNAP is designed to reduce food insecurity – reduced food intake or disrupted eating patterns in a household due to lack of money or other resources – but data quantifying this effect is limited. The objectives of this study were to: Assess how food security and food expenditures vary with SNAP participation. Examine how relationships between SNAP and food security and between SNAP and food expenditures vary by household characteristics and circumstances. Estimating the effect of SNAP on food insecurity using household survey data is challenging because households that choose to participate in SNAP can differ in systematic ways from households that do not participate, making it hard to distinguish the impact of SNAP from these other factors. This study sought to control for the SNAP participation “selection bias” by comparing information collected from households within days of entering the program (new entrants) to information obtained after about 6 months of participation.", "title": "Measuring the Effect of SNAP Participation on Food Security", "distribution": [ { "@type": "dcat:Distribution", "downloadURL": "http://www.fns.usda.gov/sites/default/files/Measuring2013.pdf", "mediaType": "application/pdf", "title": "Measuring the Effect of SNAP Participation on Food Security" } ], "license": "https://creativecommons.org/publicdomain/zero/1.0/", "bureauCode": [ "005:84" ], "dataQuality": true, "rights": "Public", "modified": "2013-08-16", "publisher": { "@type": "org:Organization", "name": "Food and Nutrition Service" }, "keyword": [ "FNS", "Food security", "SNAP", "household" ], "spatial": "United States" }, { "identifier": "USDA-FNS-64", "accessLevel": "public", "contactPoint": { "hasEmail": "mailto:ITGB@fns.usda.gov", "@type": "vcard:Contact", "fn": "FNS Datasets" }, "programCode": [ "005:056" ], "description": "My Cookbook is an online tool that helps you compile your favorite recipes in one central place and search SNAP, household, and quantity recipes. You can also submit personal recipes to the repository and browse submitted cookbooks. My Cookbook also provides USDA Foods Fact Sheets.", "title": "My Cookbook", "distribution": [ { "@type": "dcat:Distribution", "downloadURL": "http://www.whatscooking.fns.usda.gov/cookbook", "mediaType": "text/html", "title": "My Cookbook" } ], "license": "https://creativecommons.org/publicdomain/zero/1.0/", "bureauCode": [ "005:84" ], "dataQuality": true, "rights": "Public", "modified": "2014-08-08", "publisher": { "@type": "org:Organization", "name": "Food and Nutrition Service" }, "keyword": [ "Cookbook", "FNS", "Household", "Recipes", "SNAP", "USDA", "food" ], "spatial": "United States" }, { "identifier": "USDA-FNS-00001", "accessLevel": "public", "contactPoint": { "hasEmail": "mailto:angela.leone@fns.usda.gov", "@type": "vcard:Contact", "fn": "Angela Leone" }, "programCode": [ "005:057" ], "description": "MyPyramid Food Data provides information on the total calories; calories from solid fats, added sugars, and alcohol (extras); MyPyramid food group and subgroup amounts; and saturated fat content of over 1,000 commonly eaten foods with corresponding commonly used portion amounts. This information is key to help consumers meet the recommendations of the Dietary Guidelines for Americans and manage their weight by understanding how many calories are consumed from \"extras.\" CNPP has created an interactive tool from this data set available on the web at MyFood-a-pedia.gov. A mobile version is coming soon to provide consumers with assistance on-the-go.", "title": "MyPyramid Food Raw Data", "distribution": [ { "@type": "dcat:Distribution", "downloadURL": "https://inventory.data.gov/dataset/794cd3d7-4d28-4408-8f7d-84b820dbf7f2/resource/6b78ec0c-4980-4ad8-9cbd-2d6eb9eda8e7/download/myfoodapediadata.zip", "format": "zip", "mediaType": "application/zip", "title": "MyPyramid Food Raw Data" } ], "license": "https://creativecommons.org/licenses/by/4.0", "bureauCode": [ "005:84" ], "modified": "2014-12-23", "publisher": { "@type": "org:Organization", "name": "Food and Nutrition Service, Department of Agriculture" }, "keyword": [ "Calories", "Fat", "Food", "Nutrients", "Nutrition", "health" ], "spatial": "United States" }, { "identifier": "USDA-FNS-00010", "accessLevel": "public", "contactPoint": { "hasEmail": "mailto:Tim.Kreh@fns.usda.gov", "@type": "vcard:Contact", "fn": "Tim Kreh" }, "programCode": [ "005:054" ], "description": "The National School Lunch Program (NSLP) is a federally assisted meal program operating in public and nonprofit private schools and residential child care institutions. It provides nutritionally balanced, low-cost or free lunches to children each school day. Information in this dataset consists of participation and lunches served.", "title": "National School Lunch Assistance Program Participation and Meals Served Data", "distribution": [ { "@type": "dcat:Distribution", "downloadURL": "https://www.fns.usda.gov/sites/default/files/resource-files/currentsum-7.xls", "mediaType": "application/vnd.ms-excel", "title": "National School Lunch Assistance Program Participation and Meals Served Data" } ], "license": "https://creativecommons.org/publicdomain/zero/1.0/", "bureauCode": [ "005:84" ], "modified": "2014-02-24", "publisher": { "@type": "org:Organization", "name": "Food and Nutrition Service, Department of Agriculture" }, "accrualPeriodicity": "R/P3M", "keyword": [ "Child", "Free", "Lunch", "Meal", "National", "Program", "School", "States" ], "spatial": "United States" }, { "identifier": "USDA-FNS-71", "accessLevel": "public", "contactPoint": { "hasEmail": "mailto:ITGB@fns.usda.gov", "@type": "vcard:Contact", "fn": "FNS Datasets" }, "programCode": [ "005:054" ], "description": "This study describes current methods of direct certification used by State and local agencies and the challenges that State and local education agencies face in attaining high matching rates. The study presents the analysis of unmatched records in order to provide a better understanding of the categorically eligible children who are not matched in the direct certification process and identifies potential matching process improvements that might increase the number of matched children.", "title": "National School Lunch Program Direct Certification Improvement Study", "distribution": [ { "@type": "dcat:Distribution", "downloadURL": "http://www.fns.usda.gov/sites/default/files/ops/NSLPDirectCertificationImprovement.pdf", "mediaType": "application/pdf", "title": "National School Lunch Program Direct Certification Improvement Study" } ], "license": "https://creativecommons.org/publicdomain/zero/1.0/", "bureauCode": [ "005:84" ], "dataQuality": true, "rights": "Public", "modified": "2014-08-17", "publisher": { "@type": "org:Organization", "name": "Food and Nutrition Service" }, "keyword": [ "Children", "Direct Certification", "FNS", "Local Agencies", "State" ], "spatial": "United States" }, { "identifier": "USDA-FNS-102", "accessLevel": "public", "contactPoint": { "hasEmail": "mailto:Tim.Kreh@fns.usda.gov", "@type": "vcard:Contact", "fn": "Tim Kreh" }, "programCode": [ "005:054" ], "description": "This dataset provides the monthly data for National School Lunch Program.", "title": "National School Lunch Program Monthly Data", "distribution": [ { "accessURL": "http://www.fns.usda.gov/sites/default/files/pd/36slmonthly.pdf", "@type": "dcat:Distribution", "title": "National School Lunch Program Monthly Data" } ], "license": "https://creativecommons.org/publicdomain/zero/1.0/", "bureauCode": [ "005:84" ], "dataQuality": true, "modified": "2015-11-06", "publisher": { "@type": "org:Organization", "subOrganizationOf": { "@type": "org:Organization", "name": "Department of Agriculture" }, "name": "Food and Nutrition Service" }, "keyword": [ "FNS", "Monthly Data", "National School Lunch Program", "USDA" ] }, { "identifier": "USDA-FNS-33", "accessLevel": "public", "contactPoint": { "hasEmail": "mailto:webmaster@fns.usda.gov", "@type": "vcard:Contact", "fn": "FNS Webmaster" }, "programCode": [ "005:056" ], "description": "This report responds to the requirement of Public Law 110-246 to assess the effectiveness of State and local efforts to directly certify children for free school meals. Direct certification is a process conducted by the States and by local educational agencies (LEAs) to certify eligible children for free meals without the need for household applications. States and LEAs directly certified 12.3 million children at the start of SY 2012-2013, an increase of 740,000, or 6 percent, from the previous school year. Over the same period, the population of school-age SNAP participant children increased by just 1.5 percent. As a result, the share of SNAP participant children certified for free school meals without application increased to 89 percent in SY 2012-2013, up from 86 percent in SY 2011-2012.", "title": "National School Lunch Program: State Implementation Progress, School Year 2012–2013: Report to Congress", "distribution": [ { "@type": "dcat:Distribution", "downloadURL": "http://www.fns.usda.gov/direct-certification-national-school-lunch-program-state-implementation-progress-school-year-2012", "mediaType": "text/html", "title": "National School Lunch Program: State Implementation Progress, School Year 2012–2013: Report to Congress" } ], "license": "https://creativecommons.org/publicdomain/zero/1.0/", "bureauCode": [ "005:84" ], "dataQuality": true, "rights": "Public", "modified": "2013-06-12", "publisher": { "@type": "org:Organization", "name": "Food and Nutrition Service" }, "keyword": [ "Children", "SNAP", "States", "free meals", "school" ], "spatial": "United States" }, { "identifier": "USDA-FNS-47", "accessLevel": "public", "contactPoint": { "hasEmail": "mailto:webmaster@fns.usda.gov", "@type": "vcard:Contact", "fn": "FNS Webmaster" }, "programCode": [ "005:054" ], "description": "This report offers updated estimates of the number of people eligible for WIC benefits in 2011, including (1) estimates by participant category (including children by single year of age) and coverage rates; (2) updated estimates in U.S. territories; and (3) confidence intervals. The national estimates presented in this report are based on a methodology developed in 2003 by the Committee on National Statistics of the National Research Council (CNSTAT). The report’s State-level estimates use a methodology developed by the Urban Institute that apportions the national figures using data from the American Community Survey", "title": "National and State Level Estimates of Special SNP for WIC Eligibles and Program Reach", "distribution": [ { "@type": "dcat:Distribution", "downloadURL": "http://www.fns.usda.gov/sites/default/files/WICEligibles2011Volume1.pdf", "mediaType": "application/pdf", "title": "National and State-Level Estimates of Special Supplemental Nutrition Program for Women, Infants, and Children (WIC) Eligibles and Program Reach, 2011" } ], "license": "https://creativecommons.org/publicdomain/zero/1.0/", "bureauCode": [ "005:84" ], "dataQuality": true, "rights": "Public", "modified": "2014-03-15", "publisher": { "@type": "org:Organization", "name": "Food and Nutrition Service" }, "keyword": [ "FNS", "WIC", "children", "infant", "women" ], "spatial": "United States" }, { "identifier": "USDA-FNS-75", "accessLevel": "public", "contactPoint": { "hasEmail": "mailto:Kevin.Russ@fns.usda.gov", "@type": "vcard:Contact", "fn": "Kevin Russ" }, "programCode": [ "005:054" ], "description": "This memorandum provides information on the release of the new form used to report the results of the second review of free and reduced price applications in the National School Lunch Program (NSLP) and School Breakfast Program (SBP).", "title": "New Local Educational Agency Second Review of Applications Report", "distribution": [ { "@type": "dcat:Distribution", "downloadURL": "http://www.fns.usda.gov/sites/default/files/SP62-2014os.pdf", "mediaType": "application/pdf", "title": "New Local Educational Agency Second Review of Applications Report" } ], "license": "https://creativecommons.org/publicdomain/zero/1.0/", "bureauCode": [ "005:84" ], "dataQuality": true, "rights": "Public", "modified": "2014-09-08", "publisher": { "@type": "org:Organization", "name": "Food and Nutrition Service" }, "keyword": [ "FNS", "NSLP", "SBP" ], "spatial": "United States" }, { "identifier": "USDA-FNS-115", "accessLevel": "public", "contactPoint": { "hasEmail": "mailto:webmaster@fns.usda.gov", "@type": "vcard:Contact", "fn": "FNS Datasets" }, "programCode": [ "005:055" ], "description": "The data presented in this dataset is invaluable for monitoring the potential of the food supply to meet nutritional needs; for examining relationships between food supply nutrients and health; and for examining dietary trends of Americans. Additionally, food supply nutrient estimates reflect Federal enrichment and fortification standards and technological advances in the food industry and contribute to the Federal dietary guidance system. As such, these data are of interest to agricultural policymakers, economists, nutrition researchers, and nutrition and public health educators. Data are provided for the following nutrients and their food sources from the major food groups.", "title": "Nutrient Content of the U.S. Food Supply, 1909-2010", "distribution": [ { "accessURL": "http://www.cnpp.usda.gov/USFoodSupply-1909-2010", "@type": "dcat:Distribution", "format": "html", "title": "Nutrient Content of the U.S. Food Supply, 1909-2010" } ], "license": "https://creativecommons.org/publicdomain/zero/1.0/", "bureauCode": [ "005:84" ], "dataQuality": false, "modified": "2014-05-21", "publisher": { "@type": "org:Organization", "name": "Food and Nutrition Service" }, "keyword": [ "CNPP", "Nutrient", "dietary guidance", "economist", "health", "health educator" ] }, { "identifier": "USDA-FNS-82", "accessLevel": "public", "contactPoint": { "hasEmail": "mailto:ITGB@fns.usda.gov", "@type": "vcard:Contact", "fn": "FNS Datasets" }, "programCode": [ "005:055" ], "description": "Through its food distribution programs, USDA purchases a variety of food including fruits, vegetables, meat, grains, and dairy products to be distributed directly to needy households or for use in congregate feeding programs that help Americans obtain access to nutritious food and support American agriculture. This report contains nutrient and food group analyses of the USDA Food distributed through NSLP, CACFP, CSFP, FDPIR, and TEFAP in fiscal year 2009.", "title": "Nutrient and MyPyramid Analysis of USDA Foods in Five of Its Food and Nutrition Programs", "distribution": [ { "@type": "dcat:Distribution", "downloadURL": "http://www.fns.usda.gov/sites/default/files/NutrientMyPyramid.pdf", "format": "PDF", "description": "Nutrient and MyPyramid Analysis of USDA Foods in Five of Its Food and Nutrition Programs", "mediaType": "application/pdf", "title": "Nutrient and MyPyramid Analysis of USDA Foods in Five of Its Food and Nutrition Programs" } ], "license": "https://creativecommons.org/publicdomain/zero/1.0/", "bureauCode": [ "005:84" ], "dataQuality": true, "rights": "Public", "modified": "2012-01-15", "publisher": { "@type": "org:Organization", "name": "Food and Nutrition Service" }, "keyword": [ "CACFP", "CSFP", "FDPIR", "FNS", "Food Distribution Programs", "NSLP", "USDA" ] }, { "identifier": "USDA-FNS-121", "accessLevel": "public", "contactPoint": { "hasEmail": "mailto:ITGB@fns.usda.gov", "@type": "vcard:Contact", "fn": "FNS Datasets" }, "programCode": [ "005:056" ], "description": "This dataset provide data and research regarding USDA Nutrition Assistance programs.", "title": "Nutrition Assistance Programs Keydata", "distribution": [ { "accessURL": "https://www.fns.usda.gov/data-and-statistics", "@type": "dcat:Distribution", "format": "pdf", "title": "Nutrition Assistance Programs Keydata" } ], "license": "https://creativecommons.org/publicdomain/zero/1.0/", "bureauCode": [ "005:84" ], "dataQuality": true, "modified": "2017-05-05", "publisher": { "@type": "org:Organization", "name": "Food and Nutrition Service" }, "keyword": [ "FNS", "FNS cost", "Food and Nutrition Service", "National School Lunch Program", "School Breakfast Program", "Special Milk Program", "USDA" ] }, { "identifier": "USDA-FNS-80", "accessLevel": "public", "contactPoint": { "hasEmail": "mailto:Tim.Kreh@fns.usda.gov", "@type": "vcard:Contact", "fn": "Tim Kreh" }, "programCode": [ "005:055" ], "description": "This report provides data regarding the nutrition assistance programs performance report for August 2014. The report reflects the participation of persons in FNS' programs.", "title": "Nutrition Assistance Programs Performance Report", "distribution": [ { "@type": "dcat:Distribution", "downloadURL": "http://www.fns.usda.gov/sites/default/files/datastatistics/June-Performance-Report-2014.pdf", "format": "PDF", "description": "Nutrition Assistance Programs Performance Report", "mediaType": "application/pdf", "title": "Nutrition Assistance Programs Performance Report" } ], "license": "https://creativecommons.org/publicdomain/zero/1.0/", "bureauCode": [ "005:84" ], "dataQuality": true, "rights": "Public", "modified": "2014-09-05", "publisher": { "@type": "org:Organization", "name": "Food and Nutrition Service" }, "keyword": [ "FNS", "FNS Programs", "Nutrition Assistance Performance Report", "Participation" ] }, { "identifier": "USDA-FNS-88", "accessLevel": "public", "contactPoint": { "hasEmail": "mailto:ITGB@fns.usda.gov", "@type": "vcard:Contact", "fn": "FNS Datasets" }, "programCode": [ "005:056" ], "description": "This study was undertaken to understand why some SNAP participants shop at farmers markets and others in the same geographic area do not. Results suggest that SNAP participants buy most of their fresh fruits and vegetables at farmers markets. Of those who shop at farmers markets, overall value including quality and price are major reasons for shopping at markets. Of those who do not, reasons for not shopping at farmers markets centered on convenience.", "title": "Nutrition Assistance in Farmers Markets: Understanding the Shopping Patterns of SNAP Participants", "distribution": [ { "accessURL": "http://www.fns.usda.gov/sites/default/files/FarmersMarkets-Shopping-Patterns.pdf", "@type": "dcat:Distribution", "format": "PDF", "title": "Nutrition Assistance in Farmers Markets: Understanding the Shopping Patterns of SNAP Participants" } ], "license": "https://creativecommons.org/publicdomain/zero/1.0/", "bureauCode": [ "005:84" ], "dataQuality": true, "rights": "Public", "modified": "2014-10-24", "publisher": { "@type": "org:Organization", "name": "Food and Nutrition Service" }, "keyword": [ "Farmers Markets", "Food and Nutrition Service", "Fruits and Vegetables", "SNAP", "Shopping" ] }, { "identifier": "USDA-FNS-65", "accessLevel": "public", "contactPoint": { "hasEmail": "mailto:ITGB@fns.usda.gov", "@type": "vcard:Contact", "fn": "FNS Datasets" }, "programCode": [ "005:057" ], "description": "The Food Plans represent a nutritious diet at four different cost levels: thrifty plan, low-cost plan, moderate-cost plan, and a liberal plan. The report is based on the costs of home-prepared meals and snacks.", "title": "Official USDA Food Plans: Cost of Food at Home at Four Levels, U.S. Average, July 2014", "distribution": [ { "@type": "dcat:Distribution", "downloadURL": "http://www.cnpp.usda.gov/sites/default/files/usda_food_plans_cost_of_food/CostofFoodJul2014.pdf", "mediaType": "application/pdf", "title": "Official USDA Food Plans: Cost of Food at Home at Four Levels, U.S. Average, July 2014" } ], "license": "https://creativecommons.org/publicdomain/zero/1.0/", "bureauCode": [ "005:84" ], "dataQuality": true, "rights": "Public", "modified": "2014-08-17", "publisher": { "@type": "org:Organization", "name": "Food and Nutrition Service" }, "keyword": [ "Diet", "Food Plans", "Liberal Plan", "Low-Cost Plan", "Meals", "Moderate-Cost-Plan", "Nutritious", "Snacks", "Thrifty Plan" ], "spatial": "United States" }, { "identifier": "USDA-FNS-97", "accessLevel": "public", "contactPoint": { "hasEmail": "mailto:Tim.Kreh@fns.usda.gov", "@type": "vcard:Contact", "fn": "Tim Kreh" }, "programCode": [ "005:056" ], "description": "This dataset provides National & State Monthly/Annual Data from Fiscal Year 1969 to Current Year for SNAP Participation and Benefits.", "title": "Participation and Benefits - National & State Monthly /Annual Data", "distribution": [ { "accessURL": "http://www.fns.usda.gov/sites/default/files/pd/SNAPZip69throughCurrent.zip", "@type": "dcat:Distribution", "title": "Participation and Benefits - National & State Monthly /Annual Data" } ], "license": "https://creativecommons.org/publicdomain/zero/1.0/", "bureauCode": [ "005:84" ], "dataQuality": true, "modified": "2015-11-09", "publisher": { "@type": "org:Organization", "subOrganizationOf": { "@type": "org:Organization", "name": "Department of Agriculture" }, "name": "Food and Nutrition Service" }, "keyword": [ "Benefits", "FNS", "National and State data", "Participation", "SNAP", "USDA" ] }, { "identifier": "USDA-FNS-79", "accessLevel": "public", "contactPoint": { "hasEmail": "mailto:ITGB@fns.usda.gov", "@type": "vcard:Contact", "fn": "FNS Datasets" }, "programCode": [ "005:055" ], "description": "This memorandum provides revised policy guidance on certification periods pertaining to zero income households in FDPIR. The revised policy for zero income households provides for certification staff to continue to question and document households that report zero income. The certification periods have been revised to allow for longer certification periods, if the zero income household is verified to be stable with regard to lack of income.", "title": "Policy on Certification Periods for Zero Income Households", "distribution": [ { "@type": "dcat:Distribution", "downloadURL": "http://www.fns.usda.gov/sites/default/files/pmfd135_Revised_PolicyonCertificationPeriodsforZeroIncomeHouseholds.pdf", "format": "PDF", "description": "Policy on Certification Periods for Zero Income Households", "mediaType": "application/pdf", "title": "Policy on Certification Periods for Zero Income Households" } ], "license": "https://creativecommons.org/publicdomain/zero/1.0/", "bureauCode": [ "005:84" ], "dataQuality": true, "rights": "Public", "modified": "2014-05-13", "publisher": { "@type": "org:Organization", "name": "Food and Nutrition Service" }, "keyword": [ "Certification Period", "FDPIR", "FNS", "Income", "Policy", "Zero Income housefold" ] }, { "identifier": "USDA-FNS-18", "accessLevel": "public", "contactPoint": { "hasEmail": "mailto:webmaster@fns.usda.gov", "@type": "vcard:Contact", "fn": "FNS Webmaster" }, "programCode": [ "005:056" ], "description": "Improving stewardship of Federal money by reducing recipient fraud, reducing retailer fraud, ensuring accurate eligibility determinations, and reducing improper payments.\r\nClick on any state to Report Nutrition Assistance Fraud in that location.", "title": "Program Integrity for Nutrition Assistance Programs", "distribution": [ { "@type": "dcat:Distribution", "downloadURL": "http://www.fns.usda.gov/program-integrity", "mediaType": "text/html", "title": "Program Integrity for Nutrition Assistance Programs" } ], "license": "https://creativecommons.org/publicdomain/zero/1.0/", "bureauCode": [ "005:84" ], "rights": "Public", "modified": "2014-07-25", "publisher": { "@type": "org:Organization", "name": "Food and Nutrition Service" }, "keyword": [ "Federal", "civil money penalties", "fraud", "retailer" ], "spatial": "United States" }, { "identifier": "USDA-FNS-122", "accessLevel": "public", "contactPoint": { "hasEmail": "mailto:ITGB@fns.usda.gov", "@type": "vcard:Contact", "fn": "FNS Datasets" }, "programCode": [ "005:056" ], "description": "This report – part of an annual series – presents estimates of the percentage of eligible persons, by State, who participated in the U.S. Department of Agriculture’s Supplemental Nutrition Assistance Program (SNAP) during an average month in fiscal year (FY) 2014 and in the two previous fiscal years. This report also presents estimates of State participation rates for eligible “working poor” individuals (persons in households with earnings) over the same period.", "title": "Reaching Those in Need: Estimates of State SNAP Participation Rates in 2014", "distribution": [ { "@type": "dcat:Distribution", "downloadURL": "https://fns-prod.azureedge.net/sites/default/files/ops/Reaching2014.pdf", "format": "pdf", "mediaType": "application/pdf", "title": "Reaching Those in Need: Estimates of State Supplemental Nutrition Assistance Program Participation Rates in 2014" } ], "license": "https://creativecommons.org/publicdomain/zero/1.0/", "bureauCode": [ "005:84" ], "dataQuality": true, "modified": "2017-01-19", "publisher": { "@type": "org:Organization", "name": "Food and Nutrition Service" }, "keyword": [ "FNS", "FY2014", "SNAP", "USDA" ] }, { "identifier": "USDA-FNS-43", "accessLevel": "public", "contactPoint": { "hasEmail": "mailto:webmaster@fns.usda.gov", "@type": "vcard:Contact", "fn": "FNS Webmaster" }, "programCode": [ "005:056" ], "description": "This brochure provides a graphical representation of State SNAP participation rates for 2011.", "title": "Reaching Those in Need: State SNAP Participation Rates for 2011", "distribution": [ { "@type": "dcat:Distribution", "downloadURL": "http://www.fns.usda.gov/sites/default/files/Reaching2011.pdf", "mediaType": "application/pdf", "title": "Reaching Those in Need: SNAP Participation Rates for 2011" } ], "license": "https://creativecommons.org/publicdomain/zero/1.0/", "bureauCode": [ "005:84" ], "dataQuality": true, "rights": "Public", "modified": "2014-02-12", "publisher": { "@type": "org:Organization", "name": "Food and Nutrition Service" }, "keyword": [ "FNS", "Participation Rates", "SNAP", "State" ] }, { "identifier": "USDA-FNS-77", "accessLevel": "public", "contactPoint": { "hasEmail": "mailto:ITGB@fns.usda.gov", "@type": "vcard:Contact", "fn": "FNS Datasets" }, "programCode": [ "005:054" ], "description": "This study is a summarization of the national estimates of administrative error in eligibility determinations and benefits issuance for free or reduced-price school meals.", "title": "Regional Office Review of Applications (RORA) for School Meals 2013", "distribution": [ { "@type": "dcat:Distribution", "downloadURL": "http://www.fns.usda.gov/sites/default/files/ops/RORA2013.pdf", "mediaType": "application/pdf", "title": "Regional Office Review of Applications (RORA) for School Meals 2013" } ], "license": "https://creativecommons.org/publicdomain/zero/1.0/", "bureauCode": [ "005:84" ], "dataQuality": true, "rights": "Public", "modified": "2014-08-17", "publisher": { "@type": "org:Organization", "name": "Food and Nutrition Service" }, "keyword": [ "FNS", "Meals", "School", "benefits", "eligibility" ], "spatial": "United States" }, { "identifier": "USDA-FNS-60", "accessLevel": "public", "contactPoint": { "hasEmail": "mailto:chanchalat.chanhatasilpa@fns.usda.gov", "@type": "vcard:Contact", "fn": "Chan Chanhatasilpa" }, "programCode": [ "005:055" ], "description": "This Congressional report summarizes the implementation and evaluation of two approaches tested in the summers of 2011 through 2013. Summer EBT for Children (SEBTC) uses existing electronic benefits transfer systems to provide household benefits for children. The Enhanced Summer Food Service Program (eSFSP) tests several changes to the traditional program, including incentives to extend operating periods, incentives to add enrichment activities, meal delivery for children in rural areas, and weekend and holiday backpacks.", "title": "Report on the Summer Food for Children Demonstration Projects for Fiscal Year 2013", "distribution": [ { "@type": "dcat:Distribution", "downloadURL": "http://www.fns.usda.gov/sites/default/files/SEBTC_2013.pdf", "mediaType": "application/pdf", "title": "Report on the Summer Food for Children Demonstration Projects for Fiscal Year 2013" } ], "license": "https://creativecommons.org/publicdomain/zero/1.0/", "bureauCode": [ "005:84" ], "dataQuality": true, "rights": "Public", "modified": "2013-12-21", "publisher": { "@type": "org:Organization", "name": "Food and Nutrition Service" }, "keyword": [ "EBT", "FNS", "children", "eSFSP", "electronic benefits", "household benefits", "rural areas" ], "spatial": "United States" }, { "identifier": "USDA-FNS-76", "accessLevel": "public", "contactPoint": { "hasEmail": "mailto:ITGB@fns.usda.gov", "@type": "vcard:Contact", "fn": "FNS Datasets" }, "programCode": [ "005:056" ], "description": "This webpage provides reports for SNAP activity, error rates and quality control.", "title": "SNAP Activity Report, Error Rates and Quality Control", "distribution": [ { "accessURL": "http://www.fns.usda.gov/pd/snap-state-activity-reports", "@type": "dcat:Distribution", "title": "SNAP Activity Reports" }, { "accessURL": "http://www.fns.usda.gov/pd/snap-quality-control-error-rates", "@type": "dcat:Distribution", "title": "SNAP Quality Control Error Rates" }, { "accessURL": "http://www.fns.usda.gov/pd/snap-quality-control-annual-reports", "@type": "dcat:Distribution", "title": "SNAP Quality Control Annual Reports" } ], "license": "https://creativecommons.org/publicdomain/zero/1.0/", "bureauCode": [ "005:84" ], "rights": "Public", "modified": "2014-07-25", "publisher": { "@type": "org:Organization", "name": "Food and Nutrition Service" }, "keyword": [ "ADA Status Reports", "Activity", "Cotton Quality", "Error", "Rates", "SNAP" ], "spatial": "United States" }, { "identifier": "USDA-FNS-101", "accessLevel": "public", "contactPoint": { "hasEmail": "mailto:Tim.Kreh@fns.usda.gov", "@type": "vcard:Contact", "fn": "Tim Kreh" }, "programCode": [ "005:056" ], "description": "This dataset provides the Supplemental Nutrition Assistance Program (SNAP) benefits costs for each state.", "title": "SNAP Benefits Costs - Latest Available Month", "distribution": [ { "accessURL": "http://www.fns.usda.gov/sites/default/files/pd/31SNAPcurrBEN$.pdf", "@type": "dcat:Distribution", "title": "SNAP Benefits Costs - Latest Available Month" } ], "license": "https://creativecommons.org/publicdomain/zero/1.0/", "bureauCode": [ "005:84" ], "dataQuality": true, "modified": "2015-11-06", "publisher": { "@type": "org:Organization", "subOrganizationOf": { "@type": "org:Organization", "name": "Department of Agriculture" }, "name": "Food and Nutrition Service" }, "keyword": [ "Cost", "SNAP", "benefits", "state" ] }, { "identifier": "USDA-FNS-17", "accessLevel": "public", "contactPoint": { "hasEmail": "mailto:oaneweb@fns.usda.gov", "@type": "vcard:Contact", "fn": "FNS datasets" }, "programCode": [ "005:056" ], "description": "Data about communities and SNAP households. Click on a State to find data by congressional district.", "title": "SNAP Community Characteristics", "distribution": [ { "accessURL": "http://www.fns.usda.gov/ops/snap-community-characteristics", "@type": "dcat:Distribution", "format": "PDF", "title": "SNAP Community Characteristics" } ], "license": "https://creativecommons.org/publicdomain/zero/1.0/", "bureauCode": [ "005:84" ], "dataQuality": true, "rights": "Public", "modified": "2015-03-19", "publisher": { "@type": "org:Organization", "name": "Food and Nutrition Service" }, "keyword": [ "SNAP", "and household relationships", "data" ], "spatial": "United States" }, { "identifier": "USDA-FNS-20", "accessLevel": "public", "contactPoint": { "hasEmail": "mailto:webmaster@fns.usda.gov", "@type": "vcard:Contact", "fn": "FNS Webmaster" }, "programCode": [ "005:056" ], "description": "This data set provides resources for state employment and training throughout United States.", "title": "SNAP Employment and Training Resources", "distribution": [ { "@type": "dcat:Distribution", "downloadURL": "http://www.fns.usda.gov/state-employment-and-training-resources", "mediaType": "text/html", "title": "SNAP Employment and Training Resources" } ], "license": "https://creativecommons.org/publicdomain/zero/1.0/", "bureauCode": [ "005:84" ], "rights": "Public", "modified": "2014-05-22", "publisher": { "@type": "org:Organization", "name": "Food and Nutrition Service" }, "keyword": [ "employment", "state", "training" ], "spatial": "United States" }, { "identifier": "USDA-FNS-100", "accessLevel": "public", "contactPoint": { "hasEmail": "mailto:Tim.Kreh@fns.usda.gov", "@type": "vcard:Contact", "fn": "Tim Kreh" }, "programCode": [ "005:056" ], "description": "This dataset provides the number of household participating in Supplemental Nutrition Assistance Program (SNAP) for each state.", "title": "SNAP Households Participation - Latest Available Month", "distribution": [ { "accessURL": "http://www.fns.usda.gov/sites/default/files/pd/30SNAPcurrHH.pdf", "@type": "dcat:Distribution", "title": "SNAP Households Participation - Latest Available Month" } ], "license": "https://creativecommons.org/publicdomain/zero/1.0/", "bureauCode": [ "005:84" ], "dataQuality": true, "modified": "2015-11-06", "publisher": { "@type": "org:Organization", "subOrganizationOf": { "@type": "org:Organization", "name": "Department of Agriculture" }, "name": "Food and Nutrition Service" }, "keyword": [ "Household", "SNAP", "State" ] }, { "identifier": "USDA-FNS-106", "accessLevel": "public", "contactPoint": { "hasEmail": "mailto:Sasha.Gersten-Paal@fns.usda.gov", "@type": "vcard:Contact", "fn": "Sasha Gersten-Paal" }, "programCode": [ "005:056" ], "description": "Households have to meet income tests unless all members are receiving TANF, SSI, or in some places general assistance. Most households must meet both the gross and net income tests, but a household with an elderly person or a person who is receiving certain types of disability payments only has to meet the net income test. Households, except those noted, that have income over the amounts listed below cannot get SNAP benefits", "title": "SNAP Income Limits", "distribution": [ { "@type": "dcat:Distribution", "downloadURL": "http://www.fns.usda.gov/sites/default/files/snap/FY-2016-SNAP-Income-Limits.xls_.xlsx", "format": "xls", "description": "Excel File", "mediaType": "application/vnd.ms-excel", "title": "FY2016 SNAP Income Limit Table" } ], "license": "https://creativecommons.org/publicdomain/zero/1.0/", "bureauCode": [ "005:84" ], "dataQuality": true, "modified": "2015-10-15", "publisher": { "@type": "org:Organization", "name": "Food and Nutrition Service" }, "keyword": [ "FNS", "Household", "Income", "SNAP", "SSI", "TANF" ] }, { "identifier": "USDA-FNS-98", "accessLevel": "public", "contactPoint": { "hasEmail": "mailto:Tim.Kreh@fns.usda.gov", "@type": "vcard:Contact", "fn": "Tim Kreh" }, "programCode": [ "005:056" ], "description": "This dataset provides SNAP Participation and Benefits National Summary for Current Fiscal Year and Prior 4 Fiscal Years.", "title": "SNAP Participation and Benefits National Summary Current FY and Prior 4 FY", "distribution": [ { "accessURL": "http://www.fns.usda.gov/sites/default/files/pd/34SNAPmonthly.pdf", "@type": "dcat:Distribution", "format": "PDF", "title": "SNAP Participation and Benefits National Summary Current FY and Prior 4 FY" } ], "license": "https://creativecommons.org/publicdomain/zero/1.0/", "bureauCode": [ "005:84" ], "dataQuality": true, "modified": "2015-11-09", "publisher": { "@type": "org:Organization", "subOrganizationOf": { "@type": "org:Organization", "name": "Department of Agriculture" }, "name": "Food and Nutrition Service" }, "keyword": [ "Benefits", "National Summary", "Participation", "SNAP" ] }, { "identifier": "USDA-FNS-000011", "accessLevel": "public", "contactPoint": { "hasEmail": "mailto:Jonathan.Benett@fns.usda.gov", "@type": "vcard:Contact", "fn": "Jonathan Benett" }, "programCode": [ "005:056" ], "description": "The Supplemental Nutrition Assistance Program (SNAP) Retailer Locator is designed to help recipients find SNAP local stores that welcome SNAP benefits. The tool is intended to offer assistance to program recipients, State eligibility workers, community organizations - such as food banks - and others providing assistance to those in need. SNAP Retail Locator tool will make it easier for SNAP participants, especially those who may be new and unfamiliar with the program, to gain access to food. The locator is available at http://www.fns.usda.gov/snap/retailerlocator.htm", "title": "SNAP Retail Locator", "distribution": [ { "accessURL": "http://www.fns.usda.gov/snap/retailerlocator", "@type": "dcat:Distribution", "title": "SNAP Retail Locator" } ], "license": "https://creativecommons.org/licenses/by/4.0", "bureauCode": [ "005:84" ], "modified": "2014-04-30", "publisher": { "@type": "org:Organization", "name": "Food and Nutrition Service, Department of Agriculture" }, "accrualPeriodicity": "R/PT1S", "keyword": [ "Assistance", "Eligibility", "Nutrition", "Recipients", "Retailer", "SNAP", "State", "Stores", "Supplemental", "food", "program", "state" ], "spatial": "United States" }, { "identifier": "USDA-FNS-62", "accessLevel": "public", "contactPoint": { "hasEmail": "mailto:ITGB@fns.usda.gov", "@type": "vcard:Contact", "fn": "FNS Datasets" }, "programCode": [ "005:056" ], "description": "This report details the responsibilities, authorization activities, and oversight findings that the Regional Operations Division (ROD) staff found regarding retailers who participate in the Supplemental Nutrition Assistance Program (SNAP). ROD staff performed front-end authorization, reauthorization, maintenance, and administration related to retailer participation, administrative sanction activities, and retailer investigations in coordination with compliance partners.", "title": "SNAP Retailer Management 2013 Annual Report", "distribution": [ { "@type": "dcat:Distribution", "downloadURL": "http://www.fns.usda.gov/sites/default/files/snap/2013-annual-report.pdf", "mediaType": "application/pdf", "title": "SNAP Retailer Management 2013 Annual Report" } ], "license": "https://creativecommons.org/publicdomain/zero/1.0/", "bureauCode": [ "005:84" ], "dataQuality": true, "rights": "Public", "modified": "2014-03-14", "publisher": { "@type": "org:Organization", "name": "Food and Nutrition Service" }, "keyword": [ "Administrative", "Participation", "Regional Operations Division", "Retailer Investigations", "SNAP" ], "spatial": "United States" }, { "identifier": "USDA-FNS-00003", "accessLevel": "public", "contactPoint": { "hasEmail": "mailto:Ronald.Ward@fns.usda.gov", "@type": "vcard:Contact", "fn": "Ronald Ward" }, "programCode": [ "005:056" ], "description": "To apply for benefits, or for information about the SNAP, contact your local SNAP office using the information in the map below. You can find local offices and each state's application. Local offices are also listed in the State or local government pages of the telephone book. The office should be listed under \"Food Stamps,\" \"Social Services,\" \"Human Services,\" \"Public Assistance,\" or a similar title. You can also call your state's SNAP Hotline Number. Most are toll-free numbers.", "title": "SNAP State Directory of Resources", "distribution": [ { "accessURL": "https://www.fns.usda.gov/snap/state-directory", "@type": "dcat:Distribution", "format": "html", "title": "SNAP State Directory of Resources" } ], "license": "https://creativecommons.org/licenses/by/4.0", "bureauCode": [ "005:84" ], "modified": "2019-05-20", "publisher": { "@type": "org:Organization", "name": "Food and Nutrition Service, Department of Agriculture" }, "keyword": [ "EBT", "SNAP", "States", "Supplemental Nutrition Assistance Program", "access", "balance", "electronic benefits transfer", "information", "online" ], "spatial": "United States" }, { "identifier": "USDA-FNS-118", "accessLevel": "public", "contactPoint": { "hasEmail": "mailto:ITGB@fns.usda.gov", "@type": "vcard:Contact", "fn": "FNS Datasets" }, "programCode": [ "005:056" ], "description": "Use the following numbers to get information on SNAP benefit questions in the States and areas of States listed. Most are toll-free numbers. Some of the numbers that aren't toll free will accept collect calls. * Indicates numbers are for in-State and out-of-State calls. All other 800 numbers are for in-State calls only. ** Indicates numbers accept collect calls.", "title": "SNAP State Information/Hotline Numbers", "distribution": [ { "accessURL": "http://www.fns.usda.gov/snap/state-informationhotline-numbers", "@type": "dcat:Distribution", "format": "html", "title": "SNAP State Information/Hotline Numbers" } ], "license": "https://creativecommons.org/publicdomain/zero/1.0/", "bureauCode": [ "005:84" ], "dataQuality": true, "modified": "2016-05-18", "publisher": { "@type": "org:Organization", "name": "Food and Nutrition Service" }, "keyword": [ "FNS", "SNAP", "States", "Toll-Free Numbers" ] }, { "identifier": "USDA-FNS-00004", "accessLevel": "public", "contactPoint": { "hasEmail": "mailto:Tim.Kreh@fns.usda.gov", "@type": "vcard:Contact", "fn": "Tim Kreh" }, "programCode": [ "005:054" ], "description": "The School Breakfast Program (SBP) provides cash assistance to States to operate nonprofit breakfast programs in schools and residential childcare institutions. Data here consists of participation, breakfast meals served, and cash provided to states, all by year, month and current.", "title": "School Breakfast Participation and Meals Served Data", "distribution": [ { "@type": "dcat:Distribution", "downloadURL": "http://www.fns.usda.gov/sites/default/files/pd/sbsummar.xls", "mediaType": "application/vnd.ms-excel", "title": "School Breakfast Participation and Meals Served Data" } ], "license": "https://creativecommons.org/publicdomain/zero/1.0/", "bureauCode": [ "005:84" ], "modified": "2014-02-24", "publisher": { "@type": "org:Organization", "name": "Food and Nutrition Service, Department of Agriculture" }, "accrualPeriodicity": "R/P3M", "keyword": [ "Breakfast", "Participation", "Program", "School", "States", "assistance", "cash", "childcare", "meals" ], "spatial": "United States" }, { "identifier": "USDA-FNS-103", "accessLevel": "public", "contactPoint": { "hasEmail": "mailto:Tim.Kreh@fns.usda.gov", "@type": "vcard:Contact", "fn": "Tim Kreh" }, "programCode": [ "005:054" ], "description": "This dataset provides the monthly data for School Breakfast Program.", "title": "School Breakfast Program Monthly Data", "distribution": [ { "accessURL": "http://www.fns.usda.gov/sites/default/files/pd/35sbmonthly.pdf", "@type": "dcat:Distribution", "title": "School Breakfast Program Monthly Data" } ], "license": "https://creativecommons.org/publicdomain/zero/1.0/", "bureauCode": [ "005:84" ], "dataQuality": true, "modified": "2015-11-06", "publisher": { "@type": "org:Organization", "subOrganizationOf": { "@type": "org:Organization", "name": "Department of Agriculture" }, "name": "Food and Nutrition Service" }, "keyword": [ "FNS", "Monthly Data", "School Breakfast", "USDA" ] }, { "identifier": "USDA-FNS-84", "accessLevel": "public", "contactPoint": { "hasEmail": "mailto:ITGB@fns.usda.gov", "@type": "vcard:Contact", "fn": "FNS Datasets" }, "programCode": [ "005:054" ], "description": "This memorandum clarifies how SFAs may use funds provided under Sections 4 and 11 or 19 of the National School Lunch Act (NSLA) to purchase fresh fruits and vegetables from DoD Fresh Fruit and Vegetable Program (DoD) vendors.", "title": "School Food Authorities (SFAs) Purchasing Produce from U.S. Department of Defense (DoD) Vendors using Section 4 and 11 for Fresh Fruit and Vegetable Program (FFVP) Funds Memo", "distribution": [ { "@type": "dcat:Distribution", "downloadURL": "http://www.fns.usda.gov/sites/default/files/pmfd133_SFAsPurchasingProducefromDoDVendorsUsingSect4and11orFFVPFunds.pdf", "format": "PDF", "description": "School Food Authorities (SFAs) Purchasing Produce from U.S. Department of Defense (DoD) Vendors using Section 4 and 11 for Fresh Fruit and Vegetable Program (FFVP) Funds Memo", "mediaType": "application/pdf", "title": "School Food Authorities (SFAs) Purchasing Produce from U.S. Department of Defense (DoD) Vendors using Section 4 and 11 for Fresh Fruit and Vegetable Program (FFVP) Funds Memo" } ], "license": "https://creativecommons.org/publicdomain/zero/1.0/", "bureauCode": [ "005:84" ], "dataQuality": true, "rights": "Public", "modified": "2014-03-06", "publisher": { "@type": "org:Organization", "name": "Food and Nutrition Service" }, "keyword": [ "DoD", "FNS", "Fresh Fruit and Vegetable Program", "Memorandum", "National School Lunch Act", "SFAs" ] }, { "identifier": "USDA-FNS-61", "accessLevel": "public", "contactPoint": { "hasEmail": "mailto:ITGB@fns.usda.gov", "@type": "vcard:Contact", "fn": "FNS Datasets" }, "programCode": [ "005:055" ], "description": "The Healthy, Hunger-Free Kids Act (HHFKA) directed USDA to study the extent to which school food authorities (SFAs) participating in the National School Lunch Program (NSLP) and School Breakfast Program (SBP) pay indirect costs to local education agencies (LEAs). It specifically requested an assessment of the methodologies used to establish indirect costs, the types and amounts of indirect costs that are charged and not charged to the school food service account, and the types and amounts of indirect costs recovered by LEAs. To address the research questions, information was collected from four perspectives: (1) the State education agency finance officer, (2) the State child nutrition director, (3) the LEA business manager, and (4) the SFA director.", "title": "School Foodservice Indirect Cost Study", "distribution": [ { "@type": "dcat:Distribution", "downloadURL": "http://www.fns.usda.gov/sites/default/files/SFICS.pdf", "mediaType": "application/pdf", "title": "School Foodservice Indirect Cost Study" } ], "license": "https://creativecommons.org/publicdomain/zero/1.0/", "bureauCode": [ "005:84" ], "dataQuality": true, "rights": "Public", "modified": "2014-03-11", "publisher": { "@type": "org:Organization", "name": "Food and Nutrition Service" }, "keyword": [ "FNS", "HHFKA", "LEAs", "NSLP", "SBP", "SFAs", "indirect costs" ], "spatial": "United States" }, { "identifier": "USDA-FNS-74", "accessLevel": "public", "contactPoint": { "hasEmail": "mailto:ITGB@fns.usda.gov", "@type": "vcard:Contact", "fn": "FNS Datasets" }, "programCode": [ "005:054" ], "description": "The Healthy, Hunger-Free Kids Act of 2010 (HHFKA) directed the Department of Agriculture (USDA) to establish nutrition standards for all foods and beverages sold to students on the school campus during the school day. On June 28, 2013, the Food and Nutrition Service (FNS) published the \"Smart Snacks in School\" (Smart Snacks) regulation that carefully balances science-based nutrition standards with practical and flexible solutions to promote healthier eating on campus. The purpose of this memorandum is to clarify Smart Snacks standards for exempt food that are paired together as a single snack.", "title": "Smart Snacks Standards for Exempt Foods when Paired Together Notice", "distribution": [ { "@type": "dcat:Distribution", "downloadURL": "http://www.fns.usda.gov/sites/default/files/cnd/SP63-2014os.pdf", "mediaType": "application/pdf", "title": "Smart Snacks Standards for Exempt Foods when Paired Together Notice" } ], "license": "https://creativecommons.org/publicdomain/zero/1.0/", "bureauCode": [ "005:84" ], "dataQuality": true, "rights": "Public", "modified": "2014-09-11", "publisher": { "@type": "org:Organization", "name": "Food and Nutrition Service" }, "keyword": [ "Beverages", "FNS", "Foods", "HHFKA", "Nutrition", "School", "Students" ], "spatial": "United States" }, { "identifier": "USDA-FNS-00012", "accessLevel": "public", "contactPoint": { "hasEmail": "mailto:Tim.Kreh@fns.usda.gov", "@type": "vcard:Contact", "fn": "Tim Kreh" }, "programCode": [ "005:054" ], "description": "The Special Milk Program provides milk to children in schools and childcare institutions who do not participate in other Federal meal service programs. The program reimburses schools for the milk they serve. Schools in the National School Lunch or School Breakfast Programs may also participate in the Special Milk Program to provide milk to children in half-day pre-kindergarten and kindergarten programs where children do not have access to the school meal programs. The data set consists of number of outlets, number of half-pints served and federal expenditures.", "title": "Special Milk Outlets and Milk Served Data", "distribution": [ { "@type": "dcat:Distribution", "downloadURL": "http://www.fns.usda.gov/sites/default/files/pd/smsummar.xls", "mediaType": "application/vnd.ms-excel", "title": "Special Milk Outlets and Milk Served Data" } ], "license": "https://creativecommons.org/licenses/by/4.0", "bureauCode": [ "005:84" ], "modified": "2014-12-23", "publisher": { "@type": "org:Organization", "name": "Food and Nutrition Service, Department of Agriculture" }, "accrualPeriodicity": "R/P3M", "keyword": [ "Breakfast", "Childcare", "Children", "Institutions", "Milk", "Outlets", "School", "program" ], "spatial": "United States" }, { "identifier": "USDA-FNS-59", "accessLevel": "public", "contactPoint": { "hasEmail": "mailto:ITGB@fns.usda.gov", "@type": "vcard:Contact", "fn": "FNS Datasets" }, "programCode": [ "005:055" ], "description": "The Special Nutrition Program Operations Study is a multiyear study designed to provide the Food and Nutrition Service with a snapshot of current State and School Food Authority policies and practices, including information on school meal standards, competitive foods standards, professional standards, school lunch pricing and accounting, and standards for school wellness policies. The information in this first year study (School Year 2011-12) will provide a baseline for observing the improvements resulting from the implementation of the Healthy, Hunger-Free Kids Act.", "title": "Special Nutrition Program Operations Study: State and School Food Authority Policies and Practices for School Meals Programs School Year 2011-12", "distribution": [ { "@type": "dcat:Distribution", "downloadURL": "http://www.fns.usda.gov/sites/default/files/SNOPSYear1.pdf", "mediaType": "application/pdf", "title": "Special Nutrition Program Operations Study: State and School Food Authority Policies and Practices for School Meals Programs School Year 2011-12" } ], "license": "https://creativecommons.org/publicdomain/zero/1.0/", "bureauCode": [ "005:84" ], "dataQuality": true, "rights": "Public", "modified": "2014-03-22", "publisher": { "@type": "org:Organization", "name": "Food and Nutrition Service" }, "keyword": [ "FNS", "Food", "Healthy Hunger-Free Kids Act", "School", "Special Nutrition Program", "accounting", "meal standards", "school lunch pricing" ], "spatial": "United States" }, { "identifier": "USDA-FNS-26", "accessLevel": "public", "contactPoint": { "hasEmail": "mailto:webmaster@fns.usda.gov", "@type": "vcard:Contact", "fn": "FNS Webmaster" }, "programCode": [ "005:054" ], "description": "For information about how and where to apply for USDA commodities in disaster situations, please contact the State Distributing Agency (SDA) that administer the Food Distribution Programs in your State. This dataset provides contact information for SDAs which maintain stocks of USDA commodity foods in disaster situations.", "title": "State Distributing Agency (DA) Contacts for Disaster Situations", "distribution": [ { "accessURL": "http://www.fns.usda.gov/fdd/contacts/sdacontacts.htm", "@type": "dcat:Distribution", "title": "State DA Contacts For CSFP, NSLP Schools, CACFP, SFSP, NSIP, & TEFAP" } ], "license": "https://creativecommons.org/publicdomain/zero/1.0/", "bureauCode": [ "005:84" ], "dataQuality": true, "rights": "Public", "modified": "2014-03-26", "publisher": { "@type": "org:Organization", "name": "Food and Nutrition Service" }, "keyword": [ "CACFP", "CSFP", "Contact information", "Disaster", "Food", "NSIP", "NSLP Schools", "SFSP", "State DA Contacts For CSFP", "commodity foods" ], "spatial": "United States" }, { "identifier": "USDA-FNS-49", "accessLevel": "public", "contactPoint": { "hasEmail": "mailto:webmaster@fns.usda.gov", "@type": "vcard:Contact", "fn": "FNS Webmaster" }, "programCode": [ "005:054" ], "description": "The Food and Nutrition Service (FNS) Food Distribution Programs provide food and nutrition assistance to school children and families and support American agriculture by distributing high quality, 100 percent American-grown USDA Foods. This report analyzes State of origin data for Fiscal Year (FY) 2012, which captures the State where USDA purchased USDA Foods during FY 2012. In FY 2012, USDA purchased over 2 billion pounds of food, worth nearly $2 billion. Purchased USDA Foods included both raw food products such as meats, vegetables, and fruits, as well as finished food products like cereal, crackers, and pasta.", "title": "State of Origin for USDA Foods in Fiscal Year 2012", "distribution": [ { "@type": "dcat:Distribution", "downloadURL": "http://www.fns.usda.gov/sites/default/files/StateofOrigin2012.pdf", "mediaType": "application/pdf", "title": "State of Origin for USDA Foods in Fiscal Year 2012" } ], "license": "https://creativecommons.org/publicdomain/zero/1.0/", "bureauCode": [ "005:84" ], "dataQuality": true, "rights": "Public", "modified": "2014-03-17", "publisher": { "@type": "org:Organization", "name": "Food and Nutrition Service" }, "keyword": [ "FNS", "meat", "raw food", "vegetable" ], "spatial": "United States" }, { "identifier": "USDA-FNS-129", "accessLevel": "public", "contactPoint": { "hasEmail": "mailto:webmaster@fns.usda.gov", "@type": "vcard:Contact", "fn": "FNS Webmaster" }, "programCode": [ "005:056" ], "description": "The Study of Food Safety Needs of Adult Day Care Centers in the Child and Adult Care Food Program report identified and evaluated food safety knowledge gaps and education needs of adult day care center program operators. To identify and evaluate food safety education needs, the study team administered a 20-minute survey to a nationally representative sample of directors of adult day care centers that participated in CACFP across the United States in 2018. Overall, this study provides information on knowledge gaps related to food safety practices in adult day care centers and illuminates the best way for center staff to receive future food safety training and information support.", "title": "Study of Food Safety Needs of Adult Day Care Centers in the Child and Adult Care Food Program", "distribution": [ { "@type": "dcat:Distribution", "downloadURL": "https://www.fns.usda.gov/sites/default/files/resource-files/FoodSafetyNeeds-AdultDayCare-CACFP.pdf", "mediaType": "application/pdf", "title": "Study of Food Safety Needs of Adult Day Care Centers in the Child and Adult Care Food Program" } ], "license": "https://creativecommons.org/publicdomain/zero/1.0/", "bureauCode": [ "005:84" ], "modified": "2019-09-24", "publisher": { "@type": "org:Organization", "name": "Food and Nutrition Service" }, "keyword": [ "Adult Day Care Centers", "CACFP", "FNS", "Food Safety", "USDA" ] }, { "identifier": "USDA-FNS-140", "accessLevel": "public", "contactPoint": { "hasEmail": "mailto:ITGB@usda.gov", "@type": "vcard:Contact", "fn": "FNS Datasets" }, "programCode": [ "005:056" ], "description": "This report examines in-depth the accomplishments, challenges, and lessons learned from 20 states that received and completed Administrative Review and Training (ART) Grants by the end of FY 2017. ART Grants provide funding for diverse activities aimed at reducing administrative error, including training for administrative personnel and improving state-level technologies in the National School Lunch and School Breakfast Program. Data was collected through interviews with stakeholders in the interventions", "title": "Study of the Administrative Review and Training Grants in the USDA NSLP and SBP", "distribution": [ { "@type": "dcat:Distribution", "downloadURL": "https://fns-prod.azureedge.net/sites/default/files/resource-files/CNAdministrativeReview_TrainingGrants.pdf", "description": "This report examines in-depth the accomplishments, challenges, and lessons learned from 20 states that received and completed Administrative Review and Training (ART) Grants by the end of FY 2017. ART Grants provide funding for diverse activities aimed at reducing administrative error, including training for administrative personnel and improving state-level technologies in the National School Lunch and School Breakfast Program. Data was collected through interviews with stakeholders in the interventions.", "mediaType": "application/pdf", "title": "Study of the Administrative Review and Training Grants in the USDA National School Lunch and School Breakfast Program" } ], "license": "https://creativecommons.org/publicdomain/zero/1.0/", "bureauCode": [ "005:84" ], "dataQuality": true, "rights": "Public", "modified": "2020-08-25", "publisher": { "@type": "org:Organization", "name": "Food and Nutrition Service" }, "keyword": [ "ART", "Administrative Review and Training", "National School Lunch", "National School Lunch and School Breakfast Program", "grants" ] }, { "identifier": "USDA-FNS-00005", "accessLevel": "public", "contactPoint": { "hasEmail": "mailto:Tim.Kreh@fns.usda.gov", "@type": "vcard:Contact", "fn": "Tim Kreh" }, "programCode": [ "005:054" ], "description": "During the school year, many children receive free and reduced-price breakfast and lunch through the School Breakfast and National School Lunch Programs. What happens when school lets out? Hunger is one of the most severe roadblocks to the learning process. Lack of nutrition during the summer months may set up a cycle for poor performance once school begins again. Hunger also may make children more prone to illness and other health issues. The Summer Food Service Program is designed to fill that nutrition gap and make sure children can get the nutritious meals they need. This data set contains information on summer food service participation, meals served and cash payments provided by state.", "title": "Summer Food Service Participation, Meals, and Costs Data", "distribution": [ { "@type": "dcat:Distribution", "downloadURL": "http://www.fns.usda.gov/sites/default/files/pd/sfsummar.xls", "mediaType": "application/vnd.ms-excel", "title": "Summer Food Service Participation, Meals, and Costs Data" } ], "license": "https://creativecommons.org/licenses/by/4.0", "bureauCode": [ "005:84" ], "modified": "2014-12-23", "publisher": { "@type": "org:Organization", "name": "Food and Nutrition Service, Department of Agriculture" }, "accrualPeriodicity": "R/P3M", "keyword": [ "Children", "Food", "Hunger", "Lunch", "National", "Programs", "School", "State", "Summer", "breakfast", "service" ], "spatial": "United States" }, { "identifier": "USDA-FNS-111", "accessLevel": "public", "contactPoint": { "hasEmail": "mailto:ITGB@fns.usda.gov", "@type": "vcard:Contact", "fn": "FNS Datasets" }, "programCode": [ "005:054" ], "description": "Allows users to confirm eligibility of summer meal sites by accessing census tract and census block group (CBG) data. This tool can also be used to conduct weighted averaging as discussed in SFSP Policy Memorandum 10-2015, “Area Eligibility in Child Nutrition Programs,” published Nov. 21, 2014, available at http://www.fns.usda.gov/area-eligibility-child-nutrition-programs-0. Instructions for determining eligibility using these data are available at: http://www.fns.usda.gov/sites/default/files/Census%20Instructions%202014_0.pdf. The instructions offer two different tools to determine eligibility: the FNS Area Eligibility Mapper and a map developed by the Food Research and Action Center (FRAC). The FRAC map is constructed from the same data files and also may be used to determine eligibility. Additionally, State agencies may request the data file for every CBG and census tract, including Federal Information Processing Standards (FIPS) codes for Geographic Information System (GIS) efforts, in their State. State agencies also may provide these data to institutions and partners upon request. This tool can also be used to identify locations that are area eligible for participation in other Child Nutrition Programs.", "title": "Summer Food Service Program (SFSP) Area Eligibility Mapper", "distribution": [ { "accessURL": "http://www.fns.usda.gov/areaeligibility", "@type": "dcat:Distribution", "format": "API", "title": "Summer Food Service Program (SFSP) Area Eligibility Mapper" } ], "license": "https://creativecommons.org/publicdomain/zero/1.0/", "bureauCode": [ "005:84" ], "dataQuality": true, "modified": "2016-04-13", "publisher": { "@type": "org:Organization", "name": "Food and Nutrition Service" }, "keyword": [ "Child Nutrition Programs", "FNS", "FRAC", "Summer Meals" ] }, { "identifier": "USDA-FNS-109", "accessLevel": "public", "contactPoint": { "hasEmail": "mailto:webmaster@fns.usda.gov", "@type": "vcard:Contact", "fn": "FNS Webmaster" }, "programCode": [ "005:054" ], "description": "This dataset provides contact information for Summer Food Service Program (SFSP) for each state.", "title": "Summer Food Service Program (SFSP) Contacts", "distribution": [ { "accessURL": "http://www.fns.usda.gov/sfsp/sfsp-contacts", "@type": "dcat:Distribution", "format": "html", "title": "Summer Food Service Program (SFSP) Contacts" } ], "license": "https://creativecommons.org/publicdomain/zero/1.0/", "bureauCode": [ "005:84" ], "dataQuality": true, "modified": "2014-10-30", "publisher": { "@type": "org:Organization", "name": "Food and Nutrition Service" }, "keyword": [ "FNS", "State", "Summer Food Service Program" ] }, { "identifier": "USDA-FNS-113", "accessLevel": "public", "contactPoint": { "hasEmail": "mailto:ITGB@fns.usda.gov", "@type": "vcard:Contact", "fn": "FNS Datasets" }, "programCode": [ "005:054" ], "description": "This tool is primarily a routing tool for Summer meal sponsors, vendors and State agencies that is overlaid on the Capacity Builder. Routing is especially important for less densely populated areas, such as rural areas. This tool will help a variety of audiences allocate resources efficiently and in a cost effective way. Sponsors can identify potential summer sites for mobile feeding by identifying gaps in service in the neediest areas, plan the most efficient monitoring routes, and find routes to local food vendors to create fresh local meals (http://www.fns.usda.gov/farmtoschool/farm-summer). In addition self-prep central kitchens and vendors can find the best route to deliver meals to each Summer meal site. State agencies can also use this tool to plan the most efficient monitoring routes throughout the summer.", "title": "Summer Food Service Program (SFSP) Mobile Route Maker", "distribution": [ { "accessURL": "http://www.fns.usda.gov/mobile-route-maker", "@type": "dcat:Distribution", "format": "API", "title": "Summer Food Service Program (SFSP) Mobile Route Maker" } ], "license": "https://creativecommons.org/publicdomain/zero/1.0/", "bureauCode": [ "005:84" ], "dataQuality": true, "modified": "2016-02-26", "publisher": { "@type": "org:Organization", "name": "Food and Nutrition Service" }, "keyword": [ "FNS", "Food Vendors", "Summer Food Service Program" ] }, { "identifier": "USDA-FNS-112", "accessLevel": "public", "contactPoint": { "hasEmail": "mailto:ITGB@fns.usda.gov", "@type": "vcard:Contact", "fn": "FNS Datasets" }, "programCode": [ "005:054" ], "description": "Allows State agencies and sponsors to determine if a proposed site may be designated as rural for purposes of identifying a site as eligible for increased reimbursement in SFSP. To use the map, users must enter the address of the proposed site in the “Find Address or Place” box located on the right side of the screen. By pressing enter, the map will zoom to the location specified. Locations shaded in purple are non-rural; unshaded locations are rural.", "title": "Summer Food Service Program (SFSP) Rural Designation Tool", "distribution": [ { "accessURL": "http://www.fns.usda.gov/rural-designation", "@type": "dcat:Distribution", "format": "API", "title": "Summer Food Service Program (SFSP) Rural Designation Tool" } ], "license": "https://creativecommons.org/publicdomain/zero/1.0/", "bureauCode": [ "005:84" ], "dataQuality": true, "modified": "2015-01-06", "publisher": { "@type": "org:Organization", "name": "Food and Nutrition Service" }, "keyword": [ "FNS", "Rural", "State Agencies", "Summer Food Service Program" ] }, { "identifier": "USDA-FNS-110", "accessLevel": "public", "contactPoint": { "hasEmail": "mailto:ITGB@fns.usda.gov", "@type": "vcard:Contact", "fn": "FNS Datasets" }, "programCode": [ "005:054" ], "description": "Allows users to search for summer meal sites from the previous summer by zip code, adding “layers” of information, such as free and reduced-price lunch participation rates or area eligibility data. Potential site locations (multi-family housing units, libraries, museums, and schools) can be added to the map, and previous site locations can also be highlighted, helping to prevent site overlap. This tool can also be used to identify locations that are area eligible for participation in other Child Nutrition Programs.", "title": "Summer Meal Capacity Builder", "distribution": [ { "accessURL": "http://www.fns.usda.gov/capacitybuilder", "@type": "dcat:Distribution", "format": "API", "title": "Summer Meal Capacity Builder" } ], "license": "https://creativecommons.org/publicdomain/zero/1.0/", "bureauCode": [ "005:84" ], "dataQuality": true, "modified": "2015-01-06", "publisher": { "@type": "org:Organization", "name": "Food and Nutrition Service" }, "keyword": [ "Child Nutrition Programs", "FNS", "Summer Meals", "schools", "zip code" ] }, { "identifier": "USDA-FNS-14", "accessLevel": "public", "contactPoint": { "hasEmail": "mailto:Jackie.Haven@fns.usda.gov", "@type": "vcard:Contact", "fn": "Jackie Haven" }, "programCode": [ "005:057" ], "description": "The SuperTracker is an online tool that helps you track what you currently eat and drink, gives you a personalized plan for what you should eat and drink, and guides you to make better choices.", "title": "SuperTracker", "distribution": [ { "accessURL": "http://www.choosemyplate.gov/tools-supertracker", "@type": "dcat:Distribution", "title": "SuperTracker" } ], "license": "https://creativecommons.org/publicdomain/zero/1.0/", "bureauCode": [ "005:84" ], "rights": "Public", "modified": "2014-05-21", "publisher": { "@type": "org:Organization", "name": "Food and Nutrition Service" }, "keyword": [ "drink", "health", "personalized", "plan", "tool", "track" ], "spatial": "United States" }, { "identifier": "USDA-FNS-124", "accessLevel": "public", "contactPoint": { "hasEmail": "mailto:Jackie.Haven@cnpp.usda.gov", "@type": "vcard:Contact", "fn": "Jackie Haven" }, "programCode": [ "005:055" ], "description": "SuperTracker was an online tool offered by USDA (2011-2018) that helped users track diet, physical activity and weight. SuperTracker provided a personalized plan based on the 2015-2020 Dietary Guidelines for Americans for what you should eat and drink and guided users to making better choices. This dataset includes the SuperTracker source code (latest update April 2018), including: front end application, database schema, documentation, deployment scripts and a ReadMe.txt file that provides high level instructions for the source code. Database connection strings and actual data are not included. The full foods database spreadsheet is attached as well; these foods are based on the Food and Nutrient Database for Dietary Studies (FNDDS), and the Food Patterns Equivalents Database (FPED), both from the USDA/ARS Food Surveys Research Group.\r\n\r\nIt is important to note that the code is based on 2015-2020 Dietary Guidelines for Americans and will not be updated to reflect future guidance. In addition, the food database is based on FNDDS from 2011-2012 (FNDDS 6.0) and FPED from 2011-2012 and will not be updated with future data releases.", "title": "SuperTracker - source code and foods database", "distribution": [ { "@type": "dcat:Distribution", "downloadURL": "https://inventory.data.gov/dataset/97f9a5cf-61c4-406b-8170-5a6422b68654/resource/c04948d7-4af3-42c7-ae4b-5b805ea7571e/download/supertrackersource2.zip", "mediaType": "application/zip", "title": "SuperTracker source code & foods database" }, { "@type": "dcat:Distribution", "downloadURL": "https://inventory.data.gov/dataset/97f9a5cf-61c4-406b-8170-5a6422b68654/resource/089986ee-1bf9-412d-b33c-3550c292dc8c/download/supertrackerfooddatabase.xlsx", "format": "Excel", "description": "Foods database spreadsheet", "mediaType": "application/vnd.openxmlformats-officedocument.spreadsheetml.sheet", "title": "Foods database spreadsheet" } ], "license": "https://creativecommons.org/publicdomain/zero/1.0/", "bureauCode": [ "005:84" ], "modified": "2018-04-10", "publisher": { "@type": "org:Organization", "name": "Food and Nutrition Service" }, "keyword": [ "CNPP", "Dietary Guidelines", "FNS", "Health", "Nutrition", "SuperTracker", "USDA" ] }, { "identifier": "USDA-FNS-46", "accessLevel": "public", "contactPoint": { "hasEmail": "mailto:webmaster@fns.usda.gov", "@type": "vcard:Contact", "fn": "FNS Webmaster" }, "programCode": [ "005:056" ], "description": "This study presents the evaluation of the three SNAP-Ed demonstration projects. Two of the three demonstration projects studied targeted low-income children in elementary school settings with the goal of increasing children’s consumption of fruits and vegetables. The third project also focused on increasing fruit and vegetable consumption and targeted seniors. One of the child-focused interventions and the Food and Nutrition Service (FNS) developed Eat Smart, Live Strong program for older Americans demonstrated increases in fruit and vegetable consumption. This study also evaluated the self-evaluations conducted by the three demonstration projects.", "title": "Supplemental Nutrition Assistance Program Education and Evaluation Study (Wave II)", "distribution": [ { "@type": "dcat:Distribution", "downloadURL": "http://www.fns.usda.gov/supplemental-nutrition-assistance-program-education-and-evaluation-study-wave-ii", "mediaType": "text/html", "title": "Supplemental Nutrition Assistance Program Education and Evaluation Study (Wave II)" } ], "license": "https://creativecommons.org/publicdomain/zero/1.0/", "bureauCode": [ "005:84" ], "dataQuality": true, "rights": "Public", "modified": "2013-12-12", "publisher": { "@type": "org:Organization", "name": "Food and Nutrition Service" }, "keyword": [ "FNS", "SNAP", "SNAP-Ed", "elementary school", "fruit and vegetable consumption", "low-income children" ], "spatial": "United States" }, { "identifier": "USDA-FNS-00009", "accessLevel": "public", "contactPoint": { "hasEmail": "mailto:Tim.Kreh@fns.usda.gov", "@type": "vcard:Contact", "fn": "Tim Kreh" }, "programCode": [ "005:056" ], "description": "Supplemental Nutrition Assistance Program (SNAP) is the new name for the federal Food Stamp Program. This data set contains participation and cost data for SNAP. The data is furthered divided by annual, state, and monthly levels categorized by persons participating, households participating, benefits provided, average monthly benefits per person and average monthly benefits per household.", "title": "Supplemental Nutrition Assistance Program Participation and Cost Data", "distribution": [ { "@type": "dcat:Distribution", "downloadURL": "http://www.fns.usda.gov/sites/default/files/pd/SNAPsummary.xls", "mediaType": "application/vnd.ms-excel", "title": "Supplemental Nutrition Assistance Program Participation and Cost Data" } ], "license": "https://creativecommons.org/licenses/by/4.0", "bureauCode": [ "005:84" ], "modified": "2014-12-23", "publisher": { "@type": "org:Organization", "name": "Food and Nutrition Service, Department of Agriculture" }, "accrualPeriodicity": "R/P3M", "keyword": [ "Children", "Cost", "Food", "Infants", "Nutrition", "Participation", "SNAP", "WIC", "Women" ], "spatial": "United States" }, { "identifier": "USDA-FNS-99", "accessLevel": "public", "contactPoint": { "hasEmail": "mailto:Tim.Kreh@fns.usda.gov", "@type": "vcard:Contact", "fn": "Tim Kreh" }, "programCode": [ "005:056" ], "description": "This dataset provides the number of people participating in Supplemental Nutrition Assistance Program (SNAP) for each state.", "title": "Supplemental Nutrition Assistance Program Persons Partcipation - Latest Available Month", "distribution": [ { "accessURL": "http://www.fns.usda.gov/sites/default/files/pd/29SNAPcurrPP.pdf", "@type": "dcat:Distribution", "title": "SNAP Persons Participation - Latest Available Month" } ], "license": "https://creativecommons.org/publicdomain/zero/1.0/", "bureauCode": [ "005:84" ], "dataQuality": true, "modified": "2015-11-06", "publisher": { "@type": "org:Organization", "subOrganizationOf": { "@type": "org:Organization", "name": "Department of Agriculture" }, "name": "Food and Nutrition Service" }, "keyword": [ "People", "SNAP", "State" ] }, { "identifier": "USDA-FNS-117", "accessLevel": "public", "contactPoint": { "hasEmail": "mailto:webmaster@fns.usda.gov", "@type": "vcard:Contact", "fn": "FNS Datasets" }, "programCode": [ "005:056" ], "description": "This datasets provides the list of state websites to apply online for SNAP benefits.", "title": "Supplemental Nutrition Assistance Program on-line applications", "distribution": [ { "accessURL": "http://www.fns.usda.gov/snap/apply", "@type": "dcat:Distribution", "format": "html", "title": "Supplemental Nutrition Assistance Program (SNAP) On-line Application" } ], "license": "https://creativecommons.org/publicdomain/zero/1.0/", "bureauCode": [ "005:84" ], "dataQuality": false, "modified": "2018-08-26", "publisher": { "@type": "org:Organization", "name": "Food and Nutrition Service" }, "keyword": [ "FNS", "Online", "SNAP", "websites" ] }, { "identifier": "USDA-FNS-70", "accessLevel": "public", "contactPoint": { "hasEmail": "mailto:ITGB@fns.usda.gov", "@type": "vcard:Contact", "fn": "FNS Datasets" }, "programCode": [ "005:056" ], "description": "This study examines how to define \"adequacy\" of SNAP allotments in the context of improving food security and access to a healthy diet, existing data sources that could inform an assessment of the adequacy of existing and potential alternative SNAP allotments, and new data requirements to strengthen the evidence-base and allow for further rigorous analyses.", "title": "Supplemental Nutrition Assistance Program: Examining the Evidence to Define Benefit Adequacy Study", "distribution": [ { "@type": "dcat:Distribution", "downloadURL": "http://www.fns.usda.gov/sites/default/files/ops/IOMSNAPAllotments.pdf", "mediaType": "application/pdf", "title": "Supplemental Nutrition Assistance Program: Examining the Evidence to Define Benefit Adequacy Study" } ], "license": "https://creativecommons.org/publicdomain/zero/1.0/", "bureauCode": [ "005:84" ], "dataQuality": true, "rights": "Public", "modified": "2014-01-17", "publisher": { "@type": "org:Organization", "name": "Food and Nutrition Service" }, "keyword": [ "Adequacy", "Analyses", "Diet", "Food Security", "SNAP" ], "spatial": "United States" }, { "identifier": "USDA-FNS-105", "accessLevel": "public", "contactPoint": { "hasEmail": "mailto:maryrose.conroy@usda.gov", "@type": "vcard:Contact", "fn": "Mary Rose Conroy" }, "programCode": [ "005:056" ], "description": "Broad-based categorical eligibility (BBCE) is a policy that makes most households categorically eligible for SNAP because they qualify for a non-cash Temporary Assistance for Needy Families (TANF) or State maintenance of effort (MOE) funded benefit. The chart below shows which States implemented BBCE, the programs that confer BBCE, the asset limit of the TANF/MOE program, and the gross income limit of the TANF/MOE program.\r\nBBCE cannot limit eligibility. Households with seniors or disabled members that are not eligible for the program that confers categorical eligibility may apply for and receive SNAP under regular SNAP rules. Under regular program rules, households with elderly or disabled members do not need to meet the gross income limit, but must meet the net income limit.", "title": "TANF Broad Based Categorical Eligibility rules that apply to SNAP", "distribution": [ { "@type": "dcat:Distribution", "downloadURL": "https://fns-prod.azureedge.net/sites/default/files/snap/BBCE.pdf", "format": "PDF", "description": "PDF", "mediaType": "application/pdf", "title": "TANF Broad-Based Categorical Eligibility rules that apply to SNAP" } ], "license": "https://creativecommons.org/publicdomain/zero/1.0/", "bureauCode": [ "005:84" ], "dataQuality": true, "modified": "2018-10-01", "publisher": { "@type": "org:Organization", "name": "Food and Nutrition Service" }, "keyword": [ "BBCE", "FNS", "SNAP", "Stanford", "USDA" ] }, { "identifier": "USDA-FNS-119", "accessLevel": "public", "contactPoint": { "hasEmail": "mailto:ITGB@fns.usda.gov", "@type": "vcard:Contact", "fn": "FNS Datasets" }, "programCode": [ "005:054" ], "description": "This catalog provides general information about Team Nutrition, including; strategies and messages, Details on Team Nutrition Schools and how to sign up a school to be a Team Nutrition School.\r\nThe catalog includes details on all Team Nutrition education materials for schools including, kits, posters, games and stickers. Materials for child care and summer meal programs and technical and training materials for schools and child care.", "title": "Team Nutrition Resource Catalog", "distribution": [ { "@type": "dcat:Distribution", "downloadURL": "http://www.fns.usda.gov/sites/default/files/tn/TeamNutritionResourceCatalogue_Final%20508.pdf", "format": "pdf", "mediaType": "application/pdf", "title": "Team Nutrition Resource Catalog" } ], "license": "https://creativecommons.org/publicdomain/zero/1.0/", "bureauCode": [ "005:84" ], "dataQuality": true, "modified": "2016-10-17", "publisher": { "@type": "org:Organization", "name": "Food and Nutrition Service" }, "keyword": [ "FNS", "Games", "Kids", "School", "Team Nutrition", "USDA" ] }, { "identifier": "USDA-FNS-72", "accessLevel": "public", "contactPoint": { "hasEmail": "mailto:ITGB@fns.usda.gov", "@type": "vcard:Contact", "fn": "FNS Datasets" }, "programCode": [ "005:055" ], "description": "On February 7, 2014, the Agricultural Act of 2014 (P.L. 113-79, Farm Bill) was signed into law, reauthorizing TEFAP through Fiscal Year 2018. This memorandum implements two provisions of the Farm Bill relative to TEFAP funding levels and the carryover of food entitlement funds.", "title": "The Emergency Food Assistance Program (TEFAP) Farm Bill Implementation Memo", "distribution": [ { "@type": "dcat:Distribution", "downloadURL": "http://www.fns.usda.gov/sites/default/files/fdd/TEFAP_Farm_Bill_2014_Implementation_Memo_1.pdf", "mediaType": "application/pdf", "title": "The Emergency Food Assistance Program (TEFAP) Farm Bill Implementation Memo" } ], "license": "https://creativecommons.org/publicdomain/zero/1.0/", "bureauCode": [ "005:84" ], "dataQuality": true, "rights": "Public", "modified": "2014-08-14", "publisher": { "@type": "org:Organization", "name": "Food and Nutrition Service" }, "keyword": [ "Entitlement Funds", "FNS", "Farm Bill", "Food", "TEFAP" ], "spatial": "United States" }, { "identifier": "USDA-FNS-51", "accessLevel": "public", "contactPoint": { "hasEmail": "mailto:ITGB@fns.usda.gov", "@type": "vcard:Contact", "fn": "FNS Datasets" }, "programCode": [ "005:055" ], "description": "Provide total food cost of the Emergency Food Assistance Program on State level.", "title": "The Emergency Food Assistance Program (TEFAP): Total Food Cost", "distribution": [ { "@type": "dcat:Distribution", "downloadURL": "http://www.fns.usda.gov/sites/default/files/pd/22tefap.pdf", "mediaType": "application/pdf", "title": "The Emergency Food Assistance Program (TEFAP): Total Food Cost" } ], "license": "https://creativecommons.org/publicdomain/zero/1.0/", "bureauCode": [ "005:84" ], "dataQuality": true, "rights": "Public", "modified": "2014-08-08", "publisher": { "@type": "org:Organization", "name": "Food and Nutrition Service" }, "keyword": [ "Emergency", "FNS", "Food Assistance", "Food Cost", "State", "TEFAP" ], "spatial": "United States" }, { "identifier": "USDA-FNS-34", "accessLevel": "public", "contactPoint": { "hasEmail": "mailto:webmaster@fns.usda.gov", "@type": "vcard:Contact", "fn": "FNS Webmaster" }, "programCode": [ "005:056" ], "description": "Trafficking of Supplemental Nutrition Assistance Program (SNAP) benefits occurs when SNAP recipients sell their benefits for cash to food retailers, often at a discount. Although trafficking does not increase costs to the Federal Government, it is a diversion of program benefits from their intended purpose of helping low-income families access a nutritious diet. This report, the latest in a series of periodic analyses, provides estimates of the extent of trafficking during the period 2009 through 2011.", "title": "The Extent of Trafficking in the Supplemental Nutrition Assistance Program: 2009-2011", "distribution": [ { "@type": "dcat:Distribution", "downloadURL": "http://www.fns.usda.gov/extent-trafficking-supplemental-nutrition-assistance-program-2009-2011-august-2013", "mediaType": "text/html", "title": "Trafficking in the Supplemental Nutrition Assistance Program: 2009-2011" } ], "license": "https://creativecommons.org/publicdomain/zero/1.0/", "bureauCode": [ "005:84" ], "dataQuality": true, "rights": "Public", "modified": "2013-11-13", "publisher": { "@type": "org:Organization", "name": "Food and Nutrition Service" }, "keyword": [ "Retailers", "SNAP", "Trafficking", "estimates", "recipients" ], "spatial": "United States" }, { "identifier": "USDA-FNS-56", "accessLevel": "public", "contactPoint": { "hasEmail": "mailto:webmaster@fns.usda.gov", "@type": "vcard:Contact", "fn": "FNS Webmaster" }, "programCode": [ "005:055" ], "description": "Provides Toll-Free numbers for WIIC state agencies.", "title": "Toll-Free Numbers for Women, Infants and Children (WIC) State Agencies", "distribution": [ { "accessURL": "http://www.fns.usda.gov/wic/toll-free-numbers-wic-state-agencies", "@type": "dcat:Distribution", "title": "Toll-Free Numbers for Women, Infants and Children (WIC) State Agencies" } ], "license": "https://creativecommons.org/publicdomain/zero/1.0/", "bureauCode": [ "005:84" ], "dataQuality": true, "rights": "Public", "modified": "2013-06-10", "publisher": { "@type": "org:Organization", "name": "Food and Nutrition Service" }, "keyword": [ "Children", "FNS", "Infants", "State Agencies", "Toll-Free", "WIC", "Women" ], "spatial": "United States" }, { "identifier": "USDA-FNS-130", "accessLevel": "public", "contactPoint": { "hasEmail": "mailto:webmaster@fns.usda.gov", "@type": "vcard:Contact", "fn": "FNS Webmaster" }, "programCode": [ "005:056" ], "description": "Trends in Supplemental Nutrition Assistance Program Participation Rates: Fiscal Year 2010 to Fiscal Year 2017 is the latest in a series on SNAP participation rates, which estimate the proportion of people eligible for benefits under Federal income and asset rules who actually participate in the program. This report presents rates for fiscal year (FY) 2017, comparing them to rates for FYs 2010 through 2016.", "title": "Trends in SNAP Participation Rates - Fiscal Year 2010 to Fiscal Year 2017", "distribution": [ { "@type": "dcat:Distribution", "downloadURL": "https://www.fns.usda.gov/sites/default/files/resource-files/Trends2010-2017.pdf", "mediaType": "application/pdf", "title": "Trends in Supplemental Nutrition Assistance Program Participation Rates: Fiscal Year 2010 to Fiscal Year 2017" } ], "license": "https://creativecommons.org/publicdomain/zero/1.0/", "bureauCode": [ "005:84" ], "modified": "2019-09-12", "publisher": { "@type": "org:Organization", "name": "Food and Nutrition Service" }, "keyword": [ "FNS", "Federal income", "SNAP", "SNAP participation rates", "USDA" ] }, { "identifier": "USDA-FNS-68", "accessLevel": "public", "contactPoint": { "hasEmail": "mailto:ITGB@fns.usda.gov", "@type": "vcard:Contact", "fn": "FNS Datasets" }, "programCode": [ "005:056" ], "description": "This report presents the estimated percentage of individuals eligible under federal SNAP income and asset rules who choose to participate in the program", "title": "Trends in SNAP Rates: Fiscal Year 2010 to Fiscal Year 2012 Report", "distribution": [ { "@type": "dcat:Distribution", "downloadURL": "http://www.fns.usda.gov/sites/default/files/ops/Trends2010-2012.pdf", "mediaType": "application/pdf", "title": "Trends in Supplemental Nutrition Assistance Program Participation Rates: Fiscal Year 2010 to Fiscal Year 2012 Report" } ], "license": "https://creativecommons.org/publicdomain/zero/1.0/", "bureauCode": [ "005:84" ], "dataQuality": true, "rights": "Public", "modified": "2014-07-14", "publisher": { "@type": "org:Organization", "name": "Food and Nutrition Service" }, "keyword": [ "Asset", "FNS", "Income", "SNAP", "USDA" ], "spatial": "United States" }, { "identifier": "USDA-FNS-114", "accessLevel": "public", "contactPoint": { "hasEmail": "mailto:ITGB@fns.usda.gov", "@type": "vcard:Contact", "fn": "FNS Datasets" }, "programCode": [ "005:055" ], "description": "This dataset provides cost of Food at Home at Four levels for the USDA Food Plans. The Food Plans represent a nutritious diet at four different cost levels. The nutritional bases of the Food Plans are the 1997- 2005 Dietary Reference Intakes, 2005 Dietary Guidelines for Americans, and 2005 MyPyramid food intake recommendations. In addition to cost, differences among plans are in specific foods and quantities of foods. Another basis of the Food Plans is that all meals and snacks are prepared at home. For specific foods and quantities of foods in the Food Plans, see Thrifty Food Plan, 2006 (2007) and The Low-Cost, Moderate-Cost, and Liberal Food Plans, 2007 (2007). All four Food Plans are based on 2001-02 data and updated to current dollars by using the Consumer Price Index for specific food items.", "title": "USDA Food Plans: Cost of Food report for JULY 2016", "distribution": [ { "accessURL": "http://www.cnpp.usda.gov/sites/default/files/CostofFoodJul2016.pdf", "@type": "dcat:Distribution", "format": "html", "title": "Official USDA Food Plans: Cost of Food at Home at Four Levels" } ], "license": "https://creativecommons.org/publicdomain/zero/1.0/", "bureauCode": [ "005:84" ], "dataQuality": true, "modified": "2016-08-15", "publisher": { "@type": "org:Organization", "name": "Food and Nutrition Service" }, "keyword": [ "Cost of Food", "Food Plans", "Liberal Food Plan", "Low-Cost Plan", "MyPyaramid", "Thrifty Food Plan" ] }, { "identifier": "USDA-FNS-76-2015", "accessLevel": "public", "contactPoint": { "hasEmail": "mailto:ITGB@fns.usda.gov", "@type": "vcard:Contact", "fn": "FNS Datasets" }, "programCode": [ "005:055" ], "description": "This memorandum explains the FNS policy that extends the flexibility regarding Meat/Meat Alternate (M/MA) maximums for the school year 2013-2014. This memo allows State agencies to assess compliance based on the minimum daily and weekly serving requirements only, therefore, they are able to exceed the limit on the number of ounces of M/MA that can be served in any given week as long as they are compliant with the calorie requirements of the new meal pattern.", "title": "USDA Foods Bone-in-Chicken Products Memo", "distribution": [ { "@type": "dcat:Distribution", "downloadURL": "http://www.fns.usda.gov/sites/default/files/pmfd129_Chicken.pdf", "format": "PDF", "description": "USDA Foods Bone-in-Chicken Products Memo", "mediaType": "application/pdf", "title": "USDA Foods Bone-in-Chicken Products Memo" } ], "license": "https://creativecommons.org/publicdomain/zero/1.0/", "bureauCode": [ "005:84" ], "dataQuality": true, "rights": "Public", "modified": "2013-03-07", "publisher": { "@type": "org:Organization", "name": "Food and Nutrition Service" }, "keyword": [ "Calorie Requirements", "Food and Nutrition Service", "Meat", "Meat Alternate", "Memo", "School" ] }, { "identifier": "USDA-FNS-116", "accessLevel": "public", "contactPoint": { "hasEmail": "mailto:ITGB@fns.usda.gov", "@type": "vcard:Contact", "fn": "FNS Datasets" }, "programCode": [ "005:055" ], "description": "This dataset provides the list of food available for 2016 for Commodity Supplemental Food Program.", "title": "USDA Foods available for 2017 for Commodity Supplemental Food Program", "distribution": [ { "accessURL": "http://www.fns.usda.gov/sites/default/files/csfp/CSFP-Foods-Available.pdf", "@type": "dcat:Distribution", "format": "pdf", "title": "USDA Foods available for 2017 for Commodity Supplemental Food Program" } ], "license": "https://creativecommons.org/publicdomain/zero/1.0/", "bureauCode": [ "005:84" ], "dataQuality": false, "modified": "2015-12-03", "publisher": { "@type": "org:Organization", "name": "Food and Nutrition Service" }, "keyword": [ "Commodity Supplemental Food Program", "FNS" ] }, { "identifier": "USDA-FNS-87", "accessLevel": "public", "contactPoint": { "hasEmail": "mailto:ITGB@fns.usda.gov", "@type": "vcard:Contact", "fn": "FNS Datasets" }, "programCode": [ "005:054" ], "description": "This data set explains the USDA's purpose of putting $5.7 million in training grants and other new resources to help schools serve healthier meals and snacks. The data set states how these efforts will help states expand and enhance training programs that help schools encourage kids to make healthy choices.", "title": "USDA Helps Schools Make Lunchrooms \"Smarter\" as Students Head Back to Class Notice", "distribution": [ { "accessURL": "http://www.fns.usda.gov/pressrelease/2014/fns-000614", "@type": "dcat:Distribution", "format": "html", "title": "USDA Helps Schools Make Lunchrooms \"Smarter\" as Students Head Back to Class Notice" } ], "license": "https://creativecommons.org/publicdomain/zero/1.0/", "bureauCode": [ "005:84" ], "dataQuality": true, "rights": "Public", "modified": "2014-08-21", "publisher": { "@type": "org:Organization", "name": "Food and Nutrition Service" }, "keyword": [ "Food and Nutrition Service", "Health", "Meals and Snacks", "Schools", "Training Grants", "USDA" ] }, { "identifier": "USDA-FNS-90", "accessLevel": "public", "contactPoint": { "hasEmail": "mailto:ITGB@fns.usda.gov", "@type": "vcard:Contact", "fn": "FNS Datasets" }, "programCode": [ "005:056" ], "description": "This report describes \"churning\" as a policy concern in regards to the Supplemental Nutrition Assistance Program (SNAP). “Churning” in the Supplemental Nutrition Assistance Program (SNAP) is defined as when a household exits SNAP and then re-enters the program within 4 months. Churning is a policy concern due to the financial and administrative burden incurred by both SNAP households and State agencies that administer SNAP. This study explores the circumstances of churning in SNAP by determining the rates and patterns of churn, examining the causes of caseload churn, and calculating costs of churn to both participants and administering agencies in six States.", "title": "Understanding the Rates, Causes, and Costs of Churning in the Supplemental Nutrition Assistance Program (SNAP)", "distribution": [ { "accessURL": "http://www.fns.usda.gov/sites/default/files/ops/SNAPChurning.pdf", "@type": "dcat:Distribution", "format": "PDF", "title": "Understanding the Rates, Causes, and Costs of Churning in the Supplemental Nutrition Assistance Program (SNAP)" } ], "license": "https://creativecommons.org/publicdomain/zero/1.0/", "bureauCode": [ "005:84" ], "dataQuality": true, "rights": "Public", "modified": "2014-11-24", "publisher": { "@type": "org:Organization", "name": "Food and Nutrition Service" }, "keyword": [ "Churning", "Food and Nutrition Service", "Policy", "SNAP", "cost", "rates and patterns", "states" ] }, { "identifier": "USDA-FNS-30", "accessLevel": "public", "contactPoint": { "hasEmail": "mailto:Tim.Kreh@fns.usda.gov", "@type": "vcard:Contact", "fn": "Tim Kreh" }, "programCode": [ "005:054" ], "description": "The Special Supplemental Nutrition Program for Women, Infants, and Children (WIC) is administered by the Food and Nutrition Service (FNS) of the U.S. Department of Agriculture (USDA). WIC benefits include nutritious supplemental foods; nutrition education; counseling, including breastfeeding promotion and support; and referrals to health care, social service, and other community providers for pregnant, breastfeeding, and postpartum women, infants, and children up to the age of 5 years. 1 For women and their unborn children, WIC seeks to improve fetal development and reduce the incidence of low birth weight, short gestation, and anemia through intervention during the prenatal period. For infants and children, WIC seeks to provide nutritious foods during critical times of growth and development in an effort to prevent health problems and to improve the health status of these children. The reports, including PC2012, contain information on a census of WIC participants in April of the reporting year.", "title": "WIC Participant and Program Characteristics 2012 Final Report", "distribution": [ { "@type": "dcat:Distribution", "downloadURL": "http://www.fns.usda.gov/sites/default/files/WICPC2012.pdf", "mediaType": "application/pdf", "title": "WIC Participant and Program Characteristics 2012 Final Report" } ], "license": "https://creativecommons.org/publicdomain/zero/1.0/", "bureauCode": [ "005:84" ], "dataQuality": true, "rights": "Public", "modified": "2013-12-01", "publisher": { "@type": "org:Organization", "name": "Food and Nutrition Service" }, "keyword": [ "FNS", "WIC", "children", "health problems", "infant" ], "spatial": "United States" }, { "identifier": "USDA-FNS-141", "accessLevel": "public", "contactPoint": { "hasEmail": "mailto:ITGB@usda.gov", "@type": "vcard:Contact", "fn": "FNS Datasets" }, "programCode": [ "005:056" ], "description": "WIC Participant and Program Characteristics 2018 (PC 2018) summarizes the demographic characteristics of participants in the Special Supplemental Nutrition Program for Women, Infants, and Children (WIC) nationwide in April 2018. It includes information on participant income and nutrition risk characteristics, estimates breastfeeding initiation rates for WIC infants, and describes WIC members of migrant farm-worker families.", "title": "WIC Participant and Program Characteristics 2018", "distribution": [ { "@type": "dcat:Distribution", "downloadURL": "https://fns-prod.azureedge.net/sites/default/files/resource-files/WICPC2018.pdf", "description": "WIC Participant and Program Characteristics 2018 (PC 2018) summarizes the demographic characteristics of participants in the Special Supplemental Nutrition Program for Women, Infants, and Children (WIC) nationwide in April 2018. It includes information on participant income and nutrition risk characteristics, estimates breastfeeding initiation rates for WIC infants, and describes WIC members of migrant farm-worker families.", "mediaType": "application/pdf", "title": "WIC Participant and Program Characteristics 2018" } ], "license": "https://creativecommons.org/publicdomain/zero/1.0/", "bureauCode": [ "005:84" ], "dataQuality": true, "rights": "Public", "modified": "2020-05-04", "publisher": { "@type": "org:Organization", "name": "Food and Nutrition Service" }, "keyword": [ "Infants", "Participant and Program Characteristics", "SNAP", "WIC", "Women", "and Children" ] }, { "identifier": "USDA-FNS-55", "accessLevel": "public", "contactPoint": { "hasEmail": "mailto:webmaster@fns.usda.gov", "@type": "vcard:Contact", "fn": "FNS Webmaster" }, "programCode": [ "005:055" ], "description": "Provides list of WIC state agencies by state agency name in an alphabetical order.", "title": "WIC State Agencies by state agency name", "distribution": [ { "accessURL": "http://www.fns.usda.gov/wic-state-agency-contacts", "@type": "dcat:Distribution", "title": "WIC State Agencies by state agency name" } ], "license": "https://creativecommons.org/publicdomain/zero/1.0/", "bureauCode": [ "005:84" ], "dataQuality": true, "rights": "Public", "modified": "2013-09-27", "publisher": { "@type": "org:Organization", "name": "Food and Nutrition Service" }, "keyword": [ "FNS", "State Agency", "WIC" ], "spatial": "United States" }, { "identifier": "USDA-FNS-50", "accessLevel": "public", "contactPoint": { "hasEmail": "mailto:ITGB@fns.usda.gov", "@type": "vcard:Contact", "fn": "FNS Datasets" }, "programCode": [ "005:054" ], "description": "The Emergency Food Assistance Program (TEFAP) is a U.S. Department of Agriculture (USDA) program that for three decades has helped supplement the diets of low-income Americans, including seniors, by providing them with emergency food and nutrition assistance at no cost. This white paper explains the program and describes some of its key results.", "title": "White Paper on the Emergency Food Assistance Program (TEFAP)", "distribution": [ { "@type": "dcat:Distribution", "downloadURL": "http://www.fns.usda.gov/sites/default/files/TEFAPWhitePaper.pdf", "mediaType": "application/pdf", "title": "White Paper on the Emergency Food Assistance Program (TEFAP)" } ], "license": "https://creativecommons.org/publicdomain/zero/1.0/", "bureauCode": [ "005:84" ], "dataQuality": true, "rights": "Public", "modified": "2013-08-21", "publisher": { "@type": "org:Organization", "name": "Food and Nutrition Service" }, "keyword": [ "FNS", "Nutrition Assistance", "TEFAP", "emergency food" ], "spatial": "United States" }, { "identifier": "USDA-FNS-28", "accessLevel": "public", "contactPoint": { "hasEmail": "mailto:webmaster@fns.usda.gov", "@type": "vcard:Contact", "fn": "FNS Webmaster" }, "programCode": [ "005:054" ], "description": "A summary of current WIC policy and regulatory citations that are specifically relevant to WIC Program operation during disaster situations, usually hurricanes, in which WIC participants have been evacuated from their homes and relocated to other areas within their home States, or to another State.", "title": "Women, Infants and Children (WIC) Detailed Policy Guidance in Disaster Situations", "distribution": [ { "@type": "dcat:Distribution", "downloadURL": "http://www.fns.usda.gov/wic/detailed-policy-guidance-disaster-situations", "mediaType": "text/html", "title": "WIC Detailed Policy Guidance in Disaster Situation" } ], "license": "https://creativecommons.org/publicdomain/zero/1.0/", "bureauCode": [ "005:84" ], "dataQuality": true, "rights": "Public", "modified": "2013-11-20", "publisher": { "@type": "org:Organization", "name": "Food and Nutrition Service" }, "keyword": [ "disaster", "guidance", "hurricanes", "state policy" ], "spatial": "United States" }, { "identifier": "USDA-FNS-57", "accessLevel": "public", "contactPoint": { "hasEmail": "mailto:Tim.Kreh@fns.usda.gov", "@type": "vcard:Contact", "fn": "Tim Kreh" }, "programCode": [ "005:055" ], "description": "On March 5, 2014, a Notice announcing revised WIC Income Eligibility Guidelines was published in the Federal Register. The adjusted income eligibility guidelines are used by State agencies in determining the income eligibility of persons applying to participate in the WIC Program. WIC State agencies must implement the new guidelines not later than July 1, 2014. WIC State agencies may implement the revised income guidelines at the same time States implement revised income eligibility guidelines for the Medicaid Program. On January 22, 2014, the U.S. Department of Health and Human Services (HHS) published its annual update of the poverty guidelines (79 FR 3593). The HHS guidelines are used by a number of Federal programs, including WIC and the Medicaid Program, as the basis for determining and updating program income eligibility limits.", "title": "Women, Infants and Children (WIC) Income Eligibility Guidelines 2014-2015", "distribution": [ { "@type": "dcat:Distribution", "downloadURL": "http://www.fns.usda.gov/wic/wic-income-eligibility-guidelines", "mediaType": "text/html", "title": "Women, Infants and Children (WIC) Income Eligibility Guidelines 2014-2015" } ], "license": "https://creativecommons.org/publicdomain/zero/1.0/", "bureauCode": [ "005:84" ], "dataQuality": true, "rights": "Public", "modified": "2014-08-04", "publisher": { "@type": "org:Organization", "name": "Food and Nutrition Service" }, "keyword": [ "FNS", "HHS", "Income Eligibility", "Medicaid Program", "State Agencies", "WIC" ], "spatial": "United States" }, { "identifier": "USDA-FNS-00007", "accessLevel": "public", "contactPoint": { "hasEmail": "mailto:Tim.Kreh@fns.usda.gov", "@type": "vcard:Contact", "fn": "Tim Kreh" }, "programCode": [ "005:054" ], "description": "This dataset contains monthly data for the current fiscal year for each WIC State agency. There are currently 90 WIC State agencies: the 50 geographic states, the District of Columbia, Puerto Rico, Guam, the Virgin Islands, American Samoa, Northern Marianas, and 34 Indian tribal organizations (ITO's). The dataset contains number of Pregnant Women, Breastfeeding Women, Postpartum Women, Total Women, Infants and children participating in the WIC program and the associated food and administrative cost.", "title": "Women, Infants, and Children (WIC) Participating and Cost Data", "distribution": [ { "@type": "dcat:Distribution", "downloadURL": "http://www.fns.usda.gov/sites/default/files/pd/27wilatest.xls", "mediaType": "application/vnd.ms-excel", "title": "Women, Infants, and Children (WIC) Participating and Cost Data" } ], "license": "https://creativecommons.org/licenses/by/4.0", "bureauCode": [ "005:84" ], "modified": "2014-12-23", "publisher": { "@type": "org:Organization", "name": "Food and Nutrition Service, Department of Agriculture" }, "accrualPeriodicity": "R/P3M", "keyword": [ "Children", "Cost", "Food", "Infants", "Nutrition", "Participation", "WIC", "Women" ], "spatial": "United States" }, { "contactPoint": { "hasEmail": "mailto:SM.FS.data@usda.gov", "@type": "vcard:Contact", "fn": "GTAC_Image_Services" }, "description": "A digital orthophoto is a georeferenced image prepared from aerial imagery, or other remotely-sensed data in which the displacement within the image due to sensor orientation and terrain relief has been removed. Orthophotos combine the characteristics of an image with the geometric qualities of a map. Orthoimages show ground features such as roads, buildings, and streams in their proper positions, without the distortion characteristic of unrectified aerial imagery. Digital orthoimages produced and used within the Forest Service are developed from imagery acquired through various national and regional image acquisition programs. The resulting orthoimages, also known as orthomaps, can be directly applied in remote sensing, GIS and mapping applications. They serve a variety of purposes, from interim maps to references for earth science investigations and analysis. Because of the orthographic property, an orthoimage can be used like a map for measurement of distances, angles, and areas with scale being constant everywhere. Also, they can be used as map layers in GIS or other computer-based manipulation, overlaying, and analysis. An orthoimage differs from a map in a manner of depiction of detail; on a map only selected detail is shown by conventional symbols, whereas on an orthoimage all details appear just as in original aerial or satellite imagery.", "title": "AZ Apache NF Horton PostFire 2021", "distribution": [ { "accessURL": "https://www.arcgis.com/sharing/rest/content/items/759d6a6a1df24395b228a7d10a656bfb/info/metadata/metadata.xml?format=iso19139", "@type": "dcat:Distribution", "mediaType": "text/xml", "conformsTo": "https://www.isotc211.org/2005/gmi", "title": "ISO-19139 metadata" }, { "accessURL": "https://data-usfs.hub.arcgis.com/datasets/usfs::az-apache-nf-horton-postfire-2021", "@type": "dcat:Distribution", "format": "Web Page", "mediaType": "text/html", "title": "ArcGIS Hub Dataset" }, { "accessURL": "https://apps.fs.usda.gov/fsgisx04/rest/services/ResourcePhoto_Region03/AZ_Apache_NF_Horton_PostFire_2021/ImageServer", "@type": "dcat:Distribution", "format": "ArcGIS GeoServices REST API", "mediaType": "application/json", "title": "ArcGIS GeoService" } ], "bureauCode": [ "005:96" ], "modified": "2024-03-14", "theme": [ "geospatial" ], "keyword": [ "R3", "R 03", "Region 03", "Region 3", "NM", "New Mexico", "AZ", "Arizona", "Photogrammetry", "Remote sensing", "Resource Photography", "Open Data" ], "spatial": "-109.3772,33.6232,-109.2477,33.7518", "issued": "2023-12-27", "identifier": "https://www.arcgis.com/home/item.html?id=759d6a6a1df24395b228a7d10a656bfb", "accessLevel": "public", "programCode": [ "005:059" ], "landingPage": "https://data-usfs.hub.arcgis.com/datasets/usfs::az-apache-nf-horton-postfire-2021", "license": "https://creativecommons.org/licenses/by/4.0/", "publisher": { "name": "U.S. Forest Service" } }, { "contactPoint": { "hasEmail": "mailto:SM.FS.data@usda.gov", "@type": "vcard:Contact", "fn": "GTAC_Image_Services" }, "description": "A digital orthophoto is a georeferenced image prepared from aerial imagery, or other remotely-sensed data in which the displacement within the image due to sensor orientation and terrain relief has been removed. Orthophotos combine the characteristics of an image with the geometric qualities of a map. Orthoimages show ground features such as roads, buildings, and streams in their proper positions, without the distortion characteristic of unrectified aerial imagery. Digital orthoimages produced and used within the Forest Service are developed from imagery acquired through various national and regional image acquisition programs. The resulting orthoimages, also known as orthomaps, can be directly applied in remote sensing, GIS and mapping applications. They serve a variety of purposes, from interim maps to references for earth science investigations and analysis. Because of the orthographic property, an orthoimage can be used like a map for measurement of distances, angles, and areas with scale being constant everywhere. Also, they can be used as map layers in GIS or other computer-based manipulation, overlaying, and analysis. An orthoimage differs from a map in a manner of depiction of detail; on a map only selected detail is shown by conventional symbols, whereas on an orthoimage all details appear just as in original aerial or satellite imagery.", "title": "AZ Apache Sitgreaves NF 25cm 1968", "distribution": [ { "accessURL": "https://www.arcgis.com/sharing/rest/content/items/c116db3daf604907baafd5e3db056b00/info/metadata/metadata.xml?format=iso19139", "@type": "dcat:Distribution", "mediaType": "text/xml", "conformsTo": "https://www.isotc211.org/2005/gmi", "title": "ISO-19139 metadata" }, { "accessURL": "https://data-usfs.hub.arcgis.com/datasets/usfs::az-apache-sitgreaves-nf-25cm-1968", "@type": "dcat:Distribution", "format": "Web Page", "mediaType": "text/html", "title": "ArcGIS Hub Dataset" }, { "accessURL": "https://apps.fs.usda.gov/fsgisx04/rest/services/ResourcePhoto_Region03/AZ_Apache_Sitgreaves_NF_25cm_1968/ImageServer", "@type": "dcat:Distribution", "format": "ArcGIS GeoServices REST API", "mediaType": "application/json", "title": "ArcGIS GeoService" } ], "bureauCode": [ "005:96" ], "modified": "2024-03-14", "theme": [ "geospatial" ], "keyword": [ "R3", "R 03", "Region 03", "Region 3", "NM", "New Mexico", "AZ", "Arizona", "Photogrammetry", "Remote sensing", "Resource Photography", "Open Data" ], "spatial": "-111.1351,32.8862,-108.1743,34.8090", "issued": "2023-12-27", "identifier": "https://www.arcgis.com/home/item.html?id=c116db3daf604907baafd5e3db056b00", "accessLevel": "public", "programCode": [ "005:059" ], "landingPage": "https://data-usfs.hub.arcgis.com/datasets/usfs::az-apache-sitgreaves-nf-25cm-1968", "license": "https://creativecommons.org/licenses/by/4.0/", "publisher": { "name": "U.S. Forest Service" } }, { "contactPoint": { "hasEmail": "mailto:SM.FS.data@usda.gov", "@type": "vcard:Contact", "fn": "GTAC_Image_Services" }, "description": "A digital orthophoto is a georeferenced image prepared from aerial imagery, or other remotely-sensed data in which the displacement within the image due to sensor orientation and terrain relief has been removed. Orthophotos combine the characteristics of an image with the geometric qualities of a map. Orthoimages show ground features such as roads, buildings, and streams in their proper positions, without the distortion characteristic of unrectified aerial imagery. Digital orthoimages produced and used within the Forest Service are developed from imagery acquired through various national and regional image acquisition programs. The resulting orthoimages, also known as orthomaps, can be directly applied in remote sensing, GIS and mapping applications. They serve a variety of purposes, from interim maps to references for earth science investigations and analysis. Because of the orthographic property, an orthoimage can be used like a map for measurement of distances, angles, and areas with scale being constant everywhere. Also, they can be used as map layers in GIS or other computer-based manipulation, overlaying, and analysis. An orthoimage differs from a map in a manner of depiction of detail; on a map only selected detail is shown by conventional symbols, whereas on an orthoimage all details appear just as in original aerial or satellite imagery.", "title": "AZ Apache Sitgreaves NF 25cm 1968", "distribution": [ { "accessURL": "https://www.arcgis.com/sharing/rest/content/items/c116db3daf604907baafd5e3db056b00/info/metadata/metadata.xml?format=iso19139", "@type": "dcat:Distribution", "mediaType": "text/xml", "conformsTo": "https://www.isotc211.org/2005/gmi", "title": "ISO-19139 metadata" }, { "accessURL": "https://data-usfs.hub.arcgis.com/datasets/usfs::az-apache-sitgreaves-nf-25cm-1968", "@type": "dcat:Distribution", "format": "Web Page", "mediaType": "text/html", "title": "ArcGIS Hub Dataset" }, { "accessURL": "https://apps.fs.usda.gov/fsgisx04/rest/services/ResourcePhoto_Region03/AZ_Apache_Sitgreaves_NF_25cm_1968/ImageServer", "@type": "dcat:Distribution", "format": "ArcGIS GeoServices REST API", "mediaType": "application/json", "title": "ArcGIS GeoService" } ], "bureauCode": [ "005:96" ], "modified": "2024-03-14", "theme": [ "geospatial" ], "keyword": [ "R3", "R 03", "Region 03", "Region 3", "NM", "New Mexico", "AZ", "Arizona", "Photogrammetry", "Remote sensing", "Resource Photography", "Open Data" ], "spatial": "-111.1351,32.8862,-108.1743,34.8090", "issued": "2023-12-27", "identifier": "https://www.arcgis.com/home/item.html?id=c116db3daf604907baafd5e3db056b00", "accessLevel": "public", "programCode": [ "005:059" ], "landingPage": "https://data-usfs.hub.arcgis.com/datasets/usfs::az-apache-sitgreaves-nf-25cm-1968", "license": "https://creativecommons.org/licenses/by/4.0/", "publisher": { "name": "U.S. Forest Service" } }, { "contactPoint": { "hasEmail": "mailto:SM.FS.data@usda.gov", "@type": "vcard:Contact", "fn": "GTAC_Image_Services" }, "description": "A digital orthophoto is a georeferenced image prepared from aerial imagery, or other remotely-sensed data in which the displacement within the image due to sensor orientation and terrain relief has been removed. Orthophotos combine the characteristics of an image with the geometric qualities of a map. Orthoimages show ground features such as roads, buildings, and streams in their proper positions, without the distortion characteristic of unrectified aerial imagery. Digital orthoimages produced and used within the Forest Service are developed from imagery acquired through various national and regional image acquisition programs. The resulting orthoimages, also known as orthomaps, can be directly applied in remote sensing, GIS and mapping applications. They serve a variety of purposes, from interim maps to references for earth science investigations and analysis. Because of the orthographic property, an orthoimage can be used like a map for measurement of distances, angles, and areas with scale being constant everywhere. Also, they can be used as map layers in GIS or other computer-based manipulation, overlaying, and analysis. An orthoimage differs from a map in a manner of depiction of detail; on a map only selected detail is shown by conventional symbols, whereas on an orthoimage all details appear just as in original aerial or satellite imagery.", "title": "AZ Coconino NF Slate PostFire 2021", "distribution": [ { "accessURL": "https://www.arcgis.com/sharing/rest/content/items/4c19979c21ad499bbbd9fc21da6a6736/info/metadata/metadata.xml?format=iso19139", "@type": "dcat:Distribution", "mediaType": "text/xml", "conformsTo": "https://www.isotc211.org/2005/gmi", "title": "ISO-19139 metadata" }, { "accessURL": "https://data-usfs.hub.arcgis.com/datasets/usfs::az-coconino-nf-slate-postfire-2021", "@type": "dcat:Distribution", "format": "Web Page", "mediaType": "text/html", "title": "ArcGIS Hub Dataset" }, { "accessURL": "https://apps.fs.usda.gov/fsgisx04/rest/services/ResourcePhoto_Region03/AZ_Coconino_NF_Slate_PostFire_2021/ImageServer", "@type": "dcat:Distribution", "format": "ArcGIS GeoServices REST API", "mediaType": "application/json", "title": "ArcGIS GeoService" } ], "bureauCode": [ "005:96" ], "modified": "2024-03-14", "theme": [ "geospatial" ], "keyword": [ "R3", "R 03", "Region 03", "Region 3", "NM", "New Mexico", "AZ", "Arizona", "Photogrammetry", "Remote sensing", "Resource Photography", "Open Data" ], "spatial": "-111.8770,35.4672,-111.6856,35.5641", "issued": "2023-12-27", "identifier": "https://www.arcgis.com/home/item.html?id=4c19979c21ad499bbbd9fc21da6a6736", "accessLevel": "public", "programCode": [ "005:059" ], "landingPage": "https://data-usfs.hub.arcgis.com/datasets/usfs::az-coconino-nf-slate-postfire-2021", "license": "https://creativecommons.org/licenses/by/4.0/", "publisher": { "name": "U.S. Forest Service" } }, { "contactPoint": { "hasEmail": "mailto:SM.FS.data@usda.gov", "@type": "vcard:Contact", "fn": "GTAC_Image_Services" }, "description": "A digital orthophoto is a georeferenced image prepared from aerial imagery, or other remotely-sensed data in which the displacement within the image due to sensor orientation and terrain relief has been removed. Orthophotos combine the characteristics of an image with the geometric qualities of a map. Orthoimages show ground features such as roads, buildings, and streams in their proper positions, without the distortion characteristic of unrectified aerial imagery. Digital orthoimages produced and used within the Forest Service are developed from imagery acquired through various national and regional image acquisition programs. The resulting orthoimages, also known as orthomaps, can be directly applied in remote sensing, GIS and mapping applications. They serve a variety of purposes, from interim maps to references for earth science investigations and analysis. Because of the orthographic property, an orthoimage can be used like a map for measurement of distances, angles, and areas with scale being constant everywhere. Also, they can be used as map layers in GIS or other computer-based manipulation, overlaying, and analysis. An orthoimage differs from a map in a manner of depiction of detail; on a map only selected detail is shown by conventional symbols, whereas on an orthoimage all details appear just as in original aerial or satellite imagery.", "title": "AZ Coronado NF 25cm 1966", "distribution": [ { "accessURL": "https://www.arcgis.com/sharing/rest/content/items/413d015b4f0d47548f2b9f19ce72f14b/info/metadata/metadata.xml?format=iso19139", "@type": "dcat:Distribution", "mediaType": "text/xml", "conformsTo": "https://www.isotc211.org/2005/gmi", "title": "ISO-19139 metadata" }, { "accessURL": "https://data-usfs.hub.arcgis.com/datasets/usfs::az-coronado-nf-25cm-1966", "@type": "dcat:Distribution", "format": "Web Page", "mediaType": "text/html", "title": "ArcGIS Hub Dataset" }, { "accessURL": "https://apps.fs.usda.gov/fsgisx04/rest/services/ResourcePhoto_Region03/AZ_Coronado_NF_25cm_1966/ImageServer", "@type": "dcat:Distribution", "format": "ArcGIS GeoServices REST API", "mediaType": "application/json", "title": "ArcGIS GeoService" } ], "bureauCode": [ "005:96" ], "modified": "2024-03-14", "theme": [ "geospatial" ], "keyword": [ "R3", "R 03", "Region 03", "Region 3", "NM", "New Mexico", "AZ", "Arizona", "Photogrammetry", "Remote sensing", "Resource Photography", "Open Data" ], "spatial": "-111.0072,31.7146,-109.6766,33.1231", "issued": "2023-12-27", "identifier": "https://www.arcgis.com/home/item.html?id=413d015b4f0d47548f2b9f19ce72f14b", "accessLevel": "public", "programCode": [ "005:059" ], "landingPage": "https://data-usfs.hub.arcgis.com/datasets/usfs::az-coronado-nf-25cm-1966", "license": "https://creativecommons.org/licenses/by/4.0/", "publisher": { "name": "U.S. Forest Service" } }, { "contactPoint": { "hasEmail": "mailto:SM.FS.data@usda.gov", "@type": "vcard:Contact", "fn": "GTAC_Image_Services" }, "description": "A digital orthophoto is a georeferenced image prepared from aerial imagery, or other remotely-sensed data in which the displacement within the image due to sensor orientation and terrain relief has been removed. Orthophotos combine the characteristics of an image with the geometric qualities of a map. Orthoimages show ground features such as roads, buildings, and streams in their proper positions, without the distortion characteristic of unrectified aerial imagery. Digital orthoimages produced and used within the Forest Service are developed from imagery acquired through various national and regional image acquisition programs. The resulting orthoimages, also known as orthomaps, can be directly applied in remote sensing, GIS and mapping applications. They serve a variety of purposes, from interim maps to references for earth science investigations and analysis. Because of the orthographic property, an orthoimage can be used like a map for measurement of distances, angles, and areas with scale being constant everywhere. Also, they can be used as map layers in GIS or other computer-based manipulation, overlaying, and analysis. An orthoimage differs from a map in a manner of depiction of detail; on a map only selected detail is shown by conventional symbols, whereas on an orthoimage all details appear just as in original aerial or satellite imagery.", "title": "AZ Coronado NF Pinnacle PostFire 2021", "distribution": [ { "accessURL": "https://www.arcgis.com/sharing/rest/content/items/01c838ca52e142d7b8033e6e7a39d7bb/info/metadata/metadata.xml?format=iso19139", "@type": "dcat:Distribution", "mediaType": "text/xml", "conformsTo": "https://www.isotc211.org/2005/gmi", "title": "ISO-19139 metadata" }, { "accessURL": "https://data-usfs.hub.arcgis.com/datasets/usfs::az-coronado-nf-pinnacle-postfire-2021", "@type": "dcat:Distribution", "format": "Web Page", "mediaType": "text/html", "title": "ArcGIS Hub Dataset" }, { "accessURL": "https://apps.fs.usda.gov/fsgisx04/rest/services/ResourcePhoto_Region03/AZ_Coronado_NF_Pinnacle_PostFire_2021/ImageServer", "@type": "dcat:Distribution", "format": "ArcGIS GeoServices REST API", "mediaType": "application/json", "title": "ArcGIS GeoService" } ], "bureauCode": [ "005:96" ], "modified": "2024-03-14", "theme": [ "geospatial" ], "keyword": [ "R3", "R 03", "Region 03", "Region 3", "NM", "New Mexico", "AZ", "Arizona", "Photogrammetry", "Remote sensing", "Resource Photography", "Open Data" ], "spatial": "-110.3456,32.7797,-110.0918,32.9703", "issued": "2023-12-27", "identifier": "https://www.arcgis.com/home/item.html?id=01c838ca52e142d7b8033e6e7a39d7bb", "accessLevel": "public", "programCode": [ "005:059" ], "landingPage": "https://data-usfs.hub.arcgis.com/datasets/usfs::az-coronado-nf-pinnacle-postfire-2021", "license": "https://creativecommons.org/licenses/by/4.0/", "publisher": { "name": "U.S. Forest Service" } }, { "contactPoint": { "hasEmail": "mailto:SM.FS.data@usda.gov", "@type": "vcard:Contact", "fn": "GTAC_Image_Services" }, "description": "A digital orthophoto is a georeferenced image prepared from aerial imagery, or other remotely-sensed data in which the displacement within the image due to sensor orientation and terrain relief has been removed. Orthophotos combine the characteristics of an image with the geometric qualities of a map. Orthoimages show ground features such as roads, buildings, and streams in their proper positions, without the distortion characteristic of unrectified aerial imagery. Digital orthoimages produced and used within the Forest Service are developed from imagery acquired through various national and regional image acquisition programs. The resulting orthoimages, also known as orthomaps, can be directly applied in remote sensing, GIS and mapping applications. They serve a variety of purposes, from interim maps to references for earth science investigations and analysis. Because of the orthographic property, an orthoimage can be used like a map for measurement of distances, angles, and areas with scale being constant everywhere. Also, they can be used as map layers in GIS or other computer-based manipulation, overlaying, and analysis. An orthoimage differs from a map in a manner of depiction of detail; on a map only selected detail is shown by conventional symbols, whereas on an orthoimage all details appear just as in original aerial or satellite imagery.", "title": "AZ Kaibab NF 25cm 1956", "distribution": [ { "accessURL": "https://www.arcgis.com/sharing/rest/content/items/d17af767055447bf94b056b1ef6a9b35/info/metadata/metadata.xml?format=iso19139", "@type": "dcat:Distribution", "mediaType": "text/xml", "conformsTo": "https://www.isotc211.org/2005/gmi", "title": "ISO-19139 metadata" }, { "accessURL": "https://data-usfs.hub.arcgis.com/datasets/usfs::az-kaibab-nf-25cm-1956", "@type": "dcat:Distribution", "format": "Web Page", "mediaType": "text/html", "title": "ArcGIS Hub Dataset" }, { "accessURL": "https://apps.fs.usda.gov/fsgisx04/rest/services/ResourcePhoto_Region03/AZ_Kaibab_NF_25cm_1956/ImageServer", "@type": "dcat:Distribution", "format": "ArcGIS GeoServices REST API", "mediaType": "application/json", "title": "ArcGIS GeoService" } ], "bureauCode": [ "005:96" ], "modified": "2024-03-14", "theme": [ "geospatial" ], "keyword": [ "R3", "R 03", "Region 03", "Region 3", "NM", "New Mexico", "AZ", "Arizona", "Photogrammetry", "Remote sensing", "Resource Photography", "Open Data" ], "spatial": "-112.6892,36.2801,-111.8424,36.9074", "issued": "2023-12-27", "identifier": "https://www.arcgis.com/home/item.html?id=d17af767055447bf94b056b1ef6a9b35", "accessLevel": "public", "programCode": [ "005:059" ], "landingPage": "https://data-usfs.hub.arcgis.com/datasets/usfs::az-kaibab-nf-25cm-1956", "license": "https://creativecommons.org/licenses/by/4.0/", "publisher": { "name": "U.S. Forest Service" } }, { "contactPoint": { "hasEmail": "mailto:SM.FS.data@usda.gov", "@type": "vcard:Contact", "fn": "GTAC_Image_Services" }, "description": "A digital orthophoto is a georeferenced image prepared from aerial imagery, or other remotely-sensed data in which the displacement within the image due to sensor orientation and terrain relief has been removed. Orthophotos combine the characteristics of an image with the geometric qualities of a map. Orthoimages show ground features such as roads, buildings, and streams in their proper positions, without the distortion characteristic of unrectified aerial imagery. Digital orthoimages produced and used within the Forest Service are developed from imagery acquired through various national and regional image acquisition programs. The resulting orthoimages, also known as orthomaps, can be directly applied in remote sensing, GIS and mapping applications. They serve a variety of purposes, from interim maps to references for earth science investigations and analysis. Because of the orthographic property, an orthoimage can be used like a map for measurement of distances, angles, and areas with scale being constant everywhere. Also, they can be used as map layers in GIS or other computer-based manipulation, overlaying, and analysis. An orthoimage differs from a map in a manner of depiction of detail; on a map only selected detail is shown by conventional symbols, whereas on an orthoimage all details appear just as in original aerial or satellite imagery.", "title": "AZ Multiple NFs Backbone PostFire 2021", "distribution": [ { "accessURL": "https://www.arcgis.com/sharing/rest/content/items/62e5410ed95b45b1bef6d6a571871304/info/metadata/metadata.xml?format=iso19139", "@type": "dcat:Distribution", "mediaType": "text/xml", "conformsTo": "https://www.isotc211.org/2005/gmi", "title": "ISO-19139 metadata" }, { "accessURL": "https://data-usfs.hub.arcgis.com/datasets/usfs::az-multiple-nfs-backbone-postfire-2021", "@type": "dcat:Distribution", "format": "Web Page", "mediaType": "text/html", "title": "ArcGIS Hub Dataset" }, { "accessURL": "https://apps.fs.usda.gov/fsgisx04/rest/services/ResourcePhoto_Region03/AZ_Multiple_NFs_Backbone_PostFire_2021/ImageServer", "@type": "dcat:Distribution", "format": "ArcGIS GeoServices REST API", "mediaType": "application/json", "title": "ArcGIS GeoService" } ], "bureauCode": [ "005:96" ], "modified": "2024-03-14", "theme": [ "geospatial" ], "keyword": [ "R3", "R 03", "Region 03", "Region 3", "NM", "New Mexico", "AZ", "Arizona", "Photogrammetry", "Remote sensing", "Resource Photography", "Open Data" ], "spatial": "-111.8145,34.2797,-111.4045,34.5327", "issued": "2023-12-27", "identifier": "https://www.arcgis.com/home/item.html?id=62e5410ed95b45b1bef6d6a571871304", "accessLevel": "public", "programCode": [ "005:059" ], "landingPage": "https://data-usfs.hub.arcgis.com/datasets/usfs::az-multiple-nfs-backbone-postfire-2021", "license": "https://creativecommons.org/licenses/by/4.0/", "publisher": { "name": "U.S. Forest Service" } }, { "contactPoint": { "hasEmail": "mailto:SM.FS.data@usda.gov", "@type": "vcard:Contact", "fn": "GTAC_Image_Services" }, "description": "A digital orthophoto is a georeferenced image prepared from aerial imagery, or other remotely-sensed data in which the displacement within the image due to sensor orientation and terrain relief has been removed. Orthophotos combine the characteristics of an image with the geometric qualities of a map. Orthoimages show ground features such as roads, buildings, and streams in their proper positions, without the distortion characteristic of unrectified aerial imagery. Digital orthoimages produced and used within the Forest Service are developed from imagery acquired through various national and regional image acquisition programs. The resulting orthoimages, also known as orthomaps, can be directly applied in remote sensing, GIS and mapping applications. They serve a variety of purposes, from interim maps to references for earth science investigations and analysis. Because of the orthographic property, an orthoimage can be used like a map for measurement of distances, angles, and areas with scale being constant everywhere. Also, they can be used as map layers in GIS or other computer-based manipulation, overlaying, and analysis. An orthoimage differs from a map in a manner of depiction of detail; on a map only selected detail is shown by conventional symbols, whereas on an orthoimage all details appear just as in original aerial or satellite imagery.", "title": "AZ Multiple NFs Rafael PostFire 2021", "distribution": [ { "accessURL": "https://www.arcgis.com/sharing/rest/content/items/633be890980a4c3cbbd96bd6eff874dc/info/metadata/metadata.xml?format=iso19139", "@type": "dcat:Distribution", "mediaType": "text/xml", "conformsTo": "https://www.isotc211.org/2005/gmi", "title": "ISO-19139 metadata" }, { "accessURL": "https://data-usfs.hub.arcgis.com/datasets/usfs::az-multiple-nfs-rafael-postfire-2021", "@type": "dcat:Distribution", "format": "Web Page", "mediaType": "text/html", "title": "ArcGIS Hub Dataset" }, { "accessURL": "https://apps.fs.usda.gov/fsgisx04/rest/services/ResourcePhoto_Region03/AZ_Multiple_NFs_Rafael_PostFire_2021/ImageServer", "@type": "dcat:Distribution", "format": "ArcGIS GeoServices REST API", "mediaType": "application/json", "title": "ArcGIS GeoService" } ], "bureauCode": [ "005:96" ], "modified": "2024-03-14", "theme": [ "geospatial" ], "keyword": [ "R3", "R 03", "Region 03", "Region 3", "NM", "New Mexico", "AZ", "Arizona", "Photogrammetry", "Remote sensing", "Resource Photography", "Open Data" ], "spatial": "-112.1896,34.9046,-111.8418,35.1891", "issued": "2023-12-27", "identifier": "https://www.arcgis.com/home/item.html?id=633be890980a4c3cbbd96bd6eff874dc", "accessLevel": "public", "programCode": [ "005:059" ], "landingPage": "https://data-usfs.hub.arcgis.com/datasets/usfs::az-multiple-nfs-rafael-postfire-2021", "license": "https://creativecommons.org/licenses/by/4.0/", "publisher": { "name": "U.S. Forest Service" } }, { "contactPoint": { "hasEmail": "mailto:SM.FS.data@usda.gov", "@type": "vcard:Contact", "fn": "GTAC_Image_Services" }, "description": "A digital orthophoto is a georeferenced image prepared from aerial imagery, or other remotely-sensed data in which the displacement within the image due to sensor orientation and terrain relief has been removed. Orthophotos combine the characteristics of an image with the geometric qualities of a map. Orthoimages show ground features such as roads, buildings, and streams in their proper positions, without the distortion characteristic of unrectified aerial imagery. Digital orthoimages produced and used within the Forest Service are developed from imagery acquired through various national and regional image acquisition programs. The resulting orthoimages, also known as orthomaps, can be directly applied in remote sensing, GIS and mapping applications. They serve a variety of purposes, from interim maps to references for earth science investigations and analysis. Because of the orthographic property, an orthoimage can be used like a map for measurement of distances, angles, and areas with scale being constant everywhere. Also, they can be used as map layers in GIS or other computer-based manipulation, overlaying, and analysis. An orthoimage differs from a map in a manner of depiction of detail; on a map only selected detail is shown by conventional symbols, whereas on an orthoimage all details appear just as in original aerial or satellite imagery.", "title": "AZ Prescott NF 25cm 1968", "distribution": [ { "accessURL": "https://www.arcgis.com/sharing/rest/content/items/8ef8578292a940d29d009a61bcba561f/info/metadata/metadata.xml?format=iso19139", "@type": "dcat:Distribution", "mediaType": "text/xml", "conformsTo": "https://www.isotc211.org/2005/gmi", "title": "ISO-19139 metadata" }, { "accessURL": "https://data-usfs.hub.arcgis.com/datasets/usfs::az-prescott-nf-25cm-1968", "@type": "dcat:Distribution", "format": "Web Page", "mediaType": "text/html", "title": "ArcGIS Hub Dataset" }, { "accessURL": "https://apps.fs.usda.gov/fsgisx04/rest/services/ResourcePhoto_Region03/AZ_Prescott_NF_25cm_1968/ImageServer", "@type": "dcat:Distribution", "format": "ArcGIS GeoServices REST API", "mediaType": "application/json", "title": "ArcGIS GeoService" } ], "bureauCode": [ "005:96" ], "modified": "2024-03-14", "theme": [ "geospatial" ], "keyword": [ "R3", "R 03", "Region 03", "Region 3", "NM", "New Mexico", "AZ", "Arizona", "Photogrammetry", "Remote sensing", "Resource Photography", "Open Data" ], "spatial": "-113.0956,34.0613,-111.7175,35.2201", "issued": "2023-12-27", "identifier": "https://www.arcgis.com/home/item.html?id=8ef8578292a940d29d009a61bcba561f", "accessLevel": "public", "programCode": [ "005:059" ], "landingPage": "https://data-usfs.hub.arcgis.com/datasets/usfs::az-prescott-nf-25cm-1968", "license": "https://creativecommons.org/licenses/by/4.0/", "publisher": { "name": "U.S. Forest Service" } }, { "contactPoint": { "hasEmail": "mailto:SM.FS.data@usda.gov", "@type": "vcard:Contact", "fn": "GTAC_Image_Services" }, "description": "A digital orthophoto is a georeferenced image prepared from aerial imagery, or other remotely-sensed data in which the displacement within the image due to sensor orientation and terrain relief has been removed. Orthophotos combine the characteristics of an image with the geometric qualities of a map. Orthoimages show ground features such as roads, buildings, and streams in their proper positions, without the distortion characteristic of unrectified aerial imagery. Digital orthoimages produced and used within the Forest Service are developed from imagery acquired through various national and regional image acquisition programs. The resulting orthoimages, also known as orthomaps, can be directly applied in remote sensing, GIS and mapping applications. They serve a variety of purposes, from interim maps to references for earth science investigations and analysis. Because of the orthographic property, an orthoimage can be used like a map for measurement of distances, angles, and areas with scale being constant everywhere. Also, they can be used as map layers in GIS or other computer-based manipulation, overlaying, and analysis. An orthoimage differs from a map in a manner of depiction of detail; on a map only selected detail is shown by conventional symbols, whereas on an orthoimage all details appear just as in original aerial or satellite imagery.", "title": "AZ Prescott NF Crooks PostFire 30cm 2022 4band", "distribution": [ { "accessURL": "https://www.arcgis.com/sharing/rest/content/items/70e0e0c5d07b4f0bb90f265745118041/info/metadata/metadata.xml?format=iso19139", "@type": "dcat:Distribution", "mediaType": "text/xml", "conformsTo": "https://www.isotc211.org/2005/gmi", "title": "ISO-19139 metadata" }, { "accessURL": "https://data-usfs.hub.arcgis.com/datasets/usfs::az-prescott-nf-crooks-postfire-30cm-2022-4band", "@type": "dcat:Distribution", "format": "Web Page", "mediaType": "text/html", "title": "ArcGIS Hub Dataset" }, { "accessURL": "https://apps.fs.usda.gov/fsgisx04/rest/services/ResourcePhoto_Region03/AZ_Prescott_NF_Crooks_PostFire_30cm_2022_4band/ImageServer", "@type": "dcat:Distribution", "format": "ArcGIS GeoServices REST API", "mediaType": "application/json", "title": "ArcGIS GeoService" } ], "bureauCode": [ "005:96" ], "modified": "2024-03-14", "theme": [ "geospatial" ], "keyword": [ "R3", "R 03", "Region 03", "Region 3", "NM", "New Mexico", "AZ", "Arizona", "Photogrammetry", "Remote sensing", "Resource Photography", "Open Data" ], "spatial": "-112.5016,34.3113,-112.3735,34.4387", "issued": "2023-12-27", "identifier": "https://www.arcgis.com/home/item.html?id=70e0e0c5d07b4f0bb90f265745118041", "accessLevel": "public", "programCode": [ "005:059" ], "landingPage": "https://data-usfs.hub.arcgis.com/datasets/usfs::az-prescott-nf-crooks-postfire-30cm-2022-4band", "license": "https://creativecommons.org/licenses/by/4.0/", "publisher": { "name": "U.S. Forest Service" } }, { "contactPoint": { "hasEmail": "mailto:SM.FS.data@usda.gov", "@type": "vcard:Contact", "fn": "GTAC_Image_Services" }, "description": "A digital orthophoto is a georeferenced image prepared from aerial imagery, or other remotely-sensed data in which the displacement within the image due to sensor orientation and terrain relief has been removed. Orthophotos combine the characteristics of an image with the geometric qualities of a map. Orthoimages show ground features such as roads, buildings, and streams in their proper positions, without the distortion characteristic of unrectified aerial imagery. Digital orthoimages produced and used within the Forest Service are developed from imagery acquired through various national and regional image acquisition programs. The resulting orthoimages, also known as orthomaps, can be directly applied in remote sensing, GIS and mapping applications. They serve a variety of purposes, from interim maps to references for earth science investigations and analysis. Because of the orthographic property, an orthoimage can be used like a map for measurement of distances, angles, and areas with scale being constant everywhere. Also, they can be used as map layers in GIS or other computer-based manipulation, overlaying, and analysis. An orthoimage differs from a map in a manner of depiction of detail; on a map only selected detail is shown by conventional symbols, whereas on an orthoimage all details appear just as in original aerial or satellite imagery.", "title": "AZ Tonto 25cm 1958 1959", "distribution": [ { "accessURL": "https://www.arcgis.com/sharing/rest/content/items/e5d356cb6734447789bbd4414b7dbf7f/info/metadata/metadata.xml?format=iso19139", "@type": "dcat:Distribution", "mediaType": "text/xml", "conformsTo": "https://www.isotc211.org/2005/gmi", "title": "ISO-19139 metadata" }, { "accessURL": "https://data-usfs.hub.arcgis.com/datasets/usfs::az-tonto-25cm-1958-1959", "@type": "dcat:Distribution", "format": "Web Page", "mediaType": "text/html", "title": "ArcGIS Hub Dataset" }, { "accessURL": "https://apps.fs.usda.gov/fsgisx04/rest/services/ResourcePhoto_Region03/AZ_Tonto_25cm_1958_1959/ImageServer", "@type": "dcat:Distribution", "format": "ArcGIS GeoServices REST API", "mediaType": "application/json", "title": "ArcGIS GeoService" } ], "bureauCode": [ "005:96" ], "modified": "2024-03-14", "theme": [ "geospatial" ], "keyword": [ "R3", "R 03", "Region 03", "Region 3", "NM", "New Mexico", "AZ", "Arizona", "Photogrammetry", "Remote sensing", "Resource Photography", "Open Data" ], "spatial": "-112.0875,33.0528,-110.4778,34.5304", "issued": "2023-12-27", "identifier": "https://www.arcgis.com/home/item.html?id=e5d356cb6734447789bbd4414b7dbf7f", "accessLevel": "public", "programCode": [ "005:059" ], "landingPage": "https://data-usfs.hub.arcgis.com/datasets/usfs::az-tonto-25cm-1958-1959", "license": "https://creativecommons.org/licenses/by/4.0/", "publisher": { "name": "U.S. Forest Service" } }, { "contactPoint": { "hasEmail": "mailto:SM.FS.data@usda.gov", "@type": "vcard:Contact", "fn": "GTAC_Image_Services" }, "description": "A digital orthophoto is a georeferenced image prepared from aerial imagery, or other remotely-sensed data in which the displacement within the image due to sensor orientation and terrain relief has been removed. Orthophotos combine the characteristics of an image with the geometric qualities of a map. Orthoimages show ground features such as roads, buildings, and streams in their proper positions, without the distortion characteristic of unrectified aerial imagery. Digital orthoimages produced and used within the Forest Service are developed from imagery acquired through various national and regional image acquisition programs. The resulting orthoimages, also known as orthomaps, can be directly applied in remote sensing, GIS and mapping applications. They serve a variety of purposes, from interim maps to references for earth science investigations and analysis. Because of the orthographic property, an orthoimage can be used like a map for measurement of distances, angles, and areas with scale being constant everywhere. Also, they can be used as map layers in GIS or other computer-based manipulation, overlaying, and analysis. An orthoimage differs from a map in a manner of depiction of detail; on a map only selected detail is shown by conventional symbols, whereas on an orthoimage all details appear just as in original aerial or satellite imagery.", "title": "AZ Tonto NF Telegraph PostFire 2021", "distribution": [ { "accessURL": "https://www.arcgis.com/sharing/rest/content/items/2d0a0f70e5b144c2bf773a0d9c3499d6/info/metadata/metadata.xml?format=iso19139", "@type": "dcat:Distribution", "mediaType": "text/xml", "conformsTo": "https://www.isotc211.org/2005/gmi", "title": "ISO-19139 metadata" }, { "accessURL": "https://data-usfs.hub.arcgis.com/datasets/usfs::az-tonto-nf-telegraph-postfire-2021", "@type": "dcat:Distribution", "format": "Web Page", "mediaType": "text/html", "title": "ArcGIS Hub Dataset" }, { "accessURL": "https://apps.fs.usda.gov/fsgisx04/rest/services/ResourcePhoto_Region03/AZ_Tonto_NF_Telegraph_PostFire_2021/ImageServer", "@type": "dcat:Distribution", "format": "ArcGIS GeoServices REST API", "mediaType": "application/json", "title": "ArcGIS GeoService" } ], "bureauCode": [ "005:96" ], "modified": "2024-03-14", "theme": [ "geospatial" ], "keyword": [ "R3", "R 03", "Region 03", "Region 3", "NM", "New Mexico", "AZ", "Arizona", "Photogrammetry", "Remote sensing", "Resource Photography", "Open Data" ], "spatial": "-111.2205,33.0923,-110.6545,33.4077", "issued": "2023-12-27", "identifier": "https://www.arcgis.com/home/item.html?id=2d0a0f70e5b144c2bf773a0d9c3499d6", "accessLevel": "public", "programCode": [ "005:059" ], "landingPage": "https://data-usfs.hub.arcgis.com/datasets/usfs::az-tonto-nf-telegraph-postfire-2021", "license": "https://creativecommons.org/licenses/by/4.0/", "publisher": { "name": "U.S. Forest Service" } }, { "contactPoint": { "hasEmail": "mailto:SM.FS.data@usda.gov", "@type": "vcard:Contact", "fn": "USFSEnterpriseContent" }, "description": "The National Forest Climate Change Maps project was developed by the Rocky Mountain Research Station (RMRS) and the Office of Sustainability and Climate to meet the needs of national forest managers for information on projected climate changes at a scale relevant to decision making processes, including forest plans. The maps use state-of-the-art science and are available for every national forest in the contiguous United States with relevant data coverage. Currently, the map sets include variables related to precipitation, air temperature, snow (including snow residence time and April 1 snow water equivalent), and stream flow.
Snow residence time (in days) and April 1 snow water equivalent (in mm) were modeled using the spatial analog models of Luce et al., 2014 (https://agupubs.onlinelibrary.wiley.com/doi/full/10.1002/2013WR014844); see also Lute and Luce, 2017 (https://agupubs.onlinelibrary.wiley.com/doi/full/10.1002/2017WR020752). These models are built on precipitation and snow data from Snowpack Telemetry (SNOTEL) stations across the western United States and temperature data from the TopoWx dataset (https://rmets.onlinelibrary.wiley.com/doi/10.1002/joc.4127). They were calculated for the historical (1975-2005) and future (2071-2090) time periods, along with absolute and percent change.
Raster data are also available for download from RMRS site (https://www.fs.usda.gov/rm/boise/AWAE/projects/NFS-regional-climate-change-maps/categories/us-raster-layers.html), along with pdf maps and detailed metadata (https://www.fs.usda.gov/rm/boise/AWAE/projects/NFS-regional-climate-change-maps/downloads/NationalForestClimateChangeMapsMetadata.pdf).
The National Forest Climate Change Maps project was developed by the Rocky Mountain Research Station (RMRS) and the Office of Sustainability and Climate to meet the needs of national forest managers for information on projected climate changes at a scale relevant to decision making processes, including forest plans. The maps use state-of-the-art science and are available for every national forest in the contiguous United States with relevant data coverage. Currently, the map sets include variables related to precipitation, air temperature, snow (including snow residence time and April 1 snow water equivalent), and stream flow.
Historical (1975-2005) and future (2071-2090) precipitation and temperature data for the state of Alaska were developed by the Scenarios Network for Alaska and Arctic Planning (SNAP) (https://snap.uaf.edu). Monthly precipitation values (mm) were summed over the season of interest (annual, winter, or summer). These datasets have several important differences from the MACAv2-Metdata (https://climate.northwestknowledge.net/MACA/) products, used in the contiguous U.S. They were developed using different global circulation models and different downscaling methods, and were downscaled to a different scale (771 m instead of 4 km). While these cover the same time periods and use broadly similar approaches, caution should be used when directly comparing values between Alaska and the contiguous United States.
Raster data are also available for download from RMRS site (https://www.fs.usda.gov/rm/boise/AWAE/projects/NFS-regional-climate-change-maps/categories/us-raster-layers.html), along with pdf maps and detailed metadata (https://www.fs.usda.gov/rm/boise/AWAE/projects/NFS-regional-climate-change-maps/downloads/NationalForestClimateChangeMapsMetadata.pdf).

The National Forest Climate Change Maps project was developed by the Rocky Mountain Research Station (RMRS) and the Office of Sustainability and Climate to meet the needs of national forest managers for information on projected climate changes at a scale relevant to decision making processes, including forest plans. The maps use state-of-the-art science and are available for every national forest in the contiguous United States with relevant data coverage. Currently, the map sets include variables related to precipitation, air temperature, snow (including snow residence time and April 1 snow water equivalent), and stream flow.
Historical (1975-2005) and future (2071-2090) precipitation and temperature data for the contiguous United States are ensemble mean values across 20 global climate models from the CMIP5 experiment (https://journals.ametsoc.org/doi/abs/10.1175/BAMS-D-11-00094.1), downscaled to a 4 km grid. For more information on the downscaling method and to access the data, please see Abatzoglou and Brown, 2012 (https://rmets.onlinelibrary.wiley.com/doi/full/10.1002/joc.2312) and the Northwest Knowledge Network (https://climate.northwestknowledge.net/MACA/). We used the MACAv2- Metadata monthly dataset; monthly precipitation values (mm) were summed over the season of interest (annual, winter, or summer). Absolute and percent change were then calculated between the historical and future time periods.
Raster data are also available for download from RMRS site (https://www.fs.usda.gov/rm/boise/AWAE/projects/NFS-regional-climate-change-maps/categories/us-raster-layers.html), along with pdf maps and detailed metadata (https://www.fs.usda.gov/rm/boise/AWAE/projects/NFS-regional-climate-change-maps/downloads/NationalForestClimateChangeMapsMetadata.pdf).
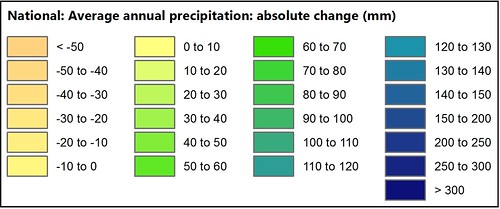
The National Forest Climate Change Maps project was developed by the Rocky Mountain Research Station (RMRS) and the Office of Sustainability and Climate to meet the needs of national forest managers for information on projected climate changes at a scale relevant to decision making processes, including forest plans. The maps use state-of-the-art science and are available for every national forest in the contiguous United States with relevant data coverage. Currently, the map sets include variables related to precipitation, air temperature, snow (including snow residence time and April 1 snow water equivalent), and stream flow.
Historical (1975-2005) and future (2071-2090) precipitation and temperature data for the state of Alaska were developed by the Scenarios Network for Alaska and Arctic Planning (SNAP) (https://snap.uaf.edu). Average temperature values were calculated as the mean of monthly minimum and maximum air temperature values (degrees C), averaged over the season of interest (annual, winter, or summer). These datasets have several important differences from the MACAv2-Metdata (https://climate.northwestknowledge.net/MACA/) products, used in the contiguous U.S. They were developed using different global circulation models and different downscaling methods, and were downscaled to a different scale (771 m instead of 4 km). While these cover the same time periods and use broadly similar approaches, caution should be used when directly comparing values between Alaska and the contiguous United States.
Raster data are also available for download from RMRS site (https://www.fs.usda.gov/rm/boise/AWAE/projects/NFS-regional-climate-change-maps/categories/us-raster-layers.html), along with pdf maps and detailed metadata (https://www.fs.usda.gov/rm/boise/AWAE/projects/NFS-regional-climate-change-maps/downloads/NationalForestClimateChangeMapsMetadata.pdf).

The National Forest Climate Change Maps project was developed by the Rocky Mountain Research Station (RMRS) and the Office of Sustainability and Climate to meet the needs of national forest managers for information on projected climate changes at a scale relevant to decision making processes, including forest plans. The maps use state-of-the-art science and are available for every national forest in the contiguous United States with relevant data coverage. Currently, the map sets include variables related to precipitation, air temperature, snow (including snow residence time and April 1 snow water equivalent), and stream flow.
Historical (1975-2005) and future (2071-2090) precipitation and temperature data for the contiguous United States are ensemble mean values across 20 global climate models from the CMIP5 experiment (https://journals.ametsoc.org/doi/abs/10.1175/BAMS-D-11-00094.1), downscaled to a 4 km grid. For more information on the downscaling method and to access the data, please see Abatzoglou and Brown, 2012 (https://rmets.onlinelibrary.wiley.com/doi/full/10.1002/joc.2312) and the Northwest Knowledge Network (https://climate.northwestknowledge.net/MACA/). We used the MACAv2- Metdata monthly dataset; average temperature values were calculated as the mean of monthly minimum and maximum air temperature values (degrees C), averaged over the season of interest (annual, winter, or summer). Absolute change was then calculated between the historical and future time periods.
Raster data are also available for download from RMRS site (https://www.fs.usda.gov/rm/boise/AWAE/projects/NFS-regional-climate-change-maps/categories/us-raster-layers.html), along with pdf maps and detailed metadata (https://www.fs.usda.gov/rm/boise/AWAE/projects/NFS-regional-climate-change-maps/downloads/NationalForestClimateChangeMapsMetadata.pdf).
", "title": "Absolute change in annual temperature (CONUS) (Image Service)", "distribution": [ { "accessURL": "https://www.arcgis.com/sharing/rest/content/items/cf0aefd243734eb7946e22d2d0812b87/info/metadata/metadata.xml?format=iso19139", "@type": "dcat:Distribution", "mediaType": "text/xml", "conformsTo": "https://www.isotc211.org/2005/gmi", "title": "ISO-19139 metadata" }, { "accessURL": "https://data-usfs.hub.arcgis.com/datasets/usfs::absolute-change-in-annual-temperature-conus-image-service", "@type": "dcat:Distribution", "format": "Web Page", "mediaType": "text/html", "title": "ArcGIS Hub Dataset" }, { "accessURL": "https://apps.fs.usda.gov/fsgisx01/rest/services/RDW_Climate/AvgAnnualTempAbsChange_CONUS/ImageServer", "@type": "dcat:Distribution", "format": "ArcGIS GeoServices REST API", "mediaType": "application/json", "title": "ArcGIS GeoService" } ], "bureauCode": [ "005:96" ], "modified": "2022-08-25", "theme": [ "geospatial" ], "keyword": [ "USDA Forest Service", "USFS", "Office of Sustainability and Climate", "OSC", "Rocky Mountain Research Station", "RMRS", "Air Water and Aquatic Environments Program", "AWAE", "climate", "climate change", "National Forests", "Open Data", "temperature", "warming", "CONUS", "contiguous U.S." ], "spatial": "-124.7930,25.0434,-67.0430,49.4169", "issued": "2017-11-22", "identifier": "https://www.arcgis.com/home/item.html?id=cf0aefd243734eb7946e22d2d0812b87", "accessLevel": "public", "programCode": [ "005:059" ], "landingPage": "https://data-usfs.hub.arcgis.com/datasets/usfs::absolute-change-in-annual-temperature-conus-image-service", "license": "https://creativecommons.org/licenses/by/4.0/", "publisher": { "name": "U.S. Forest Service" } }, { "contactPoint": { "hasEmail": "mailto:SM.FS.data@usda.gov", "@type": "vcard:Contact", "fn": "USFSEnterpriseContent" }, "description": "The National Forest Climate Change Maps project was developed by the Rocky Mountain Research Station (RMRS) and the Office of Sustainability and Climate to meet the needs of national forest managers for information on projected climate changes at a scale relevant to decision making processes, including forest plans. The maps use state-of-the-art science and are available for every national forest in the contiguous United States with relevant data coverage. Currently, the map sets include variables related to precipitation, air temperature, snow (including snow residence time and April 1 snow water equivalent), and stream flow.
\\n\\nSnow residence time (in days) and April 1 snow water equivalent (in mm) were modeled using the spatial analog models of Luce et al., 2014 (https://agupubs.onlinelibrary.wiley.com/doi/full/10.1002/2013WR014844); see also Lute and Luce, 2017 (https://agupubs.onlinelibrary.wiley.com/doi/full/10.1002/2017WR020752). These models are built on precipitation and snow data from Snowpack Telemetry (SNOTEL) stations across the western United States and temperature data from the TopoWx dataset (https://rmets.onlinelibrary.wiley.com/doi/10.1002/joc.4127). They were calculated for the historical (1975-2005) and future (2071-2090) time periods, along with absolute and percent change.
\\n\\nRaster data are also available for download from RMRS site (https://www.fs.usda.gov/rm/boise/AWAE/projects/NFS-regional-climate-change-maps/categories/us-raster-layers.html), along with pdf maps and detailed metadata (https://www.fs.usda.gov/rm/boise/AWAE/projects/NFS-regional-climate-change-maps/downloads/NationalForestClimateChangeMapsMetadata.pdf).They were calculated for the historical (1975-2005) and future (2071-2090) time periods, along with absolute and percent change.
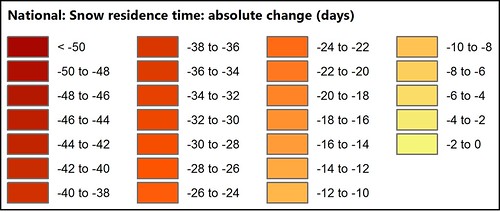
The National Forest Climate Change Maps project was developed by the Rocky Mountain Research Station (RMRS) and the Office of Sustainability and Climate to meet the needs of national forest managers for information on projected climate changes at a scale relevant to decision making processes, including forest plans. The maps use state-of-the-art science and are available for every national forest in the contiguous United States with relevant data coverage. Currently, the map sets include variables related to precipitation, air temperature, snow (including snow residence time and April 1 snow water equivalent), and stream flow.
Historical (1975-2005) and future (2071-2090) precipitation and temperature data for the state of Alaska were developed by the Scenarios Network for Alaska and Arctic Planning (SNAP) (https://snap.uaf.edu). Monthly precipitation values (mm) were summed over the season of interest (annual, winter, or summer). These datasets have several important differences from the MACAv2-Metdata (https://climate.northwestknowledge.net/MACA/) products, used in the contiguous U.S. They were developed using different global circulation models and different downscaling methods, and were downscaled to a different scale (771 m instead of 4 km). While these cover the same time periods and use broadly similar approaches, caution should be used when directly comparing values between Alaska and the contiguous United States.
Raster data are also available for download from RMRS site (https://www.fs.usda.gov/rm/boise/AWAE/projects/NFS-regional-climate-change-maps/categories/us-raster-layers.html), along with pdf maps and detailed metadata (https://www.fs.usda.gov/rm/boise/AWAE/projects/NFS-regional-climate-change-maps/downloads/NationalForestClimateChangeMapsMetadata.pdf).
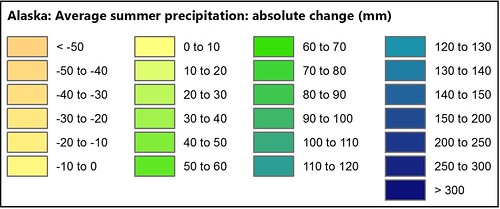
The National Forest Climate Change Maps project was developed by the Rocky Mountain Research Station (RMRS) and the Office of Sustainability and Climate to meet the needs of national forest managers for information on projected climate changes at a scale relevant to decision making processes, including forest plans. The maps use state-of-the-art science and are available for every national forest in the contiguous United States with relevant data coverage. Currently, the map sets include variables related to precipitation, air temperature, snow (including snow residence time and April 1 snow water equivalent), and stream flow.
\\n\\nHistorical (1975-2005) and future (2071-2090) precipitation and temperature data for the contiguous United States are ensemble mean values across 20 global climate models from the CMIP5 experiment (https://journals.ametsoc.org/doi/abs/10.1175/BAMS-D-11-00094.1), downscaled to a 4 km grid. For more information on the downscaling method and to access the data, please see Abatzoglou and Brown, 2012 (https://rmets.onlinelibrary.wiley.com/doi/full/10.1002/joc.2312) and the Northwest Knowledge Network (https://climate.northwestknowledge.net/MACA/). We used the MACAv2- Metdata monthly dataset; monthly precipitation values (mm) were summed over the season of interest (annual, winter, or summer). Absolute and percent change were then calculated between the historical and future time periods.
\\n\\nRaster data are also available for download from RMRS site (https://www.fs.usda.gov/rm/boise/AWAE/projects/NFS-regional-climate-change-maps/categories/us-raster-layers.html), along with pdf maps and detailed metadata (https://www.fs.usda.gov/rm/boise/AWAE/projects/NFS-regional-climate-change-maps/downloads/NationalForestClimateChangeMapsMetadata.pdf).

The National Forest Climate Change Maps project was developed by the Rocky Mountain Research Station (RMRS) and the Office of Sustainability and Climate to meet the needs of national forest managers for information on projected climate changes at a scale relevant to decision making processes, including forest plans. The maps use state-of-the-art science and are available for every national forest in the contiguous United States with relevant data coverage. Currently, the map sets include variables related to precipitation, air temperature, snow (including snow residence time and April 1 snow water equivalent), and stream flow.
Historical (1975-2005) and future (2071-2090) precipitation and temperature data for the state of Alaska were developed by the Scenarios Network for Alaska and Arctic Planning (SNAP) (https://snap.uaf.edu). Average temperature values were calculated as the mean of monthly minimum and maximum air temperature values (degrees C), averaged over the season of interest (annual, winter, or summer). These datasets have several important differences from the MACAv2-Metdata (https://climate.northwestknowledge.net/MACA/) products, used in the contiguous U.S. They were developed using different global circulation models and different downscaling methods, and were downscaled to a different scale (771 m instead of 4 km). While these cover the same time periods and use broadly similar approaches, caution should be used when directly comparing values between Alaska and the contiguous United States.
Raster data are also available for download from RMRS site (https://www.fs.usda.gov/rm/boise/AWAE/projects/NFS-regional-climate-change-maps/categories/us-raster-layers.html), along with pdf maps and detailed metadata (https://www.fs.usda.gov/rm/boise/AWAE/projects/NFS-regional-climate-change-maps/downloads/NationalForestClimateChangeMapsMetadata.pdf).

The National Forest Climate Change Maps project was developed by the Rocky Mountain Research Station (RMRS) and the Office of Sustainability and Climate to meet the needs of national forest managers for information on projected climate changes at a scale relevant to decision making processes, including forest plans. The maps use state-of-the-art science and are available for every national forest in the contiguous United States with relevant data coverage. Currently, the map sets include variables related to precipitation, air temperature, snow (including snow residence time and April 1 snow water equivalent), and stream flow.
Historical (1975-2005) and future (2071-2090) precipitation and temperature data for the contiguous United States are ensemble mean values across 20 global climate models from the CMIP5 experiment (https://journals.ametsoc.org/doi/abs/10.1175/BAMS-D-11-00094.1), downscaled to a 4 km grid. For more information on the downscaling method and to access the data, please see Abatzoglou and Brown, 2012 (https://rmets.onlinelibrary.wiley.com/doi/full/10.1002/joc.2312) and the Northwest Knowledge Network (https://climate.northwestknowledge.net/MACA/). We used the MACAv2- Metdata monthly dataset; average temperature values were calculated as the mean of monthly minimum and maximum air temperature values (degrees C), averaged over the season of interest (annual, winter, or summer). Absolute change was then calculated between the historical and future time periods.
Raster data are also available for download from RMRS site (https://www.fs.usda.gov/rm/boise/AWAE/projects/NFS-regional-climate-change-maps/categories/us-raster-layers.html), along with pdf maps and detailed metadata (https://www.fs.usda.gov/rm/boise/AWAE/projects/NFS-regional-climate-change-maps/downloads/NationalForestClimateChangeMapsMetadata.pdf).
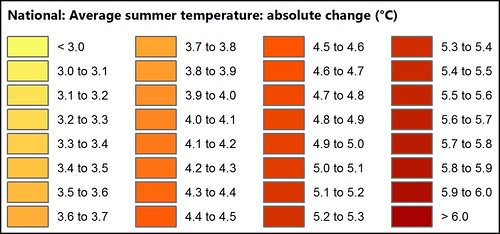
The National Forest Climate Change Maps project was developed by the Rocky Mountain Research Station (RMRS) and the Office of Sustainability and Climate to meet the needs of national forest managers for information on projected climate changes at a scale relevant to decision making processes, including forest plans. The maps use state-of-the-art science and are available for every national forest in the contiguous United States with relevant data coverage. Currently, the map sets include variables related to precipitation, air temperature, snow (including snow residence time and April 1 snow water equivalent), and stream flow.
Historical (1975-2005) and future (2071-2090) precipitation and temperature data for the state of Alaska were developed by the Scenarios Network for Alaska and Arctic Planning (SNAP) (https://snap.uaf.edu). Monthly precipitation values (mm) were summed over the season of interest (annual, winter, or summer). These datasets have several important differences from the MACAv2-Metdata (https://climate.northwestknowledge.net/MACA/) products, used in the contiguous U.S. They were developed using different global circulation models and different downscaling methods, and were downscaled to a different scale (771 m instead of 4 km). While these cover the same time periods and use broadly similar approaches, caution should be used when directly comparing values between Alaska and the contiguous United States.
Raster data are also available for download from RMRS site (https://www.fs.usda.gov/rm/boise/AWAE/projects/NFS-regional-climate-change-maps/categories/us-raster-layers.html), along with pdf maps and detailed metadata (https://www.fs.usda.gov/rm/boise/AWAE/projects/NFS-regional-climate-change-maps/downloads/NationalForestClimateChangeMapsMetadata.pdf).
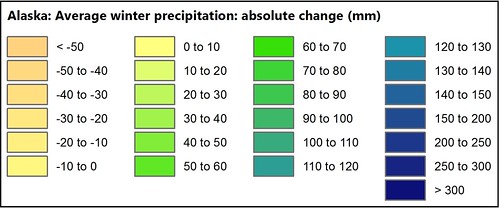
The National Forest Climate Change Maps project was developed by the Rocky Mountain Research Station (RMRS) and the Office of Sustainability and Climate to meet the needs of national forest managers for information on projected climate changes at a scale relevant to decision making processes, including forest plans. The maps use state-of-the-art science and are available for every national forest in the contiguous United States with relevant data coverage. Currently, the map sets include variables related to precipitation, air temperature, snow (including snow residence time and April 1 snow water equivalent), and stream flow.
\\n\\nHistorical (1975-2005) and future (2071-2090) precipitation and temperature data for the contiguous United States are ensemble mean values across 20 global climate models from the CMIP5 experiment (https://journals.ametsoc.org/doi/abs/10.1175/BAMS-D-11-00094.1), downscaled to a 4 km grid. For more information on the downscaling method and to access the data, please see Abatzoglou and Brown, 2012 (https://rmets.onlinelibrary.wiley.com/doi/full/10.1002/joc.2312) and the Northwest Knowledge Network (https://climate.northwestknowledge.net/MACA/). We used the MACAv2- Metdata monthly dataset; monthly precipitation values (mm) were summed over the season of interest (annual, winter, or summer). Absolute and percent change were then calculated between the historical and future time periods.
\\n\\nRaster data are also available for download from RMRS site (https://www.fs.usda.gov/rm/boise/AWAE/projects/NFS-regional-climate-change-maps/categories/us-raster-layers.html), along with pdf maps and detailed metadata (https://www.fs.usda.gov/rm/boise/AWAE/projects/NFS-regional-climate-change-maps/downloads/NationalForestClimateChangeMapsMetadata.pdf).

The National Forest Climate Change Maps project was developed by the Rocky Mountain Research Station (RMRS) and the Office of Sustainability and Climate to meet the needs of national forest managers for information on projected climate changes at a scale relevant to decision making processes, including forest plans. The maps use state-of-the-art science and are available for every national forest in the contiguous United States with relevant data coverage. Currently, the map sets include variables related to precipitation, air temperature, snow (including snow residence time and April 1 snow water equivalent), and stream flow.
Historical (1975-2005) and future (2071-2090) precipitation and temperature data for the state of Alaska were developed by the Scenarios Network for Alaska and Arctic Planning (SNAP) (https://snap.uaf.edu). Average temperature values were calculated as the mean of monthly minimum and maximum air temperature values (degrees C), averaged over the season of interest (annual, winter, or summer). These datasets have several important differences from the MACAv2-Metdata (https://climate.northwestknowledge.net/MACA/) products, used in the contiguous U.S. They were developed using different global circulation models and different downscaling methods, and were downscaled to a different scale (771 m instead of 4 km). While these cover the same time periods and use broadly similar approaches, caution should be used when directly comparing values between Alaska and the contiguous United States.
Raster data are also available for download from RMRS site (https://www.fs.usda.gov/rm/boise/AWAE/projects/NFS-regional-climate-change-maps/categories/us-raster-layers.html), along with pdf maps and detailed metadata (https://www.fs.usda.gov/rm/boise/AWAE/projects/NFS-regional-climate-change-maps/downloads/NationalForestClimateChangeMapsMetadata.pdf).
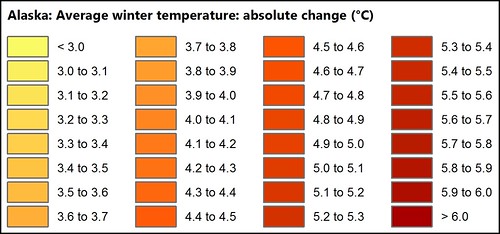
The National Forest Climate Change Maps project was developed by the Rocky Mountain Research Station (RMRS) and the Office of Sustainability and Climate to meet the needs of national forest managers for information on projected climate changes at a scale relevant to decision making processes, including forest plans. The maps use state-of-the-art science and are available for every national forest in the contiguous United States with relevant data coverage. Currently, the map sets include variables related to precipitation, air temperature, snow (including snow residence time and April 1 snow water equivalent), and stream flow.
Historical (1975-2005) and future (2071-2090) precipitation and temperature data for the contiguous United States are ensemble mean values across 20 global climate models from the CMIP5 experiment (https://journals.ametsoc.org/doi/abs/10.1175/BAMS-D-11-00094.1), downscaled to a 4 km grid. For more information on the downscaling method and to access the data, please see Abatzoglou and Brown, 2012 (https://rmets.onlinelibrary.wiley.com/doi/full/10.1002/joc.2312) and the Northwest Knowledge Network (https://climate.northwestknowledge.net/MACA/). We used the MACAv2- Metdata monthly dataset; average temperature values were calculated as the mean of monthly minimum and maximum air temperature values (degrees C), averaged over the season of interest (annual, winter, or summer). Absolute change was then calculated between the historical and future time periods.
Raster data are also available for download from RMRS site (https://www.fs.usda.gov/rm/boise/AWAE/projects/NFS-regional-climate-change-maps/categories/us-raster-layers.html), along with pdf maps and detailed metadata (https://www.fs.usda.gov/rm/boise/AWAE/projects/NFS-regional-climate-change-maps/downloads/NationalForestClimateChangeMapsMetadata.pdf).

This feature class includes States, Counties or Boroughs, Congressional Districts, Alaska Recording Districts, County Subdivisions, and Places boundaries that are derived from the latest official Census Bureau and Alaska Department of Natural Resources datasets. Features within Forest Service Administrative Forest boundaries may have been modified by the Forest Service for improved accuracy and spatial coincidence(vertical integration).
This feature class includes States, Counties or Boroughs, Congressional Districts, Alaska Recording Districts, County Subdivisions, and Places boundaries that are derived from the latest official Census Bureau and Alaska Department of Natural Resources datasets. Features within Forest Service Administrative Forest boundaries may have been modified by the Forest Service for improved accuracy and spatial coincidence(vertical integration).
Evaluating multiple signals of climate change across the conterminous United States during three 30-year periods (2010�2039, 2040�2069, 2070�2099) during this century to a baseline period (1980�2009) emphasizes potential changes for growing degree days (GDD), plant hardiness zones (PHZ), and heat zones. These indices were derived using the CCSM4 and GFDL CM3 models under the representative concentration pathways 4.5 and 8.5, respectively, and included in Matthews et al. (2018). Daily temperature was downscaled by Maurer et al. (https://doi.org/10.1029/2007EO470006) at a 1/8 degree grid scale and used to obtain growing degree days, plant hardiness zones, and heat zones. Each of these indices provides unique information about plant health related to changes in climatic conditions that influence establishment, growth, and survival. These data and the calculated changes are provided as 14 individual IMG files for each index to assist with management planning and decision making into the future. For each of the four indices the following are included: two baseline files (1980�2009), three files representing 30-year periods for the scenario CCSM4 under RCP 4.5 along with three files of changes, and three files representing 30-year periods for the scenario GFDL CM3 under RCP 8.5 along with three files of changes.Heat zones map the distribution of potential heat stress for plants and animals, including humans. We define heat zones as the number of days with maximum daily temperature >30 �C (86 �F). Because species have unique adaptations and abilities to tolerate a wide variety of conditions, this metric is used merely as an indicator of change in �hot� conditions. The 30 �C value is set primarily for agricultural production and is a general temperature threshold at which photosynthesis can be negatively impacted for C3 plants (e.g., most species including trees), but it certainly also captures temperatures that induce stress in humans as well. In addition, increases in temperature above these thresholds for longer periods, especially when accompanied with prolonged dry conditions, are linked to reduced performance and likely mortality of trees. Each day surpassing the 30 �C threshold was tallied and summed for each year and reported as the mean number of days, per year, over each 30-year period: baseline, early, mid, and late century.�
Original data and associated metadata can be downloaded from this website:�https://www.fs.usda.gov/rds/archive/Product/RDS-2019-0001
This feature class includes States, Counties or Boroughs, Congressional Districts, Alaska Recording Districts, County Subdivisions, and Places boundaries that are derived from the latest official Census Bureau and Alaska Department of Natural Resources datasets. Features within Forest Service Administrative Forest boundaries may have been modified by the Forest Service for improved accuracy and spatial coincidence(vertical integration).
This feature class includes States, Counties or Boroughs, Congressional Districts, Alaska Recording Districts, County Subdivisions, and Places boundaries that are derived from the latest official Census Bureau and Alaska Department of Natural Resources datasets. Features within Forest Service Administrative Forest boundaries may have been modified by the Forest Service for improved accuracy and spatial coincidence(vertical integration).
Each archived data set (i.e., 'data publication') contains at least one data set, complete metadata for the data set(s), and any other documentation the researcher deemed important to understanding the data set(s). The data catalog entries present the metadata and a link to the data. In some cases the data link is to a different archive.
", "title": "Forest Service Research Data Archive - Index", "distribution": [ { "accessURL": "https://www.arcgis.com/sharing/rest/content/items/eaa8f2f9700a4c99986dbee09162f56f/info/metadata/metadata.xml?format=iso19139", "@type": "dcat:Distribution", "mediaType": "text/xml", "conformsTo": "https://www.isotc211.org/2005/gmi", "title": "ISO-19139 metadata" }, { "accessURL": "https://data-usfs.hub.arcgis.com/documents/usfs::forest-service-research-data-archive-index", "@type": "dcat:Distribution", "format": "Web Page", "mediaType": "text/html", "title": "ArcGIS Hub Dataset" }, { "accessURL": "https://doi.org/10.2737/RDS", "@type": "dcat:Distribution", "format": "ArcGIS GeoServices REST API", "mediaType": "application/json", "title": "ArcGIS GeoService" } ], "bureauCode": [ "005:96" ], "modified": "2022-08-25", "theme": [ "geospatial" ], "keyword": [ "USFS", "Forest Service", "Research Data Archive", "RDA", "Index", "USDA Forest Service", "Open Data" ], "spatial": "-131.3620,6.8980,-65.6380,72.6220", "issued": "2017-11-01", "identifier": "https://www.arcgis.com/home/item.html?id=eaa8f2f9700a4c99986dbee09162f56f", "accessLevel": "public", "programCode": [ "005:059" ], "landingPage": "https://data-usfs.hub.arcgis.com/documents/usfs::forest-service-research-data-archive-index", "license": "https://creativecommons.org/licenses/by/4.0/", "publisher": { "name": "U.S. Forest Service" } }, { "contactPoint": { "hasEmail": "mailto:SM.FS.data@usda.gov", "@type": "vcard:Contact", "fn": "USFSEnterpriseContent" }, "description": "An area having regulations and/or restrictions related to existing buildings, structures, or resource activities such as a constructed fuel breaks. Metadata", "title": "Forest Service developed sites subject to regulation (Feature Layer)", "distribution": [ { "accessURL": "https://www.arcgis.com/sharing/rest/content/items/bede16e1d8c64c9ba2f9f9557934da53/info/metadata/metadata.xml?format=iso19139", "@type": "dcat:Distribution", "mediaType": "text/xml", "conformsTo": "https://www.isotc211.org/2005/gmi", "title": "ISO-19139 metadata" }, { "accessURL": "https://data-usfs.hub.arcgis.com/maps/usfs::forest-service-developed-sites-subject-to-regulation-feature-layer", "@type": "dcat:Distribution", "format": "Web Page", "mediaType": "text/html", "title": "ArcGIS Hub Dataset" }, { "accessURL": "https://apps.fs.usda.gov/arcx/rest/services/EDW/EDW_DevelopedSite_01/MapServer/0", "@type": "dcat:Distribution", "format": "ArcGIS GeoServices REST API", "mediaType": "application/json", "title": "ArcGIS GeoService" }, { "accessURL": "https://data-usfs.hub.arcgis.com/api/download/v1/items/bede16e1d8c64c9ba2f9f9557934da53/csv?layers=0", "@type": "dcat:Distribution", "format": "CSV", "mediaType": "text/csv", "title": "CSV" }, { "accessURL": "https://data-usfs.hub.arcgis.com/api/download/v1/items/bede16e1d8c64c9ba2f9f9557934da53/geojson?layers=0", "@type": "dcat:Distribution", "format": "GeoJSON", "mediaType": "application/vnd.geo+json", "title": "GeoJSON" }, { "accessURL": "https://data-usfs.hub.arcgis.com/api/download/v1/items/bede16e1d8c64c9ba2f9f9557934da53/shapefile?layers=0", "@type": "dcat:Distribution", "format": "ZIP", "mediaType": "application/zip", "title": "Shapefile" }, { "accessURL": "https://data-usfs.hub.arcgis.com/api/download/v1/items/bede16e1d8c64c9ba2f9f9557934da53/kml?layers=0", "@type": "dcat:Distribution", "format": "KML", "mediaType": "application/vnd.google-earth.kml+xml", "title": "KML" } ], "bureauCode": [ "005:96" ], "modified": "2024-06-23", "theme": [ "geospatial" ], "keyword": [ "Boundaries", "Sites subject to regulation", "devloped", "development", "forest management", "facilities and infrastructure", "Building", "Open Data" ], "spatial": "-150.0079,31.3844,-72.8085,60.9233", "issued": "2017-03-27", "identifier": "https://www.arcgis.com/home/item.html?id=bede16e1d8c64c9ba2f9f9557934da53&sublayer=0", "accessLevel": "public", "programCode": [ "005:059" ], "landingPage": "https://data-usfs.hub.arcgis.com/maps/usfs::forest-service-developed-sites-subject-to-regulation-feature-layer", "license": "https://creativecommons.org/licenses/by/4.0/", "publisher": { "name": "U.S. Forest Service" } }, { "contactPoint": { "hasEmail": "mailto:SM.FS.data@usda.gov", "@type": "vcard:Contact", "fn": "USFSEnterpriseContent" }, "description": "With the Food, Conservation, and Energy Act of 2008 (the 2008 Farm Bill), Congress tasked states and territories to craft assessments of the forests within their boundaries and develop strategies to address threats and forest management opportunities. Now known as Forest Action Plans, these assessments and strategies provide an analysis of forest conditions and trends in the state and delineate priority forest landscape areas. They offer long-term plans for investing state, federal, and other resources where they can be most effective in achieving national conservation goals by addressing the State and Private Forestry (SPF) national priorities and objectives: 1) Conserve working forest lands, 2) Protect forests from harm, and 3) Enhance public benefits from trees and forests. Administered by the US Forest Service and implemented by State forestry agencies, the SPF Forest Stewardship Program encourages private forest landowners to manage their lands using professionally prepared Forest Stewardship plans. Participation in the Forest Stewardship Program requires that states and territories submit a raster dataset of priority areas specific to the Program - aligned with priority landscapes identified in Forest Action Plans - called Forest Stewardship Program Federal Investment Areas, where they will focus their Program delivery efforts. Program performance measures include acres covered by active Forest Stewardship plans that are within Forest Stewardship Priority Areas.", "title": "Forest Stewardship Program Federal Investment Areas (Image Service)", "distribution": [ { "accessURL": "https://www.arcgis.com/sharing/rest/content/items/563e40087f2647f384e67efa03f59fc9/info/metadata/metadata.xml?format=iso19139", "@type": "dcat:Distribution", "mediaType": "text/xml", "conformsTo": "https://www.isotc211.org/2005/gmi", "title": "ISO-19139 metadata" }, { "accessURL": "https://data-usfs.hub.arcgis.com/datasets/usfs::forest-stewardship-program-federal-investment-areas-image-service", "@type": "dcat:Distribution", "format": "Web Page", "mediaType": "text/html", "title": "ArcGIS Hub Dataset" }, { "accessURL": "https://apps.fs.usda.gov/fsgisx01/rest/services/RDW_AdminAndOwnership/Forest_Stewardship_Priority_Areas/ImageServer", "@type": "dcat:Distribution", "format": "ArcGIS GeoServices REST API", "mediaType": "application/json", "title": "ArcGIS GeoService" } ], "bureauCode": [ "005:96" ], "modified": "2023-08-03", "theme": [ "geospatial" ], "keyword": [ "imagery", "Base Maps", "Earth Cover", "Forest Stewardship", "Open Data" ], "spatial": "-180.0000,-14.5661,179.2365,76.4315", "issued": "2018-10-04", "identifier": "https://www.arcgis.com/home/item.html?id=563e40087f2647f384e67efa03f59fc9", "accessLevel": "public", "programCode": [ "005:059" ], "landingPage": "https://data-usfs.hub.arcgis.com/datasets/usfs::forest-stewardship-program-federal-investment-areas-image-service", "license": "https://creativecommons.org/licenses/by/4.0/", "publisher": { "name": "U.S. Forest Service" } }, { "contactPoint": { "hasEmail": "mailto:SM.FS.data@usda.gov", "@type": "vcard:Contact", "fn": "USFSEnterpriseContent" }, "description": "This data publication contains 250 meter raster data depicting the spatial distribution of forest ownership types in the conterminous United States. The data are a modeled representation of forest land by ownership type, and include three types of public ownership: federal, state, and local; three types of private: family (includes individuals and families), corporate, and other private (includes conservation and natural resource organizations, and unincorporated partnerships and associations); as well as Native American tribal lands. The most up-to-date data available were used in creating this data publication. A plurality of the ownership data were from 2014, but some data were as old as 2004.", "title": "Forest ownership in the conterminous United States circa 2014: distribution of seven ownership types - geospatial dataset", "distribution": [ { "accessURL": "https://www.arcgis.com/sharing/rest/content/items/58d8fd23795a43e3b7a629aa3896569b/info/metadata/metadata.xml?format=iso19139", "@type": "dcat:Distribution", "mediaType": "text/xml", "conformsTo": "https://www.isotc211.org/2005/gmi", "title": "ISO-19139 metadata" }, { "accessURL": "https://data-usfs.hub.arcgis.com/documents/usfs::forest-ownership-in-the-conterminous-united-states-circa-2014-distribution-of-seven-ownership-types-geospatial-dataset", "@type": "dcat:Distribution", "format": "Web Page", "mediaType": "text/html", "title": "ArcGIS Hub Dataset" }, { "accessURL": "https://doi.org/10.2737/RDS-2017-0007", "@type": "dcat:Distribution", "format": "ArcGIS GeoServices REST API", "mediaType": "application/json", "title": "ArcGIS GeoService" } ], "bureauCode": [ "005:96" ], "modified": "2022-08-25", "theme": [ "geospatial" ], "keyword": [ "forest ownership", "forest land", "non-forest", "owner types", "public", "private", "corporate", "tribal", "Inventory", "Monitoring", "& Analysis", "Resource inventory", "Environment and People", "Impact of people on environment", "boundaries", "environment", "planningCadastre", "United States of America", "lower 48", "contiguous", "conterminous", "CONUS", "Open Data", "RDA" ], "spatial": "-131.3620,6.8980,-65.6380,72.6220", "issued": "2018-04-26", "identifier": "https://www.arcgis.com/home/item.html?id=58d8fd23795a43e3b7a629aa3896569b", "accessLevel": "public", "programCode": [ "005:059" ], "landingPage": "https://data-usfs.hub.arcgis.com/documents/usfs::forest-ownership-in-the-conterminous-united-states-circa-2014-distribution-of-seven-ownership-types-geospatial-dataset", "license": "https://creativecommons.org/licenses/by/4.0/", "publisher": { "name": "U.S. Forest Service" } }, { "contactPoint": { "hasEmail": "mailto:SM.FS.data@usda.gov", "@type": "vcard:Contact", "fn": "USFSEnterpriseContent" }, "description": "This data publication contains a geospatial file in raster format of wildfires and fuels treatments that occurred between 1995 and 2013 on Stanislaus National Forest and Yosemite National Park in California within the area burned by the 2013 Rim Fire, excluding the outer 500 meters of the fire perimeter. Tabular data are provided for three sets of circular sample windows of size 500 acres (ac), 2500 ac and 5000 ac within the same geospatial extent. Variables included for the sample windows are proportion burned at high severity in the Rim Fire; proportion treated/burned prior to the Rim Fire; mean values for actual evapotranspiration, water deficit, energy release component, and burning index; and proportion in shrubland, riparian, hardwood, conifer, and grassland LandFire vegetation classes. Tabular data are also provided for a set of transects within the same geographic extent that are placed along radial lines centered on the Rim Fire's origin point.", "title": "Fuel treatment and fire history within the Rim Fire in California", "distribution": [ { "accessURL": "https://www.arcgis.com/sharing/rest/content/items/64ac18964bdc425a915d992047cd1b44/info/metadata/metadata.xml?format=iso19139", "@type": "dcat:Distribution", "mediaType": "text/xml", "conformsTo": "https://www.isotc211.org/2005/gmi", "title": "ISO-19139 metadata" }, { "accessURL": "https://data-usfs.hub.arcgis.com/documents/usfs::fuel-treatment-and-fire-history-within-the-rim-fire-in-california", "@type": "dcat:Distribution", "format": "Web Page", "mediaType": "text/html", "title": "ArcGIS Hub Dataset" }, { "accessURL": "https://doi.org/10.2737/RDS-2017-0020", "@type": "dcat:Distribution", "format": "ArcGIS GeoServices REST API", "mediaType": "application/json", "title": "ArcGIS GeoService" } ], "bureauCode": [ "005:96" ], "modified": "2022-08-25", "theme": [ "geospatial" ], "keyword": [ "biota", "environment", "Fire", "Fire ecology", "Fire effects on environment", "Prescribed fire", "Natural Resource Management & Use", "Forest management", "Landscape management", "Restoration", "fuels treatment", "fuels reduction", "thinning", "wildfire", "fire severity", "fire progression", "mixed conifer forest", "landscape analysis", "Rim Fire", "Joint Fire Science Program", "JFSP", "Stanislaus National Forest", "Yosemite National Park", "Sierra Nevada", "California", "Open Data", "RDA" ], "spatial": "-131.3620,6.8980,-65.6380,72.6220", "issued": "2018-04-26", "identifier": "https://www.arcgis.com/home/item.html?id=64ac18964bdc425a915d992047cd1b44", "accessLevel": "public", "programCode": [ "005:059" ], "landingPage": "https://data-usfs.hub.arcgis.com/documents/usfs::fuel-treatment-and-fire-history-within-the-rim-fire-in-california", "license": "https://creativecommons.org/licenses/by/4.0/", "publisher": { "name": "U.S. Forest Service" } }, { "contactPoint": { "hasEmail": "mailto:SM.FS.data@usda.gov", "@type": "vcard:Contact", "fn": "USFSEnterpriseContent" }, "description": "This publication contains tabular data used to evaluate the effects of fuel treatments and previously burned areas on daily wildland fire management costs. The data represent daily Forest Service fire management costs for a sample of 56 fires that burned between 2008 and 2012 throughout the conterminous United States. Included in the data is a suite of spatially derived variables used to control for variation in daily fire management costs, including topography, fire weather, fuel loading, remoteness, and human populations-at-risk. These data were extracted using daily fire progression maps produced using the methods outlined in Parks (2014).", "title": "Fuel treatment and previous fire effects on daily fire management costs", "distribution": [ { "accessURL": "https://www.arcgis.com/sharing/rest/content/items/b5db26acaa4a4a02a263beb2e252cee9/info/metadata/metadata.xml?format=iso19139", "@type": "dcat:Distribution", "mediaType": "text/xml", "conformsTo": "https://www.isotc211.org/2005/gmi", "title": "ISO-19139 metadata" }, { "accessURL": "https://data-usfs.hub.arcgis.com/documents/usfs::fuel-treatment-and-previous-fire-effects-on-daily-fire-management-costs", "@type": "dcat:Distribution", "format": "Web Page", "mediaType": "text/html", "title": "ArcGIS Hub Dataset" }, { "accessURL": "https://doi.org/10.2737/RDS-2017-0050", "@type": "dcat:Distribution", "format": "ArcGIS GeoServices REST API", "mediaType": "application/json", "title": "ArcGIS GeoService" } ], "bureauCode": [ "005:96" ], "modified": "2022-08-25", "theme": [ "geospatial" ], "keyword": [ "economy", "environment", "Ecology", "Ecosystems", "& Environment", "Geography", "Fire", "Fire suppression", "pre-suppression", "Natural Resource Management & Use", "Economics", "Forest Management", "wildland fire", "fuel treatments", "suppression", "cost", "expenditures", "panel data", "Joint Fire Science Program", "JFSP", "conterminous United States", "United States", "Open Data", "RDA" ], "spatial": "-131.3620,6.8980,-65.6380,72.6220", "issued": "2018-09-28", "identifier": "https://www.arcgis.com/home/item.html?id=b5db26acaa4a4a02a263beb2e252cee9", "accessLevel": "public", "programCode": [ "005:059" ], "landingPage": "https://data-usfs.hub.arcgis.com/documents/usfs::fuel-treatment-and-previous-fire-effects-on-daily-fire-management-costs", "license": "https://creativecommons.org/licenses/by/4.0/", "publisher": { "name": "U.S. Forest Service" } }, { "contactPoint": { "hasEmail": "mailto:SM.FS.data@usda.gov", "@type": "vcard:Contact", "fn": "USFSEnterpriseContent" }, "description": "The National Forest Climate Change Maps project was developed by the Rocky Mountain Research Station (RMRS) and the Office of Sustainability and Climate to meet the needs of national forest managers for information on projected climate changes at a scale relevant to decision making processes, including forest plans. The maps use state-of-the-art science and are available for every national forest in the contiguous United States with relevant data coverage. Currently, the map sets include variables related to precipitation, air temperature, snow (including snow residence time and April 1 snow water equivalent), and stream flow.
Snow residence time (in days) and April 1 snow water equivalent (in mm) were modeled using the spatial analog models of Luce et al., 2014 (https://agupubs.onlinelibrary.wiley.com/doi/full/10.1002/2013WR014844); see also Lute and Luce, 2017 (https://agupubs.onlinelibrary.wiley.com/doi/full/10.1002/2017WR020752). These models are built on precipitation and snow data from Snowpack Telemetry (SNOTEL) stations across the western United States and temperature data from the TopoWx dataset (https://rmets.onlinelibrary.wiley.com/doi/10.1002/joc.4127). They were calculated for the historical (1975-2005) and future (2071-2090) time periods, along with absolute and percent change.
Raster data are also available for download from RMRS site (https://www.fs.usda.gov/rm/boise/AWAE/projects/NFS-regional-climate-change-maps/categories/us-raster-layers.html), along with pdf maps and detailed metadata (https://www.fs.usda.gov/rm/boise/AWAE/projects/NFS-regional-climate-change-maps/downloads/NationalForestClimateChangeMapsMetadata.pdf).
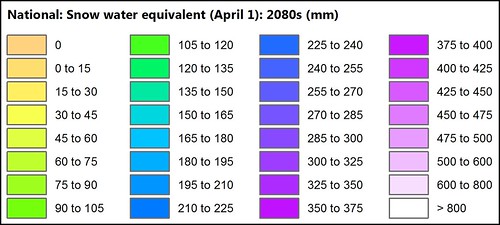
The National Forest Climate Change Maps project was developed by the Rocky Mountain Research Station (RMRS) and the Office of Sustainability and Climate to meet the needs of national forest managers for information on projected climate changes at a scale relevant to decision making processes, including forest plans. The maps use state-of-the-art science and are available for every national forest in the contiguous United States with relevant data coverage. Currently, the map sets include variables related to precipitation, air temperature, snow (including snow residence time and April 1 snow water equivalent), and stream flow.
Historical (1975-2005) and future (2071-2090) precipitation and temperature data for the state of Alaska were developed by the Scenarios Network for Alaska and Arctic Planning (SNAP) (https://snap.uaf.edu). Monthly precipitation values (mm) were summed over the season of interest (annual, winter, or summer). These datasets have several important differences from the MACAv2-Metdata (https://climate.northwestknowledge.net/MACA/) products, used in the contiguous U.S. They were developed using different global circulation models and different downscaling methods, and were downscaled to a different scale (771 m instead of 4 km). While these cover the same time periods and use broadly similar approaches, caution should be used when directly comparing values between Alaska and the contiguous United States.
Raster data are also available for download from RMRS site (https://www.fs.usda.gov/rm/boise/AWAE/projects/NFS-regional-climate-change-maps/categories/us-raster-layers.html), along with pdf maps and detailed metadata (https://www.fs.usda.gov/rm/boise/AWAE/projects/NFS-regional-climate-change-maps/downloads/NationalForestClimateChangeMapsMetadata.pdf).
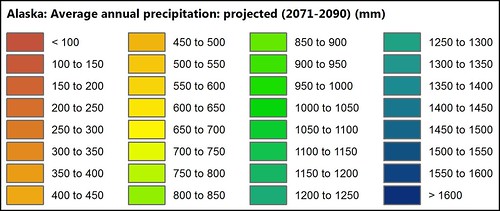
The National Forest Climate Change Maps project was developed by the Rocky Mountain Research Station (RMRS) and the Office of Sustainability and Climate to meet the needs of national forest managers for information on projected climate changes at a scale relevant to decision making processes, including forest plans. The maps use state-of-the-art science and are available for every national forest in the contiguous United States with relevant data coverage. Currently, the map sets include variables related to precipitation, air temperature, snow (including snow residence time and April 1 snow water equivalent), and stream flow.
\\n\\nHistorical (1975-2005) and future (2071-2090) precipitation and temperature data for the contiguous United States are ensemble mean values across 20 global climate models from the CMIP5 experiment (https://journals.ametsoc.org/doi/abs/10.1175/BAMS-D-11-00094.1), downscaled to a 4 km grid. For more information on the downscaling method and to access the data, please see Abatzoglou and Brown, 2012 (https://rmets.onlinelibrary.wiley.com/doi/full/10.1002/joc.2312) and the Northwest Knowledge Network (https://climate.northwestknowledge.net/MACA/). We used the MACAv2- Metdata monthly dataset; monthly precipitation values (mm) were summed over the season of interest (annual, winter, or summer). Absolute and percent change were then calculated between the historical and future time periods.
\\n\\nRaster data are also available for download from RMRS site (https://www.fs.usda.gov/rm/boise/AWAE/projects/NFS-regional-climate-change-maps/categories/us-raster-layers.html), along with pdf maps and detailed metadata (https://www.fs.usda.gov/rm/boise/AWAE/projects/NFS-regional-climate-change-maps/downloads/NationalForestClimateChangeMapsMetadata.pdf).
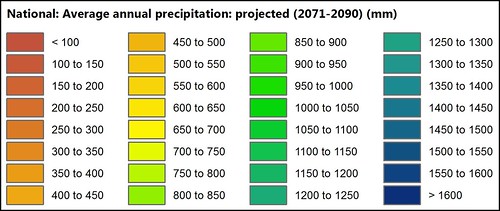
The National Forest Climate Change Maps project was developed by the Rocky Mountain Research Station (RMRS) and the Office of Sustainability and Climate to meet the needs of national forest managers for information on projected climate changes at a scale relevant to decision making processes, including forest plans. The maps use state-of-the-art science and are available for every national forest in the contiguous United States with relevant data coverage. Currently, the map sets include variables related to precipitation, air temperature, snow (including snow residence time and April 1 snow water equivalent), and stream flow.
\\n\\nHistorical (1975-2005) and future (2071-2090) precipitation and temperature data for the state of Alaska were developed by the Scenarios Network for Alaska and Arctic Planning (SNAP) (https://snap.uaf.edu). Average temperature values were calculated as the mean of monthly minimum and maximum air temperature values (degrees C), averaged over the season of interest (annual, winter, or summer). These datasets have several important differences from the MACAv2-Metdata (https://climate.northwestknowledge.net/MACA/) products, used in the contiguous U.S. They were developed using different global circulation models and different downscaling methods, and were downscaled to a different scale (771 m instead of 4 km). While these cover the same time periods and use broadly similar approaches, caution should be used when directly comparing values between Alaska and the contiguous United States.
\\n\\nRaster data are also available for download from RMRS site (https://www.fs.usda.gov/rm/boise/AWAE/projects/NFS-regional-climate-change-maps/categories/us-raster-layers.html), along with pdf maps and detailed metadata (https://www.fs.usda.gov/rm/boise/AWAE/projects/NFS-regional-climate-change-maps/downloads/NationalForestClimateChangeMapsMetadata.pdf).
\\n\\n
The National Forest Climate Change Maps project was developed by the Rocky Mountain Research Station (RMRS) and the Office of Sustainability and Climate to meet the needs of national forest managers for information on projected climate changes at a scale relevant to decision making processes, including forest plans. The maps use state-of-the-art science and are available for every national forest in the contiguous United States with relevant data coverage. Currently, the map sets include variables related to precipitation, air temperature, snow (including snow residence time and April 1 snow water equivalent), and stream flow.
Historical (1975-2005) and future (2071-2090) precipitation and temperature data for the contiguous United States are ensemble mean values across 20 global climate models from the CMIP5 experiment (https://journals.ametsoc.org/doi/abs/10.1175/BAMS-D-11-00094.1), downscaled to a 4 km grid. For more information on the downscaling method and to access the data, please see Abatzoglou and Brown, 2012 (https://rmets.onlinelibrary.wiley.com/doi/full/10.1002/joc.2312) and the Northwest Knowledge Network (https://climate.northwestknowledge.net/MACA/). We used the MACAv2- Metdata monthly dataset; average temperature values were calculated as the mean of monthly minimum and maximum air temperature values (degrees C), averaged over the season of interest (annual, winter, or summer). Absolute change was then calculated between the historical and future time periods.
Raster data are also available for download from RMRS site (https://www.fs.usda.gov/rm/boise/AWAE/projects/NFS-regional-climate-change-maps/categories/us-raster-layers.html), along with pdf maps and detailed metadata (https://www.fs.usda.gov/rm/boise/AWAE/projects/NFS-regional-climate-change-maps/downloads/NationalForestClimateChangeMapsMetadata.pdf).
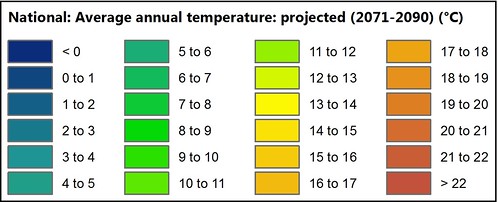
The National Forest Climate Change Maps project was developed by the Rocky Mountain Research Station (RMRS) and the Office of Sustainability and Climate to meet the needs of national forest managers for information on projected climate changes at a scale relevant to decision making processes, including forest plans. The maps use state-of-the-art science and are available for every national forest in the contiguous United States with relevant data coverage. Currently, the map sets include variables related to precipitation, air temperature, snow (including snow residence time and April 1 snow water equivalent), and stream flow.
Snow residence time (in days) and April 1 snow water equivalent (in mm) were modeled using the spatial analog models of Luce et al., 2014 (https://agupubs.onlinelibrary.wiley.com/doi/full/10.1002/2013WR014844); see also Lute and Luce, 2017 (https://agupubs.onlinelibrary.wiley.com/doi/full/10.1002/2017WR020752). These models are built on precipitation and snow data from Snowpack Telemetry (SNOTEL) stations across the western United States and temperature data from the TopoWx dataset (https://rmets.onlinelibrary.wiley.com/doi/10.1002/joc.4127). They were calculated for the historical (1975-2005) and future (2071-2090) time periods, along with absolute and percent change.
Raster data are also available for download from RMRS site (https://www.fs.usda.gov/rm/boise/AWAE/projects/NFS-regional-climate-change-maps/categories/us-raster-layers.html), along with pdf maps and detailed metadata (https://www.fs.usda.gov/rm/boise/AWAE/projects/NFS-regional-climate-change-maps/downloads/NationalForestClimateChangeMapsMetadata.pdf).
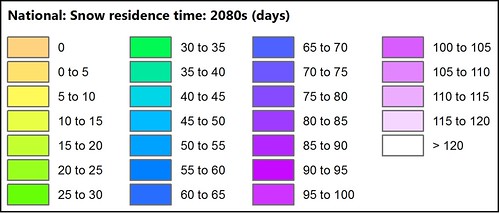
The National Forest Climate Change Maps project was developed by the Rocky Mountain Research Station (RMRS) and the Office of Sustainability and Climate to meet the needs of national forest managers for information on projected climate changes at a scale relevant to decision making processes, including forest plans. The maps use state-of-the-art science and are available for every national forest in the contiguous United States with relevant data coverage. Currently, the map sets include variables related to precipitation, air temperature, snow (including snow residence time and April 1 snow water equivalent), and stream flow.
Historical (1975-2005) and future (2071-2090) precipitation and temperature data for the state of Alaska were developed by the Scenarios Network for Alaska and Arctic Planning (SNAP) (https://snap.uaf.edu). Monthly precipitation values (mm) were summed over the season of interest (annual, winter, or summer). These datasets have several important differences from the MACAv2-Metdata (https://climate.northwestknowledge.net/MACA/) products, used in the contiguous U.S. They were developed using different global circulation models and different downscaling methods, and were downscaled to a different scale (771 m instead of 4 km). While these cover the same time periods and use broadly similar approaches, caution should be used when directly comparing values between Alaska and the contiguous United States.
Raster data are also available for download from RMRS site (https://www.fs.usda.gov/rm/boise/AWAE/projects/NFS-regional-climate-change-maps/categories/us-raster-layers.html), along with pdf maps and detailed metadata (https://www.fs.usda.gov/rm/boise/AWAE/projects/NFS-regional-climate-change-maps/downloads/NationalForestClimateChangeMapsMetadata.pdf).

The National Forest Climate Change Maps project was developed by the Rocky Mountain Research Station (RMRS) and the Office of Sustainability and Climate to meet the needs of national forest managers for information on projected climate changes at a scale relevant to decision making processes, including forest plans. The maps use state-of-the-art science and are available for every national forest in the contiguous United States with relevant data coverage. Currently, the map sets include variables related to precipitation, air temperature, snow (including snow residence time and April 1 snow water equivalent), and stream flow.
Historical (1975-2005) and future (2071-2090) precipitation and temperature data for the contiguous United States are ensemble mean values across 20 global climate models from the CMIP5 experiment (https://journals.ametsoc.org/doi/abs/10.1175/BAMS-D-11-00094.1), downscaled to a 4 km grid. For more information on the downscaling method and to access the data, please see Abatzoglou and Brown, 2012 (https://rmets.onlinelibrary.wiley.com/doi/full/10.1002/joc.2312) and the Northwest Knowledge Network (https://climate.northwestknowledge.net/MACA/). We used the MACAv2- Metdata monthly dataset; monthly precipitation values (mm) were summed over the season of interest (annual, winter, or summer). Absolute and percent change were then calculated between the historical and future time periods.
Raster data are also available for download from RMRS site (https://www.fs.usda.gov/rm/boise/AWAE/projects/NFS-regional-climate-change-maps/categories/us-raster-layers.html), along with pdf maps and detailed metadata (https://www.fs.usda.gov/rm/boise/AWAE/projects/NFS-regional-climate-change-maps/downloads/NationalForestClimateChangeMapsMetadata.pdf).
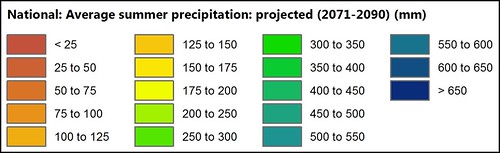
The National Forest Climate Change Maps project was developed by the Rocky Mountain Research Station (RMRS) and the Office of Sustainability and Climate to meet the needs of national forest managers for information on projected climate changes at a scale relevant to decision making processes, including forest plans. The maps use state-of-the-art science and are available for every national forest in the contiguous United States with relevant data coverage. Currently, the map sets include variables related to precipitation, air temperature, snow (including snow residence time and April 1 snow water equivalent), and stream flow.
Historical (1975-2005) and future (2071-2090) precipitation and temperature data for the state of Alaska were developed by the Scenarios Network for Alaska and Arctic Planning (SNAP) (https://snap.uaf.edu). Average temperature values were calculated as the mean of monthly minimum and maximum air temperature values (degrees C), averaged over the season of interest (annual, winter, or summer). These datasets have several important differences from the MACAv2-Metdata (https://climate.northwestknowledge.net/MACA/) products, used in the contiguous U.S. They were developed using different global circulation models and different downscaling methods, and were downscaled to a different scale (771 m instead of 4 km). While these cover the same time periods and use broadly similar approaches, caution should be used when directly comparing values between Alaska and the contiguous United States.
Raster data are also available for download from RMRS site (https://www.fs.usda.gov/rm/boise/AWAE/projects/NFS-regional-climate-change-maps/categories/us-raster-layers.html), along with pdf maps and detailed metadata (https://www.fs.usda.gov/rm/boise/AWAE/projects/NFS-regional-climate-change-maps/downloads/NationalForestClimateChangeMapsMetadata.pdf).

The National Forest Climate Change Maps project was developed by the Rocky Mountain Research Station (RMRS) and the Office of Sustainability and Climate to meet the needs of national forest managers for information on projected climate changes at a scale relevant to decision making processes, including forest plans. The maps use state-of-the-art science and are available for every national forest in the contiguous United States with relevant data coverage. Currently, the map sets include variables related to precipitation, air temperature, snow (including snow residence time and April 1 snow water equivalent), and stream flow.
\\n\\nHistorical (1975-2005) and future (2071-2090) precipitation and temperature data for the contiguous United States are ensemble mean values across 20 global climate models from the CMIP5 experiment (https://journals.ametsoc.org/doi/abs/10.1175/BAMS-D-11-00094.1), downscaled to a 4 km grid. For more information on the downscaling method and to access the data, please see Abatzoglou and Brown, 2012 (https://rmets.onlinelibrary.wiley.com/doi/full/10.1002/joc.2312) and the Northwest Knowledge Network (https://climate.northwestknowledge.net/MACA/). We used the MACAv2- Metdata monthly dataset; average temperature values were calculated as the mean of monthly minimum and maximum air temperature values (degrees C), averaged over the season of interest (annual, winter, or summer). Absolute change was then calculated between the historical and future time periods.
\\n\\nRaster data are also available for download from RMRS site (https://www.fs.usda.gov/rm/boise/AWAE/projects/NFS-regional-climate-change-maps/categories/us-raster-layers.html), along with pdf maps and detailed metadata (https://www.fs.usda.gov/rm/boise/AWAE/projects/NFS-regional-climate-change-maps/downloads/NationalForestClimateChangeMapsMetadata.pdf).
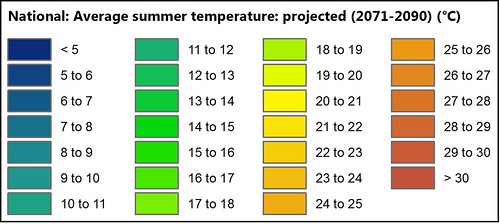
The National Forest Climate Change Maps project was developed by the Rocky Mountain Research Station (RMRS) and the Office of Sustainability and Climate to meet the needs of national forest managers for information on projected climate changes at a scale relevant to decision making processes, including forest plans. The maps use state-of-the-art science and are available for every national forest in the contiguous United States with relevant data coverage. Currently, the map sets include variables related to precipitation, air temperature, snow (including snow residence time and April 1 snow water equivalent), and stream flow.
Historical (1975-2005) and future (2071-2090) precipitation and temperature data for the state of Alaska were developed by the Scenarios Network for Alaska and Arctic Planning (SNAP) (https://snap.uaf.edu). Monthly precipitation values (mm) were summed over the season of interest (annual, winter, or summer). These datasets have several important differences from the MACAv2-Metdata (https://climate.northwestknowledge.net/MACA/) products, used in the contiguous U.S. They were developed using different global circulation models and different downscaling methods, and were downscaled to a different scale (771 m instead of 4 km). While these cover the same time periods and use broadly similar approaches, caution should be used when directly comparing values between Alaska and the contiguous United States.
Raster data are also available for download from RMRS site (https://www.fs.usda.gov/rm/boise/AWAE/projects/NFS-regional-climate-change-maps/categories/us-raster-layers.html), along with pdf maps and detailed metadata (https://www.fs.usda.gov/rm/boise/AWAE/projects/NFS-regional-climate-change-maps/downloads/NationalForestClimateChangeMapsMetadata.pdf).

The National Forest Climate Change Maps project was developed by the Rocky Mountain Research Station (RMRS) and the Office of Sustainability and Climate to meet the needs of national forest managers for information on projected climate changes at a scale relevant to decision making processes, including forest plans. The maps use state-of-the-art science and are available for every national forest in the contiguous United States with relevant data coverage. Currently, the map sets include variables related to precipitation, air temperature, snow (including snow residence time and April 1 snow water equivalent), and stream flow.
Historical (1975-2005) and future (2071-2090) precipitation and temperature data for the contiguous United States are ensemble mean values across 20 global climate models from the CMIP5 experiment (https://journals.ametsoc.org/doi/abs/10.1175/BAMS-D-11-00094.1), downscaled to a 4 km grid. For more information on the downscaling method and to access the data, please see Abatzoglou and Brown, 2012 (https://rmets.onlinelibrary.wiley.com/doi/full/10.1002/joc.2312) and the Northwest Knowledge Network (https://climate.northwestknowledge.net/MACA/). We used the MACAv2- Metdata monthly dataset; monthly precipitation values (mm) were summed over the season of interest (annual, winter, or summer). Absolute and percent change were then calculated between the historical and future time periods.
Raster data are also available for download from RMRS site (https://www.fs.usda.gov/rm/boise/AWAE/projects/NFS-regional-climate-change-maps/categories/us-raster-layers.html), along with pdf maps and detailed metadata (https://www.fs.usda.gov/rm/boise/AWAE/projects/NFS-regional-climate-change-maps/downloads/NationalForestClimateChangeMapsMetadata.pdf).
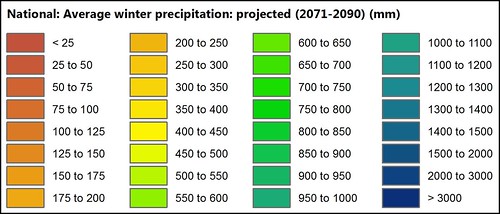
The National Forest Climate Change Maps project was developed by the Rocky Mountain Research Station (RMRS) and the Office of Sustainability and Climate to meet the needs of national forest managers for information on projected climate changes at a scale relevant to decision making processes, including forest plans. The maps use state-of-the-art science and are available for every national forest in the contiguous United States with relevant data coverage. Currently, the map sets include variables related to precipitation, air temperature, snow (including snow residence time and April 1 snow water equivalent), and stream flow.
Historical (1975-2005) and future (2071-2090) precipitation and temperature data for the state of Alaska were developed by the Scenarios Network for Alaska and Arctic Planning (SNAP) (https://snap.uaf.edu). Average temperature values were calculated as the mean of monthly minimum and maximum air temperature values (degrees C), averaged over the season of interest (annual, winter, or summer). These datasets have several important differences from the MACAv2-Metdata (https://climate.northwestknowledge.net/MACA/) products, used in the contiguous U.S. They were developed using different global circulation models and different downscaling methods, and were downscaled to a different scale (771 m instead of 4 km). While these cover the same time periods and use broadly similar approaches, caution should be used when directly comparing values between Alaska and the contiguous United States.
Raster data are also available for download from RMRS site (https://www.fs.usda.gov/rm/boise/AWAE/projects/NFS-regional-climate-change-maps/categories/us-raster-layers.html), along with pdf maps and detailed metadata (https://www.fs.usda.gov/rm/boise/AWAE/projects/NFS-regional-climate-change-maps/downloads/NationalForestClimateChangeMapsMetadata.pdf).
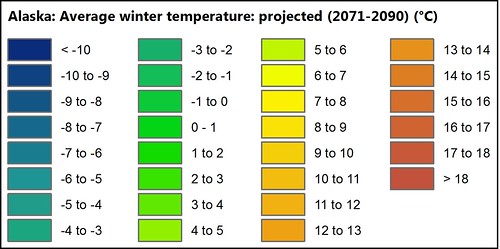
The National Forest Climate Change Maps project was developed by the Rocky Mountain Research Station (RMRS) and the Office of Sustainability and Climate to meet the needs of national forest managers for information on projected climate changes at a scale relevant to decision making processes, including forest plans. The maps use state-of-the-art science and are available for every national forest in the contiguous United States with relevant data coverage. Currently, the map sets include variables related to precipitation, air temperature, snow (including snow residence time and April 1 snow water equivalent), and stream flow.
Historical (1975-2005) and future (2071-2090) precipitation and temperature data for the contiguous United States are ensemble mean values across 20 global climate models from the CMIP5 experiment (https://journals.ametsoc.org/doi/abs/10.1175/BAMS-D-11-00094.1), downscaled to a 4 km grid. For more information on the downscaling method and to access the data, please see Abatzoglou and Brown, 2012 (https://rmets.onlinelibrary.wiley.com/doi/full/10.1002/joc.2312) and the Northwest Knowledge Network (https://climate.northwestknowledge.net/MACA/). We used the MACAv2- Metdata monthly dataset; average temperature values were calculated as the mean of monthly minimum and maximum air temperature values (degrees C), averaged over the season of interest (annual, winter, or summer). Absolute change was then calculated between the historical and future time periods.
Raster data are also available for download from RMRS site (https://www.fs.usda.gov/rm/boise/AWAE/projects/NFS-regional-climate-change-maps/categories/us-raster-layers.html), along with pdf maps and detailed metadata (https://www.fs.usda.gov/rm/boise/AWAE/projects/NFS-regional-climate-change-maps/downloads/NationalForestClimateChangeMapsMetadata.pdf).

This feature class includes States, Counties or Boroughs, Congressional Districts, Alaska Recording Districts, County Subdivisions, and Places boundaries that are derived from the latest official Census Bureau and Alaska Department of Natural Resources datasets. Features within Forest Service Administrative Forest boundaries may have been modified by the Forest Service for improved accuracy and spatial coincidence(vertical integration).
This feature class includes States, Counties or Boroughs, Congressional Districts, Alaska Recording Districts, County Subdivisions, and Places boundaries that are derived from the latest official Census Bureau and Alaska Department of Natural Resources datasets. Features within Forest Service Administrative Forest boundaries may have been modified by the Forest Service for improved accuracy and spatial coincidence(vertical integration).
The USDA Forest Service Rapid Assessment of Vegetation Condition after Wildfire (RAVG) program produces geospatial and related data representing post-fire vegetation condition by means of standardized change detection methods based on Landsat or similar multispectral satellite imagery. RAVG data products characterize the impact of disturbance (fire) on vegetation within a fire perimeter, and include estimates of percent change in live basal area (BA), percent change in canopy cover (CC), and the standardized composite burn index (CBI). Standard thematic products include 7-class percent change in basal area (BA-7), 5-class percent change in canopy cover (CC-5), and 4-class CBI (CBI-4). Contingent upon the availability of suitable imagery, RAVG products are prepared for all wildland fires reported within the conterminous United States (CONUS) that include at least 1000 acres of forested National Forest System (NFS) land (500 acres for Regions 8 and 9 as of 2016). Data for individual fires are typically made available within 45 days after fire containment (\"initial assessments\"). Late-season fires, however, may be deferred until the following spring or summer (\"extended assessments\"). Annual national mosaics of each thematic product are prepared at the end of the fire season and updated, as needed, when additional fires from the given year are processed. The annual mosaics are available via the Raster Data Warehouse (RDW, see https://apps.fs.usda.gov/arcx/rest/services/RDW_Wildfire). A combined perimeter dataset, including the burn boundaries for all published Forest Service RAVG fires from 2012 to the present, is likewise updated as needed (at least annually). This current dataset is derived from the combined perimeter dataset and adds spatial information about land ownership (National Forest) and wilderness status, as well as the areal extent of forested land (pre-fire) that experience a modeled BA loss above 50 and 75 percent.
", "title": "Geopolitical Units adjusted within Administrative Forest Boundaries: Congressional Districts FS revised 2020 Census (Feature Layer)", "distribution": [ { "accessURL": "https://www.arcgis.com/sharing/rest/content/items/726e9f93a04249c7b8b52526d564f300/info/metadata/metadata.xml?format=iso19139", "@type": "dcat:Distribution", "mediaType": "text/xml", "conformsTo": "https://www.isotc211.org/2005/gmi", "title": "ISO-19139 metadata" }, { "accessURL": "https://data-usfs.hub.arcgis.com/maps/usfs::geopolitical-units-adjusted-within-administrative-forest-boundaries-congressional-districts-fs-revised-2020-census-feature-layer", "@type": "dcat:Distribution", "format": "Web Page", "mediaType": "text/html", "title": "ArcGIS Hub Dataset" }, { "accessURL": "https://apps.fs.usda.gov/arcx/rest/services/EDW/EDW_GeopoliticalUnit_01/MapServer/4", "@type": "dcat:Distribution", "format": "ArcGIS GeoServices REST API", "mediaType": "application/json", "title": "ArcGIS GeoService" }, { "accessURL": "https://data-usfs.hub.arcgis.com/api/download/v1/items/726e9f93a04249c7b8b52526d564f300/csv?layers=4", "@type": "dcat:Distribution", "format": "CSV", "mediaType": "text/csv", "title": "CSV" }, { "accessURL": "https://data-usfs.hub.arcgis.com/api/download/v1/items/726e9f93a04249c7b8b52526d564f300/geojson?layers=4", "@type": "dcat:Distribution", "format": "GeoJSON", "mediaType": "application/vnd.geo+json", "title": "GeoJSON" }, { "accessURL": "https://data-usfs.hub.arcgis.com/api/download/v1/items/726e9f93a04249c7b8b52526d564f300/shapefile?layers=4", "@type": "dcat:Distribution", "format": "ZIP", "mediaType": "application/zip", "title": "Shapefile" }, { "accessURL": "https://data-usfs.hub.arcgis.com/api/download/v1/items/726e9f93a04249c7b8b52526d564f300/kml?layers=4", "@type": "dcat:Distribution", "format": "KML", "mediaType": "application/vnd.google-earth.kml+xml", "title": "KML" } ], "bureauCode": [ "005:96" ], "modified": "2024-06-23", "theme": [ "geospatial" ], "keyword": [ "Basal Area", "Burn Severity", "Canopy Cover", "CBI", "Composite Burn Index", "CONUS", "Perimeter", "RAVG", "United States", "Vegetation Condition", "Wildfire", "Wildland Fire", "Biota", "Burn Area Boundary" ], "spatial": "-180.0000,-14.6018,180.0000,71.9996", "issued": "2017-03-27", "identifier": "https://www.arcgis.com/home/item.html?id=726e9f93a04249c7b8b52526d564f300&sublayer=4", "accessLevel": "public", "programCode": [ "005:059" ], "landingPage": "https://data-usfs.hub.arcgis.com/maps/usfs::geopolitical-units-adjusted-within-administrative-forest-boundaries-congressional-districts-fs-revised-2020-census-feature-layer", "license": "https://creativecommons.org/licenses/by/4.0/", "publisher": { "name": "U.S. Forest Service" } }, { "contactPoint": { "hasEmail": "mailto:SM.FS.data@usda.gov", "@type": "vcard:Contact", "fn": "USFSEnterpriseContent" }, "description": "This feature class includes States, Counties or Boroughs, Congressional Districts, Alaska Recording Districts, County Subdivisions, and Places boundaries that are derived from the latest official Census Bureau and Alaska Department of Natural Resources datasets. Features within Forest Service Administrative Forest boundaries may have been modified by the Forest Service for improved accuracy and spatial coincidence(vertical integration).
This feature class includes States, Counties or Boroughs, Congressional Districts, Alaska Recording Districts, County Subdivisions, and Places boundaries that are derived from the latest official Census Bureau and Alaska Department of Natural Resources datasets. Features within Forest Service Administrative Forest boundaries may have been modified by the Forest Service for improved accuracy and spatial coincidence(vertical integration).
This feature class includes States, Counties or Boroughs, Congressional Districts, Alaska Recording Districts, County Subdivisions, and Places boundaries that are derived from the latest official Census Bureau and Alaska Department of Natural Resources datasets. Features within Forest Service Administrative Forest boundaries may have been modified by the Forest Service for improved accuracy and spatial coincidence(vertical integration).
The National Forest Climate Change Maps project was developed by the Rocky Mountain Research Station (RMRS) and the Office of Sustainability and Climate to meet the needs of national forest managers for information on projected climate changes at a scale relevant to decision making processes, including forest plans. The maps use state-of-the-art science and are available for every national forest in the contiguous United States with relevant data coverage. Currently, the map sets include variables related to precipitation, air temperature, snow (including snow residence time and April 1 snow water equivalent), and stream flow.
Snow residence time (in days) and April 1 snow water equivalent (in mm) were modeled using the spatial analog models of Luce et al., 2014 (https://agupubs.onlinelibrary.wiley.com/doi/full/10.1002/2013WR014844); see also Lute and Luce, 2017 (https://agupubs.onlinelibrary.wiley.com/doi/full/10.1002/2017WR020752). These models are built on precipitation and snow data from Snowpack Telemetry (SNOTEL) stations across the western United States and temperature data from the TopoWx dataset (https://rmets.onlinelibrary.wiley.com/doi/10.1002/joc.4127). They were calculated for the historical (1975-2005) and future (2071-2090) time periods, along with absolute and percent change.
Raster data are also available for download from RMRS site (https://www.fs.usda.gov/rm/boise/AWAE/projects/NFS-regional-climate-change-maps/categories/us-raster-layers.html), along with pdf maps and detailed metadata (https://www.fs.usda.gov/rm/boise/AWAE/projects/NFS-regional-climate-change-maps/downloads/NationalForestClimateChangeMapsMetadata.pdf).
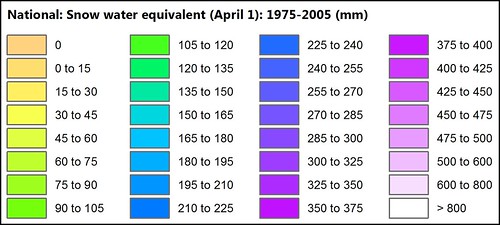
The National Forest Climate Change Maps project was developed by the Rocky Mountain Research Station (RMRS) and the Office of Sustainability and Climate to meet the needs of national forest managers for information on projected climate changes at a scale relevant to decision making processes, including forest plans. The maps use state-of-the-art science and are available for every national forest in the contiguous United States with relevant data coverage. Currently, the map sets include variables related to precipitation, air temperature, snow (including snow residence time and April 1 snow water equivalent), and stream flow.
\\Historical (1975-2005) and future (2071-2090) precipitation and temperature data for the contiguous United States are ensemble mean values across 20 global climate models from the CMIP5 experiment (https://journals.ametsoc.org/doi/abs/10.1175/BAMS-D-11-00094.1), downscaled to a 4 km grid. For more information on the downscaling method and to access the data, please see Abatzoglou and Brown, 2012 (https://rmets.onlinelibrary.wiley.com/doi/full/10.1002/joc.2312) and the Northwest Knowledge Network (https://climate.northwestknowledge.net/MACA/). We used the MACAv2- Metdata monthly dataset; monthly precipitation values (mm) were summed over the season of interest (annual, winter, or summer). Absolute and percent change were then calculated between the historical and future time periods.Historical (1975-2005) and future (2071-2090) precipitation and temperature data for the state of Alaska were developed by the Scenarios Network for Alaska and Arctic Planning (SNAP) (https://snap.uaf.edu). These datasets have several important differences from the MACAv2-Metdata (https://climate.northwestknowledge.net/MACA/) products, used in the contiguous U.S. They were developed using different global circulation models and different downscaling methods, and were downscaled to a different scale (771 m instead of 4 km). While these cover the same time periods and use broadly similar approaches, caution should be used when directly comparing values between Alaska and the contiguous United States.
Raster data are also available for download from RMRS site (https://www.fs.usda.gov/rm/boise/AWAE/projects/NFS-regional-climate-change-maps/categories/us-raster-layers.html), along with pdf maps and detailed metadata (https://www.fs.usda.gov/rm/boise/AWAE/projects/NFS-regional-climate-change-maps/downloads/NationalForestClimateChangeMapsMetadata.pdf).
", "title": "Historical and future precipitation trends (Map Service)", "distribution": [ { "accessURL": "https://www.arcgis.com/sharing/rest/content/items/6f289e36fb6a41e986159c4be262f3f6/info/metadata/metadata.xml?format=iso19139", "@type": "dcat:Distribution", "mediaType": "text/xml", "conformsTo": "https://www.isotc211.org/2005/gmi", "title": "ISO-19139 metadata" }, { "accessURL": "https://data-usfs.hub.arcgis.com/documents/usfs::historical-and-future-precipitation-trends-map-service", "@type": "dcat:Distribution", "format": "Web Page", "mediaType": "text/html", "title": "ArcGIS Hub Dataset" }, { "accessURL": "https://usfs.maps.arcgis.com/home/item.html?id=b52fafc45be4492f9ba52fe8e7324188", "@type": "dcat:Distribution", "format": "ArcGIS GeoServices REST API", "mediaType": "application/json", "title": "ArcGIS GeoService" } ], "bureauCode": [ "005:96" ], "modified": "2022-08-29", "theme": [ "geospatial" ], "keyword": [ "USDA Forest Service", "USFS", "Office of Sustainability and Climate", "OSC", "Rocky Mountain Research Station", "RMRS", "Air Water and Aquatic Environments Program", "AWAE", "climate", "climate change", "National Forests", "Open Data", "precipitation", "water yield", "Alaska", "continental U.S." ], "spatial": "-131.3620,6.8980,-65.6380,72.6220", "issued": "2019-02-20", "identifier": "https://www.arcgis.com/home/item.html?id=6f289e36fb6a41e986159c4be262f3f6", "accessLevel": "public", "programCode": [ "005:059" ], "landingPage": "https://data-usfs.hub.arcgis.com/documents/usfs::historical-and-future-precipitation-trends-map-service", "license": "https://creativecommons.org/licenses/by/4.0/", "publisher": { "name": "U.S. Forest Service" } }, { "contactPoint": { "hasEmail": "mailto:SM.FS.data@usda.gov", "@type": "vcard:Contact", "fn": "USFSEnterpriseContent" }, "description": "The National Forest Climate Change Maps project was developed by the Rocky Mountain Research Station (RMRS) and the Office of Sustainability and Climate to meet the needs of national forest managers for information on projected climate changes at a scale relevant to decision making processes, including forest plans. The maps use state-of-the-art science and are available for every national forest in the contiguous United States with relevant data coverage. Currently, the map sets include variables related to precipitation, air temperature, snow (including snow residence time and April 1 snow water equivalent), and stream flow.
\\n\\nSnow residence time (in days) and April 1 snow water equivalent (in mm) were modeled using the spatial analog models of Luce et al., 2014 (https://agupubs.onlinelibrary.wiley.com/doi/full/10.1002/2013WR014844); see also Lute and Luce, 2017 (https://agupubs.onlinelibrary.wiley.com/doi/full/10.1002/2017WR020752). These models are built on precipitation and snow data from Snowpack Telemetry (SNOTEL) stations across the western United States and temperature data from the TopoWx dataset (https://rmets.onlinelibrary.wiley.com/doi/10.1002/joc.4127).
\\n\\nRaster data are also available for download from RMRS site (https://www.fs.usda.gov/rm/boise/AWAE/projects/NFS-regional-climate-change-maps/categories/us-raster-layers.html), along with pdf maps and detailed metadata (https://www.fs.usda.gov/rm/boise/AWAE/projects/NFS-regional-climate-change-maps/downloads/NationalForestClimateChangeMapsMetadata.pdf).
", "title": "Historical and future snow trends (Map Service)", "distribution": [ { "accessURL": "https://www.arcgis.com/sharing/rest/content/items/d32079321f964b59a08b286b30c7f514/info/metadata/metadata.xml?format=iso19139", "@type": "dcat:Distribution", "mediaType": "text/xml", "conformsTo": "https://www.isotc211.org/2005/gmi", "title": "ISO-19139 metadata" }, { "accessURL": "https://data-usfs.hub.arcgis.com/documents/usfs::historical-and-future-snow-trends-map-service", "@type": "dcat:Distribution", "format": "Web Page", "mediaType": "text/html", "title": "ArcGIS Hub Dataset" }, { "accessURL": "https://usfs.maps.arcgis.com/home/item.html?id=c1c503382e5245dea84c07be00e61e18", "@type": "dcat:Distribution", "format": "ArcGIS GeoServices REST API", "mediaType": "application/json", "title": "ArcGIS GeoService" } ], "bureauCode": [ "005:96" ], "modified": "2022-08-25", "theme": [ "geospatial" ], "keyword": [ "USDA Forest Service", "USFS", "Office of Sustainability and Climate", "OSC", "Rocky Mountain Research Station", "RMRS", "Air Water and Aquatic Environments Program", "AWAE", "climate", "climate change", "National Forests", "Open Data", "snow", "snow residence time", "SRT", "snow water equivalent", "SWE", "Alaska", "continental U.S." ], "spatial": "-131.3620,6.8980,-65.6380,72.6220", "issued": "2019-02-20", "identifier": "https://www.arcgis.com/home/item.html?id=d32079321f964b59a08b286b30c7f514", "accessLevel": "public", "programCode": [ "005:059" ], "landingPage": "https://data-usfs.hub.arcgis.com/documents/usfs::historical-and-future-snow-trends-map-service", "license": "https://creativecommons.org/licenses/by/4.0/", "publisher": { "name": "U.S. Forest Service" } }, { "contactPoint": { "hasEmail": "mailto:SM.FS.data@usda.gov", "@type": "vcard:Contact", "fn": "USFSEnterpriseContent" }, "description": "The National Forest Climate Change Maps project was developed by the Rocky Mountain Research Station (RMRS) and the Office of Sustainability and Climate to meet the needs of national forest managers for information on projected climate changes at a scale relevant to decision making processes, including forest plans. The maps use state-of-the-art science and are available for every national forest in the contiguous United States with relevant data coverage. Currently, the map sets include variables related to precipitation, air temperature, snow (including snow residence time and April 1 snow water equivalent), and stream flow.
\\n\\nHistorical (1975-2005) and future (2071-2090) precipitation and temperature data for the contiguous United States are ensemble mean values across 20 global climate models from the CMIP5 experiment (https://journals.ametsoc.org/doi/abs/10.1175/BAMS-D-11-00094.1), downscaled to a 4 km grid. For more information on the downscaling method and to access the data, please see Abatzoglou and Brown, 2012 (https://rmets.onlinelibrary.wiley.com/doi/full/10.1002/joc.2312) and the Northwest Knowledge Network (https://climate.northwestknowledge.net/MACA/). We used the MACAv2- Metdata monthly dataset; average temperature values were calculated as the mean of monthly minimum and maximum air temperature values (degrees C), averaged over the season of interest (annual, winter, or summer). Absolute and percent change were then calculated between the historical and future time periods.
\\n\\nHistorical (1975-2005) and future (2071-2090) precipitation and temperature data for the state of Alaska were developed by the Scenarios Network for Alaska and Arctic Planning (SNAP) (https://snap.uaf.edu). These datasets have several important differences from the MACAv2-Metdata (https://climate.northwestknowledge.net/MACA/) products, used in the contiguous U.S. They were developed using different global circulation models and different downscaling methods, and were downscaled to a different scale (771 m instead of 4 km). While these cover the same time periods and use broadly similar approaches, caution should be used when directly comparing values between Alaska and the contiguous United States.
\\n\\nRaster data are also available for download from RMRS site (https://www.fs.usda.gov/rm/boise/AWAE/projects/NFS-regional-climate-change-maps/categories/us-raster-layers.html), along with pdf maps and detailed metadata (https://www.fs.usda.gov/rm/boise/AWAE/projects/NFS-regional-climate-change-maps/downloads/NationalForestClimateChangeMapsMetadata.pdf).
", "title": "Historical and future temperature trends (Map Service)", "distribution": [ { "accessURL": "https://www.arcgis.com/sharing/rest/content/items/d9e653180595478c86d7a01d83a07451/info/metadata/metadata.xml?format=iso19139", "@type": "dcat:Distribution", "mediaType": "text/xml", "conformsTo": "https://www.isotc211.org/2005/gmi", "title": "ISO-19139 metadata" }, { "accessURL": "https://data-usfs.hub.arcgis.com/documents/usfs::historical-and-future-temperature-trends-map-service", "@type": "dcat:Distribution", "format": "Web Page", "mediaType": "text/html", "title": "ArcGIS Hub Dataset" }, { "accessURL": "https://usfs.maps.arcgis.com/home/item.html?id=9a709b237d5940cf97cc24176e36ad88", "@type": "dcat:Distribution", "format": "ArcGIS GeoServices REST API", "mediaType": "application/json", "title": "ArcGIS GeoService" } ], "bureauCode": [ "005:96" ], "modified": "2022-08-25", "theme": [ "geospatial" ], "keyword": [ "USDA Forest Service", "USFS", "Office of Sustainability and Climate", "OSC", "Rocky Mountain Research Station", "RMRS", "Air Water and Aquatic Environments Program", "AWAE", "climate", "climate change", "National Forests", "Open Data", "temperature", "warming", "Alaska", "continental U.S." ], "spatial": "-131.3620,6.8980,-65.6380,72.6220", "issued": "2019-02-20", "identifier": "https://www.arcgis.com/home/item.html?id=d9e653180595478c86d7a01d83a07451", "accessLevel": "public", "programCode": [ "005:059" ], "landingPage": "https://data-usfs.hub.arcgis.com/documents/usfs::historical-and-future-temperature-trends-map-service", "license": "https://creativecommons.org/licenses/by/4.0/", "publisher": { "name": "U.S. Forest Service" } }, { "contactPoint": { "hasEmail": "mailto:SM.FS.data@usda.gov", "@type": "vcard:Contact", "fn": "USFSEnterpriseContent" }, "description": "The National Forest Climate Change Maps project was developed by the Rocky Mountain Research Station (RMRS) and the Office of Sustainability and Climate to meet the needs of national forest managers for information on projected climate changes at a scale relevant to decision making processes, including forest plans. The maps use state-of-the-art science and are available for every national forest in the contiguous United States with relevant data coverage. Currently, the map sets include variables related to precipitation, air temperature, snow (including snow residence time and April 1 snow water equivalent), and stream flow.
Historical (1975-2005) and future (2071-2090) precipitation and temperature data for the state of Alaska were developed by the Scenarios Network for Alaska and Arctic Planning (SNAP) (https://snap.uaf.edu). Monthly precipitation values (mm) were summed over the season of interest (annual, winter, or summer). These datasets have several important differences from the MACAv2-Metdata (https://climate.northwestknowledge.net/MACA/) products, used in the contiguous U.S. They were developed using different global circulation models and different downscaling methods, and were downscaled to a different scale (771 m instead of 4 km). While these cover the same time periods and use broadly similar approaches, caution should be used when directly comparing values between Alaska and the contiguous United States.
Raster data are also available for download from RMRS site (https://www.fs.usda.gov/rm/boise/AWAE/projects/NFS-regional-climate-change-maps/categories/us-raster-layers.html), along with pdf maps and detailed metadata (https://www.fs.usda.gov/rm/boise/AWAE/projects/NFS-regional-climate-change-maps/downloads/NationalForestClimateChangeMapsMetadata.pdf).

The National Forest Climate Change Maps project was developed by the Rocky Mountain Research Station (RMRS) and the Office of Sustainability and Climate to meet the needs of national forest managers for information on projected climate changes at a scale relevant to decision making processes, including forest plans. The maps use state-of-the-art science and are available for every national forest in the contiguous United States with relevant data coverage. Currently, the map sets include variables related to precipitation, air temperature, snow (including snow residence time and April 1 snow water equivalent), and stream flow.
Historical (1975-2005) and future (2071-2090) precipitation and temperature data for the contiguous United States are ensemble mean values across 20 global climate models from the CMIP5 experiment (https://journals.ametsoc.org/doi/abs/10.1175/BAMS-D-11-00094.1), downscaled to a 4 km grid. For more information on the downscaling method and to access the data, please see Abatzoglou and Brown, 2012 (https://rmets.onlinelibrary.wiley.com/doi/full/10.1002/joc.2312) and the Northwest Knowledge Network (https://climate.northwestknowledge.net/MACA/). We used the MACAv2- Metdata monthly dataset; monthly precipitation values (mm) were summed over the season of interest (annual, winter, or summer). Absolute and percent change were then calculated between the historical and future time periods.
Raster data are also available for download from RMRS site (https://www.fs.usda.gov/rm/boise/AWAE/projects/NFS-regional-climate-change-maps/categories/us-raster-layers.html), along with pdf maps and detailed metadata (https://www.fs.usda.gov/rm/boise/AWAE/projects/NFS-regional-climate-change-maps/downloads/NationalForestClimateChangeMapsMetadata.pdf).

The National Forest Climate Change Maps project was developed by the Rocky Mountain Research Station (RMRS) and the Office of Sustainability and Climate to meet the needs of national forest managers for information on projected climate changes at a scale relevant to decision making processes, including forest plans. The maps use state-of-the-art science and are available for every national forest in the contiguous United States with relevant data coverage. Currently, the map sets include variables related to precipitation, air temperature, snow (including snow residence time and April 1 snow water equivalent), and stream flow.
Historical (1975-2005) and future (2071-2090) precipitation and temperature data for the state of Alaska were developed by the Scenarios Network for Alaska and Arctic Planning (SNAP) (https://snap.uaf.edu). Average temperature values were calculated as the mean of monthly minimum and maximum air temperature values (degrees C), averaged over the season of interest (annual, winter, or summer). These datasets have several important differences from the MACAv2-Metdata (https://climate.northwestknowledge.net/MACA/) products, used in the contiguous U.S. They were developed using different global circulation models and different downscaling methods, and were downscaled to a different scale (771 m instead of 4 km). While these cover the same time periods and use broadly similar approaches, caution should be used when directly comparing values between Alaska and the contiguous United States.
Raster data are also available for download from RMRS site (https://www.fs.usda.gov/rm/boise/AWAE/projects/NFS-regional-climate-change-maps/categories/us-raster-layers.html), along with pdf maps and detailed metadata (https://www.fs.usda.gov/rm/boise/AWAE/projects/NFS-regional-climate-change-maps/downloads/NationalForestClimateChangeMapsMetadata.pdf).

The National Forest Climate Change Maps project was developed by the Rocky Mountain Research Station (RMRS) and the Office of Sustainability and Climate to meet the needs of national forest managers for information on projected climate changes at a scale relevant to decision making processes, including forest plans. The maps use state-of-the-art science and are available for every national forest in the contiguous United States with relevant data coverage. Currently, the map sets include variables related to precipitation, air temperature, snow (including snow residence time and April 1 snow water equivalent), and stream flow.
\\n\\nHistorical (1975-2005) and future (2071-2090) precipitation and temperature data for the contiguous United States are ensemble mean values across 20 global climate models from the CMIP5 experiment (https://journals.ametsoc.org/doi/abs/10.1175/BAMS-D-11-00094.1), downscaled to a 4 km grid. For more information on the downscaling method and to access the data, please see Abatzoglou and Brown, 2012 (https://rmets.onlinelibrary.wiley.com/doi/full/10.1002/joc.2312) and the Northwest Knowledge Network (https://climate.northwestknowledge.net/MACA/). We used the MACAv2- Metdata monthly dataset; average temperature values were calculated as the mean of monthly minimum and maximum air temperature values (degrees C), averaged over the season of interest (annual, winter, or summer). Absolute change was then calculated between the historical and future time periods.
\\n\\nRaster data are also available for download from RMRS site (https://www.fs.usda.gov/rm/boise/AWAE/projects/NFS-regional-climate-change-maps/categories/us-raster-layers.html), along with pdf maps and detailed metadata (https://www.fs.usda.gov/rm/boise/AWAE/projects/NFS-regional-climate-change-maps/downloads/NationalForestClimateChangeMapsMetadata.pdf).

The National Forest Climate Change Maps project was developed by the Rocky Mountain Research Station (RMRS) and the Office of Sustainability and Climate to meet the needs of national forest managers for information on projected climate changes at a scale relevant to decision making processes, including forest plans. The maps use state-of-the-art science and are available for every national forest in the contiguous United States with relevant data coverage. Currently, the map sets include variables related to precipitation, air temperature, snow (including snow residence time and April 1 snow water equivalent), and stream flow.
Snow residence time (in days) and April 1 snow water equivalent (in mm) were modeled using the spatial analog models of Luce et al., 2014 (https://agupubs.onlinelibrary.wiley.com/doi/full/10.1002/2013WR014844); see also Lute and Luce, 2017 (https://agupubs.onlinelibrary.wiley.com/doi/full/10.1002/2017WR020752). These models are built on precipitation and snow data from Snowpack Telemetry (SNOTEL) stations across the western United States and temperature data from the TopoWx dataset (https://rmets.onlinelibrary.wiley.com/doi/10.1002/joc.4127). They were calculated for the historical (1975-2005) and future (2071-2090) time periods, along with absolute and percent change.
Raster data are also available for download from RMRS site (https://www.fs.usda.gov/rm/boise/AWAE/projects/NFS-regional-climate-change-maps/categories/us-raster-layers.html), along with pdf maps and detailed metadata (https://www.fs.usda.gov/rm/boise/AWAE/projects/NFS-regional-climate-change-maps/downloads/NationalForestClimateChangeMapsMetadata.pdf).
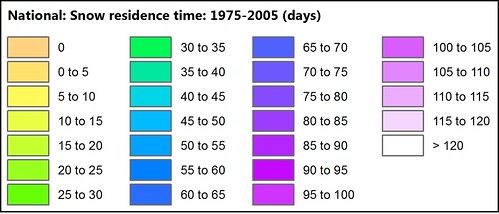
The National Forest Climate Change Maps project was developed by the Rocky Mountain Research Station (RMRS) and the Office of Sustainability and Climate to meet the needs of national forest managers for information on projected climate changes at a scale relevant to decision making processes, including forest plans. The maps use state-of-the-art science and are available for every national forest in the contiguous United States with relevant data coverage. Currently, the map sets include variables related to precipitation, air temperature, snow (including snow residence time and April 1 snow water equivalent), and stream flow.
\\n\\nHistorical (1975-2005) and future (2071-2090) precipitation and temperature data for the state of Alaska were developed by the Scenarios Network for Alaska and Arctic Planning (SNAP) (https://snap.uaf.edu). Monthly precipitation values (mm) were summed over the season of interest (annual, winter, or summer). These datasets have several important differences from the MACAv2-Metdata (https://climate.northwestknowledge.net/MACA/) products, used in the contiguous U.S. They were developed using different global circulation models and different downscaling methods, and were downscaled to a different scale (771 m instead of 4 km). While these cover the same time periods and use broadly similar approaches, caution should be used when directly comparing values between Alaska and the contiguous United States.
\\n\\nRaster data are also available for download from RMRS site (https://www.fs.usda.gov/rm/boise/AWAE/projects/NFS-regional-climate-change-maps/categories/us-raster-layers.html), along with pdf maps and detailed metadata (https://www.fs.usda.gov/rm/boise/AWAE/projects/NFS-regional-climate-change-maps/downloads/NationalForestClimateChangeMapsMetadata.pdf).
\\n\\n
The National Forest Climate Change Maps project was developed by the Rocky Mountain Research Station (RMRS) and the Office of Sustainability and Climate to meet the needs of national forest managers for information on projected climate changes at a scale relevant to decision making processes, including forest plans. The maps use state-of-the-art science and are available for every national forest in the contiguous United States with relevant data coverage. Currently, the map sets include variables related to precipitation, air temperature, snow (including snow residence time and April 1 snow water equivalent), and stream flow.
Historical (1975-2005) and future (2071-2090) precipitation and temperature data for the contiguous United States are ensemble mean values across 20 global climate models from the CMIP5 experiment (https://journals.ametsoc.org/doi/abs/10.1175/BAMS-D-11-00094.1), downscaled to a 4 km grid. For more information on the downscaling method and to access the data, please see Abatzoglou and Brown, 2012 (https://rmets.onlinelibrary.wiley.com/doi/full/10.1002/joc.2312) and the Northwest Knowledge Network (https://climate.northwestknowledge.net/MACA/). We used the MACAv2- Metdata monthly dataset; monthly precipitation values (mm) were summed over the season of interest (annual, winter, or summer). Absolute and percent change were then calculated between the historical and future time periods.
Raster data are also available for download from RMRS site (https://www.fs.usda.gov/rm/boise/AWAE/projects/NFS-regional-climate-change-maps/categories/us-raster-layers.html), along with pdf maps and detailed metadata (https://www.fs.usda.gov/rm/boise/AWAE/projects/NFS-regional-climate-change-maps/downloads/NationalForestClimateChangeMapsMetadata.pdf).

The National Forest Climate Change Maps project was developed by the Rocky Mountain Research Station (RMRS) and the Office of Sustainability and Climate to meet the needs of national forest managers for information on projected climate changes at a scale relevant to decision making processes, including forest plans. The maps use state-of-the-art science and are available for every national forest in the contiguous United States with relevant data coverage. Currently, the map sets include variables related to precipitation, air temperature, snow (including snow residence time and April 1 snow water equivalent), and stream flow.
Historical (1975-2005) and future (2071-2090) precipitation and temperature data for the state of Alaska were developed by the Scenarios Network for Alaska and Arctic Planning (SNAP) (https://snap.uaf.edu). Average temperature values were calculated as the mean of monthly minimum and maximum air temperature values (degrees C), averaged over the season of interest (annual, winter, or summer). These datasets have several important differences from the MACAv2-Metdata (https://climate.northwestknowledge.net/MACA/) products, used in the contiguous U.S. They were developed using different global circulation models and different downscaling methods, and were downscaled to a different scale (771 m instead of 4 km). While these cover the same time periods and use broadly similar approaches, caution should be used when directly comparing values between Alaska and the contiguous United States.
Raster data are also available for download from RMRS site (https://www.fs.usda.gov/rm/boise/AWAE/projects/NFS-regional-climate-change-maps/categories/us-raster-layers.html), along with pdf maps and detailed metadata (https://www.fs.usda.gov/rm/boise/AWAE/projects/NFS-regional-climate-change-maps/downloads/NationalForestClimateChangeMapsMetadata.pdf).
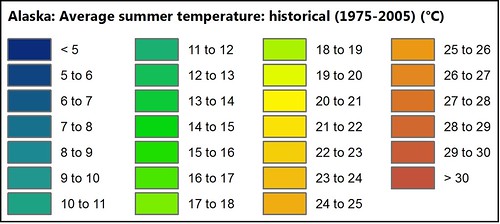
The National Forest Climate Change Maps project was developed by the Rocky Mountain Research Station (RMRS) and the Office of Sustainability and Climate to meet the needs of national forest managers for information on projected climate changes at a scale relevant to decision making processes, including forest plans. The maps use state-of-the-art science and are available for every national forest in the contiguous United States with relevant data coverage. Currently, the map sets include variables related to precipitation, air temperature, snow (including snow residence time and April 1 snow water equivalent), and stream flow.
\\n\\nHistorical (1975-2005) and future (2071-2090) precipitation and temperature data for the contiguous United States are ensemble mean values across 20 global climate models from the CMIP5 experiment (https://journals.ametsoc.org/doi/abs/10.1175/BAMS-D-11-00094.1), downscaled to a 4 km grid. For more information on the downscaling method and to access the data, please see Abatzoglou and Brown, 2012 (https://rmets.onlinelibrary.wiley.com/doi/full/10.1002/joc.2312) and the Northwest Knowledge Network (https://climate.northwestknowledge.net/MACA/). We used the MACAv2- Metdata monthly dataset; average temperature values were calculated as the mean of monthly minimum and maximum air temperature values (degrees C), averaged over the season of interest (annual, winter, or summer). Absolute change was then calculated between the historical and future time periods.
\\n\\nRaster data are also available for download from RMRS site (https://www.fs.usda.gov/rm/boise/AWAE/projects/NFS-regional-climate-change-maps/categories/us-raster-layers.html), along with pdf maps and detailed metadata (https://www.fs.usda.gov/rm/boise/AWAE/projects/NFS-regional-climate-change-maps/downloads/NationalForestClimateChangeMapsMetadata.pdf).
\\n\\n", "title": "Historical summer temperature (CONUS) (Image Service)", "distribution": [ { "accessURL": "https://www.arcgis.com/sharing/rest/content/items/d2542bb7a86d437f91ab0755d4121891/info/metadata/metadata.xml?format=iso19139", "@type": "dcat:Distribution", "mediaType": "text/xml", "conformsTo": "https://www.isotc211.org/2005/gmi", "title": "ISO-19139 metadata" }, { "accessURL": "https://data-usfs.hub.arcgis.com/datasets/usfs::historical-summer-temperature-conus-image-service", "@type": "dcat:Distribution", "format": "Web Page", "mediaType": "text/html", "title": "ArcGIS Hub Dataset" }, { "accessURL": "https://apps.fs.usda.gov/fsgisx01/rest/services/RDW_Climate/AvgSummerTempHistorical1975_2005_CONUS/ImageServer", "@type": "dcat:Distribution", "format": "ArcGIS GeoServices REST API", "mediaType": "application/json", "title": "ArcGIS GeoService" } ], "bureauCode": [ "005:96" ], "modified": "2022-08-25", "theme": [ "geospatial" ], "keyword": [ "USDA Forest Service", "USFS", "Office of Sustainability and Climate", "OSC", "Rocky Mountain Research Station", "RMRS", "Air Water and Aquatic Environments Program", "AWAE", "climate", "climate change", "National Forests", "Open Data", "temperature", "warming", "CONUS", "contiguous U.S." ], "spatial": "-124.7930,25.0434,-67.0430,49.4169", "issued": "2019-03-05", "identifier": "https://www.arcgis.com/home/item.html?id=d2542bb7a86d437f91ab0755d4121891", "accessLevel": "public", "programCode": [ "005:059" ], "landingPage": "https://data-usfs.hub.arcgis.com/datasets/usfs::historical-summer-temperature-conus-image-service", "license": "https://creativecommons.org/licenses/by/4.0/", "publisher": { "name": "U.S. Forest Service" } }, { "contactPoint": { "hasEmail": "mailto:SM.FS.data@usda.gov", "@type": "vcard:Contact", "fn": "USFSEnterpriseContent" }, "description": "The National Forest Climate Change Maps project was developed by the Rocky Mountain Research Station (RMRS) and the Office of Sustainability and Climate to meet the needs of national forest managers for information on projected climate changes at a scale relevant to decision making processes, including forest plans. The maps use state-of-the-art science and are available for every national forest in the contiguous United States with relevant data coverage. Currently, the map sets include variables related to precipitation, air temperature, snow (including snow residence time and April 1 snow water equivalent), and stream flow.
Historical (1975-2005) and future (2071-2090) precipitation and temperature data for the state of Alaska were developed by the Scenarios Network for Alaska and Arctic Planning (SNAP) (https://snap.uaf.edu). Monthly precipitation values (mm) were summed over the season of interest (annual, winter, or summer). These datasets have several important differences from the MACAv2-Metdata (https://climate.northwestknowledge.net/MACA/) products, used in the contiguous U.S. They were developed using different global circulation models and different downscaling methods, and were downscaled to a different scale (771 m instead of 4 km). While these cover the same time periods and use broadly similar approaches, caution should be used when directly comparing values between Alaska and the contiguous United States.
Raster data are also available for download from RMRS site (https://www.fs.usda.gov/rm/boise/AWAE/projects/NFS-regional-climate-change-maps/categories/us-raster-layers.html), along with pdf maps and detailed metadata (https://www.fs.usda.gov/rm/boise/AWAE/projects/NFS-regional-climate-change-maps/downloads/NationalForestClimateChangeMapsMetadata.pdf).
", "title": "Historical winter precipitation (Alaska) (Image Service)", "distribution": [ { "accessURL": "https://www.arcgis.com/sharing/rest/content/items/ab29080ff57f4153973fc2679aff0c85/info/metadata/metadata.xml?format=iso19139", "@type": "dcat:Distribution", "mediaType": "text/xml", "conformsTo": "https://www.isotc211.org/2005/gmi", "title": "ISO-19139 metadata" }, { "accessURL": "https://data-usfs.hub.arcgis.com/datasets/usfs::historical-winter-precipitation-alaska-image-service", "@type": "dcat:Distribution", "format": "Web Page", "mediaType": "text/html", "title": "ArcGIS Hub Dataset" }, { "accessURL": "https://apps.fs.usda.gov/fsgisx01/rest/services/RDW_Climate/AvgWinterPrecipHistorical1975_2005_AK/ImageServer", "@type": "dcat:Distribution", "format": "ArcGIS GeoServices REST API", "mediaType": "application/json", "title": "ArcGIS GeoService" } ], "bureauCode": [ "005:96" ], "modified": "2022-08-29", "theme": [ "geospatial" ], "keyword": [ "USDA Forest Service", "USFS", "Office of Sustainability and Climate", "OSC", "Rocky Mountain Research Station", "RMRS", "Air Water and Aquatic Environments Program", "AWAE", "climate", "climate change", "National Forests", "Open Data", "precipitation", "water yield", "Alaska" ], "spatial": "-180.0000,49.1064,180.0000,71.4307", "issued": "2019-03-05", "identifier": "https://www.arcgis.com/home/item.html?id=ab29080ff57f4153973fc2679aff0c85", "accessLevel": "public", "programCode": [ "005:059" ], "landingPage": "https://data-usfs.hub.arcgis.com/datasets/usfs::historical-winter-precipitation-alaska-image-service", "license": "https://creativecommons.org/licenses/by/4.0/", "publisher": { "name": "U.S. Forest Service" } }, { "contactPoint": { "hasEmail": "mailto:SM.FS.data@usda.gov", "@type": "vcard:Contact", "fn": "USFSEnterpriseContent" }, "description": "The National Forest Climate Change Maps project was developed by the Rocky Mountain Research Station (RMRS) and the Office of Sustainability and Climate to meet the needs of national forest managers for information on projected climate changes at a scale relevant to decision making processes, including forest plans. The maps use state-of-the-art science and are available for every national forest in the contiguous United States with relevant data coverage. Currently, the map sets include variables related to precipitation, air temperature, snow (including snow residence time and April 1 snow water equivalent), and stream flow.
\\n\\nHistorical (1975-2005) and future (2071-2090) precipitation and temperature data for the contiguous United States are ensemble mean values across 20 global climate models from the CMIP5 experiment (https://journals.ametsoc.org/doi/abs/10.1175/BAMS-D-11-00094.1), downscaled to a 4 km grid. For more information on the downscaling method and to access the data, please see Abatzoglou and Brown, 2012 (https://rmets.onlinelibrary.wiley.com/doi/full/10.1002/joc.2312) and the Northwest Knowledge Network (https://climate.northwestknowledge.net/MACA/). We used the MACAv2- Metdata monthly dataset; monthly precipitation values (mm) were summed over the season of interest (annual, winter, or summer). Absolute and percent change were then calculated between the historical and future time periods.
\\n\\nRaster data are also available for download from RMRS site (https://www.fs.usda.gov/rm/boise/AWAE/projects/NFS-regional-climate-change-maps/categories/us-raster-layers.html), along with pdf maps and detailed metadata (https://www.fs.usda.gov/rm/boise/AWAE/projects/NFS-regional-climate-change-maps/downloads/NationalForestClimateChangeMapsMetadata.pdf).
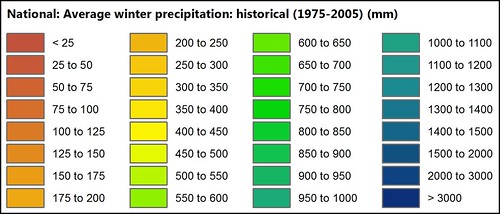
The National Forest Climate Change Maps project was developed by the Rocky Mountain Research Station (RMRS) and the Office of Sustainability and Climate to meet the needs of national forest managers for information on projected climate changes at a scale relevant to decision making processes, including forest plans. The maps use state-of-the-art science and are available for every national forest in the contiguous United States with relevant data coverage. Currently, the map sets include variables related to precipitation, air temperature, snow (including snow residence time and April 1 snow water equivalent), and stream flow.
\\n\\nHistorical (1975-2005) and future (2071-2090) precipitation and temperature data for the state of Alaska were developed by the Scenarios Network for Alaska and Arctic Planning (SNAP) (https://snap.uaf.edu). Average temperature values were calculated as the mean of monthly minimum and maximum air temperature values (degrees C), averaged over the season of interest (annual, winter, or summer). These datasets have several important differences from the MACAv2-Metdata (https://climate.northwestknowledge.net/MACA/) products, used in the contiguous U.S. They were developed using different global circulation models and different downscaling methods, and were downscaled to a different scale (771 m instead of 4 km). While these cover the same time periods and use broadly similar approaches, caution should be used when directly comparing values between Alaska and the contiguous United States.
\\n\\nRaster data are also available for download from RMRS site (https://www.fs.usda.gov/rm/boise/AWAE/projects/NFS-regional-climate-change-maps/categories/us-raster-layers.html), along with pdf maps and detailed metadata (https://www.fs.usda.gov/rm/boise/AWAE/projects/NFS-regional-climate-change-maps/downloads/NationalForestClimateChangeMapsMetadata.pdf).
The National Forest Climate Change Maps project was developed by the Rocky Mountain Research Station (RMRS) and the Office of Sustainability and Climate to meet the needs of national forest managers for information on projected climate changes at a scale relevant to decision making processes, including forest plans. The maps use state-of-the-art science and are available for every national forest in the contiguous United States with relevant data coverage. Currently, the map sets include variables related to precipitation, air temperature, snow (including snow residence time and April 1 snow water equivalent), and stream flow.
Historical (1975-2005) and future (2071-2090) precipitation and temperature data for the contiguous United States are ensemble mean values across 20 global climate models from the CMIP5 experiment (https://journals.ametsoc.org/doi/abs/10.1175/BAMS-D-11-00094.1), downscaled to a 4 km grid. For more information on the downscaling method and to access the data, please see Abatzoglou and Brown, 2012 (https://rmets.onlinelibrary.wiley.com/doi/full/10.1002/joc.2312) and the Northwest Knowledge Network (https://climate.northwestknowledge.net/MACA/). We used the MACAv2- Metdata monthly dataset; average temperature values were calculated as the mean of monthly minimum and maximum air temperature values (degrees C), averaged over the season of interest (annual, winter, or summer). Absolute change was then calculated between the historical and future time periods.
Raster data are also available for download from RMRS site (https://www.fs.usda.gov/rm/boise/AWAE/projects/NFS-regional-climate-change-maps/categories/us-raster-layers.html), along with pdf maps and detailed metadata (https://www.fs.usda.gov/rm/boise/AWAE/projects/NFS-regional-climate-change-maps/downloads/NationalForestClimateChangeMapsMetadata.pdf).
In 2021, the Federal Accounting Standards Advisory Board (FASAB) initiated a tracking mechanism that requires all federal agencies that own or manage land to categorize the acres of those lands into three broad categories of predominant land use and produce an annual report. In this context the USDA Forest Service has considered the definitions of each category and classified all acres of National Forest System (NFS) lands into 1. Conservation/Preservation, 2. Commercial, 3. Operational designations. Those designations are additionally separated by whether the lands have been identified as Stewardship lands, or if the lands were acquired by the federal government for General Plant, Property & Equipment purposes. In response, the Washington Office Lands and Realty Management staff determined the appropriate data sources for this annual report and developed classification rules and a geoprocessing methodology to overlay and extract a seamless and complete NFS acreage total by the required categorizations. The acres of land in each category are dynamic, as the status of surface ownership may change from year to year based on administrative and congressional designations, purchases, dispositions, or exchanges. The data used to generate the report are updated weekly, and this translates into continuously refreshed reporting and mapping products. Presented here is the spatial representation of the rule-based land category designations of NFS lands.The FASAB land categories are defined as follows:Conservation/ Preservation: land or land rights that are predominantly used for conservation or preservation purposes.Conservation: protection and proper use of natural resources.Preservation: the protection of buildings, objects, and landscapes.Commercial: land and permanent land rights that are predominately used to generate inflows of resources derived from the land itself or activities that nonfederal third parties perform on the land, usually through special use permits, right-of-way grants, and leases.Operational: land that is used for general or administrative purposes.The Land_FASAB dataset covers National Forest System Lands including federally owned units of forest, range, and related land consisting of national forests, purchase units, national grasslands, land utilization project areas, experimental forest areas, experimental range areas, designated experimental areas, other land areas, water areas, and interests in lands that are administered by the U.S. Department of Agriculture (USDA) Forest Service or designated for administration through the Forest Service. Additional information on this FASAB and the geoprocessing used to produce this dataset can be found here: https://www.fs.usda.gov/sites/default/files/Land-FASAB-dataset-FAQ.pdf
This product is part of the Landscape Change Monitoring System (LCMS) data suite. It shows LCMS change attribution classes for each year. See additional information about change in the Entity_and_Attribute_Information or Fields section below.LCMS is a remote sensing-based system for mapping and monitoring landscape change across the United States. Its objective is to develop a consistent approach using the latest technology and advancements in change detection to produce a \"best available\" map of landscape change. Because no algorithm performs best in all situations, LCMS uses an ensemble of models as predictors, which improves map accuracy across a range of ecosystems and change processes (Healey et al., 2018). The resulting suite of LCMS change, land cover, and land use maps offer a holistic depiction of landscape change across the United States over the past four decades.Predictor layers for the LCMS model include outputs from the LandTrendr and CCDC change detection algorithms and terrain information. These components are all accessed and processed using Google Earth Engine (Gorelick et al., 2017). To produce annual composites, the cFmask (Zhu and Woodcock, 2012), cloudScore, and TDOM (Chastain et al., 2019) cloud and cloud shadow masking methods are applied to Landsat Tier 1 and Sentinel 2a and 2b Level-1C top of atmosphere reflectance data. The annual medoid is then computed to summarize each year into a single composite. The composite time series is temporally segmented using LandTrendr (Kennedy et al., 2010; Kennedy et al., 2018; Cohen et al., 2018). All cloud and cloud shadow free values are also temporally segmented using the CCDC algorithm (Zhu and Woodcock, 2014). LandTrendr, CCDC and terrain predictors can be used as independent predictor variables in a Random Forest (Breiman, 2001) model. LandTrendr predictor variables include fitted values, pair-wise differences, segment duration, change magnitude, and slope. CCDC predictor variables include CCDC sine and cosine coefficients (first 3 harmonics), fitted values, and pairwise differences from the Julian Day of each pixel used in the annual composites and LandTrendr. Terrain predictor variables include elevation, slope, sine of aspect, cosine of aspect, and topographic position indices (Weiss, 2001) from the USGS 3D Elevation Program (3DEP) (U.S. Geological Survey, 2019). Reference data are collected using TimeSync, a web-based tool that helps analysts visualize and interpret the Landsat data record from 1984-present (Cohen et al., 2010).Outputs fall into three categories: change, land cover, and land use. Change relates specifically to vegetation cover and includes slow loss (not included for PRUSVI), fast loss (which also includes hydrologic changes such as inundation or desiccation), and gain. These values are predicted for each year of the time series and serve as the foundational products for LCMS. References: Breiman, L. (2001). Random Forests. In Machine Learning (Vol. 45, pp. 5-32). https://doi.org/10.1023/A:1010933404324Chastain, R., Housman, I., Goldstein, J., Finco, M., and Tenneson, K. (2019). Empirical cross sensor comparison of Sentinel-2A and 2B MSI, Landsat-8 OLI, and Landsat-7 ETM top of atmosphere spectral characteristics over the conterminous United States. In Remote Sensing of Environment (Vol. 221, pp. 274-285). https://doi.org/10.1016/j.rse.2018.11.012Cohen, W. B., Yang, Z., and Kennedy, R. (2010). Detecting trends in forest disturbance and recovery using yearly Landsat time series: 2. TimeSync - Tools for calibration and validation. In Remote Sensing of Environment (Vol. 114, Issue 12, pp. 2911-2924). https://doi.org/10.1016/j.rse.2010.07.010Cohen, W. B., Yang, Z., Healey, S. P., Kennedy, R. E., and Gorelick, N. (2018). A LandTrendr multispectral ensemble for forest disturbance detection. In Remote Sensing of Environment (Vol. 205, pp. 131-140). https://doi.org/10.1016/j.rse.2017.11.015Foga, S., Scaramuzza, P.L., Guo, S., Zhu, Z., Dilley, R.D., Beckmann, T., Schmidt, G.L., Dwyer, J.L., Hughes, M.J., Laue, B. (2017). Cloud detection algorithm comparison and validation for operational Landsat data products. Remote Sensing of Environment, 194, 379-390. http://doi.org/10.1016/j.rse.2017.03.026Gorelick, N., Hancher, M., Dixon, M., Ilyushchenko, S., Thau, D., and Moore, R. (2017). Google Earth Engine: Planetary-scale geospatial analysis for everyone. In Remote Sensing of Environment (Vol. 202, pp. 18-27). https://doi.org/10.1016/j.rse.2017.06.031Healey, S. P., Cohen, W. B., Yang, Z., Kenneth Brewer, C., Brooks, E. B., Gorelick, N., Hernandez, A. J., Huang, C., Joseph Hughes, M., Kennedy, R. E., Loveland, T. R., Moisen, G. G., Schroeder, T. A., Stehman, S. V., Vogelmann, J. E., Woodcock, C. E., Yang, L., and Zhu, Z. (2018). Mapping forest change using stacked generalization: An ensemble approach. In Remote Sensing of Environment (Vol. 204, pp. 717-728). https://doi.org/10.1016/j.rse.2017.09.029Kennedy, R. E., Yang, Z., and Cohen, W. B. (2010). Detecting trends in forest disturbance and recovery using yearly Landsat time series: 1. LandTrendr - Temporal segmentation algorithms. In Remote Sensing of Environment (Vol. 114, Issue 12, pp. 2897-2910). https://doi.org/10.1016/j.rse.2010.07.008Kennedy, R., Yang, Z., Gorelick, N., Braaten, J., Cavalcante, L., Cohen, W., and Healey, S. (2018). Implementation of the LandTrendr Algorithm on Google Earth Engine. In Remote Sensing (Vol. 10, Issue 5, p. 691). https://doi.org/10.3390/rs10050691Olofsson, P., Foody, G. M., Herold, M., Stehman, S. V., Woodcock, C. E., and Wulder, M. A. (2014). Good practices for estimating area and assessing accuracy of land change. In Remote Sensing of Environment (Vol. 148, pp. 42-57). https://doi.org/10.1016/j.rse.2014.02.015Pedregosa, F., Varoquaux, G., Gramfort, A., Michel, V., Thirion, B., Grisel, O., Blondel, M., Prettenhofer, P., Weiss, R., Dubourg, V., Vanderplas, J., Passos, A., Cournapeau, D., Brucher, M., Perrot, M. and Duchesnay, E. (2011). Scikit-learn: Machine Learning in Python. In Journal of Machine Learning Research (Vol. 12, pp. 2825-2830).Pengra, B. W., Stehman, S. V., Horton, J. A., Dockter, D. J., Schroeder, T. A., Yang, Z., Cohen, W. B., Healey, S. P., and Loveland, T. R. (2020). Quality control and assessment of interpreter consistency of annual land cover reference data in an operational national monitoring program. In Remote Sensing of Environment (Vol. 238, p. 111261). https://doi.org/10.1016/j.rse.2019.111261U.S. Geological Survey. (2019). USGS 3D Elevation Program Digital Elevation Model, accessed August 2022 at https://developers.google.com/earth-engine/datasets/catalog/USGS_3DEP_10mWeiss, A.D. (2001). Topographic position and landforms analysis Poster Presentation, ESRI Users Conference, San Diego, CAZhu, Z., and Woodcock, C. E. (2012). Object-based cloud and cloud shadow detection in Landsat imagery. In Remote Sensing of Environment (Vol. 118, pp. 83-94). https://doi.org/10.1016/j.rse.2011.10.028Zhu, Z., and Woodcock, C. E. (2014). Continuous change detection and classification of land cover using all available Landsat data. In Remote Sensing of Environment (Vol. 144, pp. 152-171). https://doi.org/10.1016/j.rse.2014.01.011
The Landscape Change Monitoring System (LCMS) is an emerging remote sensing-based system for mapping and monitoring land cover change across the United States. The objective of LCMS is to develop a consistent approach using the latest technology and advancements in change detection to produce a \"best available\" map of landscape change. Data products consist of Raster datasets of \"loss\", \"gain\" and landuse/landcover for all year from 1985 to present. LCMS data are designed to advance and modernize our intra- and inter-agency monitoring capabilities using reference data and a series of change detection algorithms. Because no algorithm performs best in all situations, LCMS uses an ensemble model to improve map accuracy across a range of ecosystems and disturbance processes. Reference data are collected using TimeSync, a web-based tool that helps analysts visualize and interpret the Landsat data record from 1984-present. The LCMS ensemble model yields a \"best available\" map highlighting a multitude of change processes and land cover types.
", "title": "Landscape Change Monitoring System (LCMS) Puerto Rico USVI Annual Landcover (Image Service)", "distribution": [ { "accessURL": "https://www.arcgis.com/sharing/rest/content/items/af8dfc8c7930428da84e5b80af7822b5/info/metadata/metadata.xml?format=iso19139", "@type": "dcat:Distribution", "mediaType": "text/xml", "conformsTo": "https://www.isotc211.org/2005/gmi", "title": "ISO-19139 metadata" }, { "accessURL": "https://data-usfs.hub.arcgis.com/datasets/usfs::landscape-change-monitoring-system-lcms-puerto-rico-usvi-annual-landcover-image-service", "@type": "dcat:Distribution", "format": "Web Page", "mediaType": "text/html", "title": "ArcGIS Hub Dataset" }, { "accessURL": "https://apps.fs.usda.gov/fsgisx01/rest/services/RDW_LandscapeAndWildlife/LCMS_PuertoRico_USVI_Annual_Landcover/ImageServer", "@type": "dcat:Distribution", "format": "ArcGIS GeoServices REST API", "mediaType": "application/json", "title": "ArcGIS GeoService" } ], "bureauCode": [ "005:96" ], "modified": "2024-05-10", "theme": [ "geospatial" ], "keyword": [ "GTAC", "Open Data", "BaseMaps", "EarthCover", "Imagery", "Digital Spatial Data", "Continuous", "Land Cover", "Land Use", "Land Cover Change", "Land Use Change", "Change Detection", "NGDA", "Remote Sensing", "National Geospatial Data Asset", "Land Use Land Cover Theme", "Environment", "GIS" ], "spatial": "-67.9502,17.0137,-64.3980,19.3199", "issued": "2024-05-03", "identifier": "https://www.arcgis.com/home/item.html?id=af8dfc8c7930428da84e5b80af7822b5", "accessLevel": "public", "programCode": [ "005:059" ], "landingPage": "https://data-usfs.hub.arcgis.com/datasets/usfs::landscape-change-monitoring-system-lcms-puerto-rico-usvi-annual-landcover-image-service", "license": "https://creativecommons.org/licenses/by/4.0/", "publisher": { "name": "U.S. Forest Service" } }, { "contactPoint": { "hasEmail": "mailto:SM.FS.data@usda.gov", "@type": "vcard:Contact", "fn": "USFSEnterpriseContent" }, "description": "The Landscape Change Monitoring System (LCMS) is an emerging remote sensing-based system for mapping and monitoring land cover change across the United States. The objective of LCMS is to develop a consistent approach using the latest technology and advancements in change detection to produce a 'best available' map of landscape change. Data products consist of Raster datasets of 'loss', 'gain' and landuse/landcover for all year from 1985 to present. LCMS data are designed to advance and modernize our intra- and inter-agency monitoring capabilities using reference data and a series of change detection algorithms. Because no algorithm performs best in all situations, LCMS uses an ensemble model to improve map accuracy across a range of ecosystems and disturbance processes. Reference data are collected using TimeSync, a web-based tool that helps analysts visualize and interpret the Landsat data record from 1984-present. The LCMS ensemble model yields a 'best available' map highlighting a multitude of change processes and land cover types. ", "title": "Landscape Change Monitoring System (LCMS) Puerto Rico USVI Annual Landuse (Image Service)", "distribution": [ { "accessURL": "https://www.arcgis.com/sharing/rest/content/items/788df035a1874919b054e34e6da8a633/info/metadata/metadata.xml?format=iso19139", "@type": "dcat:Distribution", "mediaType": "text/xml", "conformsTo": "https://www.isotc211.org/2005/gmi", "title": "ISO-19139 metadata" }, { "accessURL": "https://data-usfs.hub.arcgis.com/datasets/usfs::landscape-change-monitoring-system-lcms-puerto-rico-usvi-annual-landuse-image-service", "@type": "dcat:Distribution", "format": "Web Page", "mediaType": "text/html", "title": "ArcGIS Hub Dataset" }, { "accessURL": "https://apps.fs.usda.gov/fsgisx01/rest/services/RDW_LandscapeAndWildlife/LCMS_PuertoRico_USVI_Annual_Landuse/ImageServer", "@type": "dcat:Distribution", "format": "ArcGIS GeoServices REST API", "mediaType": "application/json", "title": "ArcGIS GeoService" } ], "bureauCode": [ "005:96" ], "modified": "2024-05-10", "theme": [ "geospatial" ], "keyword": [ "GTAC", "BaseMaps", "EarthCover", "Imagery", "Digital Spatial Data", "Continuous", "Land Cover", "Land Use", "Land Cover Change", "Land Use Change", "Change Detection", "NGDA", "Remote Sensing", "National Geospatial Data Asset", "Land Use Land Cover Theme", "Environment", "GIS", "Open Data" ], "spatial": "-67.9502,17.0137,-64.3980,19.3199", "issued": "2024-05-03", "identifier": "https://www.arcgis.com/home/item.html?id=788df035a1874919b054e34e6da8a633", "accessLevel": "public", "programCode": [ "005:059" ], "landingPage": "https://data-usfs.hub.arcgis.com/datasets/usfs::landscape-change-monitoring-system-lcms-puerto-rico-usvi-annual-landuse-image-service", "license": "https://creativecommons.org/licenses/by/4.0/", "publisher": { "name": "U.S. Forest Service" } }, { "contactPoint": { "hasEmail": "mailto:SM.FS.data@usda.gov", "@type": "vcard:Contact", "fn": "USFSEnterpriseContent" }, "description": "The Landscape Change Monitoring System (LCMS) is an emerging remote sensing-based system for mapping and monitoring land cover change across the United States. The objective of LCMS is to develop a consistent approach using the latest technology and advancements in change detection to produce a 'best available' map of landscape change. Data products consist of Raster datasets of 'loss', 'gain' and landuse/landcover for all year from 1985 to present. LCMS data are designed to advance and modernize our intra- and inter-agency monitoring capabilities using reference data and a series of change detection algorithms. Because no algorithm performs best in all situations, LCMS uses an ensemble model to improve map accuracy across a range of ecosystems and disturbance processes. Reference data are collected using TimeSync, a web-based tool that helps analysts visualize and interpret the Landsat data record from 1984-present. The LCMS ensemble model yields a 'best available' map highlighting a multitude of change processes and land cover types. ", "title": "Landscape Change Monitoring System (LCMS) Puerto Rico USVI Annual QA Bits (Image Service)", "distribution": [ { "accessURL": "https://www.arcgis.com/sharing/rest/content/items/06da3b8e3d964944b7a1eefd5d3bcc78/info/metadata/metadata.xml?format=iso19139", "@type": "dcat:Distribution", "mediaType": "text/xml", "conformsTo": "https://www.isotc211.org/2005/gmi", "title": "ISO-19139 metadata" }, { "accessURL": "https://data-usfs.hub.arcgis.com/datasets/usfs::landscape-change-monitoring-system-lcms-puerto-rico-usvi-annual-qa-bits-image-service", "@type": "dcat:Distribution", "format": "Web Page", "mediaType": "text/html", "title": "ArcGIS Hub Dataset" }, { "accessURL": "https://apps.fs.usda.gov/fsgisx01/rest/services/RDW_LandscapeAndWildlife/LCMS_PuertoRico_USVI_Annual_QA_bits/ImageServer", "@type": "dcat:Distribution", "format": "ArcGIS GeoServices REST API", "mediaType": "application/json", "title": "ArcGIS GeoService" } ], "bureauCode": [ "005:96" ], "modified": "2024-05-10", "theme": [ "geospatial" ], "keyword": [ "GTAC", "BaseMaps", "EarthCover", "Imagery", "Digital Spatial Data", "Continuous", "Land Cover", "Land Use", "Land Cover Change", "Land Use Change", "Change Detection", "NGDA", "Remote Sensing", "National Geospatial Data Asset", "Land Use Land Cover Theme", "Environment", "GIS", "Open Data" ], "spatial": "-67.9502,17.0137,-64.3980,19.3199", "issued": "2024-05-03", "identifier": "https://www.arcgis.com/home/item.html?id=06da3b8e3d964944b7a1eefd5d3bcc78", "accessLevel": "public", "programCode": [ "005:059" ], "landingPage": "https://data-usfs.hub.arcgis.com/datasets/usfs::landscape-change-monitoring-system-lcms-puerto-rico-usvi-annual-qa-bits-image-service", "license": "https://creativecommons.org/licenses/by/4.0/", "publisher": { "name": "U.S. Forest Service" } }, { "contactPoint": { "hasEmail": "mailto:SM.FS.data@usda.gov", "@type": "vcard:Contact", "fn": "USFSEnterpriseContent" }, "description": "The Landscape Change Monitoring System (LCMS) is an emerging remote sensing-based system for mapping and monitoring land cover change across the United States. The objective of LCMS is to develop a consistent approach using the latest technology and advancements in change detection to produce a 'best available' map of landscape change. Data products consist of Raster datasets of 'loss', 'gain' and landuse/landcover for all year from 1985 to present. LCMS data are designed to advance and modernize our intra- and inter-agency monitoring capabilities using reference data and a series of change detection algorithms. Because no algorithm performs best in all situations, LCMS uses an ensemble model to improve map accuracy across a range of ecosystems and disturbance processes. Reference data are collected using TimeSync, a web-based tool that helps analysts visualize and interpret the Landsat data record from 1984-present. The LCMS ensemble model yields a 'best available' map highlighting a multitude of change processes and land cover types. ", "title": "Landscape Change Monitoring System (LCMS) Puerto Rico USVI Most Recent Year Fast Loss (Image Service)", "distribution": [ { "accessURL": "https://www.arcgis.com/sharing/rest/content/items/fe45a76d1bb04ac9b42ea1d65814f5ed/info/metadata/metadata.xml?format=iso19139", "@type": "dcat:Distribution", "mediaType": "text/xml", "conformsTo": "https://www.isotc211.org/2005/gmi", "title": "ISO-19139 metadata" }, { "accessURL": "https://data-usfs.hub.arcgis.com/datasets/usfs::landscape-change-monitoring-system-lcms-puerto-rico-usvi-most-recent-year-fast-loss-image-service", "@type": "dcat:Distribution", "format": "Web Page", "mediaType": "text/html", "title": "ArcGIS Hub Dataset" }, { "accessURL": "https://apps.fs.usda.gov/fsgisx01/rest/services/RDW_LandscapeAndWildlife/LCMS_PuertoRico_USVI_Most_Recent_Year_Fast_Loss/ImageServer", "@type": "dcat:Distribution", "format": "ArcGIS GeoServices REST API", "mediaType": "application/json", "title": "ArcGIS GeoService" } ], "bureauCode": [ "005:96" ], "modified": "2024-05-10", "theme": [ "geospatial" ], "keyword": [ "GTAC", "BaseMaps", "EarthCover", "Imagery", "Digital Spatial Data", "Continuous", "Land Cover", "Land Use", "Land Cover Change", "Land Use Change", "Change Detection", "NGDA", "Remote Sensing", "National Geospatial Data Asset", "Land Use Land Cover Theme", "Environment", "GIS", "Open Data" ], "spatial": "-67.9502,17.0137,-64.3980,19.3199", "issued": "2024-05-03", "identifier": "https://www.arcgis.com/home/item.html?id=fe45a76d1bb04ac9b42ea1d65814f5ed", "accessLevel": "public", "programCode": [ "005:059" ], "landingPage": "https://data-usfs.hub.arcgis.com/datasets/usfs::landscape-change-monitoring-system-lcms-puerto-rico-usvi-most-recent-year-fast-loss-image-service", "license": "https://creativecommons.org/licenses/by/4.0/", "publisher": { "name": "U.S. Forest Service" } }, { "contactPoint": { "hasEmail": "mailto:SM.FS.data@usda.gov", "@type": "vcard:Contact", "fn": "USFSEnterpriseContent" }, "description": "The Landscape Change Monitoring System (LCMS) is an emerging remote sensing-based system for mapping and monitoring land cover change across the United States. The objective of LCMS is to develop a consistent approach using the latest technology and advancements in change detection to produce a 'best available' map of landscape change. Data products consist of Raster datasets of 'loss', 'gain' and landuse/landcover for all year from 1985 to present. LCMS data are designed to advance and modernize our intra- and inter-agency monitoring capabilities using reference data and a series of change detection algorithms. Because no algorithm performs best in all situations, LCMS uses an ensemble model to improve map accuracy across a range of ecosystems and disturbance processes. Reference data are collected using TimeSync, a web-based tool that helps analysts visualize and interpret the Landsat data record from 1984-present. The LCMS ensemble model yields a 'best available' map highlighting a multitude of change processes and land cover types. ", "title": "Landscape Change Monitoring System (LCMS) Puerto Rico USVI Most Recent Year Gain (Image Service)", "distribution": [ { "accessURL": "https://www.arcgis.com/sharing/rest/content/items/4cfb5c2b1ee741b0a7085b47ac461bdd/info/metadata/metadata.xml?format=iso19139", "@type": "dcat:Distribution", "mediaType": "text/xml", "conformsTo": "https://www.isotc211.org/2005/gmi", "title": "ISO-19139 metadata" }, { "accessURL": "https://data-usfs.hub.arcgis.com/datasets/usfs::landscape-change-monitoring-system-lcms-puerto-rico-usvi-most-recent-year-gain-image-service", "@type": "dcat:Distribution", "format": "Web Page", "mediaType": "text/html", "title": "ArcGIS Hub Dataset" }, { "accessURL": "https://apps.fs.usda.gov/fsgisx01/rest/services/RDW_LandscapeAndWildlife/LCMS_PuertoRico_USVI_Most_Recent_Year_Gain/ImageServer", "@type": "dcat:Distribution", "format": "ArcGIS GeoServices REST API", "mediaType": "application/json", "title": "ArcGIS GeoService" } ], "bureauCode": [ "005:96" ], "modified": "2024-05-10", "theme": [ "geospatial" ], "keyword": [ "GTAC", "BaseMaps", "EarthCover", "Imagery", "Digital Spatial Data", "Continuous", "Land Cover", "Land Use", "Land Cover Change", "Land Use Change", "Change Detection", "NGDA", "Remote Sensing", "National Geospatial Data Asset", "Land Use Land Cover Theme", "Environment", "GIS", "Open Data" ], "spatial": "-67.9502,17.0137,-64.3980,19.3199", "issued": "2024-05-03", "identifier": "https://www.arcgis.com/home/item.html?id=4cfb5c2b1ee741b0a7085b47ac461bdd", "accessLevel": "public", "programCode": [ "005:059" ], "landingPage": "https://data-usfs.hub.arcgis.com/datasets/usfs::landscape-change-monitoring-system-lcms-puerto-rico-usvi-most-recent-year-gain-image-service", "license": "https://creativecommons.org/licenses/by/4.0/", "publisher": { "name": "U.S. Forest Service" } }, { "contactPoint": { "hasEmail": "mailto:SM.FS.data@usda.gov", "@type": "vcard:Contact", "fn": "USFSEnterpriseContent" }, "description": "The Landscape Change Monitoring System (LCMS) is an emerging remote sensing-based system for mapping and monitoring land cover change across the United States. The objective of LCMS is to develop a consistent approach using the latest technology and advancements in change detection to produce a 'best available' map of landscape change. Data products consist of Raster datasets of 'loss', 'gain' and landuse/landcover for all year from 1985 to present. LCMS data are designed to advance and modernize our intra- and inter-agency monitoring capabilities using reference data and a series of change detection algorithms. Because no algorithm performs best in all situations, LCMS uses an ensemble model to improve map accuracy across a range of ecosystems and disturbance processes. Reference data are collected using TimeSync, a web-based tool that helps analysts visualize and interpret the Landsat data record from 1984-present. The LCMS ensemble model yields a 'best available' map highlighting a multitude of change processes and land cover types. ", "title": "Landscape Change Monitoring System (LCMS) Puerto Rico USVI Year Highest Prob Fast Loss (Image Service)", "distribution": [ { "accessURL": "https://www.arcgis.com/sharing/rest/content/items/e48be13bc35d451d9c7d09f42b6e08de/info/metadata/metadata.xml?format=iso19139", "@type": "dcat:Distribution", "mediaType": "text/xml", "conformsTo": "https://www.isotc211.org/2005/gmi", "title": "ISO-19139 metadata" }, { "accessURL": "https://data-usfs.hub.arcgis.com/datasets/usfs::landscape-change-monitoring-system-lcms-puerto-rico-usvi-year-highest-prob-fast-loss-image-service", "@type": "dcat:Distribution", "format": "Web Page", "mediaType": "text/html", "title": "ArcGIS Hub Dataset" }, { "accessURL": "https://apps.fs.usda.gov/fsgisx01/rest/services/RDW_LandscapeAndWildlife/LCMS_PuertoRico_USVI_Year_Highest_Prob_Fast_Loss/ImageServer", "@type": "dcat:Distribution", "format": "ArcGIS GeoServices REST API", "mediaType": "application/json", "title": "ArcGIS GeoService" } ], "bureauCode": [ "005:96" ], "modified": "2024-05-10", "theme": [ "geospatial" ], "keyword": [ "GTAC", "BaseMaps", "EarthCover", "Imagery", "Digital Spatial Data", "Continuous", "Land Cover", "Land Use", "Land Cover Change", "Land Use Change", "Change Detection", "NGDA", "Remote Sensing", "National Geospatial Data Asset", "Land Use Land Cover Theme", "Environment", "GIS", "Open Data" ], "spatial": "-67.9502,17.0137,-64.3980,19.3199", "issued": "2024-05-03", "identifier": "https://www.arcgis.com/home/item.html?id=e48be13bc35d451d9c7d09f42b6e08de", "accessLevel": "public", "programCode": [ "005:059" ], "landingPage": "https://data-usfs.hub.arcgis.com/datasets/usfs::landscape-change-monitoring-system-lcms-puerto-rico-usvi-year-highest-prob-fast-loss-image-service", "license": "https://creativecommons.org/licenses/by/4.0/", "publisher": { "name": "U.S. Forest Service" } }, { "contactPoint": { "hasEmail": "mailto:SM.FS.data@usda.gov", "@type": "vcard:Contact", "fn": "USFSEnterpriseContent" }, "description": "The Landscape Change Monitoring System (LCMS) is an emerging remote sensing-based system for mapping and monitoring land cover change across the United States. The objective of LCMS is to develop a consistent approach using the latest technology and advancements in change detection to produce a 'best available' map of landscape change. Data products consist of Raster datasets of 'loss', 'gain' and landuse/landcover for all year from 1985 to present. LCMS data are designed to advance and modernize our intra- and inter-agency monitoring capabilities using reference data and a series of change detection algorithms. Because no algorithm performs best in all situations, LCMS uses an ensemble model to improve map accuracy across a range of ecosystems and disturbance processes. Reference data are collected using TimeSync, a web-based tool that helps analysts visualize and interpret the Landsat data record from 1984-present. The LCMS ensemble model yields a 'best available' map highlighting a multitude of change processes and land cover types. ", "title": "Landscape Change Monitoring System (LCMS) Puerto Rico USVI Year Highest Prob Gain (Image Service)", "distribution": [ { "accessURL": "https://www.arcgis.com/sharing/rest/content/items/deaadfe09d024cbf8724dec9d359a7d4/info/metadata/metadata.xml?format=iso19139", "@type": "dcat:Distribution", "mediaType": "text/xml", "conformsTo": "https://www.isotc211.org/2005/gmi", "title": "ISO-19139 metadata" }, { "accessURL": "https://data-usfs.hub.arcgis.com/datasets/usfs::landscape-change-monitoring-system-lcms-puerto-rico-usvi-year-highest-prob-gain-image-service", "@type": "dcat:Distribution", "format": "Web Page", "mediaType": "text/html", "title": "ArcGIS Hub Dataset" }, { "accessURL": "https://apps.fs.usda.gov/fsgisx01/rest/services/RDW_LandscapeAndWildlife/LCMS_PuertoRico_USVI_Year_Highest_Prob_Gain/ImageServer", "@type": "dcat:Distribution", "format": "ArcGIS GeoServices REST API", "mediaType": "application/json", "title": "ArcGIS GeoService" } ], "bureauCode": [ "005:96" ], "modified": "2024-05-10", "theme": [ "geospatial" ], "keyword": [ "GTAC", "BaseMaps", "EarthCover", "Imagery", "Digital Spatial Data", "Continuous", "Land Cover", "Land Use", "Land Cover Change", "Land Use Change", "Change Detection", "NGDA", "Remote Sensing", "National Geospatial Data Asset", "Land Use Land Cover Theme", "Environment", "GIS", "Open Data" ], "spatial": "-67.9502,17.0137,-64.3980,19.3199", "issued": "2024-05-03", "identifier": "https://www.arcgis.com/home/item.html?id=deaadfe09d024cbf8724dec9d359a7d4", "accessLevel": "public", "programCode": [ "005:059" ], "landingPage": "https://data-usfs.hub.arcgis.com/datasets/usfs::landscape-change-monitoring-system-lcms-puerto-rico-usvi-year-highest-prob-gain-image-service", "license": "https://creativecommons.org/licenses/by/4.0/", "publisher": { "name": "U.S. Forest Service" } }, { "contactPoint": { "hasEmail": "mailto:SM.FS.data@usda.gov", "@type": "vcard:Contact", "fn": "USFSEnterpriseContent" }, "description": "This product is part of the Landscape Change Monitoring System (LCMS) data suite. It shows LCMS modeled change classes for each year. See additional information about change in the Entity_and_Attribute_Information section below.LCMS is a remote sensing-based system for mapping and monitoring landscape change across the United States. Its objective is to develop a consistent approach using the latest technology and advancements in change detection to produce a \"best available\" map of landscape change. Because no algorithm performs best in all situations, LCMS uses an ensemble of models as predictors, which improves map accuracy across a range of ecosystems and change processes (Healey et al., 2018). The resulting suite of LCMS change, land cover, and land use maps offer a holistic depiction of landscape change across the United States over the past four decades. Predictor layers for the LCMS model include annual Landsat and Sentinel 2 composites, outputs from the LandTrendr and CCDC change detection algorithms, and terrain information. These components are all accessed and processed using Google Earth Engine (Gorelick et al., 2017). To produce annual composites, the cFmask (Zhu and Woodcock 2012), cloudScore, and TDOM (Chastain et al., 2019) cloud and cloud shadow masking methods are applied to Landsat Tier 1 and Sentinel 2a and 2b Level-1C top of atmosphere reflectance data. The annual medoid is then computed to summarize each year into a single composite. The composite time series is temporally segmented using LandTrendr (Kennedy et al., 2010; Kennedy et al., 2018; Cohen et al., 2018). All cloud and cloud shadow free values are also temporally segmented using the CCDC algorithm (Zhu and Woodcock, 2014). The raw composite values, LandTrendr fitted values, pair-wise differences, segment duration, change magnitude, and slope, and CCDC September 1 sine and cosine coefficients (first 3 harmonics), fitted values, and pairwise differences, along with elevation, slope, sine of aspect, cosine of aspect, and topographic position indices (Weiss, 2001) from the National Elevation Dataset (NED), are used as independent predictor variables in a Random Forest (Breiman, 2001) model. Reference data are collected using TimeSync, a web-based tool that helps analysts visualize and interpret the Landsat data record from 1984-present (Cohen et al., 2010).Outputs fall into three categories: change, land cover, and land use. Change relates specifically to vegetation cover and includes slow loss, fast loss (which also includes hydrologic changes such as inundation or desiccation), and gain. These values are predicted for each year of the Landsat time series and serve as the foundational products for LCMS.References:Breiman, L. (2001). Machine Learning (Vol. 45, Issue 3, pp. 261-277). https://doi.org/10.1023/a:1017934522171Chastain, R., Housman, I., Goldstein, J., Finco, M., and Tenneson, K. (2019). Empirical cross sensor comparison of Sentinel-2A and 2B MSI, Landsat-8 OLI, and Landsat-7 ETM top of atmosphere spectral characteristics over the conterminous United States. In Remote Sensing of Environment (Vol. 221, pp. 274-285). https://doi.org/10.1016/j.rse.2018.11.012Cohen, W. B., Yang, Z., and Kennedy, R. (2010). Detecting trends in forest disturbance and recovery using yearly Landsat time series: 2. TimeSync - Tools for calibration and validation. In Remote Sensing of Environment (Vol. 114, Issue 12, pp. 2911-2924). https://doi.org/10.1016/j.rse.2010.07.010Cohen, W. B., Yang, Z., Healey, S. P., Kennedy, R. E., and Gorelick, N. (2018). A LandTrendr multispectral ensemble for forest disturbance detection. In Remote Sensing of Environment (Vol. 205, pp. 131-140). https://doi.org/10.1016/j.rse.2017.11.015 Gorelick, N., Hancher, M., Dixon, M., Ilyushchenko, S., Thau, D., and Moore, R. (2017). Google Earth Engine: Planetary-scale geospatial analysis for everyone. In Remote Sensing of Environment (Vol. 202, pp. 18-27). https://doi.org/10.1016/j.rse.2017.06.031 Healey, S. P., Cohen, W. B., Yang, Z., Kenneth Brewer, C., Brooks, E. B., Gorelick, N., Hernandez, A. J., Huang, C., Joseph Hughes, M., Kennedy, R. E., Loveland, T. R., Moisen, G. G., Schroeder, T. A., Stehman, S. V., Vogelmann, J. E., Woodcock, C. E., Yang, L., and Zhu, Z. (2018). Mapping forest change using stacked generalization: An ensemble approach. In Remote Sensing of Environment (Vol. 204, pp. 717-728). https://doi.org/10.1016/j.rse.2017.09.029Kennedy, R. E., Yang, Z., and Cohen, W. B. (2010). Detecting trends in forest disturbance and recovery using yearly Landsat time series: 1. LandTrendr - Temporal segmentation algorithms. In Remote Sensing of Environment (Vol. 114, Issue 12, pp. 2897-2910). https://doi.org/10.1016/j.rse.2010.07.008 Kennedy, R., Yang, Z., Gorelick, N., Braaten, J., Cavalcante, L., Cohen, W., and Healey, S. (2018). Implementation of the LandTrendr Algorithm on Google Earth Engine. In Remote Sensing (Vol. 10, Issue 5, p. 691). https://doi.org/10.3390/rs10050691Weiss, A.D. (2001). Topographic position and landforms analysis Poster Presentation, ESRI Users Conference, San Diego, CA Zhu, Z., and Woodcock, C. E. (2012). Object-based cloud and cloud shadow detection in Landsat imagery. In Remote Sensing of Environment (Vol. 118, pp. 83-94). https://doi.org/10.1016/j.rse.2011.10.028Zhu, Z., and Woodcock, C. E. (2014). Continuous change detection and classification of land cover using all available Landsat data. In Remote Sensing of Environment (Vol. 144, pp. 152-171). https://doi.org/10.1016/j.rse.2014.01.011", "title": "Landscape Change Monitoring System (LCMS) Southeast Alaska Annual Change (Image Service)", "distribution": [ { "accessURL": "https://www.arcgis.com/sharing/rest/content/items/ea9add6e651b45b38fe54c1a4c34a357/info/metadata/metadata.xml?format=iso19139", "@type": "dcat:Distribution", "mediaType": "text/xml", "conformsTo": "https://www.isotc211.org/2005/gmi", "title": "ISO-19139 metadata" }, { "accessURL": "https://data-usfs.hub.arcgis.com/datasets/usfs::landscape-change-monitoring-system-lcms-southeast-alaska-annual-change-image-service", "@type": "dcat:Distribution", "format": "Web Page", "mediaType": "text/html", "title": "ArcGIS Hub Dataset" }, { "accessURL": "https://apps.fs.usda.gov/fsgisx01/rest/services/RDW_LandscapeAndWildlife/LCMS_Southeast_Alaska_Annual_Change/ImageServer", "@type": "dcat:Distribution", "format": "ArcGIS GeoServices REST API", "mediaType": "application/json", "title": "ArcGIS GeoService" } ], "bureauCode": [ "005:96" ], "modified": "2024-05-24", "theme": [ "geospatial" ], "keyword": [ "GTAC", "BaseMaps", "EarthCover", "Imagery", "Digital Spatial Data", "Continuous", "Land Cover", "Land Use", "Land Cover Change", "Land Use Change", "Change Detection", "NGDA", "Remote Sensing", "National Geospatial Data Asset", "Land Use Land Cover Theme", "Environment", "GIS", "Open Data" ], "spatial": "-180.0000,49.1387,180.0000,71.4155", "issued": "2024-05-03", "identifier": "https://www.arcgis.com/home/item.html?id=ea9add6e651b45b38fe54c1a4c34a357", "accessLevel": "public", "programCode": [ "005:059" ], "landingPage": "https://data-usfs.hub.arcgis.com/datasets/usfs::landscape-change-monitoring-system-lcms-southeast-alaska-annual-change-image-service", "license": "https://creativecommons.org/licenses/by/4.0/", "publisher": { "name": "U.S. Forest Service" } }, { "contactPoint": { "hasEmail": "mailto:SM.FS.data@usda.gov", "@type": "vcard:Contact", "fn": "USFSEnterpriseContent" }, "description": "This product is part of the Landscape Change Monitoring System (LCMS) data suite. It shows LCMS modeled land cover classes for each year. See additional information about land cover in the Entity_and_Attribute_Information section below. LCMS is a remote sensing-based system for mapping and monitoring landscape change across the United States. Its objective is to develop a consistent approach using the latest technology and advancements in change detection to produce a \"best available\" map of landscape change. Because no algorithm performs best in all situations, LCMS uses an ensemble of models as predictors, which improves map accuracy across a range of ecosystems and change processes (Healey et al., 2018). The resulting suite of LCMS change, land cover, and land use maps offer a holistic depiction of landscape change across the United States over the past four decades. Predictor layers for the LCMS model include annual Landsat and Sentinel 2 composites, outputs from the LandTrendr and CCDC change detection algorithms, and terrain information. These components are all accessed and processed using Google Earth Engine (Gorelick et al., 2017). To produce annual composites, the cFmask (Zhu and Woodcock 2012), cloudScore, and TDOM (Chastain et al., 2019) cloud and cloud shadow masking methods are applied to Landsat Tier 1 and Sentinel 2a and 2b Level-1C top of atmosphere reflectance data. The annual medoid is then computed to summarize each year into a single composite. The composite time series is temporally segmented using LandTrendr (Kennedy et al., 2010; Kennedy et al., 2018; Cohen et al., 2018). All cloud and cloud shadow free values are also temporally segmented using the CCDC algorithm (Zhu and Woodcock, 2014). The raw composite values, LandTrendr fitted values, pair-wise differences, segment duration, change magnitude, and slope, and CCDC September 1 sine and cosine coefficients (first 3 harmonics), fitted values, and pairwise differences, along with elevation, slope, sine of aspect, cosine of aspect, and topographic position indices (Weiss, 2001) from the National Elevation Dataset (NED), are used as independent predictor variables in a Random Forest (Breiman, 2001) model. Reference data are collected using TimeSync, a web-based tool that helps analysts visualize and interpret the Landsat data record from 1984-present (Cohen et al., 2010). Outputs fall into three categories: change, land cover, and land use. Change relates specifically to vegetation cover and includes slow loss, fast loss (which also includes hydrologic changes such as inundation or desiccation), and gain. These values are predicted for each year of the Landsat time series and serve as the foundational products for LCMS.References:Breiman, L. (2001). Machine Learning (Vol. 45, Issue 3, pp. 261-277). https://doi.org/10.1023/a:1017934522171 Chastain, R., Housman, I., Goldstein, J., Finco, M., and Tenneson, K. (2019). Empirical cross sensor comparison of Sentinel-2A and 2B MSI, Landsat-8 OLI, and Landsat-7 ETM top of atmosphere spectral characteristics over the conterminous United States. In Remote Sensing of Environment (Vol. 221, pp. 274-285). https://doi.org/10.1016/j.rse.2018.11.012 Cohen, W. B., Yang, Z., and Kennedy, R. (2010). Detecting trends in forest disturbance and recovery using yearly Landsat time series: 2. TimeSync - Tools for calibration and validation. In Remote Sensing of Environment (Vol. 114, Issue 12, pp. 2911-2924). https://doi.org/10.1016/j.rse.2010.07.010 Cohen, W. B., Yang, Z., Healey, S. P., Kennedy, R. E., and Gorelick, N. (2018). A LandTrendr multispectral ensemble for forest disturbance detection. In Remote Sensing of Environment (Vol. 205, pp. 131-140). https://doi.org/10.1016/j.rse.2017.11.015 Gorelick, N., Hancher, M., Dixon, M., Ilyushchenko, S., Thau, D., and Moore, R. (2017). Google Earth Engine: Planetary-scale geospatial analysis for everyone. In Remote Sensing of Environment (Vol. 202, pp. 18-27). https://doi.org/10.1016/j.rse.2017.06.031 Healey, S. P., Cohen, W. B., Yang, Z., Kenneth Brewer, C., Brooks, E. B., Gorelick, N., Hernandez, A. J., Huang, C., Joseph Hughes, M., Kennedy, R. E., Loveland, T. R., Moisen, G. G., Schroeder, T. A., Stehman, S. V., Vogelmann, J. E., Woodcock, C. E., Yang, L., and Zhu, Z. (2018). Mapping forest change using stacked generalization: An ensemble approach. In Remote Sensing of Environment (Vol. 204, pp. 717-728). https://doi.org/10.1016/j.rse.2017.09.029 Kennedy, R. E., Yang, Z., and Cohen, W. B. (2010). Detecting trends in forest disturbance and recovery using yearly Landsat time series: 1. LandTrendr - Temporal segmentation algorithms. In Remote Sensing of Environment (Vol. 114, Issue 12, pp. 2897-2910). https://doi.org/10.1016/j.rse.2010.07.008 Kennedy, R., Yang, Z., Gorelick, N., Braaten, J., Cavalcante, L., Cohen, W., and Healey, S. (2018). Implementation of the LandTrendr Algorithm on Google Earth Engine. In Remote Sensing (Vol. 10, Issue 5, p. 691). https://doi.org/10.3390/rs10050691Weiss, A.D. (2001). Topographic position and landforms analysis Poster Presentation, ESRI Users Conference, San Diego, CAZhu, Z., and Woodcock, C. E. (2012). Object-based cloud and cloud shadow detection in Landsat imagery. In Remote Sensing of Environment (Vol. 118, pp. 83-94). https://doi.org/10.1016/j.rse.2011.10.028Zhu, Z., and Woodcock, C. E. (2014). Continuous change detection and classification of land cover using all available Landsat data. In Remote Sensing of Environment (Vol. 144, pp. 152-171). https://doi.org/10.1016/j.rse.2014.01.011", "title": "Landscape Change Monitoring System (LCMS) Southeast Alaska Annual Landcover (Image Service)", "distribution": [ { "accessURL": "https://www.arcgis.com/sharing/rest/content/items/978c644c112445509831c4aa9a86f712/info/metadata/metadata.xml?format=iso19139", "@type": "dcat:Distribution", "mediaType": "text/xml", "conformsTo": "https://www.isotc211.org/2005/gmi", "title": "ISO-19139 metadata" }, { "accessURL": "https://data-usfs.hub.arcgis.com/datasets/usfs::landscape-change-monitoring-system-lcms-southeast-alaska-annual-landcover-image-service", "@type": "dcat:Distribution", "format": "Web Page", "mediaType": "text/html", "title": "ArcGIS Hub Dataset" }, { "accessURL": "https://apps.fs.usda.gov/fsgisx01/rest/services/RDW_LandscapeAndWildlife/LCMS_Southeast_Alaska_Annual_Landcover/ImageServer", "@type": "dcat:Distribution", "format": "ArcGIS GeoServices REST API", "mediaType": "application/json", "title": "ArcGIS GeoService" } ], "bureauCode": [ "005:96" ], "modified": "2024-05-24", "theme": [ "geospatial" ], "keyword": [ "GTAC", "BaseMaps", "EarthCover", "Imagery", "Digital Spatial Data", "Continuous", "Land Cover", "Land Use", "Land Cover Change", "Land Use Change", "Change Detection", "NGDA", "Remote Sensing", "National Geospatial Data Asset", "Land Use Land Cover Theme", "Environment", "GIS", "Open Data" ], "spatial": "-156.2875,53.6682,-126.6393,62.4663", "issued": "2024-05-03", "identifier": "https://www.arcgis.com/home/item.html?id=978c644c112445509831c4aa9a86f712", "accessLevel": "public", "programCode": [ "005:059" ], "landingPage": "https://data-usfs.hub.arcgis.com/datasets/usfs::landscape-change-monitoring-system-lcms-southeast-alaska-annual-landcover-image-service", "license": "https://creativecommons.org/licenses/by/4.0/", "publisher": { "name": "U.S. Forest Service" } }, { "contactPoint": { "hasEmail": "mailto:SM.FS.data@usda.gov", "@type": "vcard:Contact", "fn": "USFSEnterpriseContent" }, "description": "This product is part of the Landscape Change Monitoring System (LCMS) data suite. It shows LCMS modeled land use classes for each year. See additional information about land use in the Entity_and_Attribute_Information section below. LCMS is a remote sensing-based system for mapping and monitoring landscape change across the United States. Its objective is to develop a consistent approach using the latest technology and advancements in change detection to produce a \"best available\" map of landscape change. Because no algorithm performs best in all situations, LCMS uses an ensemble of models as predictors, which improves map accuracy across a range of ecosystems and change processes (Healey et al., 2018). The resulting suite of LCMS change, land cover, and land use maps offer a holistic depiction of landscape change across the United States over the past four decades.Predictor layers for the LCMS model include annual Landsat and Sentinel 2 composites, outputs from the LandTrendr and CCDC change detection algorithms, and terrain information. These components are all accessed and processed using Google Earth Engine (Gorelick et al., 2017). To produce annual composites, the cFmask (Zhu and Woodcock 2012), cloudScore, and TDOM (Chastain et al., 2019) cloud and cloud shadow masking methods are applied to Landsat Tier 1 and Sentinel 2a and 2b Level-1C top of atmosphere reflectance data. The annual medoid is then computed to summarize each year into a single composite. The composite time series is temporally segmented using LandTrendr (Kennedy et al., 2010; Kennedy et al., 2018; Cohen et al., 2018). All cloud and cloud shadow free values are also temporally segmented using the CCDC algorithm (Zhu and Woodcock, 2014). The raw composite values, LandTrendr fitted values, pair-wise differences, segment duration, change magnitude, and slope, and CCDC September 1 sine and cosine coefficients (first 3 harmonics), fitted values, and pairwise differences, along with elevation, slope, sine of aspect, cosine of aspect, and topographic position indices (Weiss, 2001) from the National Elevation Dataset (NED), are used as independent predictor variables in a Random Forest (Breiman, 2001) model. Reference data are collected using TimeSync, a web-based tool that helps analysts visualize and interpret the Landsat data record from 1984-present (Cohen et al., 2010).Outputs fall into three categories: change, land cover, and land use. Change relates specifically to vegetation cover and includes slow loss, fast loss (which also includes hydrologic changes such as inundation or desiccation), and gain. These values are predicted for each year of the Landsat time series and serve as the foundational products for LCMS.References:Breiman, L. (2001). Machine Learning (Vol. 45, Issue 3, pp. 261-277). https://doi.org/10.1023/a:1017934522171 Chastain, R., Housman, I., Goldstein, J., Finco, M., and Tenneson, K. (2019). Empirical cross sensor comparison of Sentinel-2A and 2B MSI, Landsat-8 OLI, and Landsat-7 ETM top of atmosphere spectral characteristics over the conterminous United States. In Remote Sensing of Environment (Vol. 221, pp. 274-285). https://doi.org/10.1016/j.rse.2018.11.012Cohen, W. B., Yang, Z., and Kennedy, R. (2010). Detecting trends in forest disturbance and recovery using yearly Landsat time series: 2. TimeSync - Tools for calibration and validation. In Remote Sensing of Environment (Vol. 114, Issue 12, pp. 2911-2924). https://doi.org/10.1016/j.rse.2010.07.010 Cohen, W. B., Yang, Z., Healey, S. P., Kennedy, R. E., and Gorelick, N. (2018). A LandTrendr multispectral ensemble for forest disturbance detection. In Remote Sensing of Environment (Vol. 205, pp. 131-140). https://doi.org/10.1016/j.rse.2017.11.015 Gorelick, N., Hancher, M., Dixon, M., Ilyushchenko, S., Thau, D., and Moore, R. (2017). Google Earth Engine: Planetary-scale geospatial analysis for everyone. In Remote Sensing of Environment (Vol. 202, pp. 18-27). https://doi.org/10.1016/j.rse.2017.06.031 Healey, S. P., Cohen, W. B., Yang, Z., Kenneth Brewer, C., Brooks, E. B., Gorelick, N., Hernandez, A. J., Huang, C., Joseph Hughes, M., Kennedy, R. E., Loveland, T. R., Moisen, G. G., Schroeder, T. A., Stehman, S. V., Vogelmann, J. E., Woodcock, C. E., Yang, L., and Zhu, Z. (2018). Mapping forest change using stacked generalization: An ensemble approach. In Remote Sensing of Environment (Vol. 204, pp. 717-728). https://doi.org/10.1016/j.rse.2017.09.029 Kennedy, R. E., Yang, Z., and Cohen, W. B. (2010). Detecting trends in forest disturbance and recovery using yearly Landsat time series: 1. LandTrendr - Temporal segmentation algorithms. In Remote Sensing of Environment (Vol. 114, Issue 12, pp. 2897-2910). https://doi.org/10.1016/j.rse.2010.07.008 Kennedy, R., Yang, Z., Gorelick, N., Braaten, J., Cavalcante, L., Cohen, W., and Healey, S. (2018). Implementation of the LandTrendr Algorithm on Google Earth Engine. In Remote Sensing (Vol. 10, Issue 5, p. 691). https://doi.org/10.3390/rs10050691Weiss, A.D. (2001). Topographic position and landforms analysis Poster Presentation, ESRI Users Conference, San Diego, CA Zhu, Z., and Woodcock, C. E. (2012). Object-based cloud and cloud shadow detection in Landsat imagery. In Remote Sensing of Environment (Vol. 118, pp. 83-94). https://doi.org/10.1016/j.rse.2011.10.028 Zhu, Z., and Woodcock, C. E. (2014). Continuous change detection and classification of land cover using all available Landsat data. In Remote Sensing of Environment (Vol. 144, pp. 152-171). https://doi.org/10.1016/j.rse.2014.01.011", "title": "Landscape Change Monitoring System (LCMS) Southeast Alaska Annual Landuse (Image Service)", "distribution": [ { "accessURL": "https://www.arcgis.com/sharing/rest/content/items/27d77275b2aa450e9c0d4dbc979bab88/info/metadata/metadata.xml?format=iso19139", "@type": "dcat:Distribution", "mediaType": "text/xml", "conformsTo": "https://www.isotc211.org/2005/gmi", "title": "ISO-19139 metadata" }, { "accessURL": "https://data-usfs.hub.arcgis.com/datasets/usfs::landscape-change-monitoring-system-lcms-southeast-alaska-annual-landuse-image-service", "@type": "dcat:Distribution", "format": "Web Page", "mediaType": "text/html", "title": "ArcGIS Hub Dataset" }, { "accessURL": "https://apps.fs.usda.gov/fsgisx01/rest/services/RDW_LandscapeAndWildlife/LCMS_Southeast_Alaska_Annual_Landuse/ImageServer", "@type": "dcat:Distribution", "format": "ArcGIS GeoServices REST API", "mediaType": "application/json", "title": "ArcGIS GeoService" } ], "bureauCode": [ "005:96" ], "modified": "2024-05-24", "theme": [ "geospatial" ], "keyword": [ "GTAC", "BaseMaps", "EarthCover", "Imagery", "Digital Spatial Data", "Continuous", "Land Cover", "Land Use", "Land Cover Change", "Land Use Change", "Change Detection", "NGDA", "Remote Sensing", "National Geospatial Data Asset", "Land Use Land Cover Theme", "Environment", "GIS", "Open Data" ], "spatial": "-180.0000,49.1387,180.0000,71.4155", "issued": "2024-05-03", "identifier": "https://www.arcgis.com/home/item.html?id=27d77275b2aa450e9c0d4dbc979bab88", "accessLevel": "public", "programCode": [ "005:059" ], "landingPage": "https://data-usfs.hub.arcgis.com/datasets/usfs::landscape-change-monitoring-system-lcms-southeast-alaska-annual-landuse-image-service", "license": "https://creativecommons.org/licenses/by/4.0/", "publisher": { "name": "U.S. Forest Service" } }, { "contactPoint": { "hasEmail": "mailto:SM.FS.data@usda.gov", "@type": "vcard:Contact", "fn": "USFSEnterpriseContent" }, "description": "This product is part of the Landscape Change Monitoring System (LCMS) data suite. It shows LCMS modeled land use classes for each year. See additional information about land use in the Entity_and_Attribute_Information section below. LCMS is a remote sensing-based system for mapping and monitoring landscape change across the United States. Its objective is to develop a consistent approach using the latest technology and advancements in change detection to produce a \"best available\" map of landscape change. Because no algorithm performs best in all situations, LCMS uses an ensemble of models as predictors, which improves map accuracy across a range of ecosystems and change processes (Healey et al., 2018). The resulting suite of LCMS change, land cover, and land use maps offer a holistic depiction of landscape change across the United States over the past four decades. Predictor layers for the LCMS model include annual Landsat and Sentinel 2 composites, outputs from the LandTrendr and CCDC change detection algorithms, and terrain information. These components are all accessed and processed using Google Earth Engine (Gorelick et al., 2017). To produce annual composites, the cFmask (Zhu and Woodcock 2012), cloudScore, and TDOM (Chastain et al., 2019) cloud and cloud shadow masking methods are applied to Landsat Tier 1 and Sentinel 2a and 2b Level-1C top of atmosphere reflectance data. The annual medoid is then computed to summarize each year into a single composite. The composite time series is temporally segmented using LandTrendr (Kennedy et al., 2010; Kennedy et al., 2018; Cohen et al., 2018). All cloud and cloud shadow free values are also temporally segmented using the CCDC algorithm (Zhu and Woodcock, 2014). The raw composite values, LandTrendr fitted values, pair-wise differences, segment duration, change magnitude, and slope, and CCDC September 1 sine and cosine coefficients (first 3 harmonics), fitted values, and pairwise differences, along with elevation, slope, sine of aspect, cosine of aspect, and topographic position indices (Weiss, 2001) from the National Elevation Dataset (NED), are used as independent predictor variables in a Random Forest (Breiman, 2001) model. Reference data are collected using TimeSync, a web-based tool that helps analysts visualize and interpret the Landsat data record from 1984-present (Cohen et al., 2010).Outputs fall into three categories: change, land cover, and land use. Change relates specifically to vegetation cover and includes slow loss, fast loss (which also includes hydrologic changes such as inundation or desiccation), and gain. These values are predicted for each year of the Landsat time series and serve as the foundational products for LCMS.References: Breiman, L. (2001). Machine Learning (Vol. 45, Issue 3, pp. 261-277). https://doi.org/10.1023/a:1017934522171 Chastain, R., Housman, I., Goldstein, J., Finco, M., and Tenneson, K. (2019). Empirical cross sensor comparison of Sentinel-2A and 2B MSI, Landsat-8 OLI, and Landsat-7 ETM top of atmosphere spectral characteristics over the conterminous United States. In Remote Sensing of Environment (Vol. 221, pp. 274-285). https://doi.org/10.1016/j.rse.2018.11.012 Cohen, W. B., Yang, Z., and Kennedy, R. (2010). Detecting trends in forest disturbance and recovery using yearly Landsat time series: 2. TimeSync - Tools for calibration and validation. In Remote Sensing of Environment (Vol. 114, Issue 12, pp. 2911-2924). https://doi.org/10.1016/j.rse.2010.07.010 Cohen, W. B., Yang, Z., Healey, S. P., Kennedy, R. E., and Gorelick, N. (2018). A LandTrendr multispectral ensemble for forest disturbance detection. In Remote Sensing of Environment (Vol. 205, pp. 131-140). https://doi.org/10.1016/j.rse.2017.11.015 Gorelick, N., Hancher, M., Dixon, M., Ilyushchenko, S., Thau, D., and Moore, R. (2017). Google Earth Engine: Planetary-scale geospatial analysis for everyone. In Remote Sensing of Environment (Vol. 202, pp. 18-27). https://doi.org/10.1016/j.rse.2017.06.031 Healey, S. P., Cohen, W. B., Yang, Z., Kenneth Brewer, C., Brooks, E. B., Gorelick, N., Hernandez, A. J., Huang, C., Joseph Hughes, M., Kennedy, R. E., Loveland, T. R., Moisen, G. G., Schroeder, T. A., Stehman, S. V., Vogelmann, J. E., Woodcock, C. E., Yang, L., and Zhu, Z. (2018). Mapping forest change using stacked generalization: An ensemble approach. In Remote Sensing of Environment (Vol. 204, pp. 717-728). https://doi.org/10.1016/j.rse.2017.09.029 Kennedy, R. E., Yang, Z., and Cohen, W. B. (2010). Detecting trends in forest disturbance and recovery using yearly Landsat time series: 1. LandTrendr - Temporal segmentation algorithms. In Remote Sensing of Environment (Vol. 114, Issue 12, pp. 2897-2910). https://doi.org/10.1016/j.rse.2010.07.008 Kennedy, R., Yang, Z., Gorelick, N., Braaten, J., Cavalcante, L., Cohen, W., and Healey, S. (2018). Implementation of the LandTrendr Algorithm on Google Earth Engine. In Remote Sensing (Vol. 10, Issue 5, p. 691). https://doi.org/10.3390/rs10050691 Weiss, A.D. (2001). Topographic position and landforms analysis Poster Presentation, ESRI Users Conference, San Diego, CA Zhu, Z., and Woodcock, C. E. (2012). Object-based cloud and cloud shadow detection in Landsat imagery. In Remote Sensing of Environment (Vol. 118, pp. 83-94). https://doi.org/10.1016/j.rse.2011.10.028 Zhu, Z., and Woodcock, C. E. (2014). Continuous change detection and classification of land cover using all available Landsat data. In Remote Sensing of Environment (Vol. 144, pp. 152-171). https://doi.org/10.1016/j.rse.2014.01.011", "title": "Landscape Change Monitoring System (LCMS) Southeast Alaska Most Recent Year Of Fast Loss (Image Service)", "distribution": [ { "accessURL": "https://www.arcgis.com/sharing/rest/content/items/1c1e335ada0e4554be346858b01f4f88/info/metadata/metadata.xml?format=iso19139", "@type": "dcat:Distribution", "mediaType": "text/xml", "conformsTo": "https://www.isotc211.org/2005/gmi", "title": "ISO-19139 metadata" }, { "accessURL": "https://data-usfs.hub.arcgis.com/datasets/usfs::landscape-change-monitoring-system-lcms-southeast-alaska-most-recent-year-of-fast-loss-image-service", "@type": "dcat:Distribution", "format": "Web Page", "mediaType": "text/html", "title": "ArcGIS Hub Dataset" }, { "accessURL": "https://apps.fs.usda.gov/fsgisx01/rest/services/RDW_LandscapeAndWildlife/LCMS_Southeast_Alaska_Most_Recent_Year_Of_Fast_Loss/ImageServer", "@type": "dcat:Distribution", "format": "ArcGIS GeoServices REST API", "mediaType": "application/json", "title": "ArcGIS GeoService" } ], "bureauCode": [ "005:96" ], "modified": "2024-05-10", "theme": [ "geospatial" ], "keyword": [ "GTAC", "BaseMaps", "EarthCover", "Imagery", "Digital Spatial Data", "Continuous", "Land Cover", "Land Use", "Land Cover Change", "Land Use Change", "Change Detection", "NGDA", "Remote Sensing", "National Geospatial Data Asset", "Land Use Land Cover Theme", "Environment", "GIS", "Open Data" ], "spatial": "-156.2875,53.6682,-126.6393,62.4663", "issued": "2024-05-03", "identifier": "https://www.arcgis.com/home/item.html?id=1c1e335ada0e4554be346858b01f4f88", "accessLevel": "public", "programCode": [ "005:059" ], "landingPage": "https://data-usfs.hub.arcgis.com/datasets/usfs::landscape-change-monitoring-system-lcms-southeast-alaska-most-recent-year-of-fast-loss-image-service", "license": "https://creativecommons.org/licenses/by/4.0/", "publisher": { "name": "U.S. Forest Service" } }, { "contactPoint": { "hasEmail": "mailto:SM.FS.data@usda.gov", "@type": "vcard:Contact", "fn": "USFSEnterpriseContent" }, "description": "This product is part of the Landscape Change Monitoring System (LCMS) data suite. It shows LCMS modeled land use classes for each year. See additional information about land use in the Entity_and_Attribute_Information section below. LCMS is a remote sensing-based system for mapping and monitoring landscape change across the United States. Its objective is to develop a consistent approach using the latest technology and advancements in change detection to produce a \"best available\" map of landscape change. Because no algorithm performs best in all situations, LCMS uses an ensemble of models as predictors, which improves map accuracy across a range of ecosystems and change processes (Healey et al., 2018). The resulting suite of LCMS change, land cover, and land use maps offer a holistic depiction of landscape change across the United States over the past four decades. Predictor layers for the LCMS model include annual Landsat and Sentinel 2 composites, outputs from the LandTrendr and CCDC change detection algorithms, and terrain information. These components are all accessed and processed using Google Earth Engine (Gorelick et al., 2017). To produce annual composites, the cFmask (Zhu and Woodcock 2012), cloudScore, and TDOM (Chastain et al., 2019) cloud and cloud shadow masking methods are applied to Landsat Tier 1 and Sentinel 2a and 2b Level-1C top of atmosphere reflectance data. The annual medoid is then computed to summarize each year into a single composite. The composite time series is temporally segmented using LandTrendr (Kennedy et al., 2010; Kennedy et al., 2018; Cohen et al., 2018). All cloud and cloud shadow free values are also temporally segmented using the CCDC algorithm (Zhu and Woodcock, 2014). The raw composite values, LandTrendr fitted values, pair-wise differences, segment duration, change magnitude, and slope, and CCDC September 1 sine and cosine coefficients (first 3 harmonics), fitted values, and pairwise differences, along with elevation, slope, sine of aspect, cosine of aspect, and topographic position indices (Weiss, 2001) from the National Elevation Dataset (NED), are used as independent predictor variables in a Random Forest (Breiman, 2001) model. Reference data are collected using TimeSync, a web-based tool that helps analysts visualize and interpret the Landsat data record from 1984-present (Cohen et al., 2010).Outputs fall into three categories: change, land cover, and land use. Change relates specifically to vegetation cover and includes slow loss, fast loss (which also includes hydrologic changes such as inundation or desiccation), and gain. These values are predicted for each year of the Landsat time series and serve as the foundational products for LCMS.References: Breiman, L. (2001). Machine Learning (Vol. 45, Issue 3, pp. 261-277). https://doi.org/10.1023/a:1017934522171 Chastain, R., Housman, I., Goldstein, J., Finco, M., and Tenneson, K. (2019). Empirical cross sensor comparison of Sentinel-2A and 2B MSI, Landsat-8 OLI, and Landsat-7 ETM top of atmosphere spectral characteristics over the conterminous United States. In Remote Sensing of Environment (Vol. 221, pp. 274-285). https://doi.org/10.1016/j.rse.2018.11.012 Cohen, W. B., Yang, Z., and Kennedy, R. (2010). Detecting trends in forest disturbance and recovery using yearly Landsat time series: 2. TimeSync - Tools for calibration and validation. In Remote Sensing of Environment (Vol. 114, Issue 12, pp. 2911-2924). https://doi.org/10.1016/j.rse.2010.07.010 Cohen, W. B., Yang, Z., Healey, S. P., Kennedy, R. E., and Gorelick, N. (2018). A LandTrendr multispectral ensemble for forest disturbance detection. In Remote Sensing of Environment (Vol. 205, pp. 131-140). https://doi.org/10.1016/j.rse.2017.11.015 Gorelick, N., Hancher, M., Dixon, M., Ilyushchenko, S., Thau, D., and Moore, R. (2017). Google Earth Engine: Planetary-scale geospatial analysis for everyone. In Remote Sensing of Environment (Vol. 202, pp. 18-27). https://doi.org/10.1016/j.rse.2017.06.031 Healey, S. P., Cohen, W. B., Yang, Z., Kenneth Brewer, C., Brooks, E. B., Gorelick, N., Hernandez, A. J., Huang, C., Joseph Hughes, M., Kennedy, R. E., Loveland, T. R., Moisen, G. G., Schroeder, T. A., Stehman, S. V., Vogelmann, J. E., Woodcock, C. E., Yang, L., and Zhu, Z. (2018). Mapping forest change using stacked generalization: An ensemble approach. In Remote Sensing of Environment (Vol. 204, pp. 717-728). https://doi.org/10.1016/j.rse.2017.09.029 Kennedy, R. E., Yang, Z., and Cohen, W. B. (2010). Detecting trends in forest disturbance and recovery using yearly Landsat time series: 1. LandTrendr - Temporal segmentation algorithms. In Remote Sensing of Environment (Vol. 114, Issue 12, pp. 2897-2910). https://doi.org/10.1016/j.rse.2010.07.008 Kennedy, R., Yang, Z., Gorelick, N., Braaten, J., Cavalcante, L., Cohen, W., and Healey, S. (2018). Implementation of the LandTrendr Algorithm on Google Earth Engine. In Remote Sensing (Vol. 10, Issue 5, p. 691). https://doi.org/10.3390/rs10050691 Weiss, A.D. (2001). Topographic position and landforms analysis Poster Presentation, ESRI Users Conference, San Diego, CA Zhu, Z., and Woodcock, C. E. (2012). Object-based cloud and cloud shadow detection in Landsat imagery. In Remote Sensing of Environment (Vol. 118, pp. 83-94). https://doi.org/10.1016/j.rse.2011.10.028 Zhu, Z., and Woodcock, C. E. (2014). Continuous change detection and classification of land cover using all available Landsat data. In Remote Sensing of Environment (Vol. 144, pp. 152-171). https://doi.org/10.1016/j.rse.2014.01.011", "title": "Landscape Change Monitoring System (LCMS) Southeast Alaska Most Recent Year Of Gain (Image Service)", "distribution": [ { "accessURL": "https://www.arcgis.com/sharing/rest/content/items/a51377791124489fb894170c8e2a0793/info/metadata/metadata.xml?format=iso19139", "@type": "dcat:Distribution", "mediaType": "text/xml", "conformsTo": "https://www.isotc211.org/2005/gmi", "title": "ISO-19139 metadata" }, { "accessURL": "https://data-usfs.hub.arcgis.com/datasets/usfs::landscape-change-monitoring-system-lcms-southeast-alaska-most-recent-year-of-gain-image-service", "@type": "dcat:Distribution", "format": "Web Page", "mediaType": "text/html", "title": "ArcGIS Hub Dataset" }, { "accessURL": "https://apps.fs.usda.gov/fsgisx01/rest/services/RDW_LandscapeAndWildlife/LCMS_Southeast_Alaska_Most_Recent_Year_Of_Gain/ImageServer", "@type": "dcat:Distribution", "format": "ArcGIS GeoServices REST API", "mediaType": "application/json", "title": "ArcGIS GeoService" } ], "bureauCode": [ "005:96" ], "modified": "2024-05-10", "theme": [ "geospatial" ], "keyword": [ "GTAC", "BaseMaps", "EarthCover", "Imagery", "Digital Spatial Data", "Continuous", "Land Cover", "Land Use", "Land Cover Change", "Land Use Change", "Change Detection", "NGDA", "Remote Sensing", "National Geospatial Data Asset", "Land Use Land Cover Theme", "Environment", "GIS", "Open Data" ], "spatial": "-156.2875,53.6682,-126.6393,62.4663", "issued": "2024-05-03", "identifier": "https://www.arcgis.com/home/item.html?id=a51377791124489fb894170c8e2a0793", "accessLevel": "public", "programCode": [ "005:059" ], "landingPage": "https://data-usfs.hub.arcgis.com/datasets/usfs::landscape-change-monitoring-system-lcms-southeast-alaska-most-recent-year-of-gain-image-service", "license": "https://creativecommons.org/licenses/by/4.0/", "publisher": { "name": "U.S. Forest Service" } }, { "contactPoint": { "hasEmail": "mailto:SM.FS.data@usda.gov", "@type": "vcard:Contact", "fn": "USFSEnterpriseContent" }, "description": "This product is part of the Landscape Change Monitoring System (LCMS) data suite. It shows LCMS modeled land use classes for each year. See additional information about land use in the Entity_and_Attribute_Information section below. LCMS is a remote sensing-based system for mapping and monitoring landscape change across the United States. Its objective is to develop a consistent approach using the latest technology and advancements in change detection to produce a \"best available\" map of landscape change. Because no algorithm performs best in all situations, LCMS uses an ensemble of models as predictors, which improves map accuracy across a range of ecosystems and change processes (Healey et al., 2018). The resulting suite of LCMS change, land cover, and land use maps offer a holistic depiction of landscape change across the United States over the past four decades. Predictor layers for the LCMS model include annual Landsat and Sentinel 2 composites, outputs from the LandTrendr and CCDC change detection algorithms, and terrain information. These components are all accessed and processed using Google Earth Engine (Gorelick et al., 2017). To produce annual composites, the cFmask (Zhu and Woodcock 2012), cloudScore, and TDOM (Chastain et al., 2019) cloud and cloud shadow masking methods are applied to Landsat Tier 1 and Sentinel 2a and 2b Level-1C top of atmosphere reflectance data. The annual medoid is then computed to summarize each year into a single composite. The composite time series is temporally segmented using LandTrendr (Kennedy et al., 2010; Kennedy et al., 2018; Cohen et al., 2018). All cloud and cloud shadow free values are also temporally segmented using the CCDC algorithm (Zhu and Woodcock, 2014). The raw composite values, LandTrendr fitted values, pair-wise differences, segment duration, change magnitude, and slope, and CCDC September 1 sine and cosine coefficients (first 3 harmonics), fitted values, and pairwise differences, along with elevation, slope, sine of aspect, cosine of aspect, and topographic position indices (Weiss, 2001) from the National Elevation Dataset (NED), are used as independent predictor variables in a Random Forest (Breiman, 2001) model. Reference data are collected using TimeSync, a web-based tool that helps analysts visualize and interpret the Landsat data record from 1984-present (Cohen et al., 2010).Outputs fall into three categories: change, land cover, and land use. Change relates specifically to vegetation cover and includes slow loss, fast loss (which also includes hydrologic changes such as inundation or desiccation), and gain. These values are predicted for each year of the Landsat time series and serve as the foundational products for LCMS.References: Breiman, L. (2001). Machine Learning (Vol. 45, Issue 3, pp. 261-277). https://doi.org/10.1023/a:1017934522171 Chastain, R., Housman, I., Goldstein, J., Finco, M., and Tenneson, K. (2019). Empirical cross sensor comparison of Sentinel-2A and 2B MSI, Landsat-8 OLI, and Landsat-7 ETM top of atmosphere spectral characteristics over the conterminous United States. In Remote Sensing of Environment (Vol. 221, pp. 274-285). https://doi.org/10.1016/j.rse.2018.11.012 Cohen, W. B., Yang, Z., and Kennedy, R. (2010). Detecting trends in forest disturbance and recovery using yearly Landsat time series: 2. TimeSync - Tools for calibration and validation. In Remote Sensing of Environment (Vol. 114, Issue 12, pp. 2911-2924). https://doi.org/10.1016/j.rse.2010.07.010 Cohen, W. B., Yang, Z., Healey, S. P., Kennedy, R. E., and Gorelick, N. (2018). A LandTrendr multispectral ensemble for forest disturbance detection. In Remote Sensing of Environment (Vol. 205, pp. 131-140). https://doi.org/10.1016/j.rse.2017.11.015 Gorelick, N., Hancher, M., Dixon, M., Ilyushchenko, S., Thau, D., and Moore, R. (2017). Google Earth Engine: Planetary-scale geospatial analysis for everyone. In Remote Sensing of Environment (Vol. 202, pp. 18-27). https://doi.org/10.1016/j.rse.2017.06.031 Healey, S. P., Cohen, W. B., Yang, Z., Kenneth Brewer, C., Brooks, E. B., Gorelick, N., Hernandez, A. J., Huang, C., Joseph Hughes, M., Kennedy, R. E., Loveland, T. R., Moisen, G. G., Schroeder, T. A., Stehman, S. V., Vogelmann, J. E., Woodcock, C. E., Yang, L., and Zhu, Z. (2018). Mapping forest change using stacked generalization: An ensemble approach. In Remote Sensing of Environment (Vol. 204, pp. 717-728). https://doi.org/10.1016/j.rse.2017.09.029 Kennedy, R. E., Yang, Z., and Cohen, W. B. (2010). Detecting trends in forest disturbance and recovery using yearly Landsat time series: 1. LandTrendr - Temporal segmentation algorithms. In Remote Sensing of Environment (Vol. 114, Issue 12, pp. 2897-2910). https://doi.org/10.1016/j.rse.2010.07.008 Kennedy, R., Yang, Z., Gorelick, N., Braaten, J., Cavalcante, L., Cohen, W., and Healey, S. (2018). Implementation of the LandTrendr Algorithm on Google Earth Engine. In Remote Sensing (Vol. 10, Issue 5, p. 691). https://doi.org/10.3390/rs10050691 Weiss, A.D. (2001). Topographic position and landforms analysis Poster Presentation, ESRI Users Conference, San Diego, CA Zhu, Z., and Woodcock, C. E. (2012). Object-based cloud and cloud shadow detection in Landsat imagery. In Remote Sensing of Environment (Vol. 118, pp. 83-94). https://doi.org/10.1016/j.rse.2011.10.028 Zhu, Z., and Woodcock, C. E. (2014). Continuous change detection and classification of land cover using all available Landsat data. In Remote Sensing of Environment (Vol. 144, pp. 152-171). https://doi.org/10.1016/j.rse.2014.01.011", "title": "Landscape Change Monitoring System (LCMS) Southeast Alaska Most Recent Year Of Slow Loss (Image Service)", "distribution": [ { "accessURL": "https://www.arcgis.com/sharing/rest/content/items/a7337c956dd441b385c194733a63e9e6/info/metadata/metadata.xml?format=iso19139", "@type": "dcat:Distribution", "mediaType": "text/xml", "conformsTo": "https://www.isotc211.org/2005/gmi", "title": "ISO-19139 metadata" }, { "accessURL": "https://data-usfs.hub.arcgis.com/datasets/usfs::landscape-change-monitoring-system-lcms-southeast-alaska-most-recent-year-of-slow-loss-image-service", "@type": "dcat:Distribution", "format": "Web Page", "mediaType": "text/html", "title": "ArcGIS Hub Dataset" }, { "accessURL": "https://apps.fs.usda.gov/fsgisx01/rest/services/RDW_LandscapeAndWildlife/LCMS_Southeast_Alaska_Most_Recent_Year_Of_Slow_Loss/ImageServer", "@type": "dcat:Distribution", "format": "ArcGIS GeoServices REST API", "mediaType": "application/json", "title": "ArcGIS GeoService" } ], "bureauCode": [ "005:96" ], "modified": "2024-05-10", "theme": [ "geospatial" ], "keyword": [ "GTAC", "BaseMaps", "EarthCover", "Imagery", "Digital Spatial Data", "Continuous", "Land Cover", "Land Use", "Land Cover Change", "Land Use Change", "Change Detection", "NGDA", "Remote Sensing", "National Geospatial Data Asset", "Land Use Land Cover Theme", "Environment", "GIS", "Open Data" ], "spatial": "-156.2875,53.6682,-126.6393,62.4663", "issued": "2024-05-03", "identifier": "https://www.arcgis.com/home/item.html?id=a7337c956dd441b385c194733a63e9e6", "accessLevel": "public", "programCode": [ "005:059" ], "landingPage": "https://data-usfs.hub.arcgis.com/datasets/usfs::landscape-change-monitoring-system-lcms-southeast-alaska-most-recent-year-of-slow-loss-image-service", "license": "https://creativecommons.org/licenses/by/4.0/", "publisher": { "name": "U.S. Forest Service" } }, { "contactPoint": { "hasEmail": "mailto:SM.FS.data@usda.gov", "@type": "vcard:Contact", "fn": "USFSEnterpriseContent" }, "description": "This product is part of the Landscape Change Monitoring System (LCMS) data suite. It shows LCMS modeled land use classes for each year. See additional information about land use in the Entity_and_Attribute_Information section below. LCMS is a remote sensing-based system for mapping and monitoring landscape change across the United States. Its objective is to develop a consistent approach using the latest technology and advancements in change detection to produce a \"best available\" map of landscape change. Because no algorithm performs best in all situations, LCMS uses an ensemble of models as predictors, which improves map accuracy across a range of ecosystems and change processes (Healey et al., 2018). The resulting suite of LCMS change, land cover, and land use maps offer a holistic depiction of landscape change across the United States over the past four decades. Predictor layers for the LCMS model include annual Landsat and Sentinel 2 composites, outputs from the LandTrendr and CCDC change detection algorithms, and terrain information. These components are all accessed and processed using Google Earth Engine (Gorelick et al., 2017). To produce annual composites, the cFmask (Zhu and Woodcock 2012), cloudScore, and TDOM (Chastain et al., 2019) cloud and cloud shadow masking methods are applied to Landsat Tier 1 and Sentinel 2a and 2b Level-1C top of atmosphere reflectance data. The annual medoid is then computed to summarize each year into a single composite. The composite time series is temporally segmented using LandTrendr (Kennedy et al., 2010; Kennedy et al., 2018; Cohen et al., 2018). All cloud and cloud shadow free values are also temporally segmented using the CCDC algorithm (Zhu and Woodcock, 2014). The raw composite values, LandTrendr fitted values, pair-wise differences, segment duration, change magnitude, and slope, and CCDC September 1 sine and cosine coefficients (first 3 harmonics), fitted values, and pairwise differences, along with elevation, slope, sine of aspect, cosine of aspect, and topographic position indices (Weiss, 2001) from the National Elevation Dataset (NED), are used as independent predictor variables in a Random Forest (Breiman, 2001) model. Reference data are collected using TimeSync, a web-based tool that helps analysts visualize and interpret the Landsat data record from 1984-present (Cohen et al., 2010).Outputs fall into three categories: change, land cover, and land use. Change relates specifically to vegetation cover and includes slow loss, fast loss (which also includes hydrologic changes such as inundation or desiccation), and gain. These values are predicted for each year of the Landsat time series and serve as the foundational products for LCMS.References: Breiman, L. (2001). Machine Learning (Vol. 45, Issue 3, pp. 261-277). https://doi.org/10.1023/a:1017934522171 Chastain, R., Housman, I., Goldstein, J., Finco, M., and Tenneson, K. (2019). Empirical cross sensor comparison of Sentinel-2A and 2B MSI, Landsat-8 OLI, and Landsat-7 ETM top of atmosphere spectral characteristics over the conterminous United States. In Remote Sensing of Environment (Vol. 221, pp. 274-285). https://doi.org/10.1016/j.rse.2018.11.012 Cohen, W. B., Yang, Z., and Kennedy, R. (2010). Detecting trends in forest disturbance and recovery using yearly Landsat time series: 2. TimeSync - Tools for calibration and validation. In Remote Sensing of Environment (Vol. 114, Issue 12, pp. 2911-2924). https://doi.org/10.1016/j.rse.2010.07.010 Cohen, W. B., Yang, Z., Healey, S. P., Kennedy, R. E., and Gorelick, N. (2018). A LandTrendr multispectral ensemble for forest disturbance detection. In Remote Sensing of Environment (Vol. 205, pp. 131-140). https://doi.org/10.1016/j.rse.2017.11.015 Gorelick, N., Hancher, M., Dixon, M., Ilyushchenko, S., Thau, D., and Moore, R. (2017). Google Earth Engine: Planetary-scale geospatial analysis for everyone. In Remote Sensing of Environment (Vol. 202, pp. 18-27). https://doi.org/10.1016/j.rse.2017.06.031 Healey, S. P., Cohen, W. B., Yang, Z., Kenneth Brewer, C., Brooks, E. B., Gorelick, N., Hernandez, A. J., Huang, C., Joseph Hughes, M., Kennedy, R. E., Loveland, T. R., Moisen, G. G., Schroeder, T. A., Stehman, S. V., Vogelmann, J. E., Woodcock, C. E., Yang, L., and Zhu, Z. (2018). Mapping forest change using stacked generalization: An ensemble approach. In Remote Sensing of Environment (Vol. 204, pp. 717-728). https://doi.org/10.1016/j.rse.2017.09.029 Kennedy, R. E., Yang, Z., and Cohen, W. B. (2010). Detecting trends in forest disturbance and recovery using yearly Landsat time series: 1. LandTrendr - Temporal segmentation algorithms. In Remote Sensing of Environment (Vol. 114, Issue 12, pp. 2897-2910). https://doi.org/10.1016/j.rse.2010.07.008 Kennedy, R., Yang, Z., Gorelick, N., Braaten, J., Cavalcante, L., Cohen, W., and Healey, S. (2018). Implementation of the LandTrendr Algorithm on Google Earth Engine. In Remote Sensing (Vol. 10, Issue 5, p. 691). https://doi.org/10.3390/rs10050691 Weiss, A.D. (2001). Topographic position and landforms analysis Poster Presentation, ESRI Users Conference, San Diego, CA Zhu, Z., and Woodcock, C. E. (2012). Object-based cloud and cloud shadow detection in Landsat imagery. In Remote Sensing of Environment (Vol. 118, pp. 83-94). https://doi.org/10.1016/j.rse.2011.10.028 Zhu, Z., and Woodcock, C. E. (2014). Continuous change detection and classification of land cover using all available Landsat data. In Remote Sensing of Environment (Vol. 144, pp. 152-171). https://doi.org/10.1016/j.rse.2014.01.011", "title": "Landscape Change Monitoring System (LCMS) Southeast Alaska Year Of Highest Prob Fast Loss (Image Service)", "distribution": [ { "accessURL": "https://www.arcgis.com/sharing/rest/content/items/475ea43a47104c148946a46094ec86aa/info/metadata/metadata.xml?format=iso19139", "@type": "dcat:Distribution", "mediaType": "text/xml", "conformsTo": "https://www.isotc211.org/2005/gmi", "title": "ISO-19139 metadata" }, { "accessURL": "https://data-usfs.hub.arcgis.com/datasets/usfs::landscape-change-monitoring-system-lcms-southeast-alaska-year-of-highest-prob-fast-loss-image-service", "@type": "dcat:Distribution", "format": "Web Page", "mediaType": "text/html", "title": "ArcGIS Hub Dataset" }, { "accessURL": "https://apps.fs.usda.gov/fsgisx01/rest/services/RDW_LandscapeAndWildlife/LCMS_Southeast_Alaska_Year_Of_Highest_Prob_Fast_Loss/ImageServer", "@type": "dcat:Distribution", "format": "ArcGIS GeoServices REST API", "mediaType": "application/json", "title": "ArcGIS GeoService" } ], "bureauCode": [ "005:96" ], "modified": "2024-05-10", "theme": [ "geospatial" ], "keyword": [ "GTAC", "BaseMaps", "EarthCover", "Imagery", "Digital Spatial Data", "Continuous", "Land Cover", "Land Use", "Land Cover Change", "Land Use Change", "Change Detection", "NGDA", "Remote Sensing", "National Geospatial Data Asset", "Land Use Land Cover Theme", "Environment", "GIS", "Open Data" ], "spatial": "-156.2875,53.6682,-126.6393,62.4663", "issued": "2024-05-03", "identifier": "https://www.arcgis.com/home/item.html?id=475ea43a47104c148946a46094ec86aa", "accessLevel": "public", "programCode": [ "005:059" ], "landingPage": "https://data-usfs.hub.arcgis.com/datasets/usfs::landscape-change-monitoring-system-lcms-southeast-alaska-year-of-highest-prob-fast-loss-image-service", "license": "https://creativecommons.org/licenses/by/4.0/", "publisher": { "name": "U.S. Forest Service" } }, { "contactPoint": { "hasEmail": "mailto:SM.FS.data@usda.gov", "@type": "vcard:Contact", "fn": "USFSEnterpriseContent" }, "description": "This product is part of the Landscape Change Monitoring System (LCMS) data suite. It shows LCMS modeled land use classes for each year. See additional information about land use in the Entity_and_Attribute_Information section below. LCMS is a remote sensing-based system for mapping and monitoring landscape change across the United States. Its objective is to develop a consistent approach using the latest technology and advancements in change detection to produce a \"best available\" map of landscape change. Because no algorithm performs best in all situations, LCMS uses an ensemble of models as predictors, which improves map accuracy across a range of ecosystems and change processes (Healey et al., 2018). The resulting suite of LCMS change, land cover, and land use maps offer a holistic depiction of landscape change across the United States over the past four decades. Predictor layers for the LCMS model include annual Landsat and Sentinel 2 composites, outputs from the LandTrendr and CCDC change detection algorithms, and terrain information. These components are all accessed and processed using Google Earth Engine (Gorelick et al., 2017). To produce annual composites, the cFmask (Zhu and Woodcock 2012), cloudScore, and TDOM (Chastain et al., 2019) cloud and cloud shadow masking methods are applied to Landsat Tier 1 and Sentinel 2a and 2b Level-1C top of atmosphere reflectance data. The annual medoid is then computed to summarize each year into a single composite. The composite time series is temporally segmented using LandTrendr (Kennedy et al., 2010; Kennedy et al., 2018; Cohen et al., 2018). All cloud and cloud shadow free values are also temporally segmented using the CCDC algorithm (Zhu and Woodcock, 2014). The raw composite values, LandTrendr fitted values, pair-wise differences, segment duration, change magnitude, and slope, and CCDC September 1 sine and cosine coefficients (first 3 harmonics), fitted values, and pairwise differences, along with elevation, slope, sine of aspect, cosine of aspect, and topographic position indices (Weiss, 2001) from the National Elevation Dataset (NED), are used as independent predictor variables in a Random Forest (Breiman, 2001) model. Reference data are collected using TimeSync, a web-based tool that helps analysts visualize and interpret the Landsat data record from 1984-present (Cohen et al., 2010). Outputs fall into three categories: change, land cover, and land use. Change relates specifically to vegetation cover and includes slow loss, fast loss (which also includes hydrologic changes such as inundation or desiccation), and gain. These values are predicted for each year of the Landsat time series and serve as the foundational products for LCMS.References: Breiman, L. (2001). Machine Learning (Vol. 45, Issue 3, pp. 261-277). https://doi.org/10.1023/a:1017934522171 Chastain, R., Housman, I., Goldstein, J., Finco, M., and Tenneson, K. (2019). Empirical cross sensor comparison of Sentinel-2A and 2B MSI, Landsat-8 OLI, and Landsat-7 ETM top of atmosphere spectral characteristics over the conterminous United States. In Remote Sensing of Environment (Vol. 221, pp. 274-285). https://doi.org/10.1016/j.rse.2018.11.012 Cohen, W. B., Yang, Z., and Kennedy, R. (2010). Detecting trends in forest disturbance and recovery using yearly Landsat time series: 2. TimeSync - Tools for calibration and validation. In Remote Sensing of Environment (Vol. 114, Issue 12, pp. 2911-2924). https://doi.org/10.1016/j.rse.2010.07.010 Cohen, W. B., Yang, Z., Healey, S. P., Kennedy, R. E., and Gorelick, N. (2018). A LandTrendr multispectral ensemble for forest disturbance detection. In Remote Sensing of Environment (Vol. 205, pp. 131-140). https://doi.org/10.1016/j.rse.2017.11.015 Gorelick, N., Hancher, M., Dixon, M., Ilyushchenko, S., Thau, D., and Moore, R. (2017). Google Earth Engine: Planetary-scale geospatial analysis for everyone. In Remote Sensing of Environment (Vol. 202, pp. 18-27). https://doi.org/10.1016/j.rse.2017.06.031 Healey, S. P., Cohen, W. B., Yang, Z., Kenneth Brewer, C., Brooks, E. B., Gorelick, N., Hernandez, A. J., Huang, C., Joseph Hughes, M., Kennedy, R. E., Loveland, T. R., Moisen, G. G., Schroeder, T. A., Stehman, S. V., Vogelmann, J. E., Woodcock, C. E., Yang, L., and Zhu, Z. (2018). Mapping forest change using stacked generalization: An ensemble approach. In Remote Sensing of Environment (Vol. 204, pp. 717-728). https://doi.org/10.1016/j.rse.2017.09.029 Kennedy, R. E., Yang, Z., and Cohen, W. B. (2010). Detecting trends in forest disturbance and recovery using yearly Landsat time series: 1. LandTrendr - Temporal segmentation algorithms. In Remote Sensing of Environment (Vol. 114, Issue 12, pp. 2897-2910). https://doi.org/10.1016/j.rse.2010.07.008 Kennedy, R., Yang, Z., Gorelick, N., Braaten, J., Cavalcante, L., Cohen, W., and Healey, S. (2018). Implementation of the LandTrendr Algorithm on Google Earth Engine. In Remote Sensing (Vol. 10, Issue 5, p. 691). https://doi.org/10.3390/rs10050691 Weiss, A.D. (2001). Topographic position and landforms analysis Poster Presentation, ESRI Users Conference, San Diego, CA Zhu, Z., and Woodcock, C. E. (2012). Object-based cloud and cloud shadow detection in Landsat imagery. In Remote Sensing of Environment (Vol. 118, pp. 83-94). https://doi.org/10.1016/j.rse.2011.10.028 Zhu, Z., and Woodcock, C. E. (2014). Continuous change detection and classification of land cover using all available Landsat data. In Remote Sensing of Environment (Vol. 144, pp. 152-171). https://doi.org/10.1016/j.rse.2014.01.011", "title": "Landscape Change Monitoring System (LCMS) Southeast Alaska Year Of Highest Prob Gain (Image Service)", "distribution": [ { "accessURL": "https://www.arcgis.com/sharing/rest/content/items/467b9928c5474864ab40fb8844bc190d/info/metadata/metadata.xml?format=iso19139", "@type": "dcat:Distribution", "mediaType": "text/xml", "conformsTo": "https://www.isotc211.org/2005/gmi", "title": "ISO-19139 metadata" }, { "accessURL": "https://data-usfs.hub.arcgis.com/datasets/usfs::landscape-change-monitoring-system-lcms-southeast-alaska-year-of-highest-prob-gain-image-service", "@type": "dcat:Distribution", "format": "Web Page", "mediaType": "text/html", "title": "ArcGIS Hub Dataset" }, { "accessURL": "https://apps.fs.usda.gov/fsgisx01/rest/services/RDW_LandscapeAndWildlife/LCMS_Southeast_Alaska_Year_Of_Highest_Prob_Gain/ImageServer", "@type": "dcat:Distribution", "format": "ArcGIS GeoServices REST API", "mediaType": "application/json", "title": "ArcGIS GeoService" } ], "bureauCode": [ "005:96" ], "modified": "2024-05-10", "theme": [ "geospatial" ], "keyword": [ "GTAC", "BaseMaps", "EarthCover", "Imagery", "Digital Spatial Data", "Continuous", "Land Cover", "Land Use", "Land Cover Change", "Land Use Change", "Change Detection", "NGDA", "Remote Sensing", "National Geospatial Data Asset", "Land Use Land Cover Theme", "Environment", "GIS", "Open Data" ], "spatial": "-156.2875,53.6682,-126.6393,62.4663", "issued": "2024-05-03", "identifier": "https://www.arcgis.com/home/item.html?id=467b9928c5474864ab40fb8844bc190d", "accessLevel": "public", "programCode": [ "005:059" ], "landingPage": "https://data-usfs.hub.arcgis.com/datasets/usfs::landscape-change-monitoring-system-lcms-southeast-alaska-year-of-highest-prob-gain-image-service", "license": "https://creativecommons.org/licenses/by/4.0/", "publisher": { "name": "U.S. Forest Service" } }, { "contactPoint": { "hasEmail": "mailto:SM.FS.data@usda.gov", "@type": "vcard:Contact", "fn": "USFSEnterpriseContent" }, "description": "This product is part of the Landscape Change Monitoring System (LCMS) data suite. It shows LCMS modeled land use classes for each year. See additional information about land use in the Entity_and_Attribute_Information section below. LCMS is a remote sensing-based system for mapping and monitoring landscape change across the United States. Its objective is to develop a consistent approach using the latest technology and advancements in change detection to produce a \"best available\" map of landscape change. Because no algorithm performs best in all situations, LCMS uses an ensemble of models as predictors, which improves map accuracy across a range of ecosystems and change processes (Healey et al., 2018). The resulting suite of LCMS change, land cover, and land use maps offer a holistic depiction of landscape change across the United States over the past four decades. Predictor layers for the LCMS model include annual Landsat and Sentinel 2 composites, outputs from the LandTrendr and CCDC change detection algorithms, and terrain information. These components are all accessed and processed using Google Earth Engine (Gorelick et al., 2017). To produce annual composites, the cFmask (Zhu and Woodcock 2012), cloudScore, and TDOM (Chastain et al., 2019) cloud and cloud shadow masking methods are applied to Landsat Tier 1 and Sentinel 2a and 2b Level-1C top of atmosphere reflectance data. The annual medoid is then computed to summarize each year into a single composite. The composite time series is temporally segmented using LandTrendr (Kennedy et al., 2010; Kennedy et al., 2018; Cohen et al., 2018). All cloud and cloud shadow free values are also temporally segmented using the CCDC algorithm (Zhu and Woodcock, 2014). The raw composite values, LandTrendr fitted values, pair-wise differences, segment duration, change magnitude, and slope, and CCDC September 1 sine and cosine coefficients (first 3 harmonics), fitted values, and pairwise differences, along with elevation, slope, sine of aspect, cosine of aspect, and topographic position indices (Weiss, 2001) from the National Elevation Dataset (NED), are used as independent predictor variables in a Random Forest (Breiman, 2001) model. Reference data are collected using TimeSync, a web-based tool that helps analysts visualize and interpret the Landsat data record from 1984-present (Cohen et al., 2010).Outputs fall into three categories: change, land cover, and land use. Change relates specifically to vegetation cover and includes slow loss, fast loss (which also includes hydrologic changes such as inundation or desiccation), and gain. These values are predicted for each year of the Landsat time series and serve as the foundational products for LCMS.References: Breiman, L. (2001). Machine Learning (Vol. 45, Issue 3, pp. 261-277). https://doi.org/10.1023/a:1017934522171 Chastain, R., Housman, I., Goldstein, J., Finco, M., and Tenneson, K. (2019). Empirical cross sensor comparison of Sentinel-2A and 2B MSI, Landsat-8 OLI, and Landsat-7 ETM top of atmosphere spectral characteristics over the conterminous United States. In Remote Sensing of Environment (Vol. 221, pp. 274-285). https://doi.org/10.1016/j.rse.2018.11.012 Cohen, W. B., Yang, Z., and Kennedy, R. (2010). Detecting trends in forest disturbance and recovery using yearly Landsat time series: 2. TimeSync - Tools for calibration and validation. In Remote Sensing of Environment (Vol. 114, Issue 12, pp. 2911-2924). https://doi.org/10.1016/j.rse.2010.07.010 Cohen, W. B., Yang, Z., Healey, S. P., Kennedy, R. E., and Gorelick, N. (2018). A LandTrendr multispectral ensemble for forest disturbance detection. In Remote Sensing of Environment (Vol. 205, pp. 131-140). https://doi.org/10.1016/j.rse.2017.11.015 Gorelick, N., Hancher, M., Dixon, M., Ilyushchenko, S., Thau, D., and Moore, R. (2017). Google Earth Engine: Planetary-scale geospatial analysis for everyone. In Remote Sensing of Environment (Vol. 202, pp. 18-27). https://doi.org/10.1016/j.rse.2017.06.031 Healey, S. P., Cohen, W. B., Yang, Z., Kenneth Brewer, C., Brooks, E. B., Gorelick, N., Hernandez, A. J., Huang, C., Joseph Hughes, M., Kennedy, R. E., Loveland, T. R., Moisen, G. G., Schroeder, T. A., Stehman, S. V., Vogelmann, J. E., Woodcock, C. E., Yang, L., and Zhu, Z. (2018). Mapping forest change using stacked generalization: An ensemble approach. In Remote Sensing of Environment (Vol. 204, pp. 717-728). https://doi.org/10.1016/j.rse.2017.09.029 Kennedy, R. E., Yang, Z., and Cohen, W. B. (2010). Detecting trends in forest disturbance and recovery using yearly Landsat time series: 1. LandTrendr - Temporal segmentation algorithms. In Remote Sensing of Environment (Vol. 114, Issue 12, pp. 2897-2910). https://doi.org/10.1016/j.rse.2010.07.008 Kennedy, R., Yang, Z., Gorelick, N., Braaten, J., Cavalcante, L., Cohen, W., and Healey, S. (2018). Implementation of the LandTrendr Algorithm on Google Earth Engine. In Remote Sensing (Vol. 10, Issue 5, p. 691). https://doi.org/10.3390/rs10050691 Weiss, A.D. (2001). Topographic position and landforms analysis Poster Presentation, ESRI Users Conference, San Diego, CA Zhu, Z., and Woodcock, C. E. (2012). Object-based cloud and cloud shadow detection in Landsat imagery. In Remote Sensing of Environment (Vol. 118, pp. 83-94). https://doi.org/10.1016/j.rse.2011.10.028 Zhu, Z., and Woodcock, C. E. (2014). Continuous change detection and classification of land cover using all available Landsat data. In Remote Sensing of Environment (Vol. 144, pp. 152-171). https://doi.org/10.1016/j.rse.2014.01.011", "title": "Landscape Change Monitoring System (LCMS) Southeast Alaska Year Of Highest Prob Slow Loss (Image Service)", "distribution": [ { "accessURL": "https://www.arcgis.com/sharing/rest/content/items/c523a314f6a8426b9bf558e9a7f9c2bb/info/metadata/metadata.xml?format=iso19139", "@type": "dcat:Distribution", "mediaType": "text/xml", "conformsTo": "https://www.isotc211.org/2005/gmi", "title": "ISO-19139 metadata" }, { "accessURL": "https://data-usfs.hub.arcgis.com/datasets/usfs::landscape-change-monitoring-system-lcms-southeast-alaska-year-of-highest-prob-slow-loss-image-service", "@type": "dcat:Distribution", "format": "Web Page", "mediaType": "text/html", "title": "ArcGIS Hub Dataset" }, { "accessURL": "https://apps.fs.usda.gov/fsgisx01/rest/services/RDW_LandscapeAndWildlife/LCMS_Southeast_Alaska_Year_Of_Highest_Prob_Slow_Loss/ImageServer", "@type": "dcat:Distribution", "format": "ArcGIS GeoServices REST API", "mediaType": "application/json", "title": "ArcGIS GeoService" } ], "bureauCode": [ "005:96" ], "modified": "2024-05-10", "theme": [ "geospatial" ], "keyword": [ "GTAC", "BaseMaps", "EarthCover", "Imagery", "Digital Spatial Data", "Continuous", "Land Cover", "Land Use", "Land Cover Change", "Land Use Change", "Change Detection", "NGDA", "Remote Sensing", "National Geospatial Data Asset", "Land Use Land Cover Theme", "Environment", "GIS", "Open Data" ], "spatial": "-156.2875,53.6682,-126.6393,62.4663", "issued": "2024-05-03", "identifier": "https://www.arcgis.com/home/item.html?id=c523a314f6a8426b9bf558e9a7f9c2bb", "accessLevel": "public", "programCode": [ "005:059" ], "landingPage": "https://data-usfs.hub.arcgis.com/datasets/usfs::landscape-change-monitoring-system-lcms-southeast-alaska-year-of-highest-prob-slow-loss-image-service", "license": "https://creativecommons.org/licenses/by/4.0/", "publisher": { "name": "U.S. Forest Service" } }, { "contactPoint": { "hasEmail": "mailto:SM.FS.data@usda.gov", "@type": "vcard:Contact", "fn": "USFSEnterpriseContent" }, "description": "This product is part of the Landscape Change Monitoring System (LCMS) data suite. It shows LCMS modeled change classes for each year. See additional information about change in the Entity_and_Attribute_Information section below. LCMS is a remote sensing-based system for mapping and monitoring landscape change across the United States. Its objective is to develop a consistent approach using the latest technology and advancements in change detection to produce a 'best available' map of landscape change. Because no algorithm performs best in all situations, LCMS uses an ensemble of models as predictors, which improves map accuracy across a range of ecosystems and change processes (Healey et al., 2018). The resulting suite of LCMS change, land cover, and land use maps offer a holistic depiction of landscape change across the United States over the past four decades. Predictor layers for the LCMS model include annual Landsat and Sentinel 2 composites, outputs from the LandTrendr and CCDC change detection algorithms, and terrain information.NIDRM data can be used to:
For a quick overview of the 2013 - 2027 assessment and to learn more information on the differences between the 2006 and 2012 NIDRMs download the executive summary (2 MB PDF).
Explore forests vulnerable to attack from major insects and diseases by viewing the Interactive Story Map of the National Insect and Disease Risk Map
This data publication contains a spatial database of wildfires that occurred in the United States from 1992 to 2020. It is the fifth update of a publication originally generated to support the national Fire Program Analysis (FPA) system. The wildfire records were acquired from the reporting systems of federal, state, and local fire organizations. The following core data elements were required for records to be included in this data publication: discovery date, final fire size, and a point location at least as precise as a Public Land Survey System (PLSS) section (1-square mile grid). The data were transformed to conform, when possible, to the data standards of the National Wildfire Coordinating Group (NWCG), including an updated wildfire-cause standard (approved August 2020). Basic error-checking was performed and redundant records were identified and removed, to the degree possible. The resulting product, referred to as the Fire Program Analysis fire-occurrence database (FPA FOD), includes 2.3 million geo-referenced wildfire records, representing a total of 180 million acres burned during the 29-year period. Identifiers necessary to link the point-based, final-fire-reporting information to published large-fire-perimeter and operational-situation-reporting datasets are included.
The USDA Forest Service (USFS) builds two versions of percent tree canopy cover data, in order to serve needs of multiple user communities. These datasets encompass conterminous United States (CONUS), Coastal Alaska, Hawaii, and Puerto Rico and U.S. Virgin Islands (PRUSVI). The two versions of data within the v2021-4 TCC product suite include: The initial model outputs referred to as the Science data; And a modified version built for the National Land Cover Database and referred to as NLCD data. The NLCD product suite includes data for years 2011 through 2021. The NCLD data are processed to remove small interannual changes from the annual TCC timeseries, and to mask TCC pixels that are known to be 0 percent TCC, non-tree agriculture, and water. A small interannual change is defined as a TCC change less than an increase or decrease of 10 percent compared to a TCC baseline value. The initial TCC baseline value is the median of 2008-2010 TCC data. For each year following 2011, on a pixel-wise basis TCC values are updated to a new baseline value if an increase or decrease of 10 percent TCC occurs relative to the 2008-2010 TCC baseline value. If no increase or decrease greater than 10 percent TCC occurs relative to the 2008-2010 baseline, then the 2008-2010 TCC baseline value is caried through to the next year in the timeseries. Pixel values range from 0 to 100 percent. The non-processing area is represented by value 254, and the background is represented by the value 255. The Science and NLCD tree canopy cover data are accessible for multiple user communities, through multiple channels and platforms. For information on the Science data and processing steps see the Science metadata. Information on the NLCD data and processing steps are included here. Data Download and Methods Documents: - https://data.fs.usda.gov/geodata/rastergateway/treecanopycover/
Updated February 2024. Snags continue to pose an ever-present hazard to responders, and recent increases in fire activity have resulted in an accumulation of these hazards across forested landscapes of the American West. National Snag Hazard is intended to provide a landscape-level view of existing snag hazard to firefighters and other field going employees. National Snag hazard is based on estimated density and median height of snags greater than or equal to 7.9 inches in diameter at breast height. Snag density and median snag height are classified into hazard levels using the breakpoints from Dunn et al. 2019, which are based on the logic that hazard increases with snag density and height. Dunn CJ, O’Connor CD, Reilly MJ, Calkin DE, Thompson MP (2019) Spatial and temporal assessment of responder exposure to snag hazards in post-fire environments. Forest Ecology and Management 441, 202-2014. DOI:10.1016/j.foreco.2019.03.035 This is a strategic landscape level decision support tool intended to help firefighters consider the magnitude and spatial distribution of snag hazard in their incident response strategy planning. Valid uses include identifying areas of higher snag hazard locations on landscape that may require extra mitigation for safe operation or could be avoided to reduce risk to responders. The snag hazard map is not meant to identify individual dead trees or for tactical planning. A rating of low snag hazard does not mean that no overhead hazards are present and should not be interpreted as judgement that an area is safe to occupy. Conditions should always be verified in the field. High levels of awareness for overhead hazards are always recommended regardless of the snag hazard rating.
This layer includes both Proclaimed Forest and National Grassland boundary areas. A Proclaimed Forest boundary is the boundary encompassing National Forest System land within a national forest that is set aside and reserved from the public domain by executive order or proclamation; congressional action is required to terminate a proclaimed boundary; if, at some point in time, no National Forest System land remains within the proclaimed boundary, then there is no legal significance to the proclaimed boundary, however, its legal status remains. National Grasslands are lands designated \"National Grasslands\" by the Secretary of Agriculture and permanently held by the Department of Agriculture for administration under Title III of the Bankhead-Jones Farm Tenant Act.
Download via FSGeodata Clearinghouse
The National Forest Climate Change Maps project was developed by the Rocky Mountain Research Station (RMRS) and the Office of Sustainability and Climate to meet the needs of national forest managers for information on projected climate changes at a scale relevant to decision making processes, including forest plans. The maps use state-of-the-art science and are available for every national forest in the contiguous United States with relevant data coverage. Currently, the map sets include variables related to precipitation, air temperature, snow (including snow residence time and April 1 snow water equivalent), and stream flow.
Snow residence time (in days) and April 1 snow water equivalent (in mm) were modeled using the spatial analog models of Luce et al., 2014 (https://agupubs.onlinelibrary.wiley.com/doi/full/10.1002/2013WR014844); see also Lute and Luce, 2017 (https://agupubs.onlinelibrary.wiley.com/doi/full/10.1002/2017WR020752). These models are built on precipitation and snow data from Snowpack Telemetry (SNOTEL) stations across the western United States and temperature data from the TopoWx dataset (https://rmets.onlinelibrary.wiley.com/doi/10.1002/joc.4127). They were calculated for the historical (1975-2005) and future (2071-2090) time periods, along with absolute and percent change.
Raster data are also available for download from RMRS site (https://www.fs.usda.gov/rm/boise/AWAE/projects/NFS-regional-climate-change-maps/categories/us-raster-layers.html), along with pdf maps and detailed metadata (https://www.fs.usda.gov/rm/boise/AWAE/projects/NFS-regional-climate-change-maps/downloads/NationalForestClimateChangeMapsMetadata.pdf).
The National Forest Climate Change Maps project was developed by the Rocky Mountain Research Station (RMRS) and the Office of Sustainability and Climate to meet the needs of national forest managers for information on projected climate changes at a scale relevant to decision making processes, including forest plans. The maps use state-of-the-art science and are available for every national forest in the contiguous United States with relevant data coverage. Currently, the map sets include variables related to precipitation, air temperature, snow (including snow residence time and April 1 snow water equivalent), and stream flow.
Historical (1975-2005) and future (2071-2090) precipitation and temperature data for the state of Alaska were developed by the Scenarios Network for Alaska and Arctic Planning (SNAP) (https://snap.uaf.edu). Monthly precipitation values (mm) were summed over the season of interest (annual, winter, or summer). These datasets have several important differences from the MACAv2-Metdata (https://climate.northwestknowledge.net/MACA/) products, used in the contiguous U.S. They were developed using different global circulation models and different downscaling methods, and were downscaled to a different scale (771 m instead of 4 km). While these cover the same time periods and use broadly similar approaches, caution should be used when directly comparing values between Alaska and the contiguous United States.
Raster data are also available for download from RMRS site (https://www.fs.usda.gov/rm/boise/AWAE/projects/NFS-regional-climate-change-maps/categories/us-raster-layers.html), along with pdf maps and detailed metadata (https://www.fs.usda.gov/rm/boise/AWAE/projects/NFS-regional-climate-change-maps/downloads/NationalForestClimateChangeMapsMetadata.pdf).

The National Forest Climate Change Maps project was developed by the Rocky Mountain Research Station (RMRS) and the Office of Sustainability and Climate to meet the needs of national forest managers for information on projected climate changes at a scale relevant to decision making processes, including forest plans. The maps use state-of-the-art science and are available for every national forest in the contiguous United States with relevant data coverage. Currently, the map sets include variables related to precipitation, air temperature, snow (including snow residence time and April 1 snow water equivalent), and stream flow.
Historical (1975-2005) and future (2071-2090) precipitation and temperature data for the contiguous United States are ensemble mean values across 20 global climate models from the CMIP5 experiment (https://journals.ametsoc.org/doi/abs/10.1175/BAMS-D-11-00094.1), downscaled to a 4 km grid. For more information on the downscaling method and to access the data, please see Abatzoglou and Brown, 2012 (https://rmets.onlinelibrary.wiley.com/doi/full/10.1002/joc.2312) and the Northwest Knowledge Network (https://climate.northwestknowledge.net/MACA/). We used the MACAv2- Metadata monthly dataset; monthly precipitation values (mm) were summed over the season of interest (annual, winter, or summer). Absolute and percent change were then calculated between the historical and future time periods.
Raster data are also available for download from RMRS site (https://www.fs.usda.gov/rm/boise/AWAE/projects/NFS-regional-climate-change-maps/categories/us-raster-layers.html), along with pdf maps and detailed metadata (https://www.fs.usda.gov/rm/boise/AWAE/projects/NFS-regional-climate-change-maps/downloads/NationalForestClimateChangeMapsMetadata.pdf).

The National Forest Climate Change Maps project was developed by the Rocky Mountain Research Station (RMRS) and the Office of Sustainability and Climate to meet the needs of national forest managers for information on projected climate changes at a scale relevant to decision making processes, including forest plans. The maps use state-of-the-art science and are available for every national forest in the contiguous United States with relevant data coverage. Currently, the map sets include variables related to precipitation, air temperature, snow (including snow residence time and April 1 snow water equivalent), and stream flow.
Snow residence time (in days) and April 1 snow water equivalent (in mm) were modeled using the spatial analog models of Luce et al., 2014 (https://agupubs.onlinelibrary.wiley.com/doi/full/10.1002/2013WR014844); see also Lute and Luce, 2017 (https://agupubs.onlinelibrary.wiley.com/doi/full/10.1002/2017WR020752). These models are built on precipitation and snow data from Snowpack Telemetry (SNOTEL) stations across the western United States and temperature data from the TopoWx dataset (https://rmets.onlinelibrary.wiley.com/doi/10.1002/joc.4127). They were calculated for the historical (1975-2005) and future (2071-2090) time periods, along with absolute and percent change.
Raster data are also available for download from RMRS site (https://www.fs.usda.gov/rm/boise/AWAE/projects/NFS-regional-climate-change-maps/categories/us-raster-layers.html), along with pdf maps and detailed metadata (https://www.fs.usda.gov/rm/boise/AWAE/projects/NFS-regional-climate-change-maps/downloads/NationalForestClimateChangeMapsMetadata.pdf).
The National Forest Climate Change Maps project was developed by the Rocky Mountain Research Station (RMRS) and the Office of Sustainability and Climate to meet the needs of national forest managers for information on projected climate changes at a scale relevant to decision making processes, including forest plans. The maps use state-of-the-art science and are available for every national forest in the contiguous United States with relevant data coverage. Currently, the map sets include variables related to precipitation, air temperature, snow (including snow residence time and April 1 snow water equivalent), and stream flow.
Historical (1975-2005) and future (2071-2090) precipitation and temperature data for the state of Alaska were developed by the Scenarios Network for Alaska and Arctic Planning (SNAP) (https://snap.uaf.edu). Monthly precipitation values (mm) were summed over the season of interest (annual, winter, or summer). These datasets have several important differences from the MACAv2-Metdata (https://climate.northwestknowledge.net/MACA/) products, used in the contiguous U.S. They were developed using different global circulation models and different downscaling methods, and were downscaled to a different scale (771 m instead of 4 km). While these cover the same time periods and use broadly similar approaches, caution should be used when directly comparing values between Alaska and the contiguous United States.Raster data are also available for download from RMRS site (https://www.fs.usda.gov/rm/boise/AWAE/projects/NFS-regional-climate-change-maps/categories/us-raster-layers.html), along with pdf maps and detailed metadata (https://www.fs.usda.gov/rm/boise/AWAE/projects/NFS-regional-climate-change-maps/downloads/NationalForestClimateChangeMapsMetadata.pdf).
The National Forest Climate Change Maps project was developed by the Rocky Mountain Research Station (RMRS) and the Office of Sustainability and Climate to meet the needs of national forest managers for information on projected climate changes at a scale relevant to decision making processes, including forest plans. The maps use state-of-the-art science and are available for every national forest in the contiguous United States with relevant data coverage. Currently, the map sets include variables related to precipitation, air temperature, snow (including snow residence time and April 1 snow water equivalent), and stream flow.
\\n\\nHistorical (1975-2005) and future (2071-2090) precipitation and temperature data for the contiguous United States are ensemble mean values across 20 global climate models from the CMIP5 experiment (https://journals.ametsoc.org/doi/abs/10.1175/BAMS-D-11-00094.1), downscaled to a 4 km grid. For more information on the downscaling method and to access the data, please see Abatzoglou and Brown, 2012 (https://rmets.onlinelibrary.wiley.com/doi/full/10.1002/joc.2312) and the Northwest Knowledge Network (https://climate.northwestknowledge.net/MACA/). We used the MACAv2- Metdata monthly dataset; monthly precipitation values (mm) were summed over the season of interest (annual, winter, or summer). Absolute and percent change were then calculated between the historical and future time periods.
\\n\\nRaster data are also available for download from RMRS site (https://www.fs.usda.gov/rm/boise/AWAE/projects/NFS-regional-climate-change-maps/categories/us-raster-layers.html), along with pdf maps and detailed metadata (https://www.fs.usda.gov/rm/boise/AWAE/projects/NFS-regional-climate-change-maps/downloads/NationalForestClimateChangeMapsMetadata.pdf).
\\n\\n
The National Forest Climate Change Maps project was developed by the Rocky Mountain Research Station (RMRS) and the Office of Sustainability and Climate to meet the needs of national forest managers for information on projected climate changes at a scale relevant to decision making processes, including forest plans. The maps use state-of-the-art science and are available for every national forest in the contiguous United States with relevant data coverage. Currently, the map sets include variables related to precipitation, air temperature, snow (including snow residence time and April 1 snow water equivalent), and stream flow.
Historical (1975-2005) and future (2071-2090) precipitation and temperature data for the state of Alaska were developed by the Scenarios Network for Alaska and Arctic Planning (SNAP) (https://snap.uaf.edu). Monthly precipitation values (mm) were summed over the season of interest (annual, winter, or summer). These datasets have several important differences from the MACAv2-Metdata (https://climate.northwestknowledge.net/MACA/) products, used in the contiguous U.S. They were developed using different global circulation models and different downscaling methods, and were downscaled to a different scale (771 m instead of 4 km). While these cover the same time periods and use broadly similar approaches, caution should be used when directly comparing values between Alaska and the contiguous United States.
Raster data are also available for download from RMRS site (https://www.fs.usda.gov/rm/boise/AWAE/projects/NFS-regional-climate-change-maps/categories/us-raster-layers.html), along with pdf maps and detailed metadata (https://www.fs.usda.gov/rm/boise/AWAE/projects/NFS-regional-climate-change-maps/downloads/NationalForestClimateChangeMapsMetadata.pdf).
The National Forest Climate Change Maps project was developed by the Rocky Mountain Research Station (RMRS) and the Office of Sustainability and Climate to meet the needs of national forest managers for information on projected climate changes at a scale relevant to decision making processes, including forest plans. The maps use state-of-the-art science and are available for every national forest in the contiguous United States with relevant data coverage. Currently, the map sets include variables related to precipitation, air temperature, snow (including snow residence time and April 1 snow water equivalent), and stream flow.
\\n\\nHistorical (1975-2005) and future (2071-2090) precipitation and temperature data for the contiguous United States are ensemble mean values across 20 global climate models from the CMIP5 experiment (https://journals.ametsoc.org/doi/abs/10.1175/BAMS-D-11-00094.1), downscaled to a 4 km grid. For more information on the downscaling method and to access the data, please see Abatzoglou and Brown, 2012 (https://rmets.onlinelibrary.wiley.com/doi/full/10.1002/joc.2312) and the Northwest Knowledge Network (https://climate.northwestknowledge.net/MACA/). We used the MACAv2- Metdata monthly dataset; monthly precipitation values (mm) were summed over the season of interest (annual, winter, or summer). Absolute and percent change were then calculated between the historical and future time periods.
\\n\\nRaster data are also available for download from RMRS site (https://www.fs.usda.gov/rm/boise/AWAE/projects/NFS-regional-climate-change-maps/categories/us-raster-layers.html), along with pdf maps and detailed metadata (https://www.fs.usda.gov/rm/boise/AWAE/projects/NFS-regional-climate-change-maps/downloads/NationalForestClimateChangeMapsMetadata.pdf).
A digital orthophoto is a georeferenced image prepared from aerial imagery, or other remotely-sensed data in which the displacement within the image due to sensor orientation and terrain relief has been removed. Orthophotos combine the characteristics of an image with the geometric qualities of a map. Orthoimages show ground features such as roads, buildings, and streams in their proper positions, without the distortion characteristic of unrectified aerial imagery. Digital orthoimages produced and used within the Forest Service are developed from imagery acquired through various national and regional image acquisition programs. The resulting orthoimages, also known as orthomaps, can be directly applied in remote sensing, GIS and mapping applications. They serve a variety of purposes, from interim maps to references for earth science investigations and analysis. Because of the orthographic property, an orthoimage can be used like a map for measurement of distances, angles, and areas with scale being constant everywhere. Also, they can be used as map layers in GIS or other computer-based manipulation, overlaying, and analysis. An orthoimage differs from a map in a manner of depiction of detail; on a map only selected detail is shown by conventional symbols, whereas on an orthoimage all details appear just as in original aerial or satellite imagery.
Terrain-related imagery are primarily derived\nfrom Lidar, stereoscopic aerial imagery, or Interferometric Synthetic Aperture\nRadar datasets. Consequently, these derivatives inherit the limitations and\nuncertainties of the parent sensor and platform and the processing techniques\nused to produce the imagery. The terrain images are orthographic; they have\nbeen georeferenced and displacement due to sensor orientation and topography\nhave been removed, producing data that combines the characteristics of an image\nwith the geometric qualities of a map. The orthographic images show ground features such as roads, buildings,\nand streams in their proper positions, without the distortion characteristic of\nunrectified aerial or satellite imagery. Digital orthoimages produced and used\nwithin the Forest Service are developed from imagery acquired through various\nnational and regional image acquisition programs. The resulting orthoimages can\nbe directly applied in remote sensing, GIS and mapping applications. They serve\na variety of purposes, from interim maps to references for earth science\ninvestigations and analysis. Because of the orthographic property, an orthoimage\ncan be used like a map for measurement of distances, angles, and areas with\nscale being constant everywhere. Also, they can be used as map layers in GIS or\nother computer-based manipulation, overlaying, and analysis. An orthoimage\ndiffers from a map in a manner of depiction of detail; on a map only selected\ndetail is shown by conventional symbols, whereas on an orthoimage all details\nappear just as in original aerial or satellite imagery.
Terrain-related imagery are primarily derived from Lidar, stereoscopic aerial imagery, or Interferometric Synthetic Aperture Radar datasets. Consequently, these derivatives inherit the limitations and uncertainties of the parent sensor and platform and the processing techniques used to produce the imagery. The terrain images are orthographic; they have been georeferenced and displacement due to sensor orientation and topography have been removed, producing data that combines the characteristics of an image with the geometric qualities of a map. The orthographic images show ground features such as roads, buildings, and streams in their proper positions, without the distortion characteristic of unrectified aerial or satellite imagery. Digital orthoimages produced and used within the Forest Service are developed from imagery acquired through various national and regional image acquisition programs. The resulting orthoimages can be directly applied in remote sensing, GIS and mapping applications. They serve a variety of purposes, from interim maps to references for earth science investigations and analysis. Because of the orthographic property, an orthoimage can be used like a map for measurement of distances, angles, and areas with scale being constant everywhere. Also, they can be used as map layers in GIS or other computer-based manipulation, overlaying, and analysis. An orthoimage differs from a map in a manner of depiction of detail; on a map only selected detail is shown by conventional symbols, whereas on an orthoimage all details appear just as in original aerial or satellite imagery.
Terrain-related imagery are primarily derived from Lidar, stereoscopic aerial imagery, or Interferometric Synthetic Aperture Radar datasets. Consequently, these derivatives inherit the limitations and uncertainties of the parent sensor and platform and the processing techniques used to produce the imagery. The terrain images are orthographic; they have been georeferenced and displacement due to sensor orientation and topography have been removed, producing data that combines the characteristics of an image with the geometric qualities of a map. The orthographic images show ground features such as roads, buildings, and streams in their proper positions, without the distortion characteristic of unrectified aerial or satellite imagery. Digital orthoimages produced and used within the Forest Service are developed from imagery acquired through various national and regional image acquisition programs. The resulting orthoimages can be directly applied in remote sensing, GIS and mapping applications. They serve a variety of purposes, from interim maps to references for earth science investigations and analysis. Because of the orthographic property, an orthoimage can be used like a map for measurement of distances, angles, and areas with scale being constant everywhere. Also, they can be used as map layers in GIS or other computer-based manipulation, overlaying, and analysis. An orthoimage differs from a map in a manner of depiction of detail; on a map only selected detail is shown by conventional symbols, whereas on an orthoimage all details appear just as in original aerial or satellite imagery.
Terrain-related imagery are primarily derived from Lidar, stereoscopic aerial imagery, or Interferometric Synthetic Aperture Radar datasets. Consequently, these derivatives inherit the limitations and uncertainties of the parent sensor and platform and the processing techniques used to produce the imagery. The terrain images are orthographic; they have been georeferenced and displacement due to sensor orientation and topography have been removed, producing data that combines the characteristics of an image with the geometric qualities of a map. The orthographic images show ground features such as roads, buildings, and streams in their proper positions, without the distortion characteristic of unrectified aerial or satellite imagery. Digital orthoimages produced and used within the Forest Service are developed from imagery acquired through various national and regional image acquisition programs. The resulting orthoimages can be directly applied in remote sensing, GIS and mapping applications. They serve a variety of purposes, from interim maps to references for earth science investigations and analysis. Because of the orthographic property, an orthoimage can be used like a map for measurement of distances, angles, and areas with scale being constant everywhere. Also, they can be used as map layers in GIS or other computer-based manipulation, overlaying, and analysis. An orthoimage differs from a map in a manner of depiction of detail; on a map only selected detail is shown by conventional symbols, whereas on an orthoimage all details appear just as in original aerial or satellite imagery.
This feature class includes States, Counties or Boroughs, Congressional Districts, Alaska Recording Districts, County Subdivisions, and Places boundaries that are derived from the latest official Census Bureau and Alaska Department of Natural Resources datasets. Features within Forest Service Administrative Forest boundaries may have been modified by the Forest Service for improved accuracy and spatial coincidence(vertical integration).
This dataset shows information about the USDA Forest Service constructed recreation sites used to populate the public facing webpages. This information is the descriptive and qualitative information used to set appropriate expectations for visitor use and may not contain all the exact engineering, constructed features. View Metadata.
The USDA Forest Service (USFS) builds two versions of percent tree canopy cover data, in order to serve needs of multiple user communities. These datasets encompass conterminous United States (CONUS), Coastal Alaska, Hawaii, and Puerto Rico and U.S. Virgin Islands (PRUSVI). The two versions of data within the v2021-4 TCC product suite include: The initial model outputs referred to as the Science data; And a modified version built for the National Land Cover Database and referred to as NLCD data. The Science data are the initial annual model outputs that consist of two images: percent tree canopy cover (TCC) and standard error. These data are best suited for users who will carry out their own detailed statistical and uncertainty analyses on the dataset, and place lower priority on the visual appearance of the dataset for cartographic purposes. Datasets for the years 2008 through 2021 are available. The Science data were produced using a random forests regression algorithm. For standard error data, the initial standard error estimates that ranged from 0 to approximately 45 were multiplied by 100 to maintain data precision (e.g., 45 = 4500). Therefore, standard error estimates pixel values range from 0 to approximately 4500. The value 65534 represents the non-processing area mask where no cloud or cloud shadow-free data are available to produce an output, and 65535 represents the background value. The Science data are accessible for multiple user communities, through multiple channels and platforms. For information on the NLCD TCC data and processing steps see the NLCD metadata. Information on the Science data and processing steps are included here. Data Download and Methods Documents: - https://data.fs.usda.gov/geodata/rastergateway/treecanopycover/
The USDA Forest Service (USFS) builds two versions of percent tree canopy cover data, in order to serve needs of multiple user communities. These datasets encompass conterminous United States (CONUS), Coastal Alaska, Hawaii, and Puerto Rico and U.S. Virgin Islands (PRUSVI). The two versions of data within the v2021-4 TCC product suite include: The initial model outputs referred to as the Science data; And a modified version built for the National Land Cover Database and referred to as NLCD data. The Science data are the initial annual model outputs that consist of two images: percent tree canopy cover (TCC) and standard error. These data are best suited for users who will carry out their own detailed statistical and uncertainty analyses on the dataset, and place lower priority on the visual appearance of the dataset for cartographic purposes. Datasets for the years 2008 through 2021 are available. The Science data were produced using a random forests regression algorithm. For standard error data, the initial standard error estimates that ranged from 0 to approximately 45 were multiplied by 100 to maintain data precision (e.g., 45 = 4500). Therefore, standard error estimates pixel values range from 0 to approximately 4500. The value 65534 represents the non-processing area mask where no cloud or cloud shadow-free data are available to produce an output, and 65535 represents the background value. The Science data are accessible for multiple user communities, through multiple channels and platforms. For information on the NLCD TCC data and processing steps see the NLCD metadata. Information on the Science data and processing steps are included here. Data Download and Methods Documents: - https://data.fs.usda.gov/geodata/rastergateway/treecanopycover/
This feature class includes States, Counties or Boroughs, Congressional Districts, Alaska Recording Districts, County Subdivisions, and Places boundaries that are derived from the latest official Census Bureau and Alaska Department of Natural Resources datasets. Features within Forest Service Administrative Forest boundaries may have been modified by the Forest Service for improved accuracy and spatial coincidence(vertical integration).
The Bipartisan Infrastructure Law (a.k.a Infrastructure Investment Jobs Act) and the Inflation Reduction Act include significant funding to execute fuels mitigation projects. Regions submitted proposed project boundaries designed to address community exposure to wildfire. The Executive Leadership Team of the Forest Service selected \"Landscapes\" for initial investment in fiscal years 2022 and 2023. Additional landscapes may be selected for future action. This dataset documents the official boundary of the landscapes selected for fuels treatment activities in the Wildfire Crisis Strategy. The public-facing version of these boundaries is called Wildfire Crisis Strategy Landscapes. This Dataset is current from June 9, 2023 to Present.
", "title": "Wildfire Crisis Strategy Landscapes (Feature Layer)", "distribution": [ { "accessURL": "https://www.arcgis.com/sharing/rest/content/items/caa2789ec1a74f3ea29034417316703a/info/metadata/metadata.xml?format=iso19139", "@type": "dcat:Distribution", "mediaType": "text/xml", "conformsTo": "https://www.isotc211.org/2005/gmi", "title": "ISO-19139 metadata" }, { "accessURL": "https://data-usfs.hub.arcgis.com/maps/usfs::wildfire-crisis-strategy-landscapes-feature-layer", "@type": "dcat:Distribution", "format": "Web Page", "mediaType": "text/html", "title": "ArcGIS Hub Dataset" }, { "accessURL": "https://apps.fs.usda.gov/arcx/rest/services/EDW/EDW_BILLandscapeInvestments_01/MapServer/0", "@type": "dcat:Distribution", "format": "ArcGIS GeoServices REST API", "mediaType": "application/json", "title": "ArcGIS GeoService" }, { "accessURL": "https://data-usfs.hub.arcgis.com/api/download/v1/items/caa2789ec1a74f3ea29034417316703a/csv?layers=0", "@type": "dcat:Distribution", "format": "CSV", "mediaType": "text/csv", "title": "CSV" }, { "accessURL": "https://data-usfs.hub.arcgis.com/api/download/v1/items/caa2789ec1a74f3ea29034417316703a/geojson?layers=0", "@type": "dcat:Distribution", "format": "GeoJSON", "mediaType": "application/vnd.geo+json", "title": "GeoJSON" }, { "accessURL": "https://data-usfs.hub.arcgis.com/api/download/v1/items/caa2789ec1a74f3ea29034417316703a/shapefile?layers=0", "@type": "dcat:Distribution", "format": "ZIP", "mediaType": "application/zip", "title": "Shapefile" }, { "accessURL": "https://data-usfs.hub.arcgis.com/api/download/v1/items/caa2789ec1a74f3ea29034417316703a/kml?layers=0", "@type": "dcat:Distribution", "format": "KML", "mediaType": "application/vnd.google-earth.kml+xml", "title": "KML" } ], "bureauCode": [ "005:96" ], "modified": "2023-06-08", "theme": [ "geospatial" ], "keyword": [ "IIJA", "boundaries", "Fuels Treatment", "BIL", "Wildfire Exposure", "Wildfire", "Open Data", "IRA" ], "spatial": "-124.0982,32.4414,-104.6818,49.0015", "issued": "2022-09-27", "identifier": "https://www.arcgis.com/home/item.html?id=caa2789ec1a74f3ea29034417316703a&sublayer=0", "accessLevel": "public", "programCode": [ "005:059" ], "landingPage": "https://data-usfs.hub.arcgis.com/maps/usfs::wildfire-crisis-strategy-landscapes-feature-layer", "license": "https://creativecommons.org/licenses/by/4.0/", "publisher": { "name": "U.S. Forest Service" } }, { "contactPoint": { "hasEmail": "mailto:SM.FS.data@usda.gov", "@type": "vcard:Contact", "fn": "USFSEnterpriseContent" }, "description": "The wildfire hazard potential (WHP) is a raster geospatial product at 270-meter resolution covering all lands in the conterminous United States. It can help to inform evaluations of wildfire risk or prioritization of fuels management needs across very large landscapes (millions of acres). Our specific objective with the WHP map is to depict the relative potential for wildfire that would be difficult for suppression resources to contain. For more information, please visit: https://www.firelab.org/project/wildfire-hazard-potential. This dataset can be downloaded from this website: https://doi.org/10.2737/RDS-2015-0046", "title": "Wildfire Hazard Potential, Version 2014 Classified (Image Service)", "distribution": [ { "accessURL": "https://www.arcgis.com/sharing/rest/content/items/4b54e1a163344817ad0cf12472a4586f/info/metadata/metadata.xml?format=iso19139", "@type": "dcat:Distribution", "mediaType": "text/xml", "conformsTo": "https://www.isotc211.org/2005/gmi", "title": "ISO-19139 metadata" }, { "accessURL": "https://data-usfs.hub.arcgis.com/datasets/usfs::wildfire-hazard-potential-version-2014-classified-image-service", "@type": "dcat:Distribution", "format": "Web Page", "mediaType": "text/html", "title": "ArcGIS Hub Dataset" }, { "accessURL": "https://apps.fs.usda.gov/fsgisx01/rest/services/RDW_Wildfire/RMRS_WildfireHazardPotential_2014/ImageServer", "@type": "dcat:Distribution", "format": "ArcGIS GeoServices REST API", "mediaType": "application/json", "title": "ArcGIS GeoService" } ], "bureauCode": [ "005:96" ], "modified": "2022-08-29", "theme": [ "geospatial" ], "keyword": [ "Wildfire", "Hazard", "Potential", "2014", "Classified", "RDW", "Raster Data Warehouse", "RMRS", "Open Data" ], "spatial": "-127.9722,22.7646,-65.2573,51.6315", "issued": "2017-04-14", "identifier": "https://www.arcgis.com/home/item.html?id=4b54e1a163344817ad0cf12472a4586f", "accessLevel": "public", "programCode": [ "005:059" ], "landingPage": "https://data-usfs.hub.arcgis.com/datasets/usfs::wildfire-hazard-potential-version-2014-classified-image-service", "license": "https://creativecommons.org/licenses/by/4.0/", "publisher": { "name": "U.S. Forest Service" } }, { "contactPoint": { "hasEmail": "mailto:SM.FS.data@usda.gov", "@type": "vcard:Contact", "fn": "USFSEnterpriseContent" }, "description": "The wildfire hazard potential (WHP) is a raster geospatial product at 270-meter resolution covering all lands in the conterminous United States. It can help to inform evaluations of wildfire risk or prioritization of fuels management needs across very large landscapes (millions of acres). Our specific objective with the WHP map is to depict the relative potential for wildfire that would be difficult for suppression resources to contain. For more information, please visit: https://www.firelab.org/project/wildfire-hazard-potential. \\n\\nThis data publication is a second edition. The first edition (https://doi.org/10.2737/RDS-2015-0046) represents WHP mapped in 2014, depicting landscape conditions as of 2010. This second edition is the 2018 version, and depicts landscape conditions as of 2012. (See \\Supplements\\WHP2014_to_2018_ChangeSummary.pdf for a summary of the changes between the first and second editions of these data.)�SDI factors in topography, fuels, expected fire behavior under prevailing conditions, fireline production rates in various fuel types with and without heavy equipment, and access via roads, trails, or cross-country travel. SDI does not account for standing snags or other overhead hazards to firefighters, so it is not a firefighter hazard map. It is only showing in relative terms where it is harder or easier to perform suppression work.