

Imagine this. You are a new farmer who bought a plot of land in your hometown. You’re making important decisions for your operation like what to plant and where. If only you had a tool to identify historical information for what’s been grown on your land and in your area that would allow you to make better informed decisions to set up your new business for success.
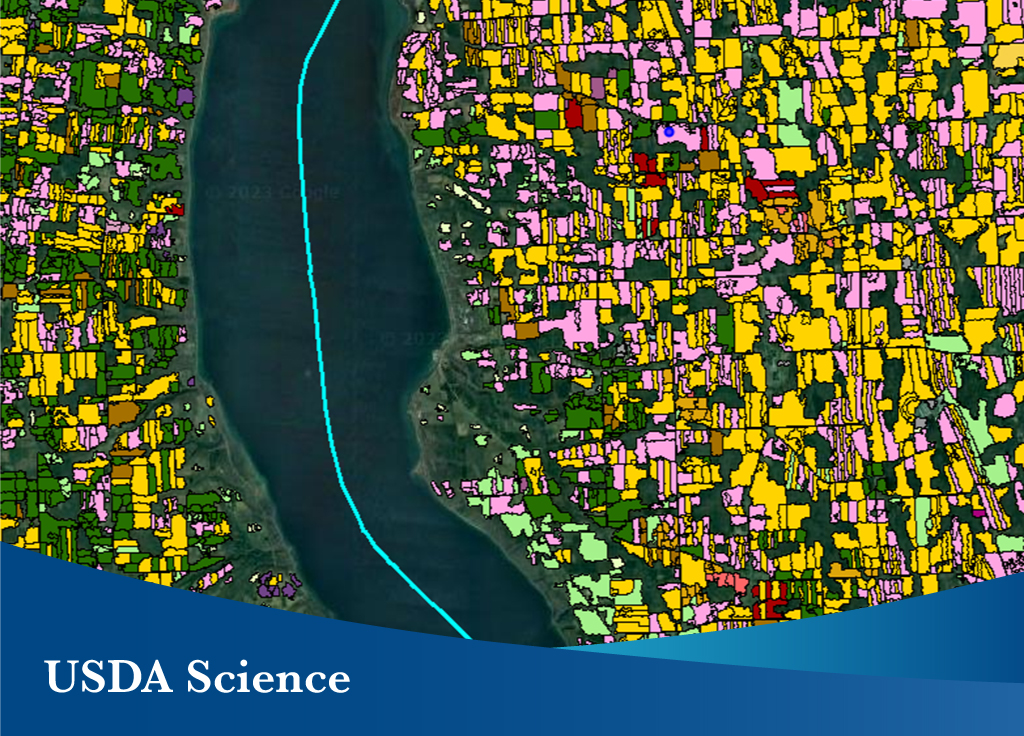
Thanks to USDA’s National Agricultural Statistics Service (NASS) and Economic Research Service (ERS), this tool has become a reality. The public can now access a new geospatial product called Crop Sequence Boundaries (CSB). CSB is a cutting-edge map of agricultural fields that provides crop acreage estimates and historical planting decisions across the contiguous United States. Created using satellite imagery and other public data, it allows users to conduct area and statistical analyses of planted U.S. commodities.
CSB is an innovative new resource that enhances agricultural research and applications that require national-scale analyses and crop mapping. It can help producers make planting and farm practice decisions and researchers conduct analyses at the field level, such as the study of conservation practices. CSB fills a gap between existing data sources; most other field level spatial products offer only small areas of focus.
Advancements in high-performance cloud computing made information on planting decisions and farming practices more accessible to everyone. A wide range of users, from farmers to researchers, will find CSB valuable. For example:
- NASS found that having a representative field to predict crop planting and acreage for the upcoming season based on historical crop rotations was beneficial as an early supplement to producer-supplied data that is known later in the season.
- ERS is using CSB to study changes in farm management practices, such as tillage or cover cropping, over time.
- Farmers can use the eight years of historical crop rotations to inform current or future planting decisions. It is an opportunity to enhance farm records and look at the management history of land that they might have recently started operating.
- The whole of the agricultural community could examine the planting decisions and farming practices of farmers within an area or region.
The CSB data sets for 2015 to 2022 are viewable and available for download at the state and county-level using an interactive map powered by Google Earth Engine. CSB contains no confidential or personally identifiable information. Explore all the spatial data tools developed by NASS and its partners at www.nass.usda.gov/Research_and_Science.