An official website of the United States government
Official websites use .gov
A .gov website belongs to an official government organization in the United States.
Secure .gov websites use HTTPS
A lock ( ) or https:// means you’ve safely connected to the .gov website. Share sensitive information only on official, secure websites.
National Ag Day: Where Was the Food On Your Plate Grown?
Posted by Angie Tagtow, Executive Director, USDA Center for Nutrition Policy and Promotion in
Food and Nutrition
Mar 15, 2016
MyPlate, MyState, a celebration of hometown goodness and healthy eating styles. More details coming soon!
March is National Nutrition Month. Throughout the month, USDA will be highlighting results of our efforts to improve access to safe, healthy food for all Americans and supporting the health of our next generation.
Recently, the Let’s Move! campaign issued its annual call for kids to enter original recipes into the Healthy Lunchtime Challenge. One winner from each state will be selected to attend the 2016 Kids “State Dinner” at the White House, where a selection of the winning recipes will be served. This year, the Healthy Lunchtime Challenge is putting a spotlight on homegrown pride and encouraging entries from across the country that include ingredients grown in your state, territory, or community, celebrating MyPlate, MyState.
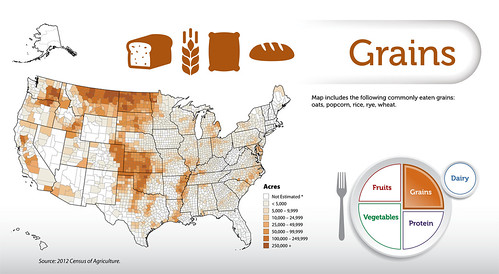
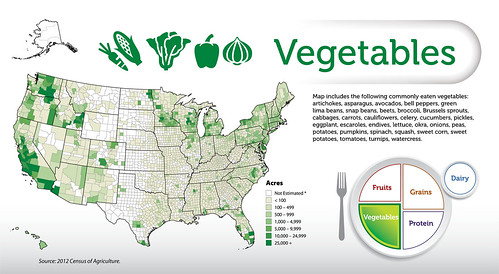
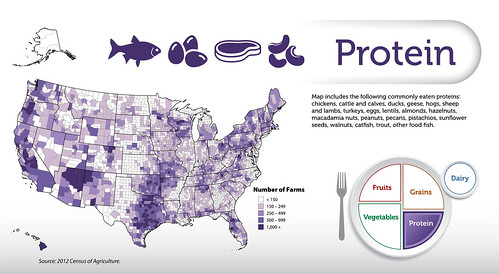
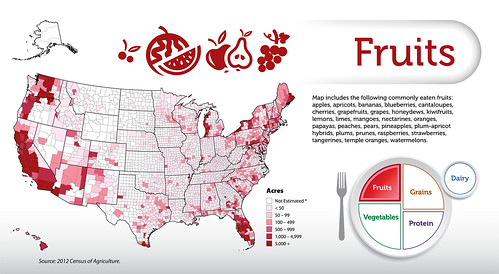
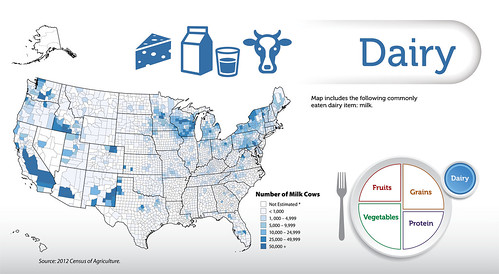
From farm to fork, agriculture and nutrition are integrally linked. And every state in the U.S. can play an important role in helping Americans eat healthfully. Thanks to USDA’s National Agricultural Statistics Service, the maps below show where foods from every MyPlate food group are grown. If you have a child between ages 8 to 12, consider having them enter a recipe into the Healthy Lunchtime Challenge. The deadline for entries is April 4. And stay tuned for more on MyPlate, MyState from CNPP – we’ll have more activities for everyone next month!
This map includes the following commonly eaten grains: oats, popcorn, rice, rye, wheat. Source: 2012 Census of Agriculture.This map includes the following commonly eaten vegetables: artichokes, asparagus, avocados, bell peppers, green lima beans, snap beans, beets, broccoli, Brussels sprouts, cabbages, carrots, cauliflowers, celery, cucumbers, pickles, eggplant, escaroles, endives, lettuce, okra, onions, peas, potatoes, pumpkins, spinach, squash, sweet corn, sweet potatoes, tomatoes, turnips and watercress. Source: 2012 Census of Agriculture.This map includes the following commonly eaten proteins: chickens, cattle and calves, ducks, geese, hogs, sheep and lambs, turkeys, eggs, lentils, almonds, hazelnuts, macadamia nuts, peanuts, pecans, pistachios, sunflower seeds, walnuts, catfish, trout, other food fish. Source: 2012 Census of Agriculture.This map includes the following commonly eaten fruits: apples, apricots, bananas, blueberries, cantaloupes, cherries, grapefruits, grapes, honeydews, kiwifruits, lemons, limes, mangoes, nectarines, oranges, papayas, peaches, pears, pineapples, plum-apricot hybrids, plums, peaches, prunes, raspberries, strawberries, tangerines, temple oranges and watermelons. Source: 2012 Census of Agriculture.This map includes the following commonly eaten dairy item: milk. Source: 2012 Census of Agriculture.