Did you know that total farm production nearly tripled between 1948 and 2017? Even as land and labor used in farming declined, innovations in animal and crop genetics, chemicals, equipment and farm organization have enabled continuing growth in farm output. USDA’s Economic Research Service’s Agricultural Productivity in the U.S. data product provides estimates of the growth and relative levels of U.S. agricultural productivity.
Total Factor Productivity (TFP) growth is a measure of the rate of growth of total output relative to the rate of growth of total inputs. Total output comprises the aggregate of farm production including crops, livestock and livestock products, and associated services, whereas total inputs comprise land, labor, physical capital, and intermediate inputs such as fertilizers, pesticides, energy, and custom services.
From 1948 to 2017, TFP increased at an annual rate of 1.47%. This growth was made possible by a surge in total output at a growth rate of 1.53% per year while holding total inputs nearly constant; inputs increased at just 0.07% per year, even after accounting for changes in their quality. Agriculture stands out among U.S. industries, both because TFP growth is much higher than the average for all U.S. industries, and because input growth accounts for almost none of output growth.
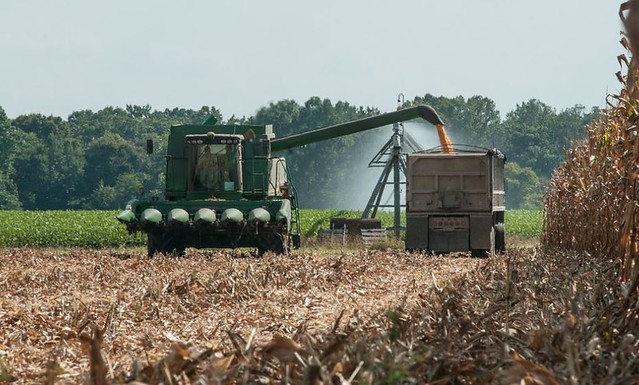
The substantial increase in total agricultural production can be attributed to the advent of new technologies, innovations, and process improvements in the farm sector. These range from improved seed varieties, genetic enhancement in livestock, advanced machinery that comes equipped with global positioning systems, and robotics, among other innovations.
This has enabled a production system that requires considerably less of traditional inputs such as land and labor. Between 1948 and 2017, labor and land inputs declined by 76 and 28 percent, respectively, while intermediate goods, such as energy, agricultural chemicals, purchased services, and other materials grew by 133 percent.
TFP estimates may fluctuate from year-to-year – reflecting transitive events, such as bad weather or oil shocks – but usually return to long-term trend growth as has happened in recent years. High growth in agricultural TFP has allowed us to continue producing more food to feed a growing population, while shifting land and labor to other sectors of the economy.
ERS research has found that TFP growth has been driven by a continuing series of biological, chemical, mechanical, and organizational innovations, which have themselves been the result of investments in public and private agricultural research. Successful innovations have spread rapidly across the farm sector, aided by a system of public extension and private service providers who deliver information and expertise to farmers.
ERS research continues to inform this topic, via our periodic reports. For more information, including a summary of recent findings, see the ERS Agricultural Productivity in the U.S. data product.