

In 2017, consumers in the United States spent $1.2 trillion on U.S.-produced food. Nearly all food starts out on a farm, but did you ever wonder how the value added from processing, packaging, transporting, and marketing agricultural food products factors into the costs?
USDA’s Economic Research Service has a tool that can show you this breakdown. ERS recently updated its Food Dollar Series data product. This most recent annual update added 2017 data to the historical data going back to 1993. Aside from detailing what U.S. total food spending pays for, the Food Dollar Series tells us what consumers pay for at grocery stores (food-at-home dollars) and restaurants (food-away-from-home dollars).
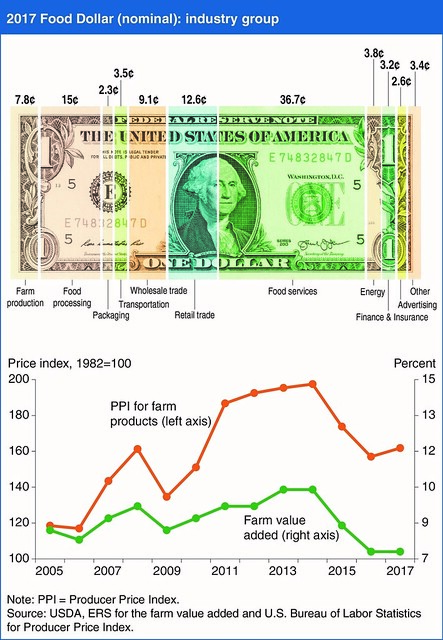
Of the $1.2 trillion in 2017 food spending, the largest cost share of the food dollar went to foodservices (restaurants) at 36.7 percent – this pays for others to host, prepare, and serve our meals, then clean-up afterwards. The next largest share, at 15 percent, went to food processors, such as bakeries, meat and dairy processors, and frozen food manufacturers. Rounding out the top five industry groups are food retailers, like grocery store chains and independent grocers (12.6 percent), wholesalers of both food products and production inputs (9.1 percent), and farm producers (7.8 percent). The farm producer’s share is what they receive after they pay for production inputs like seed, fertilizer, and electricity.
The value of farm commodities sold to fulfill food purchases represented 14.6 percent of the food’s purchase price, down from 14.8 cents in 2016 (1.4 percent decline). Although 2017 was the lowest level since the beginning of this series in 1993 and the 6th consecutive year the farm share dropped, the decline in 2017 was smaller than in 2016 (4.5 percent) and 2015 (9.9 percent).
For the fourth year in a row, 2017 saw no increase in the farm production cost share of the food dollar. But unlike in 2015-16 when the cost of farm production in the food dollar dropped sharply, average prices received by U.S. farmers actually went up in 2017. This period also coincided with six consecutive years (2012-17) of increases in the foodservice industry share of the food dollar, driven by a continuing trend of consumers spending more of their food dollars eating out. So, increases in eating-out spending by consumers actually offset the likely increase in the farm production cost share, as more money went to food services.
For more information, please see the Food Dollar Series data product page and more at www.ers.usda.gov.