
nass

Buckeye State's Agriculture in a Nutshell

The Census of Agriculture is the most complete account of U.S. farms and ranches and the people who operate them. Every Thursday USDA’s National Agricultural Statistics Service will highlight new Census data and the power of the information to shape the future of American agriculture.

The 2012 Census of Agriculture results are out and, just as many predicted, Ohio continues to grow agriculturally. True to our rich history, the Buckeye State is a large contributor of corn, soybeans, winter wheat, milk, hogs, poultry, and floriculture and nursery. And that is just a few of our many commodities produced in Ohio.

According to the census results, there are 75,462 farms (ranking 7th nationally) on 13,960,904 acres of farm land in Ohio. Even though 2012 was a drought year, Ohio ranked 13th nationally in total sales by topping $10 billion, a whopping 42 percent increase from just five years ago, which was the last time my agency conducted the Census of Agriculture. We also ranked 10th nationally in crop sales with just under $6.6.billion and 20th nationally in livestock sales with just under $3.5 billion.

#AgCensus and MyPlate Serve up Lessons in Math, Nutrition, and More

This post is part of the Science Tuesday feature series on the USDA blog. Check back each week as we showcase stories and news from the USDA’s rich science and research portfolio.

Where was the food on your plate grown? Do you know in which state the apple in your lunchbox was mostly likely harvested? Or where the milk from your milk carton was mostly likely produced?

USDA’s National Agricultural Statistics Service (NASS) is helping students, parents, and teachers get revved up for a healthy school year by exploring U.S. agriculture production and the food they eat. Using the maps to display learning the most recent Census of Agriculture results, NASS is showing where foods in the five main food groups, dairy, fruits, grains, proteins, and vegetables, according to USDA’s MyPlate, are grown in the United States.  And the conversation and learning opportunities continue online using the hashtag #AgCensus.

Local & Regional Data Added to USDA Market News

America’s hunger for locally and regionally grown food has become a $7 billion-per-year market.  That means more consumers are savoring farm-fresh food, and more farmers—especially small and mid-size farmers—are profiting from new markets for their products.  It also means that a trove of useful pricing and volume data about local and regional food markets is now available, ready to be collected and analyzed.  Thanks to the 2014 Farm Bill, USDA is making that data available to farmers and businesses of all sizes for free and helping to level the playing field.

USDA Market News has created a new series of market reports on locally or regionally produced agricultural products.  The reports—covering products from all commodity areas—are all available on the Local & Regional Food Marketing Information web page, which provides farmers, other agricultural businesses, and consumers with a one-stop-shop for market and pricing information for local and regional food outlets.  Three report categories are now online:

The Empire State - A Veritable Dairyland

The Census of Agriculture is the most complete account of U.S. farms and ranches and the people who operate them. Every Thursday USDA’s National Agricultural Statistics Service will highlight new Census data and the power of the information to shape the future of American agriculture.

According to the 2012 Census of Agriculture, the value of New York’s number one commodity is nearly half the value of all our agricultural products. The value of milk sales, at $2.42 billion, ranks third among all states. This milk is used in the production of many dairy products, with New York ranking number one among states in the production of yogurt, cottage cheese, and sour cream and also ranking high in the production of cheese.

However, because of New York’s varied geography and large size, New York is agriculturally diverse, with many commodities ranking in the top ten nationally. For example, 2,598 New York farms produce fruit on 93,304 acres. New York traditionally ranks second in the nation in apple production with apples grown on 47,148 acres. New York also produces 39,216 acres of grapes, mostly along the moderating climates on the shores of the Great Lakes, Finger Lakes, and Long Island. New York grows grapes both for juice and for wine, and typically ranks third in total grape production.

Keeping #AgStrong

The strength of America’s farmers and ranchers is undeniable. I knew that strength firsthand growing up in a rural community that depended on agriculture. And I see it in so many ways as I meet folks from across the country in my role at USDA—in their work ethic, in their dedication to their crops and animals, and in their commitment to feed their communities and the world. They are all #AgStrong—an old truth in a new format, celebrating the common agricultural roots among farmer and rancher, family business and rural community.

Through these commonalities, many family-owned farms find strength in numbers, in pooling resources and expertise to grow and sustain their family businesses.  For many of them, ag boards—with oversight from USDA’s Agricultural Marketing Service (AMS)—are vital to their success, increasing business opportunities and mapping out a long-term future for their industry.

Maryland: America in Miniature

The Census of Agriculture is the most complete account of U.S. farms and ranches and the people who operate them. Every Thursday USDA’s National Agricultural Statistics Service will highlight new Census data and the power of the information to shape the future of American agriculture.

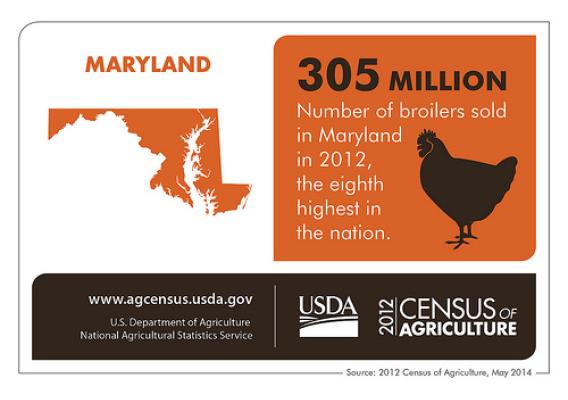
The 2012 Census of Agriculture results are out, and it is clear that here in Maryland, we have a little bit of everything. Although our state is small, the geography is diverse, providing suitable environments for a variety of agricultural commodities. From the Atlantic shore, to mountainous terrain, and from a diversity of livestock to an array of crops, Maryland truly is America in miniature.

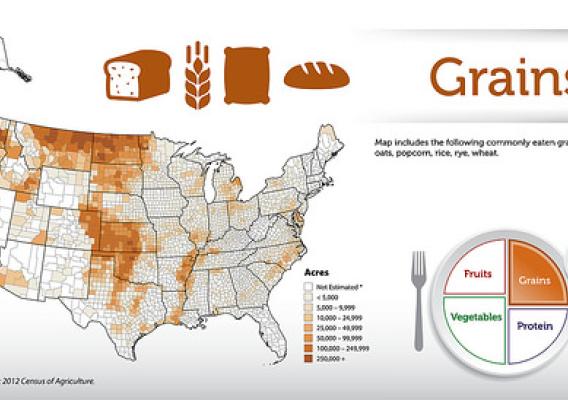
In the Free State, about 69 percent of land in farms is cropland. We have 435,646 acres of corn for grain, 1,936 acres of oats for grain, 475,615 acres of soybeans for beans, and 210,354 acres of wheat for grain. In fact, 31.5 percent of the total market value of agriculture products sold comes from grains, oilseeds, dry beans, and dry peas. We also have almost every fruit and vegetable in the Census. The sandy environment near the shoreline is conducive to growing watermelons, of which we have 3,278 acres; and, the higher altitudes provide opportunities for producing grapes and peaches, of which we have 681 acres and 999 acres respectively.

Massachusetts Agriculture Defies National Trends

The Census of Agriculture is the most complete account of U.S. farms and ranches and the people who operate them. Every Thursday USDA’s National Agricultural Statistics Service will highlight new Census data and the power of the information to shape the future of American agriculture.

According to the 2012 Census of Agriculture, Massachusetts agriculture defies national trends in more ways than one. For example, while across the country the number of farms decreased four percent since the 2007 Census, Massachusetts was one of only 10 states that saw an increase in both the number of farms and land in farms in the same time period. In addition, while women make up 31 percent of all operators across the country, they make up 41 percent of all operators in the Bay State. Similarly, while the number of female principal operators decreased nationally since the last census, that number increased from 2,226 to 2,507 in our state. In fact, female principal operators compose 32 percent of all of our state’s principal operators, the highest percentage among the New England states and the third highest nationwide.

We also have a growing number of beginning farmers in Massachusetts. Although the proportion of all beginning farmers in our state is down slightly since 2007, it is still higher than in other parts of the country. In Massachusetts, 29 percent of all operators and 25 percent of principal operators began farming in the last decade, while nationwide, 26 percent of all operators and 22 percent of principal operators fall in that category.

The Sunshine State's Agriculture Remains Bright

The Census of Agriculture is the most complete account of U.S. farms and ranches and the people who operate them. Every Thursday USDA’s National Agricultural Statistics Service will highlight new Census data and the power of the information to shape the future of American agriculture.

As the new Florida State Statistician, I am excited to start digging into the agricultural data here in the Sunshine State. One of the first things anybody would notice upon glancing over our stats is the wealth of fruits, vegetables, and other unique commodities. According to the 2012 Census of Agriculture, almost 64% of Florida’s total market value of agricultural products sold comes from three categories: (1) fruits and nuts, (2) nursery, greenhouse, floriculture, and sod, and (3) vegetables, melons, potatoes, and sweet potatoes. We are one of the top three states nationwide in sales in all three of these categories, and Florida is also the top producer of sugarcane for sugar. Thus, the Sunshine State definitely lives up to its bright nickname by harvesting a rainbow of commodities.

If one crop defines Florida, it’s oranges. There are over 465,000 acres of orange farms in our state, accounting for almost 70% of all the orange acreage in the nation. To top it off, we are the only state to grow the delectable Temple orange.

Agriculture Remains the Backbone of West Virginia

The Census of Agriculture is the most complete account of U.S. farms and ranches and the people who operate them. Every Thursday USDA’s National Agricultural Statistics Service will highlight new Census data and the power of the information to shape the future of American agriculture.

West Virginia’s climate and topography earned our state the Mountain State nickname. Our rugged mountains also ensure our agricultural community remains extremely diverse. Since West Virginia was admitted to the Union on June 20, 1863, farms have been the backbone of the state. According to the first agricultural census, conducted in West Virginia in 1870, there were 39,778 farms with 8,528,394 acres in production, with an average farm size of 214 acres. In the 2012 Census of Agriculture there were 21,480 farms in West Virginia with 3,606,674 acres in production, with an average farm size of 209 acres.

Unlike in many other states, West Virginia’s small farms (those farms selling less than $250,000 in agricultural products) account for nearly 29 percent of total farm sales in 2012, contrasting the US average of 11.1 percent. An even more telling statistic is that nearly half of sales of agricultural products were from farms selling less than $1,000,000, compared to the U.S. average of 33.6 percent. West Virginia has one of the highest ratios of small farms to total number of farms based on the 2012 Census of Agriculture.

Farming on the Rise in Connecticut

The Census of Agriculture is the most complete account of U.S. farms and ranches and the people who operate them. Every Thursday USDA’s National Agricultural Statistics Service will highlight new Census data and the power of the information to shape the future of American agriculture.

Connecticut may be the third smallest state in the Union, but it has a large agricultural presence, as the results of the 2012 Census of Agriculture showed.

Bucking the national trend, Connecticut farming has been growing for the past two decades. We now have nearly 6,000 farms, which may not seem like a lot, but it’s a staggering 60 percent increase from the 3,754 farms we had in our state in 1982. At the same time, our farmland acreage remained relatively stable, which means that the size of an average farm has been trending down. As of 2012, an average Connecticut farm is 73 acres.